1. Introduction
Deformed wing virus (DWV) [
1] is a pathogen affecting the western honey bee (
Apis mellifera L.) which significantly affects colony health and survival [
2,
3,
4,
5]. DWV is pervasive and present in the majority of honey bee colonies, particularly in regions where the parasitic mite
Varroa destructor is prevalent. The impact becomes particularly detrimental through the synergistic relationship between the virus and mite, where mite feeding both transmits the virus and suppresses bee immunity, leading to increased viral replication and consequently higher bee mortality [
6]. Understanding and monitoring DWV prevalence and load has therefore become essential for effective colony health management and sustainable beekeeping practices.
1.1. Current Detection Methods and Limitations
The current standard for assessing DWV levels involves extracting total RNA from honey bee tissues using an acid-phenol protocol, such as TRIzol
® (Invitrogen, Carlsbad, CA, USA), herein referred to simply as the “TRIzol
®” method [
7]. This RNA is then quantified using reverse-transcription quantitative polymerase chain reaction (RT-qPCR). While this method provides precise quantification of the viral load, it presents several practical barriers for large-scale surveillance:
Safety and Infrastructure Concerns: The use of phenol-chloroform extraction requires specialized laboratory infrastructure, including fume hoods and hazardous waste disposal systems. These chemicals pose substantial health risks to laboratory personnel and create regulatory compliance challenges for institutions conducting large-scale screening. For field-based surveillance programs or laboratories in resource-limited settings, these requirements can be prohibitive.
Cost Considerations: Beyond the direct costs of hazardous reagents, TRIzol®-based extraction incurs substantial indirect expenses, including specialized safety equipment, waste disposal fees, and extended processing times. For surveillance programs requiring analysis of hundreds or thousands of samples, these costs can become economically unfeasible.
Throughput Limitations: The multi-step nature of RNA extraction, including phase separation, precipitation, and purification steps, limits sample processing throughput and increases opportunities for cross-contamination. These constraints are particularly problematic for time-sensitive surveillance applications, where rapid results are needed for management decisions.
1.2. Immunocapture Approaches: Established Alternative Strategy
Immunocapture techniques have been successfully employed for viral detection in various pathosystems, offering simplified sample preparation, while maintaining analytical specificity. The basic principle involves using immobilized antibodies to selectively capture viral particles from complex sample matrices, followed by direct molecular analysis of the captured material [
8]. This approach has demonstrated particular success for plant virus detection, where it enables field-deployable diagnostic systems with reduced infrastructure requirements.
Published immunocapture methods for viruses including Indian citrus ringspot virus [
9], Potato Mop-Top Virus [
10], and others [
11] have consistently demonstrated similar performance characteristics: strong correlation with standard extraction methods, accompanied by 5–10 Ct reduced sensitivity. This sensitivity trade-off is well established and accepted in exchange for practical advantages including improved safety, reduced costs, and simplified workflows.
The adaptation of immunocapture methods to honey bee viral diagnostics follows established principles, while addressing the unique challenges of bee homogenates, which contain high levels of proteins, lipids, and other potential interferents. The requirement for quantitative results necessitates careful validation to ensure that capture efficiency remains consistent across varying viral loads and sample conditions.
1.3. DWV Biology and Detection Challenges
DWV exists as a complex of related viral variants, with DWV-A and DWV-B representing the most epidemiologically significant strains [
12]. These variants differ in their pathogenicity profiles and geographic distribution [
13]. The viral load in infected bees can vary dramatically depending on factors including mite burden, bee age, season, and colony health status, creating detection challenges across a wide dynamic range [
4,
14].
Developmental Stage Considerations: Viral loads differ significantly between bee life stages, with pupae and newly emerged adults often showing distinct infection profiles [
15]. This biological variability necessitates validation of detection methods across developmental stages to ensure reliable performance in field applications where mixed-age populations are commonly sampled.
Infection Route Dependencies: Natural DWV infections typically occur through mite-mediated transmission or horizontal transfer between bees, resulting in different tissue distribution patterns compared to experimental infections [
6,
16]. Understanding how detection methods perform across different infection scenarios is crucial for appropriate application in surveillance programs.
1.4. Method Positioning and Practical Applications
This study presents the development and validation of an immunocapture RT-qPCR method specifically designed for DWV-A surveillance applications where practical advantages outweigh the expected sensitivity reduction typical of immunocapture approaches. Rather than seeking to replace established extraction methods, this work expands the available toolkit for different surveillance scenarios.
The concept is to provide a complementary method that sacrifices some analytical sensitivity in exchange for improved safety, simplified workflows, and reduced infrastructure requirements. Some operations may find that this approach provides sufficient information for management decisions, while retaining the option to use more sensitive methods for samples requiring precise quantification or confirmation of low-level infections.
1.5. Research Objectives
This study aimed to develop and validate an immunocapture protocol that eliminates hazardous RNA extraction for DWV-A detection, while honestly assessing performance against the TRIzol® standard. The specific objectives included
Develop and validate an immunocapture protocol for DWV-A detection following established immunocapture principles.
Evaluate laboratory-produced reverse transcriptase as a cost-effective alternative to commercial enzymes.
Characterize method performance across different viral loads, infection routes, and bee life stages.
Define practical applications where the method provides useful information despite expected sensitivity limitations.
Establish clear guidelines for appropriate method selection based on application requirements.
1.6. Study Design and Validation Philosophy
Our validation strategy focused on defining specific scenarios where immunocapture provides useful information, while clearly acknowledging the sensitivity limitations typical of this approach. The study emphasizes rigorous statistical validation using appropriate normality testing and statistical test selection, with results interpreted in the context of published immunocapture literature, rather than attempting to compete directly with gold standard extraction methods.
We developed a comprehensive validation protocol including paired comparisons between methods, assessment across different infection routes and viral loads, and evaluation of method performance with laboratory-produced versus commercial reagents. This approach ensures that the conclusions accurately reflect method capabilities within the expectations established for immunocapture approaches.
2. Materials and Methods
2.1. Antiserum Production and Characterization
Polyclonal rabbit antiserum against DWV was produced as previously described [
17], following methods initially described by Clark and Adams (1977) [
8] and employing a modified protocol based on Mumford and Seal (1997) [
12]. Antibody specificity was validated by Western blot analysis using identical antisera, confirming specific recognition of DWV structural proteins [
17]. The antisera were diluted fourfold with PBS and pre-absorbed using acetone powder prepared from Varroa-free honey bee pupae containing baseline DWV levels (below 10
4 genome equivalents per pupa, determined by RT-qPCR) to reduce cross-reactivity with host proteins [
18].
2.2. Reverse Transcriptase Evaluation and Selection
Two reverse transcriptases were evaluated for equivalency before method validation:
Commercial SuperScript II (Thermo Fisher): Used according to the manufacturer’s protocols.
Laboratory-produced reverse transcriptase (Mashup RTase [
19]): The laboratory-produced reverse transcriptase was prepared as follows:
Transformation and Protein Expression: A dried plasmid encoding the Mashup RTase was rehydrated in TE elution buffer at 60 °C. BL21(DE3) Competent E. coli (NEB) was transformed with 5 μL of the rehydrated plasmid and plated on LB with 50 μg/mL kanamycin. Following overnight incubation at 37 °C, a single colony was selected and grown in 10 mL LB with 50 μg/mL kanamycin at 30 °C overnight. The next day, 3 mL of the seed culture was inoculated into 300 mL LB with 50 μg/mL kanamycin and grown at 37 °C with 220 rpm shaking for approximately 2 h. The shaker temperature was then reduced to 25 °C, and protein expression was induced by adding 0.5 mM IPTG. The culture continued incubation overnight at 25 °C.
Cell Lysis and Protein Purification: After approximately 24 h of induction, cells were harvested by centrifugation at 5000 rpm at 4 °C. Cell pellets were resuspended in lysis buffer (300 mM NaCl, 25 mM Tris-HCl pH 7.5, 10% glycerol, 0.5% Triton X-100) with lysozyme powder, protease inhibitor tablet, and TURBO DNase. After 40 min of incubation at 25 °C, the lysate was centrifuged and the supernatant purified using NEBExpress™ Ni Spin Columns according to the manufacturer’s protocol. The purified enzyme was concentrated and buffer-exchanged, with final storage at −20 °C in buffer containing 50% glycerol.
2.3. Reagents and Solutions
Phosphate-buffered saline (PBS) was prepared using 137 mM NaCl, 2.7 mM KCl, 10 mM Na2HPO4, and 1.8 mM KH2PO4, adjusted to pH 7.4. All solutions were prepared using molecular-biology-grade reagents and nuclease-free water. PBS-Tween (PBS-T) was prepared by adding Tween-20 to PBS at a final concentration of 0.05%.
2.4. Sample Collection and Preparation
Newly emerged worker bees and worker bee pupae were collected from a Varroa-infested honey bee colony at the USDA-ARS apiary in Beltsville, MD, USA. Individual bees were screened for the presence of V. destructor mites, and non-parasitized individuals were selected for experiments.
Homogenate Preparation: Individual bees/pupae were homogenized in 0.5 mL PBS using sterile pestles in 1.5 mL microcentrifuge tubes (approximately 1 min on ice), followed by centrifugation at 8000× g for 5 min. Homogenates were filtered to remove debris (filter specifications: 0.45 μm cellulose acetate filters, Millipore).
Note on Standardization: Samples were standardized by individual bee/pupa rather than by tissue weight or protein content. While this may contribute to variability between samples from different developmental stages, it reflects typical field surveillance conditions where individual bee assessment is standard practice.
2.5. Experimental Design
Experiment 1: Antisera Dilution Optimization
Experiment 2A: Pre-absorption Evaluation
Experiment 2B: Reverse Transcriptase Validation
Experiment 3: Method Validation Against TRIzol® Standard
Experiment 4: Route-Dependent Performance Assessment
2.6. Infection Protocols
Pupal Injection Experiments: Purple-eye stage pupae were carefully removed from frames containing capped brood. Each pupa received a lateral microinjection of 10 µL containing 104 DWV copies in PBS under the third abdominal sternite. Injected pupae were maintained in Petri dishes with folded filter paper at 37 °C and approximately 50% relative humidity.
Oral Infection Experiments: Newly emerged worker bees were starved for 2 h before receiving 10 µL doses of either 1:1 DWV–sugar water solution (107 or 108 genome equivalents) or control solution (1:2 sugar–water).
Adult Injection Experiments: Newly emerged workers were injected with 10 µL of either PBS control, 104 genome equivalents of DWV, or 106 genome equivalents of DWV.
Five days post-treatment, bees were individually homogenized in 100 µL of PBS using a sterile pestle in 1.5 mL microcentrifuge tubes.
2.7. Immunocapture Protocol
Ninety-six-well qPCR plates (Bio-Rad) were coated with 100 µL of 1:250 diluted pre-absorbed polyclonal anti-DWV rabbit antiserum in 0.05 M sodium carbonate buffer (pH 9.6). After 2 h incubation at 37 °C, solutions were carefully removed using an 8-channel pipettor, avoiding contact with well walls to preserve the antibody coating. Wells were washed three times with PBS-T (PBS + 0.05% Tween-20).
Sample Loading: 50 µL of cleared bee extract was combined with 150 µL PBS-T per well. Plates were incubated at 4 °C for 18 h to maximize viral particle capture.
Viral Particle Lysis and RNA Release: Following immunocapture, viral particles were lysed to release RNA for cDNA synthesis. Nuclease-free water (pre-heated to 90 °C) was quickly pipetted (11.9 µL) into each well to denature viral proteins and release genomic RNA. Plates were incubated at 70 °C for 5 min to ensure complete particle disruption, followed by brief centrifugation and placement on ice.
2.8. Molecular Analysis
Reverse Transcription: For cDNA synthesis, each well received 11 µL nuclease-free water, 1 µL dNTP mix (10 mM each), and 1 µL random primer (100 ng/µL). Plates were sealed, mixed, briefly centrifuged, heated at 65 °C for 5 min, and placed on ice. The reaction mixture was completed by adding 4 µL 5× Buffer, 2 µL 0.1 M DTT, 1 µL RNase inhibitor (RNAse Out, Thermo Fisher), and 1 µL reverse transcriptase (either SuperScript II or laboratory-produced). Reactions were incubated at 25 °C for 10 min, 42 °C for 50 min, 70 °C for 10 min, and held at 10 °C.
Quantitative PCR: The cDNA was diluted tenfold with 180 µL nuclease-free water per well. qPCR reactions (20 µL total volume) contained 2.0 µL diluted cDNA, 10 µL SYBR Green (SsoAdvanced Universal SYBR Green Supermix, Bio-Rad, Hercules, CA, USA), 0.4 µL each of forward (5′-GAGATTGAAGCGCATGAACA-3′) and reverse (5′-TGAATTCAGTGTCGCCCATA-3′) primers (10 µM), and 7.2 µL nuclease-free water.
Cycling conditions: Initial denaturation at 95 °C for 30 s, followed by 49 cycles of 95 °C for 5 s and 60 °C for 30 s. Melt curve analysis included 95 °C for 10 s, 60 °C for 5 s, and 0.5 °C increments every 5 s to 95 °C.
TRIzol
® Extraction Comparison: For comparison samples, total RNA was extracted from PBS homogenates using TRIzol
® reagent (Thermo Fisher, San Francisco, CA, USA) following established protocols for honey bee samples [
7], followed by identical RT-qPCR procedures.
2.9. Statistical Analysis
Data normality was assessed using Shapiro-Wilk tests (α = 0.05). For experiments where all groups showed normal distributions (p > 0.05), parametric tests were employed: Student’s t-tests for two-group comparisons and one-way ANOVA followed by Tukey’s HSD post hoc tests for multiple comparisons. For experiments where one or more groups showed non-normal distributions (p ≤ 0.05), non-parametric alternatives were used: Mann–Whitney U tests for two-group comparisons and Kruskal–Wallis tests for multiple group comparisons. Statistical significance was set at p < 0.05. All analyses were performed using R version 4.0.2.
3. Results
3.1. Experiment 1: Optimization of Antisera Dilution
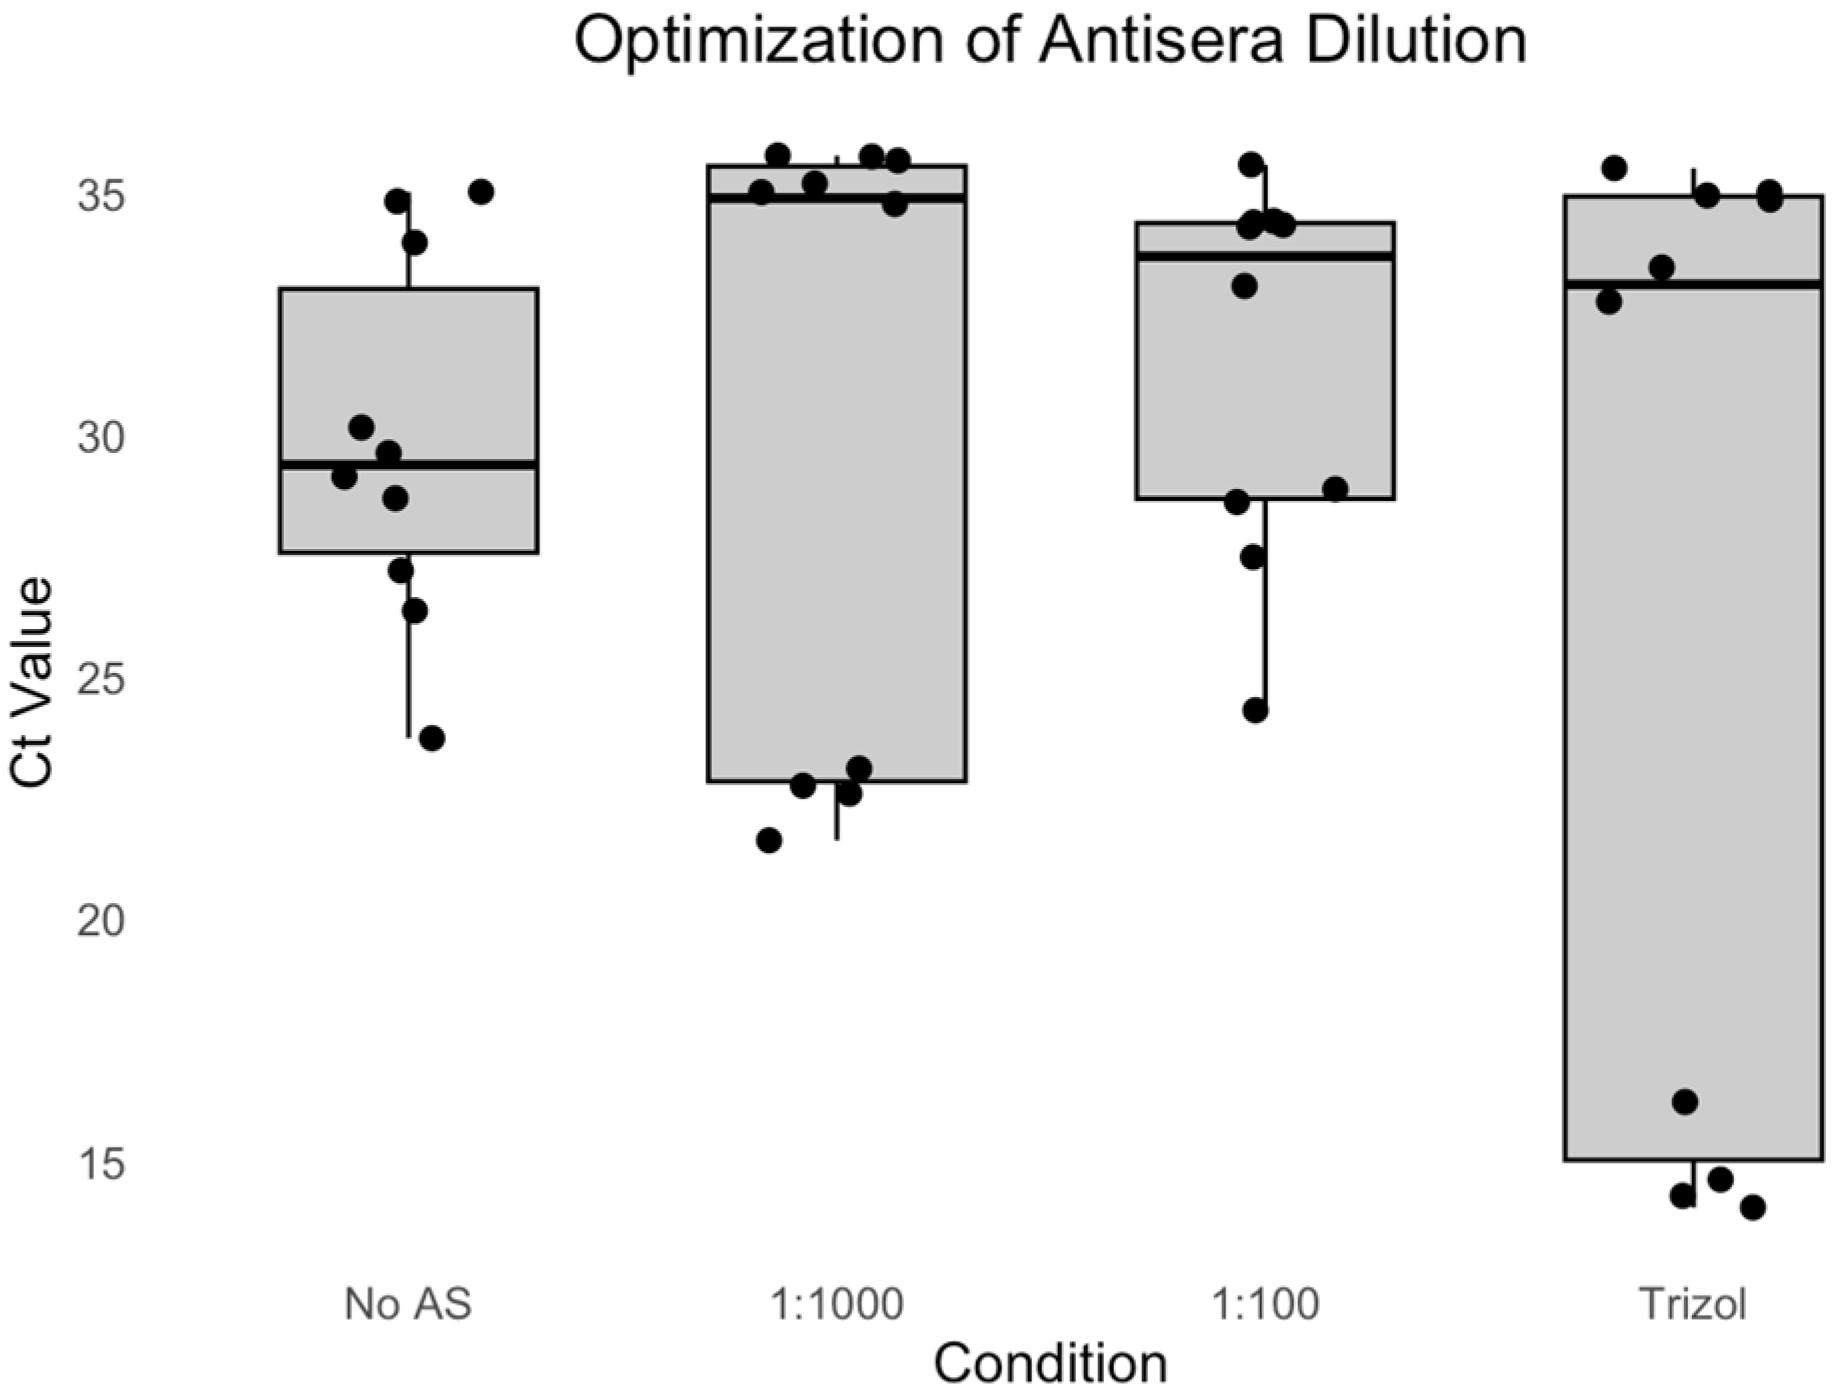
We evaluated the effectiveness of different antisera dilutions for immunocapture RT-PCR by comparing 1:1000 (IC.1to1000.AS) and 1:100 (IC.1to100.AS) dilutions of anti-DWV rabbit antiserum against a no-antiserum control (IC.No.AS) (
Figure 1,
Table 1).
Shapiro–Wilk tests revealed non-normal distributions for the IC.1to1000.AS group (W = 0.7015, p < 0.001) and TRIzol® group (W = 0.7135, p = 0.001), while the IC.No.AS (W = 0.9368, p = 0.518) and IC.1to100.AS (W = 0.8493, p = 0.057) groups showed normal distributions. Due to the presence of non-normal data, non-parametric analysis was employed.
Kruskal–Wallis analysis showed no significant differences between methods (H = 1.51, df = 3, p = 0.680). The median Ct values were IC.No.AS: 29.1 (IQR: 26.4–30.2), IC.1to1000.AS: 23.2 (IQR: 22.6–35.2), IC.1to100.AS: 28.8 (IQR: 27.5–33.1), and TRIzol®: 14.6 (IQR: 14.3–32.8).
Despite the lack of statistical significance, the 1:1000 dilution showed more consistent performance, with lower variability compared to the 1:100 dilution, making it the optimal choice for the subsequent experiments.
3.2. Experiment 2: Evaluation of Pre-Absorbed Antisera and Reverse Transcriptases
3.2.1. Experiment 2a: Comparison of Pre-Absorbed and Non-Treated Antisera
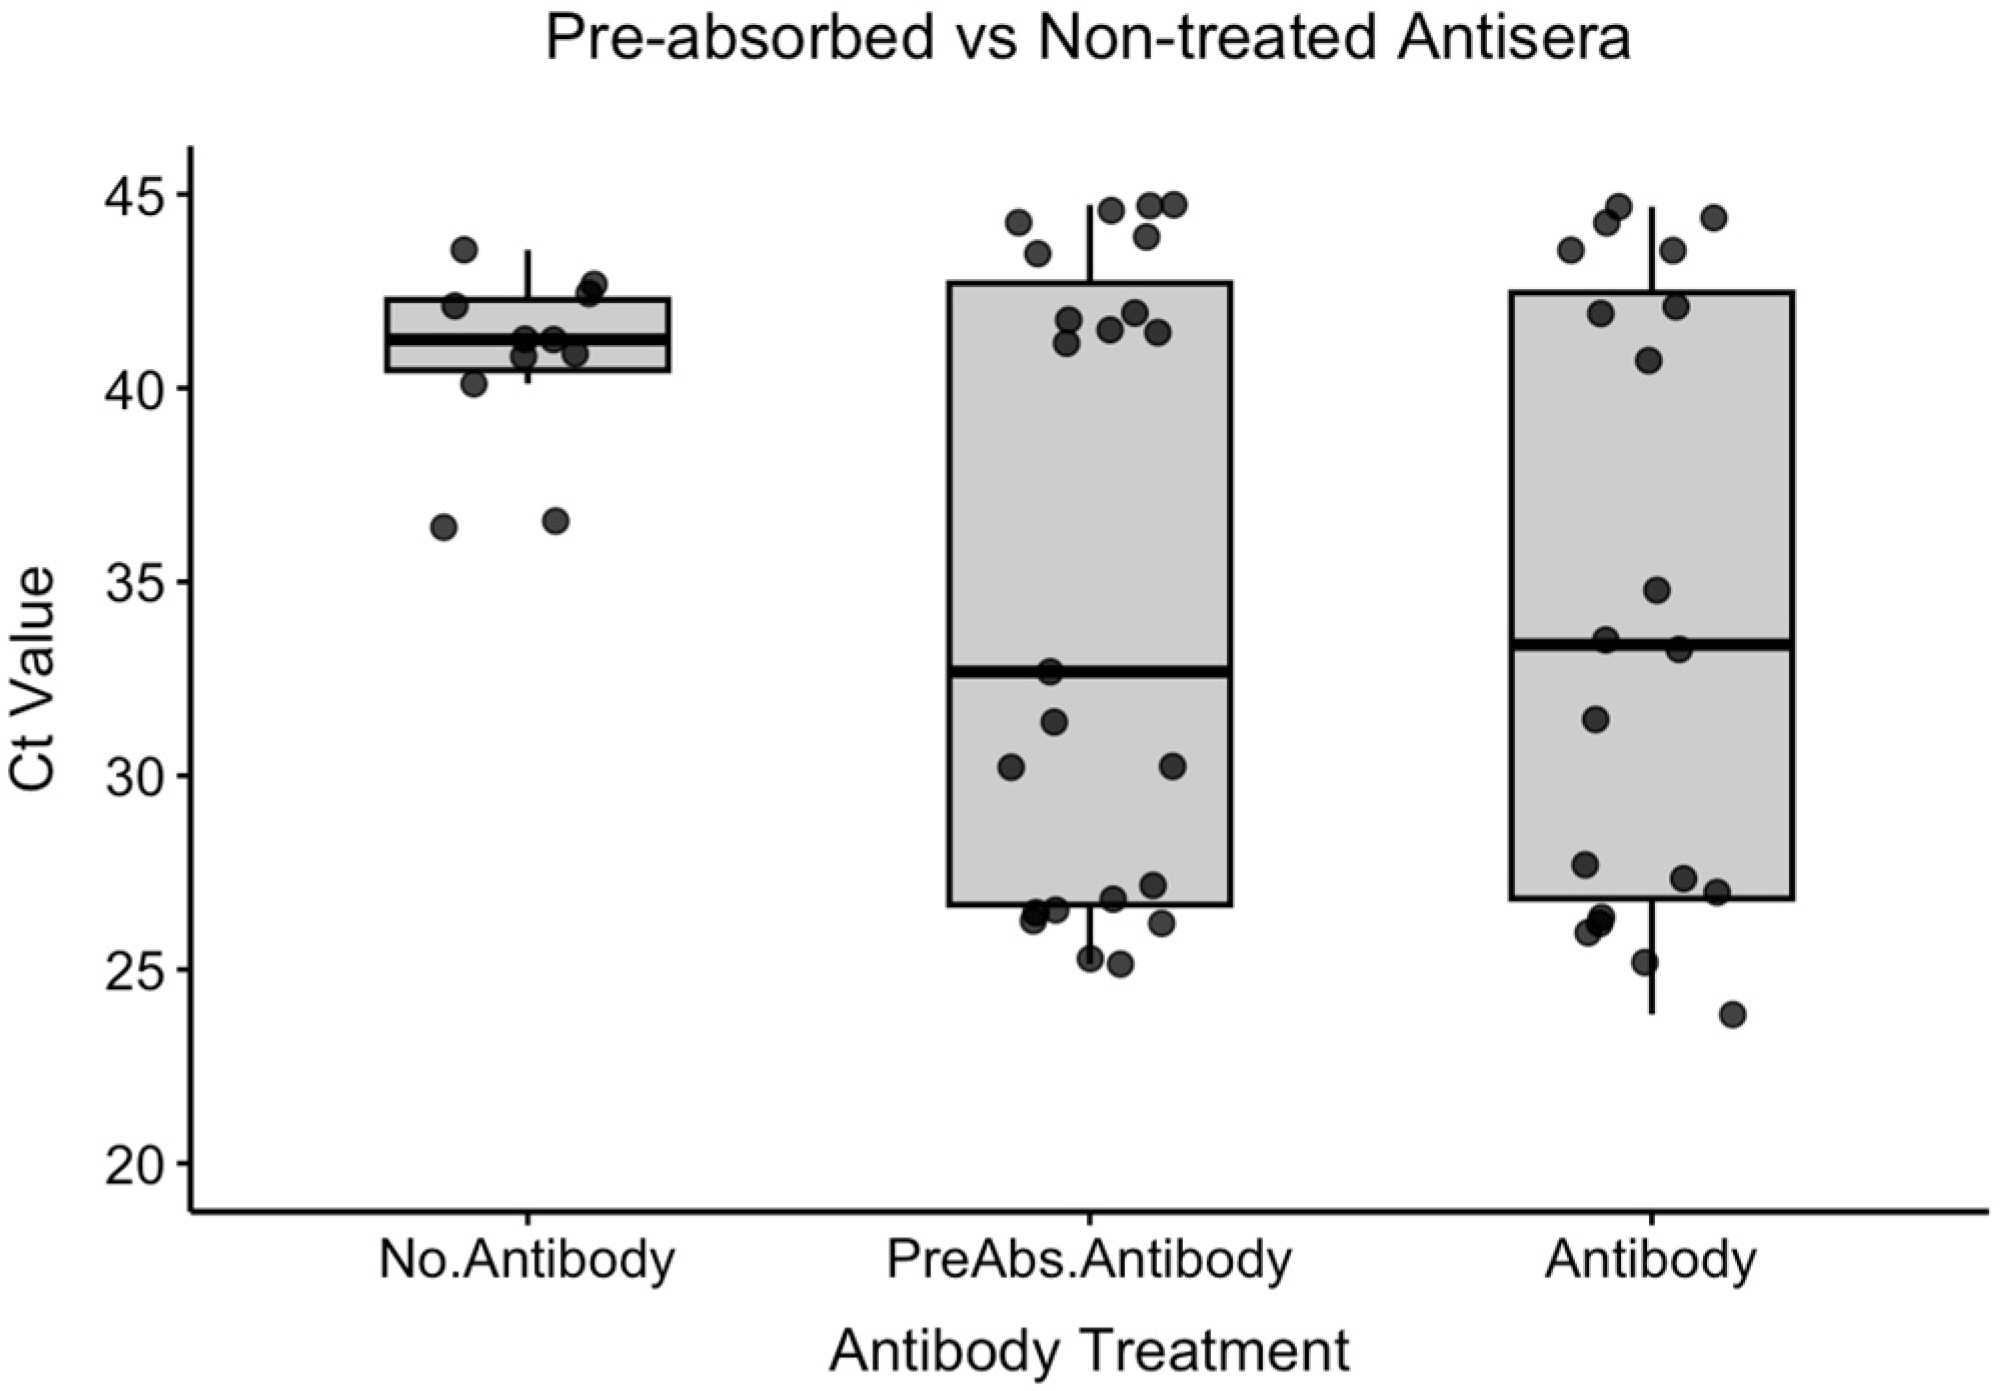
We compared three conditions for immunocapture: no antibody (No.Antibody), pre-absorbed antiserum (PreAbs.Antibody), and non-treated antisera (Antibody) (
Figure 2,
Table 2).
Shapiro–Wilk tests revealed non-normal distributions for the PreAbs.Antibody (W = 0.8158, p < 0.001) and Antibody groups (W = 0.8845, p = 0.015), while the No.Antibody group showed a normal distribution (W = 0.8557, p = 0.051). Due to the presence of non-normal data, non-parametric analysis was employed for all pairwise comparisons.
The mean Ct values were No.Antibody: 40.7 ± 2.3, PreAbs.Antibody: 35.6 ± 8.1, and Antibody: 35.6 ± 8.5. Pairwise comparisons using Mann–Whitney U tests revealed no significant differences between any groups: PreAbs.Antibody vs. No.Antibody (W = 109, p = 0.430), Antibody vs. No.Antibody (W = 92, p = 0.281), and PreAbs.Antibody vs. Antibody (W = 259.5, p = 0.930).
These findings indicate that while both antibody treatments showed numerically lower Ct values compared to the no-antibody control, the differences were not statistically significant, suggesting comparable performance between pre-absorbed and non-treated antisera under these experimental conditions.
3.2.2. Experiment 2b: Comparison of Reverse Transcriptases
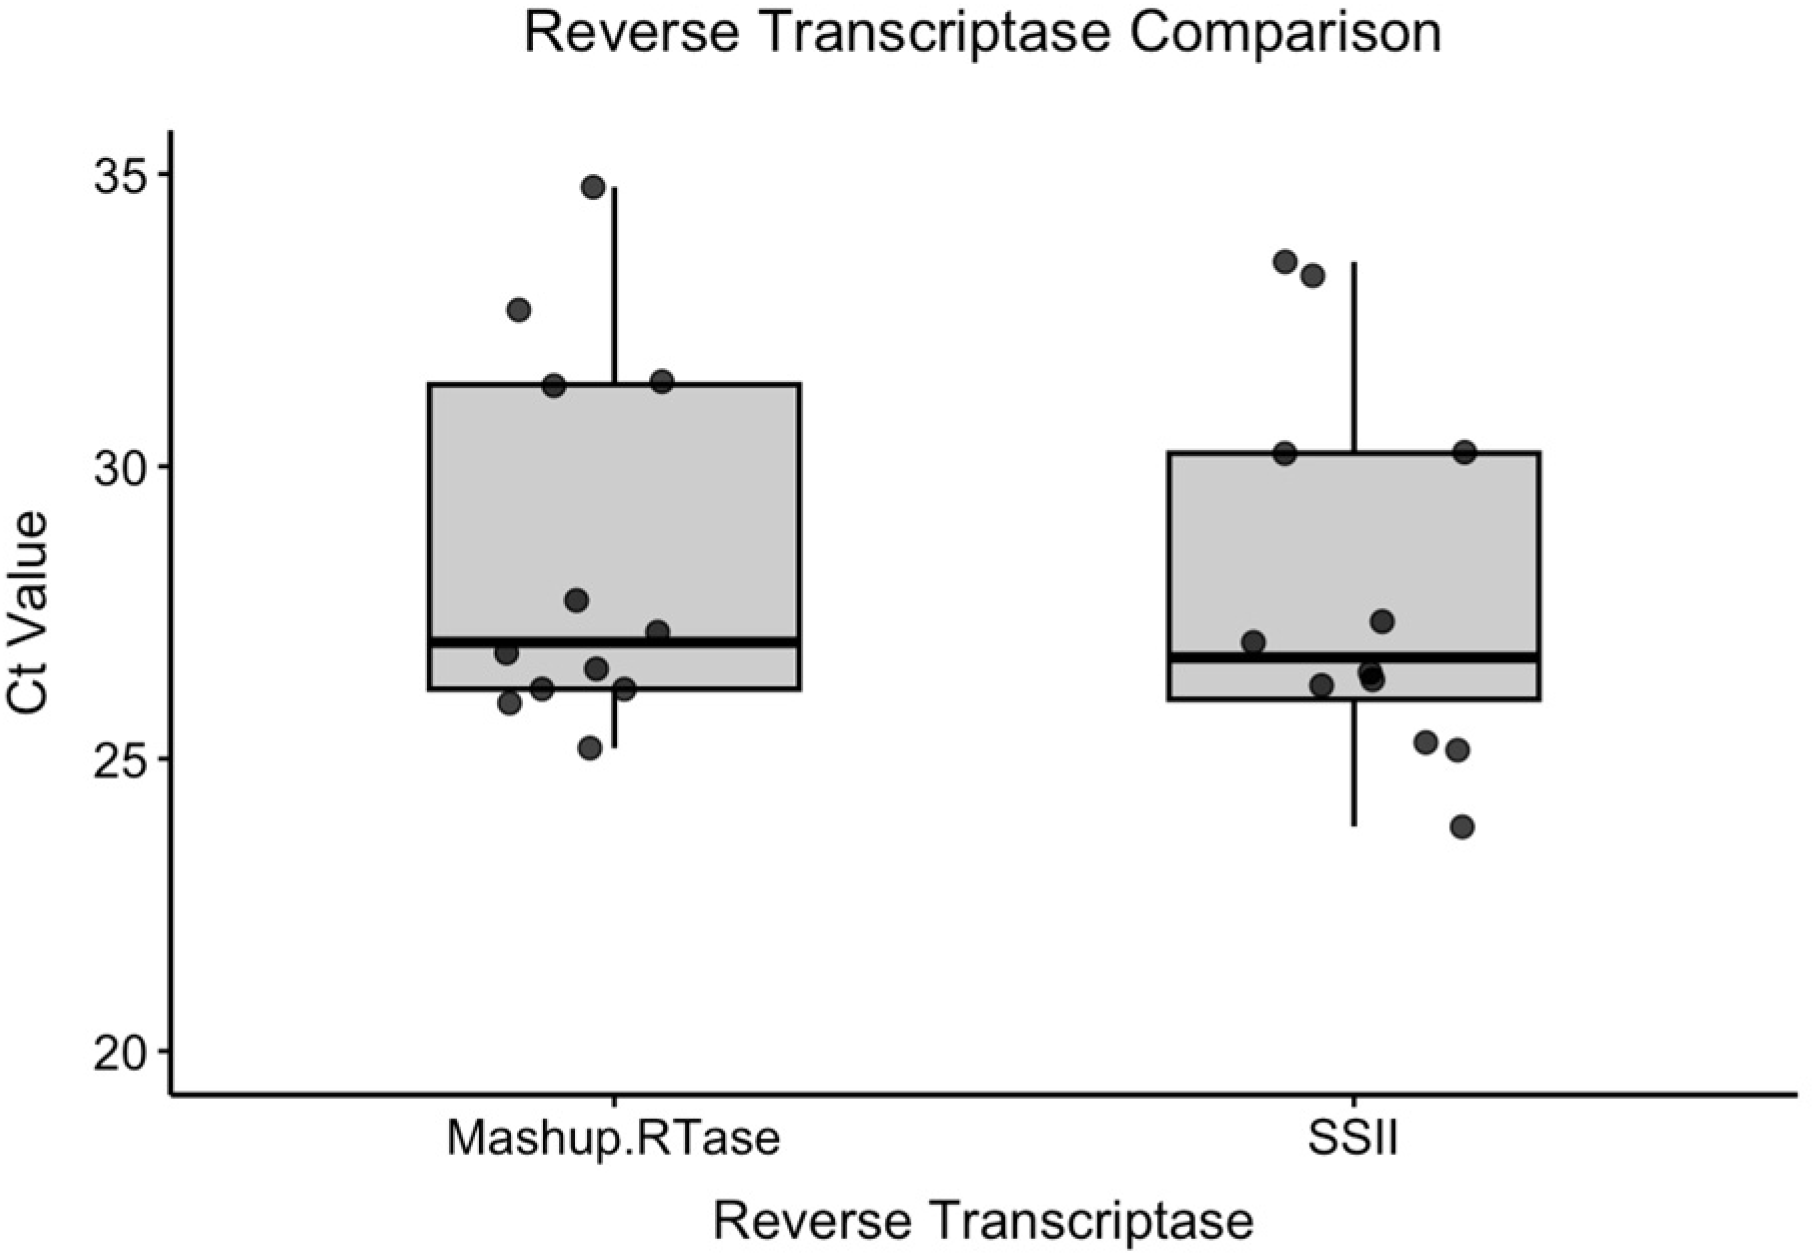
To assess the performance of the laboratory-produced Mashup RTase relative to commercial SuperScript II (SSII), cycle threshold (Ct) values were compared between the two groups using standard samples. A total of 28 samples were analyzed, including 24 standard samples and four negative controls; the negative controls were excluded from the statistical analysis comparing reverse transcriptase performance (
Figure 3,
Table 3).
Shapiro–Wilk tests revealed a non-normal distribution for Mashup RTase (W = 0.8407, p = 0.028), while SSII showed a normal distribution (W = 0.8874, p = 0.109). Due to the presence of non-normal data, non-parametric analysis was employed.
The mean Ct values were Mashup RTase: 28.5 ± 3.2 and SSII: 27.9 ± 3.2. Mann–Whitney U tests revealed no significant difference between RT types (W = 80, p = 0.665). These findings support the use of Mashup RTase as a cost-effective, laboratory-produced enzyme for large-scale DWV surveillance programs, with performance comparable to commercial SuperScript II.
3.3. Experiment 3: Method Validation
3.3.1. 3a: Sensitivity Comparison
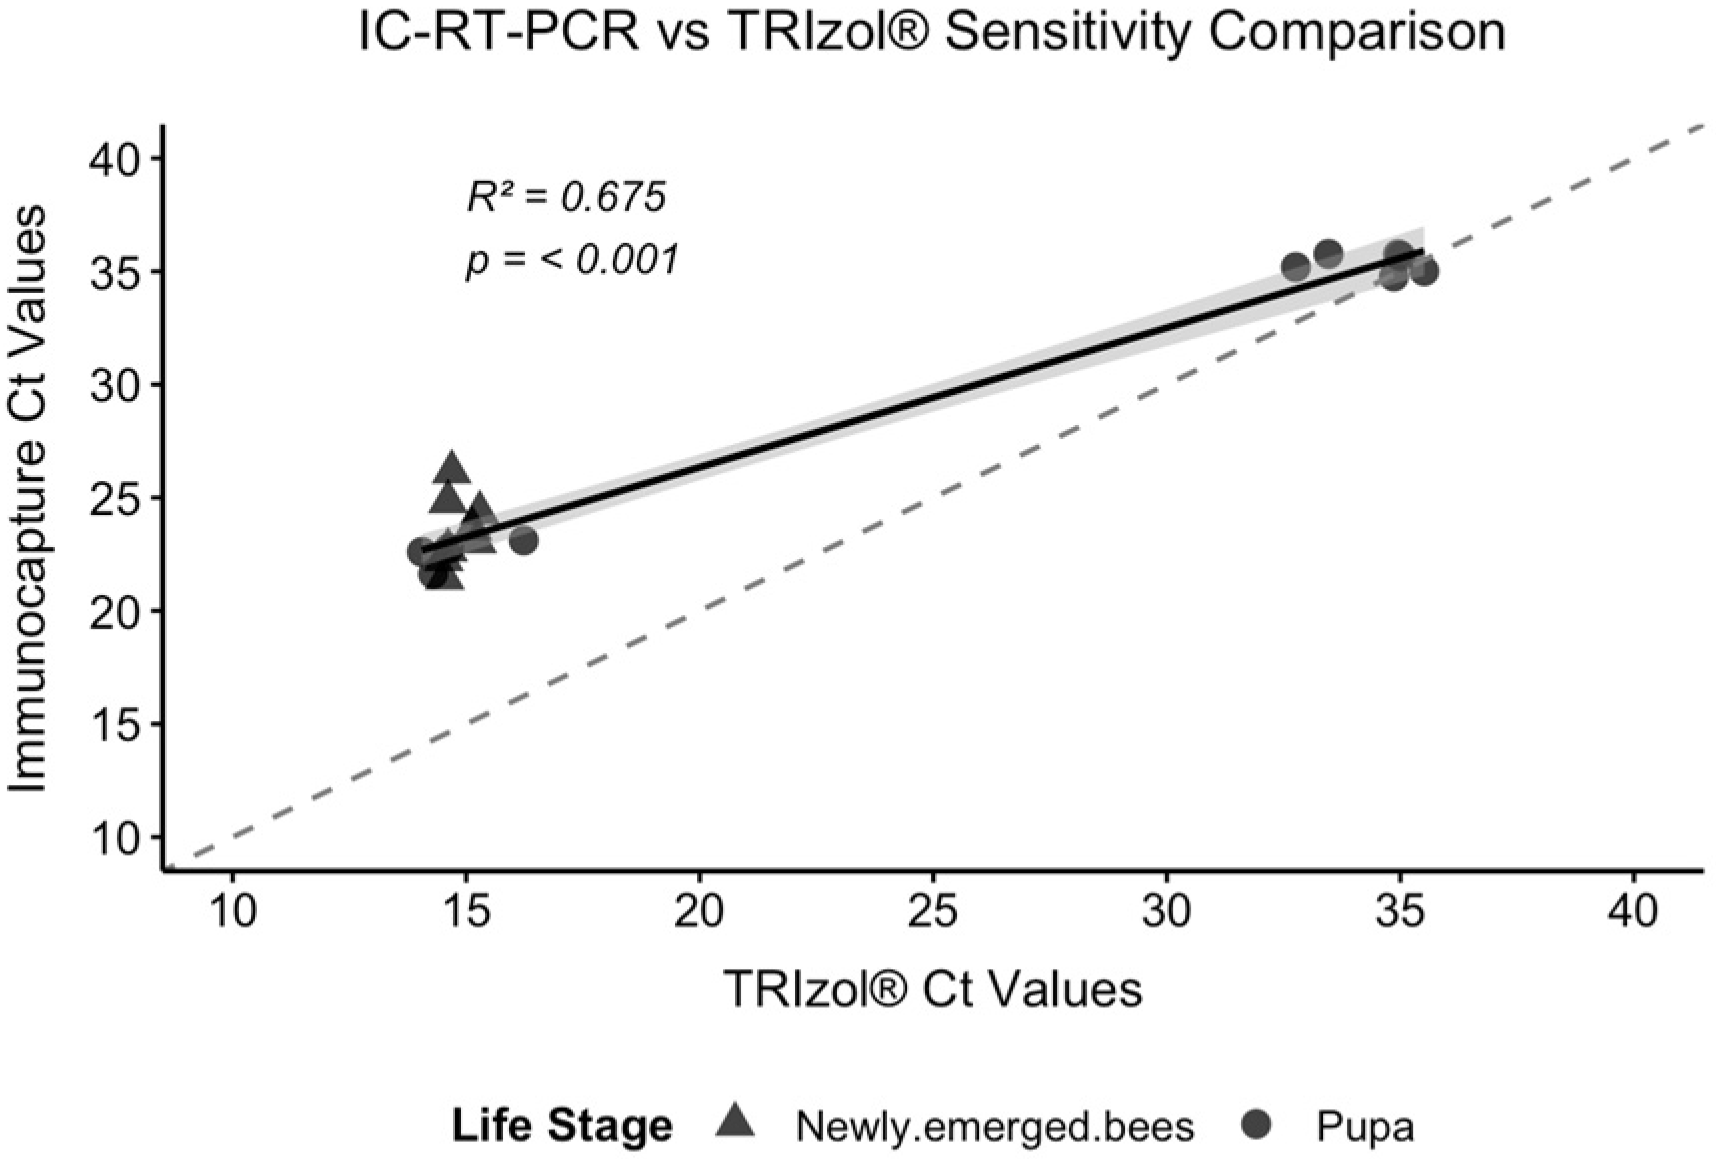
We performed a direct comparison of the IC-RT-PCR and TRIzol
® methods using identical bee samples (
n = 20) (
Figure 4,
Table 4).
Shapiro–Wilk tests revealed non-normal distributions for both the TRIzol® (W = 0.6693, p < 0.001) and Immunocapture methods (W = 0.7333, p < 0.001), necessitating non-parametric analysis. Spearman correlation analysis revealed a strong positive correlation (rho = 0.821, R2 = 0.675, p < 0.001). Linear regression analysis confirmed an excellent agreement between methods (R2 = 0.958, p < 0.001).
Paired comparison using Wilcoxon signed-rank tests revealed a significant difference between methods (V = 3, p < 0.001), with TRIzol® yielding consistently lower Ct values (mean difference = −5.99 ± 3.71). The overall means were TRIzol® 20.9 ± 9.2 and IC-RT-PCR 26.9 ± 5.8. Despite this systematic difference, the strong correlation indicates excellent proportional agreement between methods across the full range of viral loads tested (Ct values 15–35).
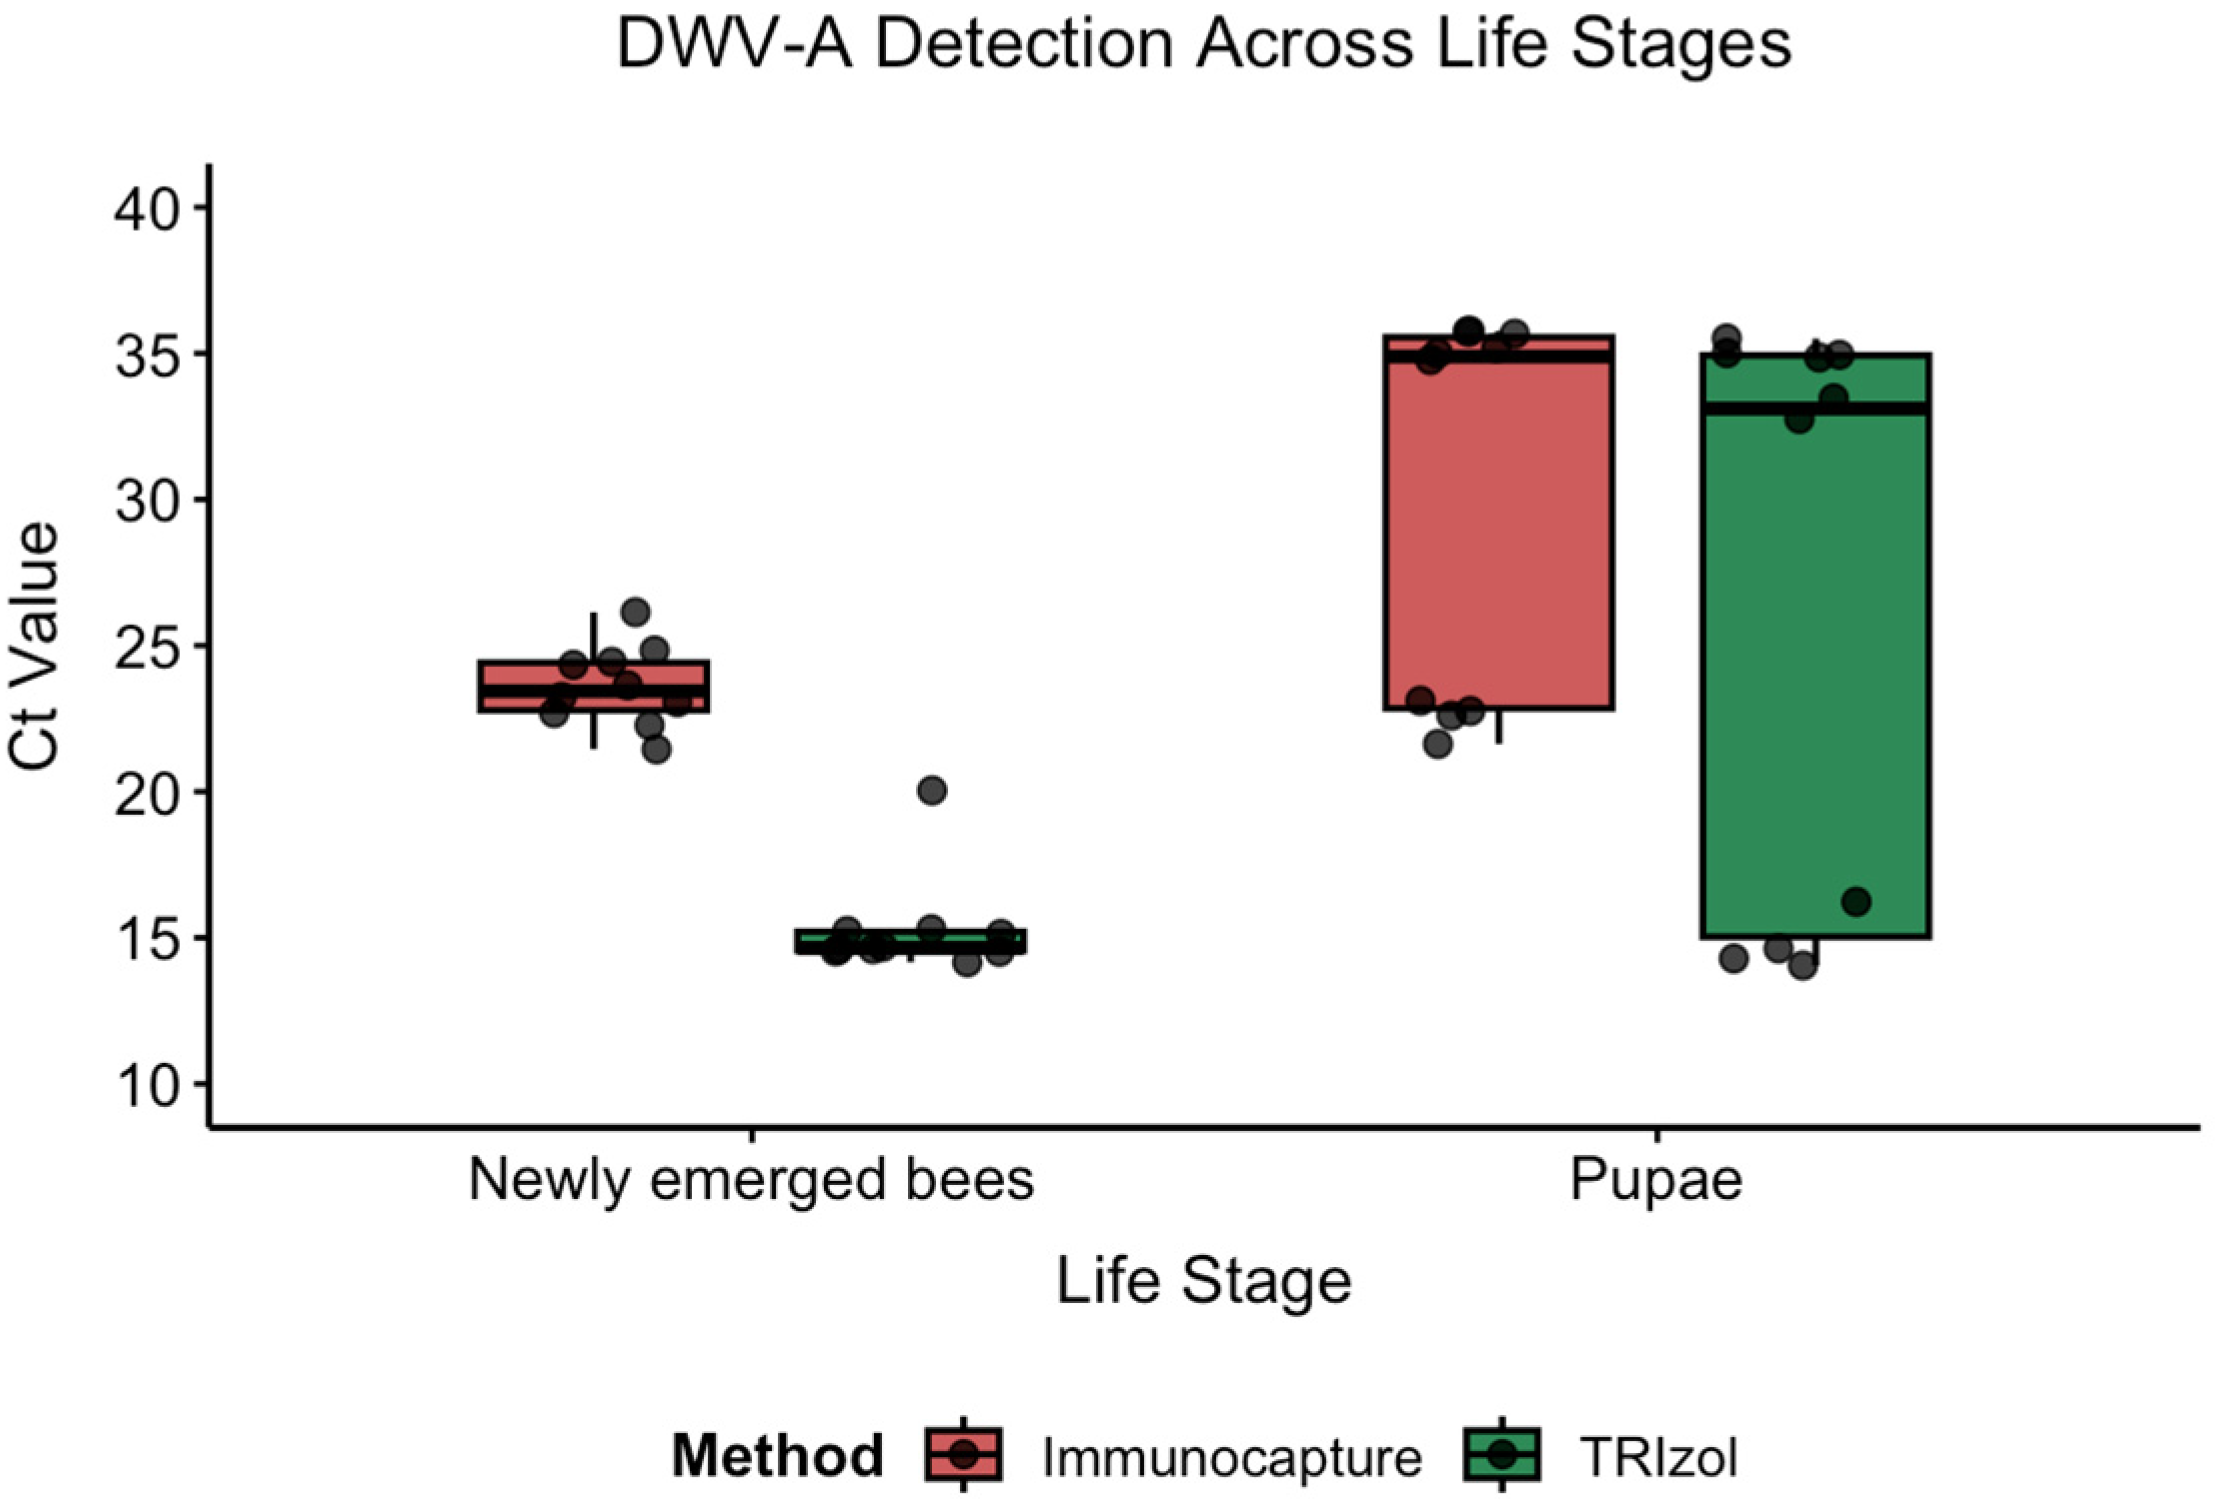
3.3.2. 3b: Life Stage Comparison
We evaluated the method performance across two honey bee life stages using paired samples: pupae (
n = 10) and newly emerged bees (
n = 10) analyzed with both the TRIzol
® and IC-RT-PCR methods (
Figure 5,
Table 4).
Statistical Analysis: Shapiro–Wilk tests revealed non-normal distributions for three of four groups (Newly.emerged.bees-TRIzol: W = 0.561, p < 0.001; Pupa-Immunocapture: W = 0.702, p < 0.001; Pupa-TRIzol: W = 0.714, p = 0.001), with only Newly.emerged.bees-Immunocapture showing a normal distribution (W = 0.988, p = 0.994), necessitating non-parametric analysis.
Results: Both methods detected numerical differences in viral loads between life stages, with newly emerged bees showing lower Ct values (higher viral loads) than pupae. For TRIzol®, the mean difference was 11.3 Ct units (pupae: 26.6 ± 10.2 vs. newly emerged: 15.3 ± 1.7), while IC-RT-PCR showed a 6.6 Ct unit difference (pupae: 30.2 ± 6.7 vs. newly emerged: 23.6 ± 1.4). However, Mann–Whitney U tests revealed that these life stage differences were not statistically significant for either method (TRIzol®: W = 75, p = 0.064; IC-RT-PCR: W = 70, p = 0.143).
Method Comparison Within Life Stages: Method comparisons within each life stage showed no significant difference in pupae (W = 30.5, p = 0.151), but a highly significant difference in newly emerged bees (W = 0, p < 0.001), with TRIzol® yielding consistently lower Ct values (8.3 Ct difference) for this life stage.
These findings indicate that while both methods detected the same biological pattern (higher viral loads in newly emerged bees), the high variability within groups, particularly in pupae, limited the statistical significance, despite substantial numerical differences.
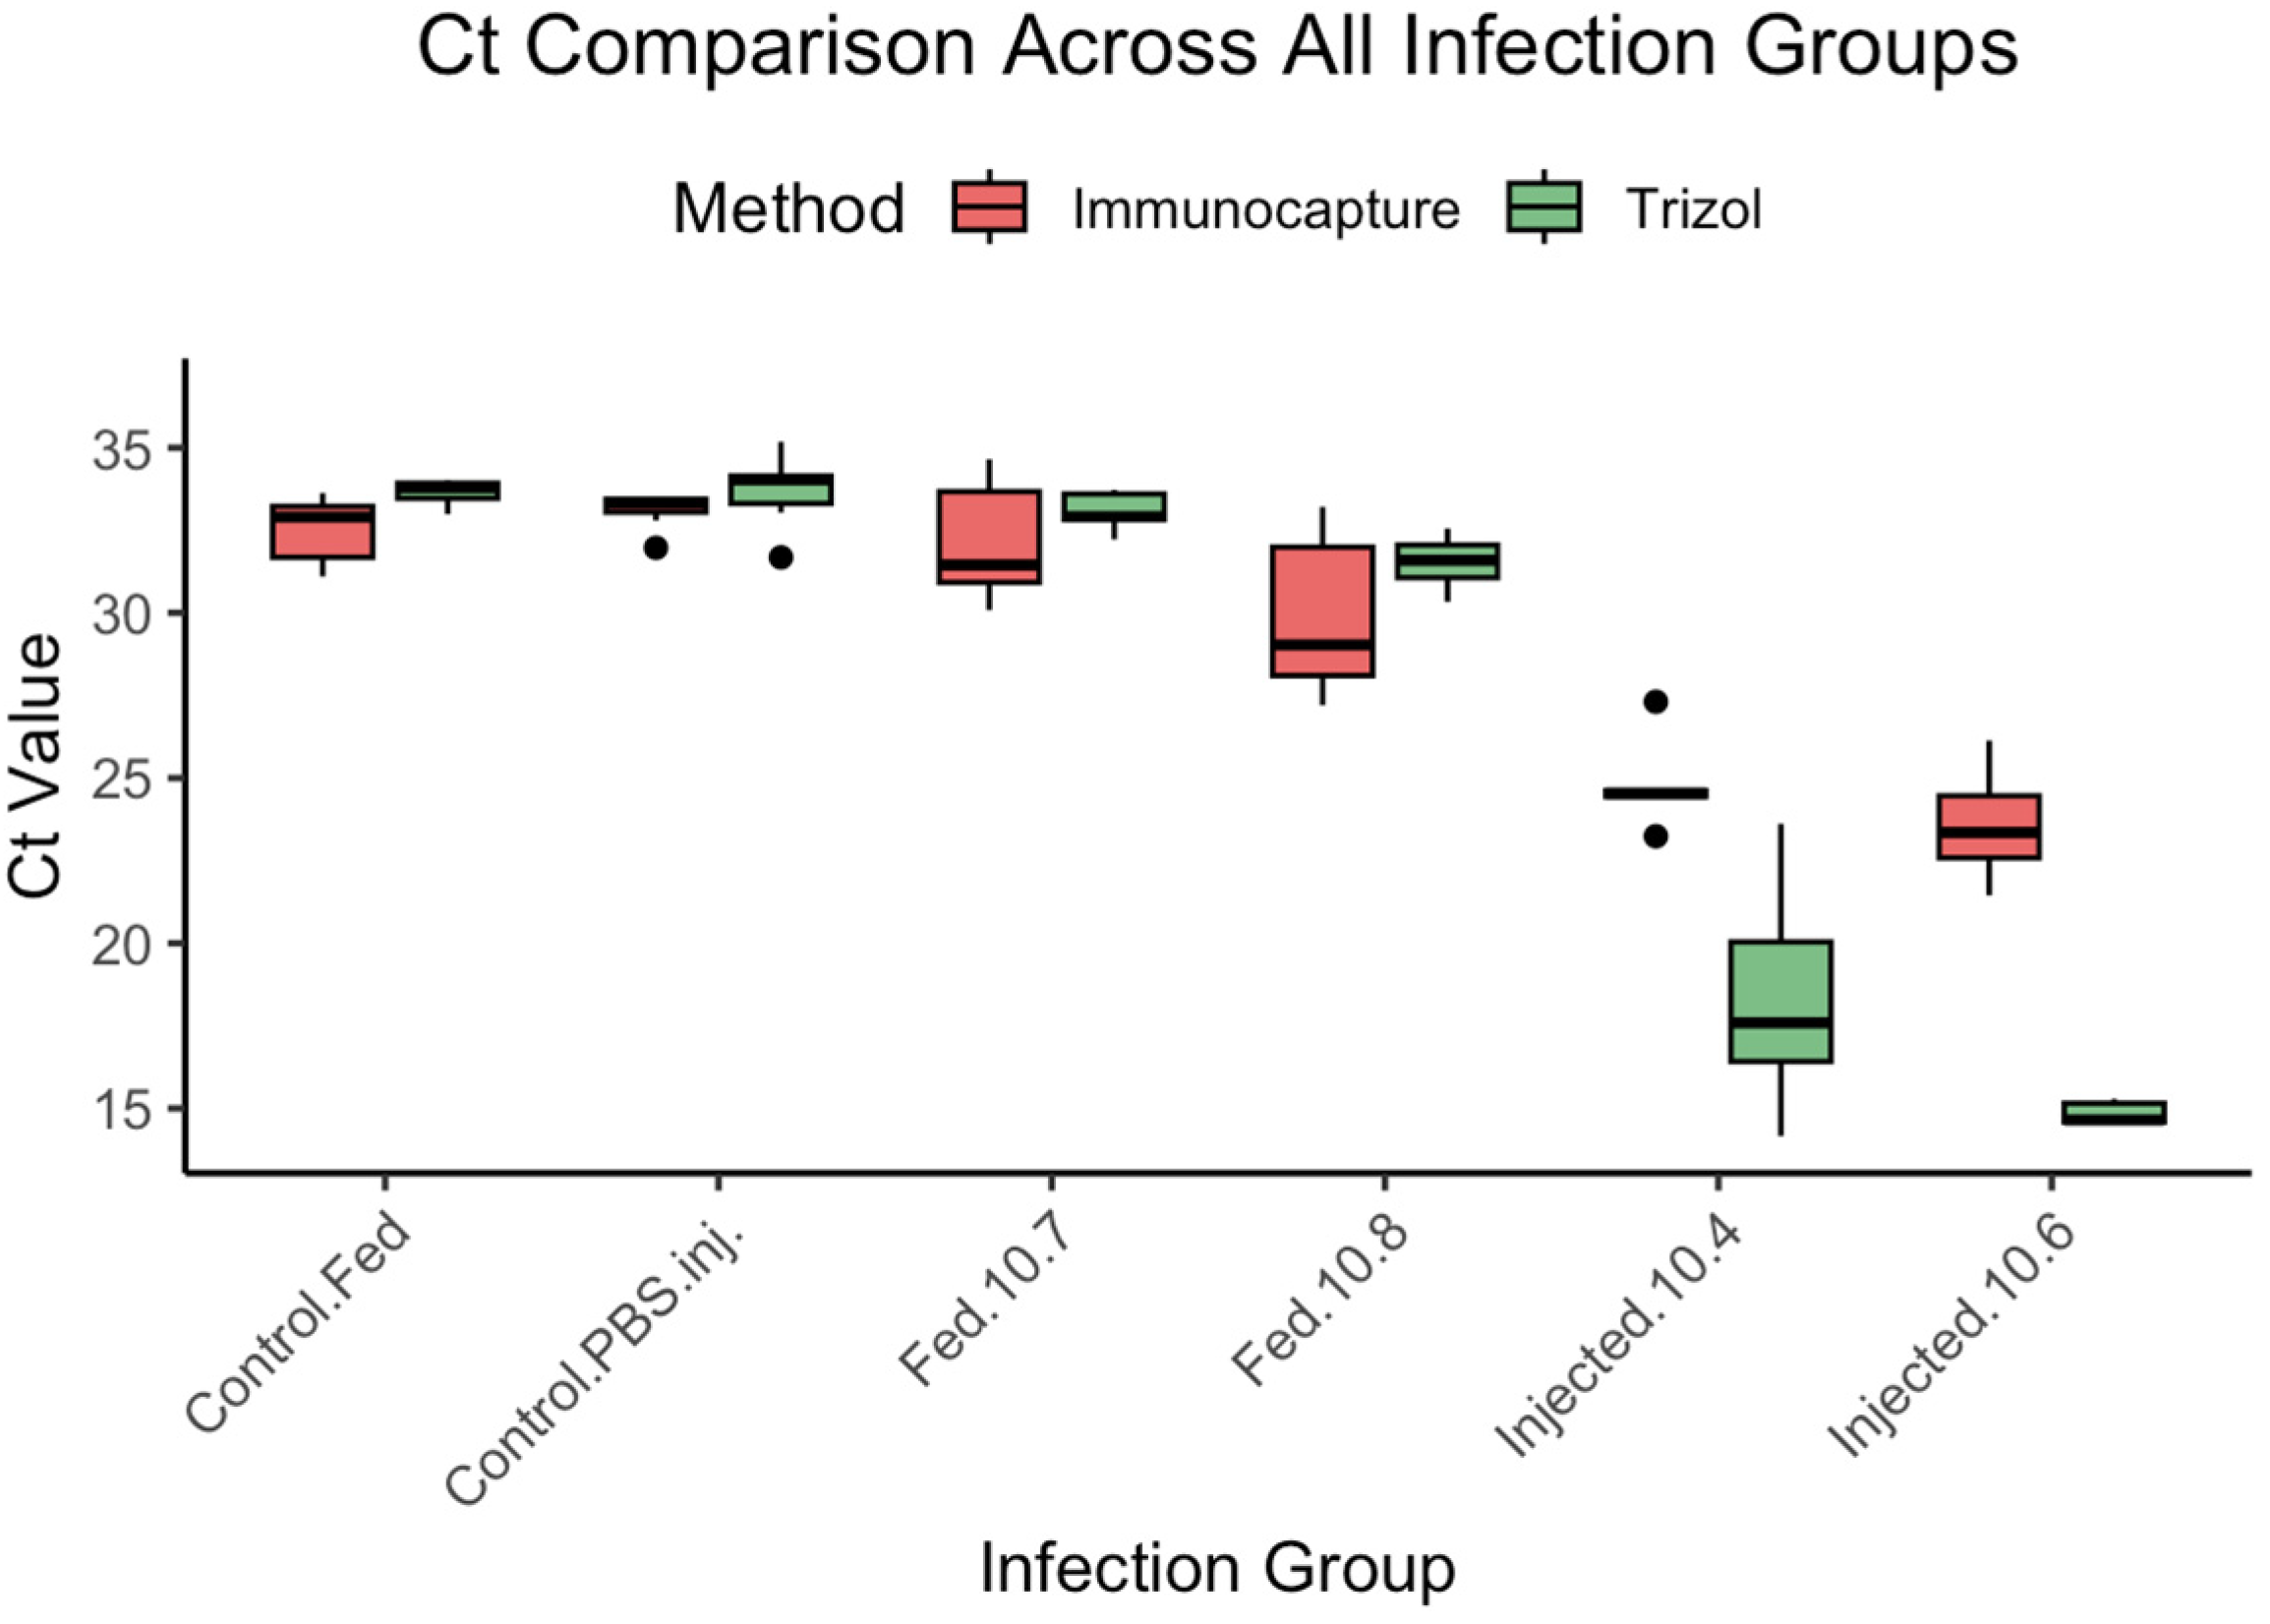
3.4. Experiment 4: Virus Delivery Assessment
To compare the sensitivity of TRIzol
®-based RNA extraction and immunocapture RT-qPCR in detecting viral genome equivalents across different infection routes and doses, we analyzed Ct values obtained from newly emerged bees exposed to either oral or injection-based infections (
Figure 6,
Table 5).
Statistical Analysis: Shapiro–Wilk tests revealed non-normal distributions for two treatment groups (Control.PBS.inj.-Immunocapture: W = 0.737, p = 0.009; Injected.10.6-TRIzol®: W = 0.802, p = 0.030), while the other groups showed normal distributions, necessitating non-parametric analysis for affected comparisons.
Results by Infection Route:
Oral Infections (Fed groups):
At 107 genome equivalents (Fed.10.7): TRIzol® 33.1 ± 0.6 vs. IC-RT-PCR 32.2 ± 1.9 (no significant difference expected based on overlapping ranges)
At 108 genome equivalents (Fed.10.8): TRIzol® 31.5 ± 0.8 vs. IC-RT-PCR 30.0 ± 2.5 (IC-RT-PCR showing slightly lower Ct values)
Injection Infections (Injected groups):
At 104 genome equivalents (Injected.10.4): TRIzol® 18.4 ± 3.6 vs. IC-RT-PCR 24.8 ± 1.5 (substantial difference, TRIzol® more sensitive)
At 106 genome equivalents (Injected.10.6): TRIzol® 14.8 ± 0.3 vs. IC-RT-PCR 23.6 ± 1.5 (pronounced difference, TRIzol® markedly more sensitive)
Controls:
4. Discussion
The development of cost-effective and scalable tools for DWV detection is essential for both research and field-level surveillance. Our findings demonstrate that immunocapture RT-qPCR (IC-RT-PCR) offers a practical alternative to conventional RNA extraction methods for specific applications, though with important limitations that must be considered for appropriate implementation.
4.1. Antibody Performance and Protocol Simplification
Contrary to initial expectations, pre-absorption of antisera did not significantly improve detection performance compared to non-treated antibodies. While this finding initially appeared to contradict the theoretical benefits of reducing background binding, it actually provides a practical advantage by eliminating an unnecessary preparation step. The lack of significant differences between antibody treatments suggests that the immunocapture process is sufficiently robust to function effectively without extensive antibody optimization, simplifying implementation for routine use.
The 1:1000 antisera dilution emerged as the optimal choice, not due to statistical superiority, but rather because of its practical advantages, including reduced antibody consumption and lower variability. This finding supports the scalability of the method for large surveillance programs where antibody costs could become prohibitive.
4.2. Reverse Transcriptase Equivalency and Cost Implications
The validation of laboratory-produced Mashup RTase as equivalent to commercial SuperScript II addresses a critical cost barrier for large-scale implementation. With potential cost savings of 75–85% in RT expenses, this finding significantly enhances the economic feasibility of the IC-RT-PCR approach for surveillance programs.
Cost Analysis Example: For a surveillance program processing 1000 samples annually, commercial SuperScript II costs approximately USD 2000–2500 per year for RT alone. Laboratory-produced Mashup RTase reduces this to USD 300–500 annually, yielding savings of USD 1500–2200 per year. Combined with elimination of hazardous waste disposal costs (USD 500–1000 annually) and reduced safety infrastructure requirements, the total cost savings could exceed USD 2000–3000 per year for medium-scale operations.
The comparable performance between enzymes (p = 0.665) validated the use of in-house produced RT, while providing greater supply chain control and customization opportunities. For laboratories processing > 500 samples annually, the initial investment in RT production capabilities would typically achieve cost recovery within 6–12 months.
4.3. Sensitivity Analysis and Method Limitations
While IC-RT-PCR demonstrated strong correlation with TRIzol® extraction (rho = 0.821), the method yielded consistently higher Ct values (mean difference = 5.99 ± 3.71), indicating reduced sensitivity compared to the gold standard. This difference likely reflects inherent losses during the immunocapture washing steps and suggests that IC-RT-PCR is most suitable for applications where moderate to high viral loads are expected, such as surveillance of symptomatic colonies or monitoring treatment efficacy.
The excellent linear relationship (R2 = 0.958) validates IC-RT-PCR as a reliable method for comparative viral load assessment, even though the absolute sensitivity differed from TRIzol®. The preserved proportionality across viral loads and life stages confirms that biological differences are accurately detected by both methods.
Based on these findings, IC-RT-PCR is recommended for large-scale surveillance programs where safety, cost, and throughput are prioritized over maximal sensitivity. For detection of low-level infections or research requiring precise quantification, TRIzol® extraction remains the preferred method.
4.4. Life Stage Comparison
Biological Relevance: Despite the lack of statistical significance, both methods consistently detected higher viral loads in newly emerged bees compared to pupae, with effect sizes (6–11 Ct differences) that were biologically meaningful. The high variability within pupal samples likely reflects natural heterogeneity in infection timing and viral replication during development.
Method Selection Guidance: The significant difference in methods in newly emerged bees (p < 0.001) but not in pupae (p = 0.151) suggests that TRIzol® provides greater sensitivity advantages when viral loads are higher and more consistent. For surveillance of mixed-age populations, IC-RT-PCR may provide adequate information for detecting general infection patterns.
Study Design Implications: The high variability in pupal samples suggests that larger sample sizes or more precise developmental staging may be needed to achieve statistical significance in life stage comparisons. Alternatively, focusing on newly emerged bees may provide more consistent and statistically powerful results.
4.5. Route-Specific Performance
The dramatic difference in method performance between oral and injection routes suggests that the immunocapture method may be less effective at detecting systemically distributed virus compared to locally concentrated infections. This finding has important implications for surveillance program design, where the expected infection route may influence method selection.
Sensitivity Thresholds: TRIzol® extraction demonstrated superior sensitivity for detecting low-level systemic infections introduced by injection, with Ct values 6–9 cycles lower than IC-RT-PCR. This difference likely reflects the immunocapture method’s inherent losses during washing steps, which become more critical when initial viral loads are low.
Practical Applications: For field surveillance where natural oral infections predominate and viral loads are typically moderate to high, IC-RT-PCR provides adequate sensitivity, with significant cost and safety advantages. However, for research applications requiring detection of experimentally induced low-level infections or for diagnostic confirmation of suspected cases, TRIzol® extraction remains the preferred method.
4.6. Practical Applications and Method Selection Guidelines
Based on our comprehensive analysis, clear guidelines emerge for appropriate IC-RT-PCR application:
Recommended for
Large-scale surveillance programs prioritizing safety, cost, and throughput
Monitoring moderate to high viral loads in naturally infected colonies
Screening programs where relative viral load assessment is sufficient
Field applications where hazardous chemical use is prohibited
High-throughput scenarios requiring automation compatibility
Not recommended for
Detection of low-level experimental infections
Research requiring maximal analytical sensitivity
Diagnostic confirmation of suspected cases with low viral loads
Studies requiring precise absolute quantification
4.7. Methodological Considerations and Future Directions
Several methodological improvements could enhance IC-RT-PCR performance. The current 18 h immunocapture incubation, while optimized for sensitivity, limits rapid diagnostic applications. Future work should investigate shorter incubation times and their impact on detection limits. Additionally, the method’s current limitation to DWV-A detection represents a significant constraint given the epidemiological importance of other DWV variants, particularly DWV-B.
Integration with portable detection platforms represents a promising development path. The simplified workflow and reduced hazardous chemical requirements make IC-RT-PCR particularly suitable for field-deployable diagnostic systems. However, such applications would need to carefully consider the sensitivity limitations identified in this study.
4.8. Economic and Safety Benefits
The elimination of phenol-chloroform extraction provides substantial safety benefits, particularly for large-scale screening programs. Cost analysis suggests significant savings through reduced chemical purchases, waste disposal costs, and safety infrastructure requirements. For surveillance programs processing hundreds or thousands of samples, these savings could be substantial, while providing adequate analytical performance for program objectives.
4.9. Study Limitations
Several limitations merit acknowledgment:
Single virus focus: Validation was limited to DWV-A, restricting applicability to comprehensive viral screening
Laboratory conditions: All validations were performed under controlled laboratory conditions; requirement for field validation remains
Sample matrix: Testing was limited to honey bee homogenates; performance with other sample types (bee bread, honey, etc.) requires separate validation
Storage stability: Long-term stability of immunocaptured samples was not evaluated
Cross-reactivity: Comprehensive testing against related viruses was not performed
5. Conclusions
The IC-RT-PCR method represents a significant advance in DWV detection methodology when applied appropriately to its intended use cases. Our comprehensive validation demonstrates that while the method does not achieve the absolute sensitivity of TRIzol® extraction, it provides reliable, proportional viral load assessment, with substantial practical advantages.
Key findings:
Method validation: IC-RT-PCR shows strong correlation (rho = 0.821) with TRIzol® extraction but with reduced absolute sensitivity (~6 Ct difference)
Cost-effectiveness: Combination with laboratory-produced RT and simplified antibody protocols provides substantial cost savings for large-scale applications
Route-dependent performance: Method performs adequately for oral infections at moderate to high doses but shows limitations for low-level systemic infections
Safety advantages: Elimination of hazardous chemical extraction provides significant safety benefits for high-throughput applications
Practical impact: This method fills an important gap for surveillance applications where safety, cost, and throughput are prioritized over maximal sensitivity. For research applications requiring detection of low-level infections or precise quantification, TRIzol® extraction remains the preferred approach.
Future directions: Continued development should focus on expanding virus specificity to include other DWV variants, optimizing incubation conditions for reduced processing time, and validation under field conditions. Integration with portable diagnostic platforms represents a particularly promising application given the method’s simplified workflow and reduced infrastructure requirements.
The honest assessment of method capabilities and limitations provided in this study should guide appropriate implementation and prevent misapplication in contexts requiring maximal analytical sensitivity. When applied within its validated performance envelope, IC-RT-PCR offers a valuable tool for advancing DWV surveillance capabilities, while significantly reducing associated costs and safety risks.
