Article

Evolution of the Genetic Diversity and Spatial Distribution of Self-Establishing Black Locust (Robinia Pseudoacacia L.) Stands

by
Sinilga Černulienė
1,
Rita Verbylaitė
1,* and
Vidas Stakėnas
2
1
Faculty of Environmental Engineering, Lietuvos Inžinerijos Kolegija|Higher Education Institution, 50155 Kaunas, Lithuania
2
Lithuanian Research Centre for Agriculture and Forestry, 58344 Akademija, Lithuania
*
Author to whom correspondence should be addressed.
Appl. Biosci. 2025, 4(3), 33; https://doi.org/10.3390/applbiosci4030033
Submission received: 21 March 2025 / Revised: 26 May 2025 / Accepted: 20 June 2025 / Published: 7 July 2025

Abstract

Robinia pseudoacacia is one of the most widely introduced—but also controversial—tree species in Europe. On the one hand, it is valued for its productivity, timber quality, and melliferous blossom. On the other hand, it is highly invasive and causes habitat change and homogenization. The aim of the study reported on here was to assess the genetic diversity of selected R. pseudoacacia stands in Lithuania in districts with the highest black locust stands frequency and to evaluate its spatial distribution in self-establishing stands. To achieve this aim, we employed four nuclear SSR loci (Rops 02, Rops 05, Rops 06, and Rops 08) and investigated the genetic diversity of five R. pseudoacacia plots. The study results reveal that R. pseudoacacia in Lithuania is genetically diverse (the average allele number per plot was 3.66, and the average Ho was 0.83). R. pseudoacacia in the plots forms tight clonal groups that hardly intermix with each other; it also spreads by seeds (66 single-copy genotypes were found in total in all 5 investigated plots). R. pseudoacacia stands in Lithuania originate from different seed sources and from different introduction events, as revealed by the allelic pattern, genetic diversity, and genetic differentiation among the research plots.

1. Introduction

Robinia pseudoacacia L. (black locust) is a North American species that was introduced to Europe in the early 17th century [1]. It has one of the largest distribution areas of any introduced plant species in Europe [2]. R. pseudoacacia has many beneficial traits; however, due to its ecological plasticity and its ability to spread easily to local habitats, in many countries, it is included in invasive species lists [3,4,5].
R. pseudoacacia is a deciduous tree with fragrant and melliferous blossom valued for its productivity and timber, which is hard and durable and similar to that of a hardwood species [2,6]. In Europe and Lithuania, R. pseudoacacia is affected by few natural pests and pathogens [7,8,9,10]. In its introduced range R. pseudoacacia can grow in poor soils due to its nitrogen fixing abilities, it can tolerate dry habitats, and it has excellent propagation ability due to prolific seed production and intensive vegetative sprouting [2,11,12,13]. Under certain climatic conditions R. pseudoacacia can spread very fast into open spaces after forest fires [14,15], clearcuts or strong wind breaks [16,17]. Its rapid spread into unintended habitats, including protected areas, together with R. pseudoacacia’s life history characteristics, contributes to its invasiveness [18]. Furthermore, global warming will allow this species’ distribution to expand northwards [19]. However, R. pseudoacacia is not competitive under the canopy of other deciduous forest tree species [20,21,22,23]. On the one hand, R. pseudoacacia is a valuable and easy-to-propagate forest tree species. On the other hand, its ability to grow well in different habitats and to spread rapidly can present significant problems for nature conservation and management [24]. Some data also show that R. pseudoacacia causes the homogenization of forest vegetation [25], changes valuable native habitats, and decreases native species biodiversity [26,27,28,29].
In Lithuania, R. pseudoacacia is mostly grown as an ornamental tree in cities and farmsteads. It is frequently cultivated along roadsides, from which it escapes to forests. It remains rather rare in Lithuanian forests, occupying approximately 49 hectares (ha). Most R. pseudoacacia stands are found in Kaunas (Dubrava and Jonava branches of the State Forest Enterprise (SFE)) and Klaipėda (mostly Curronian Spit) districts (State Forestry Service data, personal communication). R. pseudoacacia spreads rapidly in Lithuania in certain ecotops, such as in open sandy soils in Curonian Spit, where valuable and protected habitats prevail. R. pseudoacacia is included in Lithuania’s national invasive species list [30].
Ecological niche modeling of R. pseudoacacia predicts its rapid spread in central and northeastern Europe, and in Lithuania its rapid spread is also envisaged [31]. Therefore, it is crucial to better understand, and to have more data on, R. pseudoacacia invasion and spread in natural ecosystems in Lithuania.
Lithuania is a favorable research area for R. pseudoacacia spread, as autochthonous tree species forests are prevalent, with only a few research plots for introduced tree species. R. pseudoacacia was introduced to the country fairly recently, and we can therefore observe its spread patterns directly after introduction. Better understanding of the spread patterns and genetic diversity of the tree populations can help in choosing the correct management regime for controlling R. pseudoacacia, especially in valuable protected habitats. The hypothesis of the present study is that R. pseudoacacia originated in research plots from different introductory events (being planted along roads) and later spread into adjacent areas with suitable conditions.
The aim of the study reported on here was to assess the genetic diversity of selected R. pseudoacacia stands in districts with the highest R. pseudoacacia stand frequency and to evaluate its spatial distribution in self-establishing stands.

2. Materials and Methods

2.1. Sampling

The study included five research plots of black locust overgrowth (Figure 1). Research plots were selected in locations where the majority of R. pseudoacacia is registered in the country. The plots were selected based on the plot size (1 ha or more) and R. pseudoacaia age (trees of seed-bearing age being present) in the plot. All studied plots were in nutrient-poor (Nb) sites with normal moisture levels. Four plots were selected in the Dubrava branch of SFE in the Vaišvydava forest district (sites 1–4), and one was selected in the Kretinga branch of SFE in the Juodkrantė forest district (site 5). R. pseudoacacia sites at Dubrava SFE are formed in Scots pine clearcuts. The oldest R. pseudoacacia trees in these sites are 30–35 years old. Juodkrantė 5 site is established at the site of a former forest fire, with devastated Pinus mugo. The group of old R. pseudoacacia trees there are approximately 50 years old. After the clearcut or fire event, there was no management in the sampling plots. All R. pseudoacacia trees present in the plots were sampled for molecular analysis (2016, July), and their coordinates were recorded. In total, 379 samples were taken—99 in Vaišvydava plot 1, 49 in Vaišvydava plot 2, 76 in Vaišvydava plot 3, 45 in Vaišvydava plot 4, and 110 in Juodkrantė plot 5. For molecular analysis, one leaf per plant was sampled and put in a paper bag containing the drying agent silica gel. Room temperature-dried samples were stored in a laboratory under ambient conditions until DNA extraction.

2.2. DNA Extraction

For DNA extraction, 25–30 ng of dry R. pseudoacacia leaf material was ground in liquid nitrogen and extracted using the modified CTAB protocol, as described in Menkis et al. [32]. DNA concentration was measured using an Implen spectrophotometer (Implen, Munich, Germany), and diluted to 20 ng/µL with sterile MiliQ water.

2.3. SSR Analysis

Four SSR loci—Rops02, Rops05, Rops06 and Rops08 [33]—were used for molecular analysis. These loci were previously used for genets identification in R. pseudoacacia clearcuts in Japan [17,34].
PCR was performed in a total 15 μL reaction volume, consisting of 40 ng of genomic DNA, 5 pmol of forward primer and reverse primers (Table 1), 0.2 U of Dream Taq DNA polymerase (Thermo Fisher Scientific, Vilnius, Lithuania), 30 μM of dNTP mix (Thermo Fisher Scientific, Vilnius, Lithuania), and 1x Dream Taq buffer (Thermo Fisher Scientific, Vilnius, Lithuania). The PCR cycle consisted of 1 min at 94 °C, 30 cycles of 94 °C for 30 s, 53 °C for 30 s, and 72 °C for 30 s, followed by 5 min at 72 °C. PCR was performed using a GenePro Bioer Thermal cycler (Bioer Technology, Hangzhou, China). The resulting PCR products were checked on 1% agarose gels (Thermo Fisher Scientific, Vilnius, Lithuania), under UV light using the BioDocAnalyze gel documentation system (Biometra, Jena, Germany) for successful amplification.
PCR products of four loci used were pooled together for each sample, and 4 μL of the resulting mix was diluted in 15 μL of formamide and 0.5 μL of fluorescent-labelled inner size standard (Gene Scan 600 Liz standard, ABI, Waltham, MA, USA). SSR analysis was performed at Ecogenics GMBH (Balgach, Switzerland) and involved use of an ABI 3500 genetic analyser (ABI, Waltham, MA, USA). The raw microsatellite data obtained were scored using Geneious computer software R10 [35,36,37].

2.4. Statistical Analysis

The main genetic parameters of the investigated R. pseudoacacia individuals and populations—such as the total (Na) and effective (Ne) number of alleles, the number of different genotypes in investigated plots, observed (Ho) and expected (He) heterozygosity, fixation index for all loci used (F), departure from Hardy–Weinberg equilibrium, F statistics and AMOVA analysis [38,39], and Nei’s genetic distance D [40,41]—were calculated using GenAlEx v. 6.5 software [42,43]. For AMOVA analysis, the probability P was assessed with standard permutation (9999) across the full data set and on a reduced data set, where only one copy of each individual genotype was present.
The probability of two genetically different plants having the same allelic combinations by chance at all four loci used (PD, discrimination power) was calculated according to Aoki [44].
PAST v. 2.17 computer software [45] was used to construct a dendrogram among investigated sample plots using a pairwise Nei‘s genetic distance matrix [44] and the UPGMA method [46] (a paired group algorithm with a similarity measure—Euclidean distance). The significance of clusters was assessed using bootstraps [47].
To infer the number of groups among the investigated R. pseudoacacia genotypes, the Bayesian clustering approach implemented in the software STRUCTURE v. 2.1 [48] was used. For calculations, an admixture model with correlated allele frequencies was selected, and the probable number of groups K was set from 1 to 10. The length of the burn-in and MCMC model was run for 100,000 iterations each. Each run was repeated 10 times, and the most likely number of clusters was identified by the ΔK criterion using Structure Harvester software [49]. The probability calculations were based on the second-order rate of change in the likelihood [50].

3. Results

3.1. Locus Diversity

All loci used for R. pseudoacacia molecular analysis were polymorphic. In total, we found 44 polymorphic alleles: 15 for Rops02, 11 for Rops05 and 9 for Rops06 and Rops08 each. In total, eight private alleles in four out of five investigated plots were found (three for the Vaišvydava 1 and Juodkrantė 5 sample plots and one for the Vaišvydava 3 and Vaišvydava 4 sample plots). Private alleles were found in three investigated loci (Rops02, Rops05, and Rops08, with five, two and one allele, respectively). Close inspection of the allelic pattern revealed that different alleles in different plots were present in contrasting frequencies. Only 10 rare alleles (a frequency of 0.05 or less) were rare or absent in other plots, and of those, 5 were private alleles. Six alleles were found to be common (a frequency of higher than 0.05) in all investigated sites.

3.2. Genetic Diversity in Plots

The main genetic diversity parameters, calculated for all investigated R. pseudoacacia plots, are presented in Table 2. The number of alleles ranged from 6.00 to 8.75, and the effective number of alleles ranged from 2.90 to 4.16 for different plots. The average number of alleles and the average number of effective alleles were 6.9 and 3.66, respectively. Observed heterozygosity rates were remarkably high for all sample plots and ranged from 0.78 in Juodkrantė 5 to 0.92 in Vaišvydava 3. The expected heterozygosity was lower than the observed heterozybosity, but still high and ranged from 0.65 in the Vaišvydava 2 plot to 0.75 in the Vaišvydava 4 plot. Calculated fixation index values revealed negative assortative mating for the Vaišvydava 2, Vaišvydava 3 and Vaišvydava 4 plots. The Vaišvydava 1 and Juodkrantė 5 plots revealed random matting (Table 3).

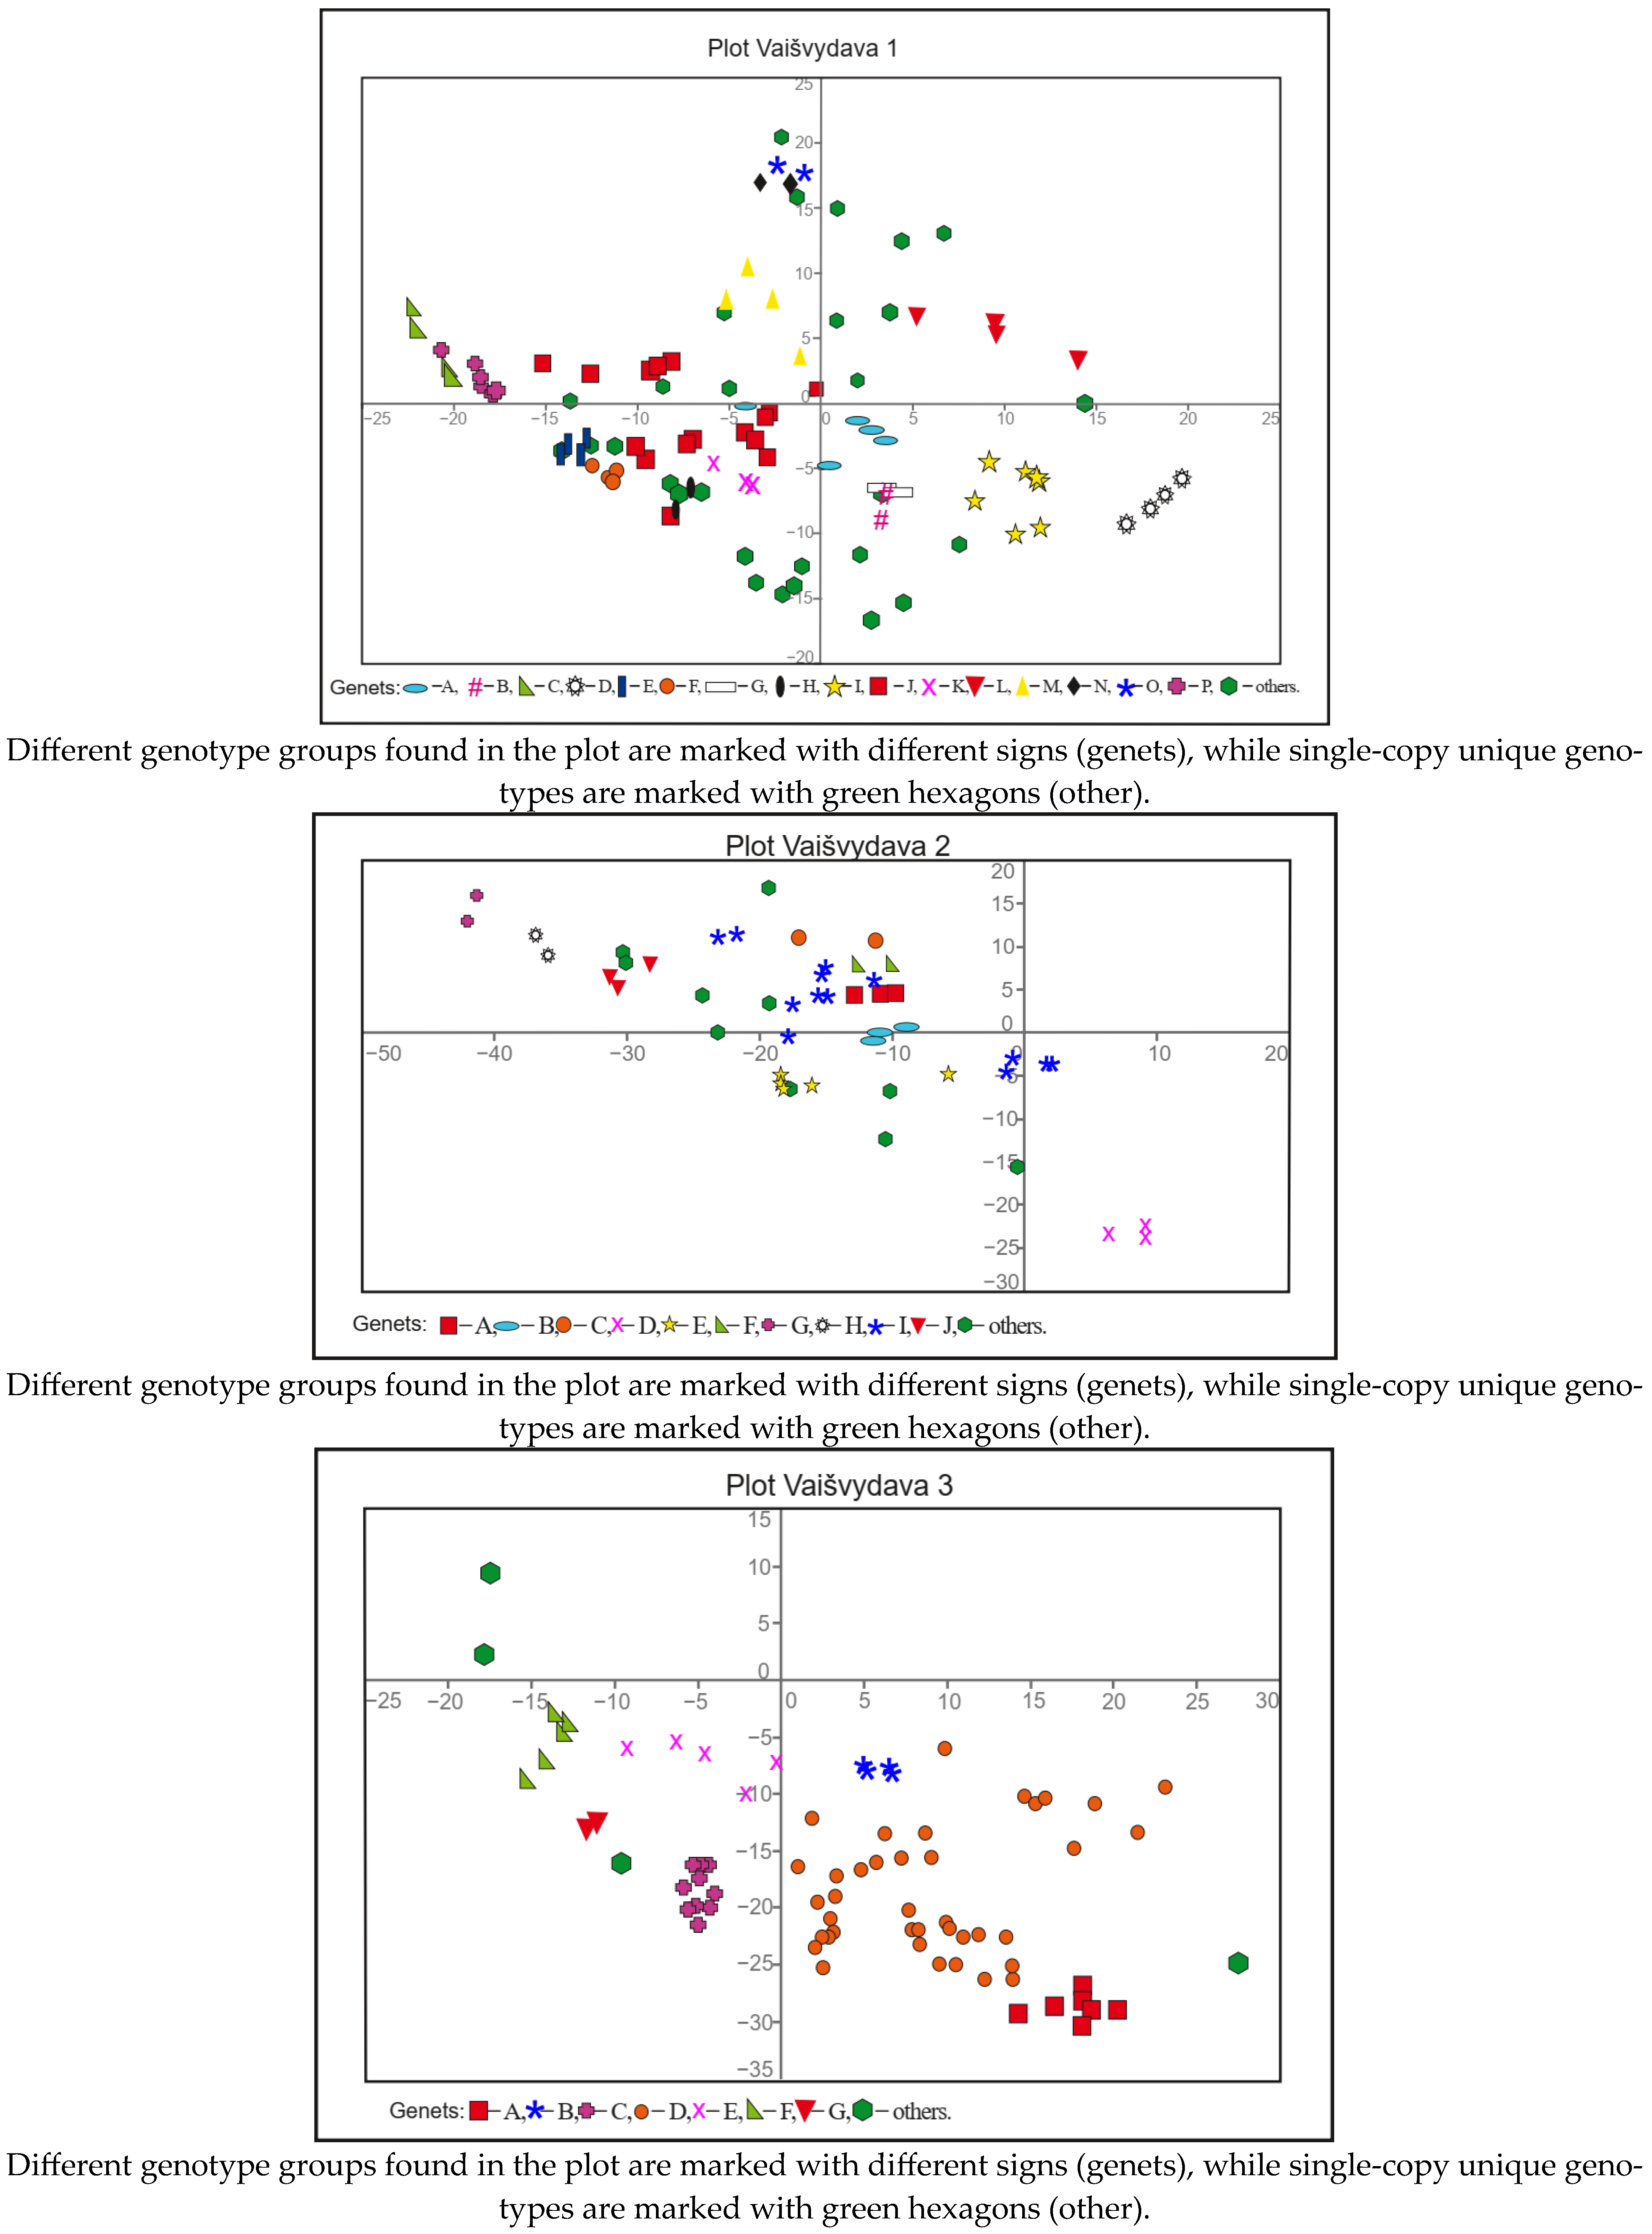
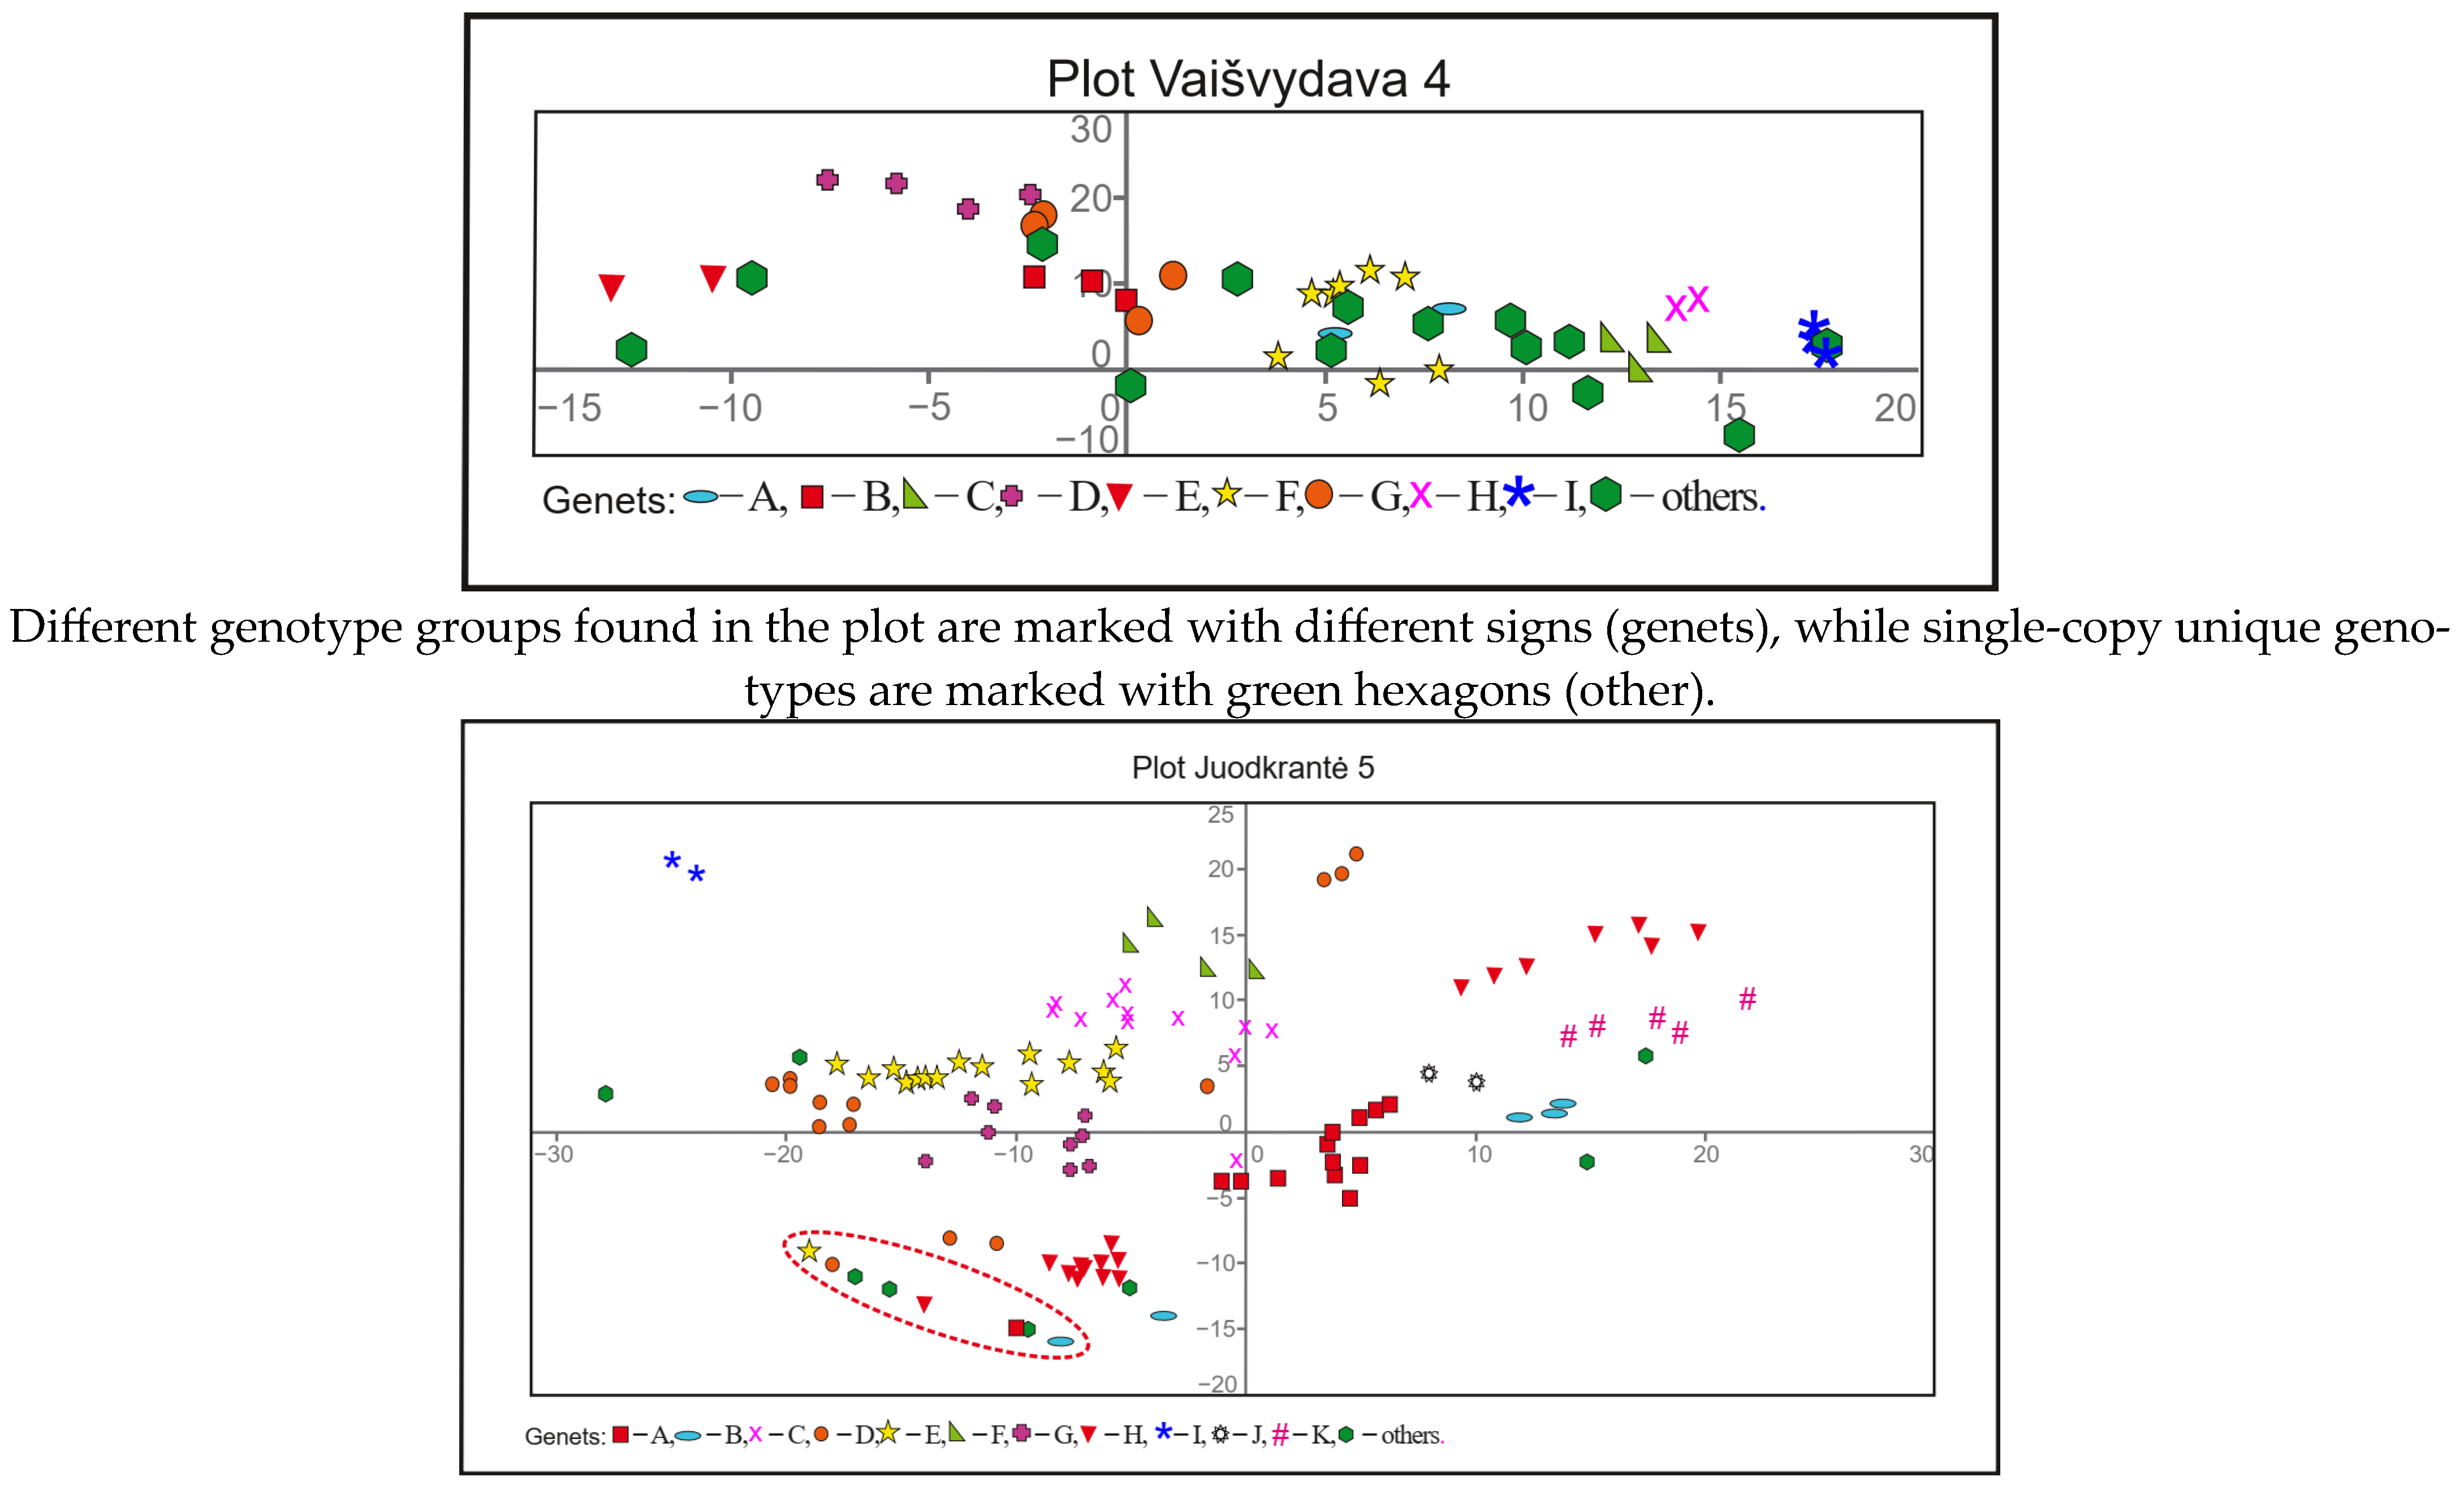
3.3. Genotypic Diversity and Spatial Structure

Genetic analysis of R. pseudoacacia samples identified unique genotypes and genetically identical plants in the investigated sample lot (Table 3). The calculated power of discrimination ability for all four SSR loci used was greater than 0.9999. This undoubtedly makes it possible to assign samples with the same allelic pattern to the same clonal group. In total, out of 379 samples analyzed, we identified 119 unique genotypes (Table 3). Out of 119 genotypes found, 66 were represented by one ramet, while 53 had more than one ramet and formed clonal groups. All five research plots investigated in this study had a unique set of genotypes (no genotype was shared among the different plots). The number of unique genotypes in the sample plots ranged from 11 to 45, while the proportion of clonal plants in different plots ranged from 70% to 94% (Table 3).
Using genotype data and coordinates, we constructed spatial R. pseudoacacia schemes for each plot (Figure 2).
The spatial schemes of R. pseudoacacia plots reveal that different genotypes grow in tight separated groups. We presume that individuals with only one ramet present are grown from seed and thus are of sexual origin. The plot with the largest number of potentially sexually reproduced individuals (individuals with only one ramet found) was Vaišvydava 1, with 29 individuals, whilst the most abundant sexual reproduction was found in the Vaišvydava 4 plot, with 14 individuals, comprising 31% of all present R. pseudoacacia plants. Less than 10% of sexually reproduced individuals were found in the Vaišvydava 3 and Juodkrantė 5 plots. The majority of the R. pseudoacacia plants there belonged to one of several clonal groups.
The Juodkrantė 5 sample plot is a special case, as there is a group of old (approximately 50 years old) R. pseudoacacia trees present (in the Juodkrantė 5 sampling plot scheme, these trees are circled with a red dotted line). As can be seen in the scheme, six out of nine old trees reproduced by vegetative means and formed clonal groups from root suckers. Several other clonal groups are likely to have originated from a single seminal individual each, by vegetative means.

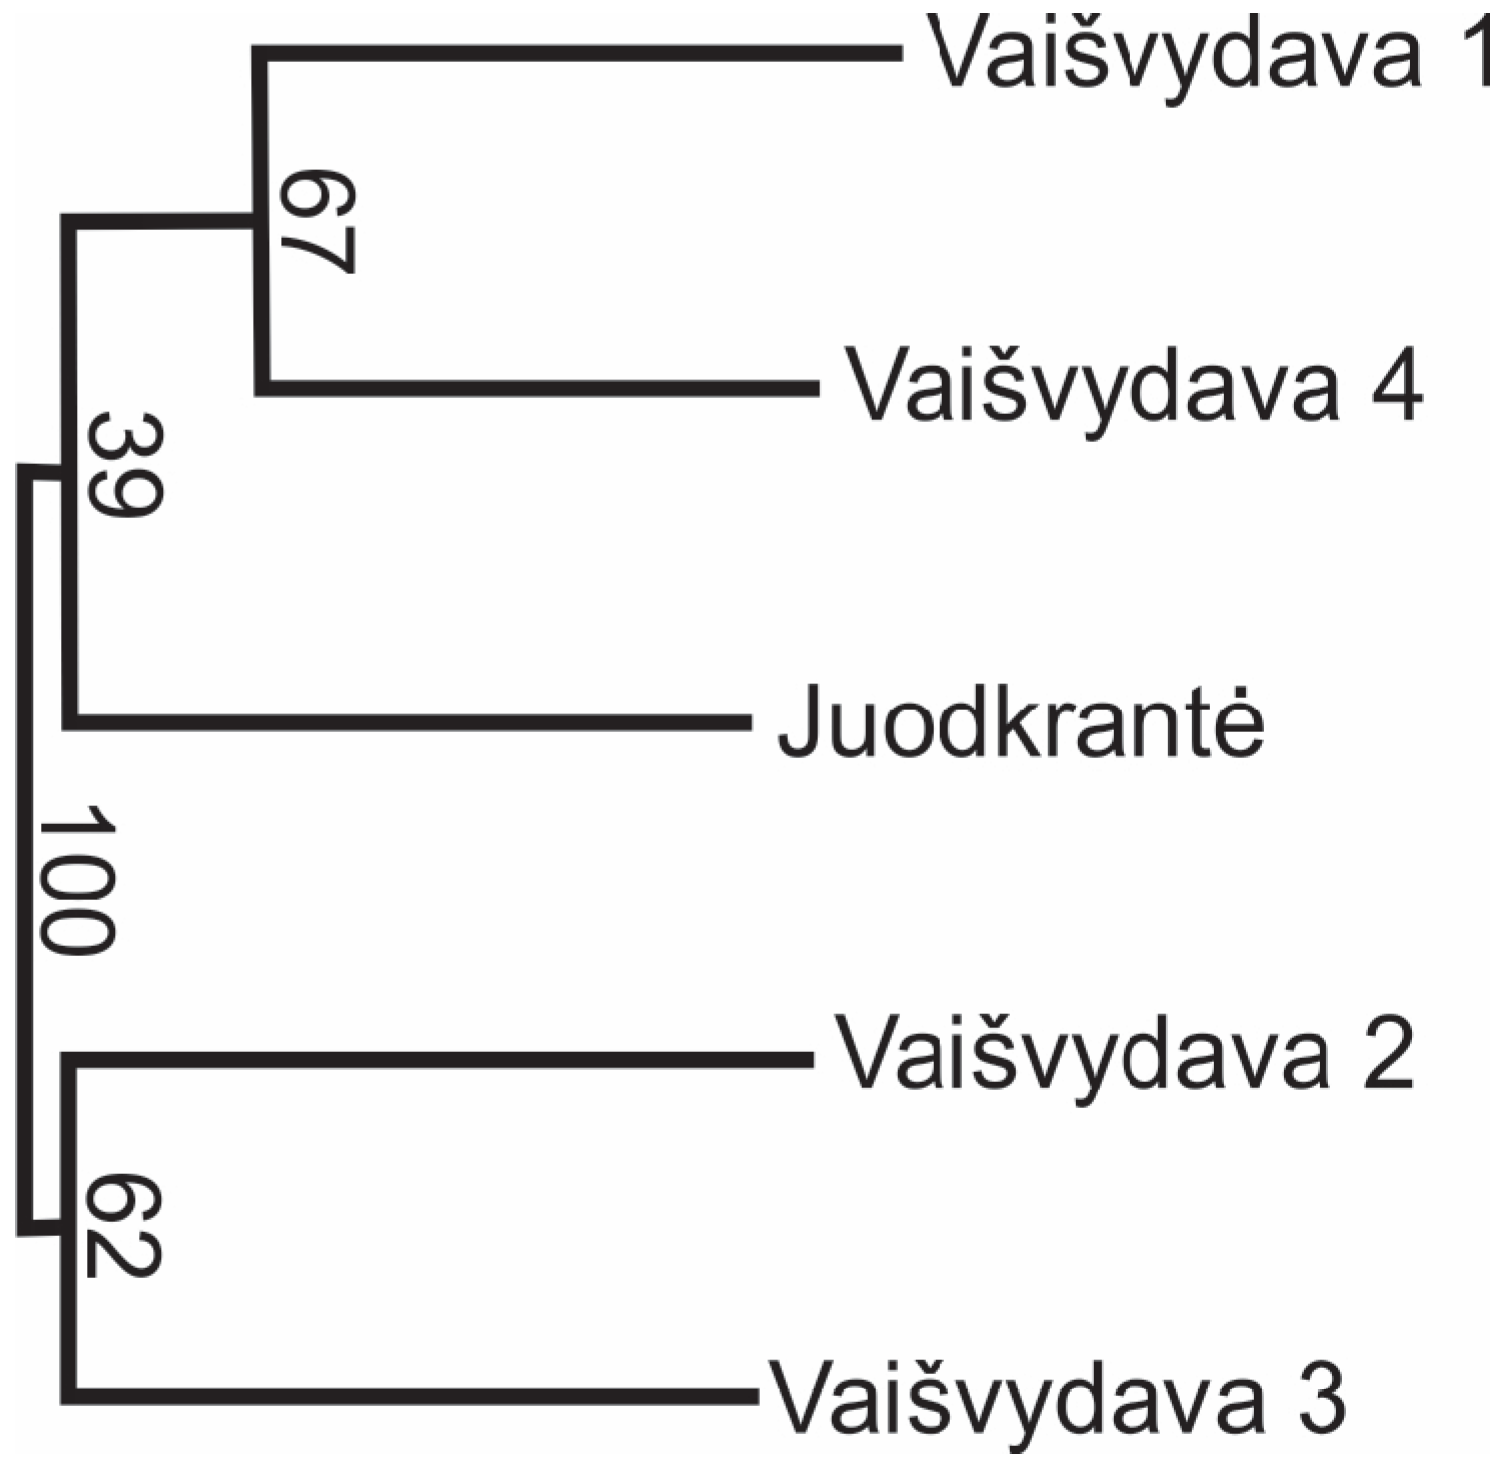
3.4. Genetic Differentiation

Lithuania is at the initial stage of R. pseudoacacia introduction; only a few stands are present in the country. To check the hypothesis of multiple introductions, we compared the genetic similarity of the investigated research plots. To assess similarities among different plots, we calculated Nei’s genetic distances (Table 4) and found that the average distance was 0.642. Genetically, the most similar plots were found to be the Vaišvydava 1 and Vaišvydava 4 plots (0.454).
To visualize the genetic similarities among the investigated R. pseudoacacia plots on the basis of Nei’s distance matrix and using the UPGMA grouping method, a genetic dendrogram was constructed (Figure 3). Different R. pseudoacacia plots in the dendrogram were divided into two clusters. Vaišvydava 1, Vaišvydava 4 and Juodkrantė 5 belong to the first cluster, while Vaišvydava 2 and Vaišvydava 3 belong to the second.
Pairwise genetic differentiation, FST, between R. pseudoacacia plots was calculated for the full data set and for the reduced data set that retained only one copy of each genotype. The differences between all plot pairs were significant regardless of whether or not the full or reduced data set was used (Table 4). The numerical values of the FST coefficient for the reduced data set were lower, but significant, indicating that all the plots can be regarded as separate populations. Furthermore, significant FST values reveal that loci used for R. pseudoacacia genetic research were well suited to identifying the genetic structure of the R. pseudoacacia population in Lithuania. The other aspect of population differentiation is the number of migrants per generation. In this study, the average number of migrants per generation among all investigated R. pseudoacacia plots was found to be 1.36, while for the reduced data set, it was equal to 2.50.
A Bayesian clustering approach was used to specify the number of R. pseudoacacia populations in our study. This analysis revealed that the most likely number of clusters, based on SSR data, is two. Bayesian clustering approach confirmed the data of Nei similarity grouping, where two population clusters were revealed (Figure 3).
Finally, a multilocus AMOVA analysis [38,39] was used to partition genetic diversity data into among- and between-population (research plots) parts. The AMOVA analysis of SSR data revealed that 86% of genetic variation was due to variation among R. pseudoacacia individuals, while the remaining variation was that among different research plots (Table 5). For the reduced data set with only one copy of each genotype, the genetic variation among individuals was 91% (Table 5).

4. Discussion

The SSR loci used in this study for genetic diversity assessment and used to reveal spatial structures were suitable, considering the study’s aims. The allelic pattern found in different plots revealed an uneven allele frequency distribution, with rather large variation in allele frequencies. We hypothesized that the large allele frequency variation is due to different independent introduction events, as the close proximity of four of the plots investigated would have resulted in a similar allelic pattern if a single introduction event had occurred. We found that the Lithuanian R. pseudoacacia stands investigated had a large number of alleles and were remarkably heterozygous (Table 3). The high heterozygosity level was an expected result, as R. pseudoacacia has high ecological plasticity, and due to its long lifespan, it outlasts changing environmental conditions [51,52]. Species with ecological features such as prolific vegetative propagation and a pioneering nature need to preserve their high genetic diversity and heterozygosity level in order to remain successful. R. pseudoacacia, due to its clonal reproduction and formation of root suckers [53,54,55,56], as well as excellent coppicing [57,58], is one of these species. The abundant seed yield [59,60] creates favorable conditions for natural selection. As R. pseudoacacia is an invasive species [3,8,18], the high heterozygosity level and negative assortative mating found in the investigated research plots were highly likely results [61]. Results from China [62] show that different R. pseudoacacia varieties had positive assortative mating (Fis = 0.091 on average), indicating a possible lack of heterozygotes, while in this study, we found an excess of heterozygotes (Fis = −0.17 on average).
SSR analysis data revealed the spatial structure of R. pseudoacacia plots in Lithuania (Figure 2). This tree species was found to form clonal groups, but there were numerous single-copy genotypes present. The single-copy genotypes were presumed to be of seminal origin. The clonal groups were found to grow in somewhat tight clusters and to rarely intermix with other clonal groups. A similar spatial stand structure of R. pseudoacacia has been found in other countries as well [17,33,63]. In Japan, R. pseudoacacia stands that regenerated after clearcuts were found to have bigger clonal groups with more ramets than in our study, as well as fewer unique single-copy genotypes [17]. A study conducted in Henan Province, China, revealed that the percentage of ramets of stump origin after clearcuts decreased with stand age (from 40.4% to 30.1% and from 57.1% to 35.7%, when comparing four-year-old and nine-year-old stands and one-year-old and eight-year-old stands, respectively), and after a period of time, their clusters were found to be less tight [63]. Spatial structures with tight one-genotype clusters in R. pseudoacacia stands are formed because of the allelopathic activity of the species [18].
The higher number of unique genotypes in our research plots could be explained by the age of the stand. In Lithuania, the R. pseudoacacia stands are in their emerging state; there were no R. pseudoacacia plants present before the clearcuts. Meanwhile, in Japan and China, the regeneration of R. pseudoacacia occurred in already-established stands after clearcuts. As R. pseudoacacia is a pioneer species, its seedlings have poor shade tolerance [8,20,64] and so, under a canopy, the seedlings of R. pseudoacacia rarely acquire a foothold, with sexual reproduction being rather inefficient. The spatial distribution results of our study indicate that the source of the R. pseudoacacia plants was seeds or artificially planted trees. Kunakh et al. [65] demonstrated that R. pseudoacacia relies on sexual reproduction in the initial establishment phase, later followed by vegetative spread retaining sexual reproduction, and only in well-established stands does it rely on mainly vegetative reproduction. It has been reported that if favorable environmental conditions occur (no canopy cover, destruction of grass cover, sufficient humidity, etc.), R. pseudoacacia can spread by seeds [2,11,12,13] and later by root suckers [66]. In our research plots, the conditions for R. pseudoacacia seedling establishment were adequate, and we found a rather high number of single-copy genotypes alongside the asexually reproduced ones. The other difference between the Lithuanian and Japan stands is the clone structure. In Japan, Kurokochi et al. [17] observed a strict distribution and no overlap among different clonal groups, while in Lithuania, the clone boundaries were found to be not as strict, and some intermixing was found. This difference might again be due to stand age. In Japan, regeneration occurred after the clearcut of R. pseudoacacia, and the regeneration most likely stemmed not only from root suckers but also from stump sprouts, while in our study, only the initial spread was observed, and no stumps were present. R. pseudoacacia stand clearcuts foster tree regeneration from adventitious shoots in stumps, resulting in numerous vegetative sprouts. This phenomenon is well known for other tree species as well [67,68]. R. pseudoacacia is also characterized by competitive rejection of other clones, which results in the formation of clearly distinguished clonal groups [17,64].
The genetic diversity found in Lithuanian R. pseudoacacia stands is high (Table 3). In Lithuania, the average Ho was 0.83, and He was 0.71. Population genetic analysis in China revealed an average Ho of 0.55 and He of 0.61 [62]; the genetic diversity found in the native range was Ho = 0.495 and He = 0.553 [69]. This finding also helps to support our hypothesis that the R. pseudoacacia stands in Lithuania originated from multiple introduction events from different seed sources. The genetic differentiation between the plots investigated was found to be significant (Table 5). Analysis of molecular differentiation (Table 5) also revealed a high percentage of diversity present among different research plots (14% for the total data set and 9% for the reduced data set). Similar AMOVA results (6% variation) for different R. pseudoacacia stands were found in Japan [17] and in China (7% variation) [62], while only 3% variation was found among different provenances in USA [69]. The significant differences among R. pseudoacacia stands in Lithuania is likely the result of the anthropogenic origin of these stands (this tree species spreads from cities, farmsteads and roadsides, where it is planted mainly for ornamental purposes). The planting of R. pseudoacacia in urban areas and its later spread to natural forests [70] can also act to supplement the genetic diversity of the species in the area. This aspect in relation to invasive species spread still needs to be addressed in future research. High FST values could also be influenced by the sampling intensity. Our study found a limited number of genotypes (ranging from 11 to 45, Table 3). Despite significant differences among the plots, some gene exchange can occur among the different stands. This would help to maintain the high genetic diversity of R. pseudoacacia in Lithuania. Significant genetic diversity, high differentiation among the investigated plots, and the lack of a geographical gradient lead us to the conclusion that the R. pseudoacacia stands in Lithuania originate from different seed sources.
To develop better management decisions, there is a need for further research on the species, including more locations and more loci. Future research could explore the connectivity between different R. pseudoacacia habitats and stands.

5. Conclusions

R. pseudoacacia stands in Lithuania are characterized by different allelic patterns, are genetically diverse (Ho = 0.83 and He = 0.71), and are significantly differentiated, with 9% of variation being attributed to variation among the stands. R. pseudoacacia stands in Lithuania likely originate from different seed sources and from different introduction events, as revealed by the genetic diversity, high differentiation, and allelic patterns among the research plots. After establishment, R. pseudoacacia spreads by vegetative means and forms spatially tight clonal groups (the average clonal group size in the research plots was 5.9 ramets). In favorable conditions, this tree species also reproduces by seeds (on average, 13.2 single-copy genotypes were found in the research plots). The present study used only four loci and five plots to analyze the genetic diversity and spread pattern of R. pseudoacacia in Lithuania. To prevent the rapid spread of this species in adjacent areas, it is recommended to ensure minimum disturbance in already-established stands and to implement artificial planting of native forest tree species and active management measures to prevent R. pseudoacacia outcompeting the autochthonous seedlings at a young age until they close the canopy.

Author Contributions

Conceptualization, S.Č. and V.S.; methodology, S.Č., R.V. and V.S.; formal analysis, R.V.; investigation, S.Č. and R.V.; resources, S.Č. and V.S.; data curation, R.V.; writing—original draft preparation, S.Č. and R.V.; writing—review and editing, S.Č., R.V. and V.S.; visualization, S.Č. and R.V.; supervision, V.S.; funding acquisition, S.Č. and V.S. All authors have read and agreed to the published version of the manuscript.

Funding

This research received no external funding.

Institutional Review Board Statement

Not applicable.

Informed Consent Statement

Not applicable.

Data Availability Statement

The raw data supporting the conclusions of this article will be made available by the authors on request.

Conflicts of Interest

The authors declare no conflicts of interest.

References

  1. Boring, L.R.; Swank, W.T. The role of black locust (Robinia pseudoacacia) in forest succession. J. Ecol. 1984, 72, 749–766. [Google Scholar] [CrossRef]
  2. Martin, G.D. Addressing geographical bias: A review of Robinia pseudoacacia (black locust) in the Southern Hemisphere. S. Afr. J. Bot. 2019, 125, 481–492. [Google Scholar] [CrossRef]
  3. Richardson, D.M.; Rejmánek, M. Trees and shrubs as invasive alien species—A global review. Divers. Distrib. 2011, 17, 788–809. [Google Scholar] [CrossRef]
  4. Rumlerová, Z.; Vilà, M.; Pergl, J.; Nentwig, W.; Pyšek, P. Scoring environmental and socioeconomic impacts of alien plants invasive in Europe. Biol. Invasion 2016, 18, 3697–3711. [Google Scholar] [CrossRef]
  5. Roy, D.; Alderman, D.; Anastasiu, P.; Arianoutsou, M.; Augustin, S.; Bacher, S.; Basnou, C.; Beisel, J.; Bertolino, S.; Bonesi, L.; et al. DAISIE—Inventory of Alien Invasive Species in Europe. Version 1.6. Research Institute for Nature and Forest (INBO). 2019. Available online: https://doi.org/10.15468/ybwd3x (accessed on 24 February 2025). [CrossRef]
  6. Rédei, K.; Csiha, I.; Keserű, Z.; Rásó, J.; Kamandiné, V.Á.; Antal, B. Growth and yield of black locust (Robinia pseudoacacia L.) stands in Nyírség Growing Region (North-East Hungary). South-East Eur. For. SEEFOR 2014, 5, 13–22. [Google Scholar] [CrossRef]
  7. Wilkaniec, A.; Borowiak-Sobkowiak, B.; Irzykowska, L.; Breś, W.; Świerk, D.; Pardela, Ł.; Wielgus, K. Biotic and abiotic factors causing the collapse of Robinia pseudoacacia L. veteran trees in urban environments. PLoS ONE 2021, 16, e0245398. [Google Scholar] [CrossRef]
  8. Vitkova, M.; Mullerova, M.; Sadlo, J.; Pergl, J.; Pyšek, P. Black locust (Robinia pseudoacacia) beloved and despised: A story of an invasive tree in Central Europe. For. Ecol. Manag. 2017, 384, 287–302. [Google Scholar] [CrossRef]
  9. Ciuvăt, A.L.; Abrudan, I.V.; Ciuvăt, C.G.; Marcu, C.; Lorent, A.; Dincăa, L.; Szilard, B. Black locust (Robinia pseudoacacia L.) in Romanian Forestry. Diversity 2022, 14, 780. [Google Scholar] [CrossRef]
  10. Ivinskis, P.; Rimšaitė, J. Records of Phyllonorycter robiniella (Clemens, 1859) and Parectopa robiniella Clemens, 1863 (Lepidoptera, Gracillariidae) in Lithuania. Acta Zool. Litu. 2008, 18, 130–133. [Google Scholar] [CrossRef]
  11. Cierjacks, A.; Kowarik, I.; Joshi, J.; Hempel, S.; Ristow, M.; von der Lippe, M.; Weber, E. Biological flora of the British Isles: Robinia pseudoacacia. J. Ecol. 2013, 101, 1623–1640. [Google Scholar] [CrossRef]
  12. Środek, D.; Rahmonov, O. The Properties of Black Locust Robinia pseudoacacia L. to Selectively Accumulate Chemical Elements from Soils of Ecologically Transformed Areas. Forests 2022, 13, 7. [Google Scholar] [CrossRef]
  13. Redei, K.; Bujtas, Z.O.; Veperdi, I. Black locust (Robinia pseudoacacia L.) improvement in Hungary: A review. Acta Silv. Lign. Hung. 2008, 4, 127–132. [Google Scholar] [CrossRef]
  14. Saulino, L.; Rita, A.; Stinca, A.; Liuzzi, G.; Silvestro, R.; Rossi, S.; Saracino, A. Wildfire promotes the invasion of Robinia pseudoacacia in the unmanaged Mediterranean Castanea savita coppice forests. Fire For. 2023, 6, 1177551. [Google Scholar] [CrossRef]
  15. De Marco, A.; Napoletano, P.; Panico, S.C.; Memoli, V.; Santorufo, L.; Rugiero, A.G. Combined effect of black locust invasion and fire on soils of Mediterranean shrublands and pine forests. Catena 2023, 220, 106656. [Google Scholar] [CrossRef]
  16. Jung, S.C.; Matsushita, N.; Wu, B.Y.; Kondo, N.; Shiraishi, A.; Hogetsu, T. Reproduction of a Robinia pseudoacacia population in a coastal Pinus thunbergii windbreak along the Kujukurihama Coast, Japan. J. For. Res. 2009, 14, 101–110. [Google Scholar] [CrossRef]
  17. Kurokochi, H.; Toyama, K.; Hogetsu, T. Regeneration of Robinia pseudoacacia riparian forests after clear-cutting along the Chikumagawa River in Japan. Plant Ecol. 2010, 210, 31–41. [Google Scholar] [CrossRef]
  18. Kato-Noguchi, H.; Kato, M. Invasive characteristics of Robinia pseudoacacia and its impacts on species diversity. Diversity 2024, 16, 773. [Google Scholar] [CrossRef]
  19. Nadal-Sala, D.; Hartig, F.; Gracia, C.A.; Sabaté, S. Global warming likely to enhance black locust (Robinia pseudoacacia L.) growth in a Mediterranean riparian forest. For. Ecol. Manag. 2019, 449, 117448. [Google Scholar] [CrossRef]
  20. Patalauskaitė, D. Possibility of survival of Robinia pseudaccacia in decidous forest. Acta Biol. Univ. Daugavp. 2007, 7, 129–132. Available online: https://du.lv/wp-content/uploads/2022/02/Zurnals_7_2.pdf (accessed on 14 March 2025).
  21. Dyderski, M.K.; Jagodziński, A.M. Seedling survival of Prunus serotina Ehrh., Quercus rubra L. and Robinia pseudoacacia L. in temperate forests of Western Poland. For. Ecol. Manag. 2019, 450, 117498. [Google Scholar] [CrossRef]
  22. Dyderski, M.K.; Paź, S.; Frelich, L.E.; Jagodziński, A.M. How much does climate change threaten European forest tree species distributions? Glob. Change Biol. 2018, 24, 1150–1163. [Google Scholar] [CrossRef] [PubMed]
  23. Vítková, M.; Kolbek, J. Vegetation classification and synecology of Bohemian Robinia pseudacacia stands in a Central European context. Phytocoenologia 2010, 40, 205–241. [Google Scholar] [CrossRef]
  24. Kleinbauer, I.; Dullinger, S.; Peterseil, J.; Essl, F. Climate change might drive the invasive tree Robinia pseudacacia into nature reserves and endangered habitats. Biol. Conserv. 2010, 143, 382–390. [Google Scholar] [CrossRef]
  25. Šibíková, M.; Jarolímek, I.; Hegedüšová, K.; Májeková, J.; Mikulová, K.; Slabejová, D.; Medvecká, J. Effect of planting alien Robinia pseudoacacia trees on homogenization of Central European Forest vegetation. Sci. Total Environ. 2019, 687, 1164–1175. [Google Scholar] [CrossRef] [PubMed]
  26. Slabejová, D.; Bacigál, T.; Hegedüšová, K.; Májeková, J.; Medvecká, J.; Mikulová, K.; Jarolímek, I. Comparison of the understory vegetation of native forests and adjacent Robinia pseudoacacia plantations in the Carpathian-Pannonian region. For. Ecol. Manag. 2019, 439, 8–40. [Google Scholar] [CrossRef]
  27. Zhang, L.; Li, H.; Wu, C.; Linghu, G.; Zhu, H.; Khamphilavong, K.; Li, M.; Zhou, X.; Ma, G.; Kang, Y. Far-reaching effects on soil properties and underground microbial ecosystem after the introduction of black locusts in forest. Front. Ecol. Evol. 2023, 11, 1210498. [Google Scholar] [CrossRef]
  28. Wohlgemuth, T.; Gossner, M.M.; Campagnaro, T.; Marchante, H.; Van Loo, M.; Vacchiano, G.; Castro-Díez, P.; Dobrowolska, D.; Gazda, A.; Keren, S.; et al. Impact of non-native tree species in Europe on soil properties and biodiversity: A review. Neobiota 2022, 78, 45–69. [Google Scholar] [CrossRef]
  29. Campagnaro, T.; Nascimbene, J.; Tasinazzo, S.; Trentanovi, G.; Sitzia, T. Exploring patterns, drivers and structure of plant community composition in alien Robinia pseudoacacia secondary woodlands. iForest 2018, 11, 586–593. [Google Scholar] [CrossRef]
  30. Order of the Ministry of the Republic of Lithuania 2016 Nowember 28 No. D1-810 “Dėl Invazinių Lietuvoje Organizmų Rūšių Sąrašo Patvirtinimo ir dėl kai Kurių Aplinkos Ministro Įsakymų Pripažinimo Netekusiais Galios”. Available online: https://e-seimas.lrs.lt/portal/legalAct/lt/TAD/TAIS.239692/asr (accessed on 25 February 2025).
  31. Puchałka, R.; Dyderski, M.K.; Vítková, M.; Sádlo, J.; Klisz, M.; Netsvetov, M.; Jagodziński, A.M. Black locust (Robinia pseudoacacia L.) range contraction and expansion in Europe under changing climate. Glob. Change Biol. 2021, 27, 1587–1600. [Google Scholar] [CrossRef]
  32. Menkis, A.; Marčiulynas, A.; Gedminas, A.; Lynikienė, J.; Povilaitienė, A. High-Throughput sequencing reveals drastic changes in fungal communities in the phyllosphere of Norway spruce (Picea abies) following invasion of the spruce bud scale (Physokermes piceae). Microb. Ecol. 2015, 70, 904–911. [Google Scholar] [CrossRef]
  33. Lian, C.; Hogetsu, T. Development of microsatellite markers in black locust (Robinia pseudoacacia) using a dual-supression-PCR technique. Mol. Ecol. Notes 2002, 2, 211–213. [Google Scholar] [CrossRef]
  34. Kurokochi, H.; Hogetsu, T. Fine-scale initiation of non-native Robinia pseudoacacia riparian forests along the Chikumagawa River in central Japan. J. Ecol. Environ. 2014, 37, 21–29. [Google Scholar] [CrossRef]
  35. From Data to Discovery—Faster. Geneious Puts Industry-Leading Bioinformaticsw, Molecular Biology and Antibody Discovery Tools Directly into Researchers Hands, Streamlining Sequence Analysis and Insights. Available online: http://www.geneious.com (accessed on 25 March 2025).
  36. Kearse, M.; Moir, R.; Wilson, A.; Stones-Havas, S.; Cheung, M.; Sturrock, S.; Buxton, S.; Cooper, A.; Markowitz, S.; Duran, C.; et al. Geneious Basic: An integrated and extendable desktop software platform for the organization and analysis of sequence data. Bioinformatics 2012, 28, 1647–1649. [Google Scholar] [CrossRef]
  37. Gallagher, J.; Lordan, C.; Hughes, G.M.; Jonasson, J.P.; Carlsson, J. Microsatellites obtained using high throughput sequencing and a novel microsatellite genotyping method reveals population genetic structure in Norway Lobster, Nephrops norvegicus. J. Sea Res. 2022, 179, 102139. [Google Scholar] [CrossRef]
  38. Excoffier, L.; Smouse, P.E.; Quattro, J.M. Analysis of molecular variance inferred from metric distances among DNA haplotypes: Application to human mitocondrial DNA restriction sites. Genetics 1992, 131, 479–491. [Google Scholar] [CrossRef]
  39. Mengoni, A.; Bazzicalupo, M. The statistical treatment of data and the analysis of molecular variance (AMOVA) in molecular microbial ecology. Ann. Microbiol. 2002, 52, 95–101. [Google Scholar]
  40. Nei, M. Genetic distance between populations. Am. Nat. 1972, 106, 283–392. [Google Scholar] [CrossRef]
  41. Nei, M. Estimation of average heterozygosity and genetic distance from a small number of individuals. Genetics 1978, 89, 583–590. [Google Scholar] [CrossRef]
  42. Peakall, R.; Smouse, P.E. GenAlEx 6: Genetic analysis in Excel. Population genetic software for teaching and research. Mol. Ecol. Notes 2006, 6, 288–295. [Google Scholar] [CrossRef]
  43. Peakall, R.; Smouse, P.E. GenAlEx 6.5: Genetic analysis in Excel. Population genetic software for teaching and research—An update. Bioinformatics 2012, 28, 2537–2539. [Google Scholar] [CrossRef]
  44. Aoki, Y. Statistical and probabilistic bases of forensic DNA testing. J. Iwate Med. Assoc. 2002, 54, 81–94. [Google Scholar]
  45. Hammer, O.; Harper, D.A.T.; Ryan, P.D. PAST: Paleontological Statistics Software Package for Education and Data Analysis. Palaeontol. Electron. 2001, 4, 4. Available online: http://palaeo-electronica.org/2001_1/past/issue1_01.htm (accessed on 14 June 2025).
  46. Sneath, P.H.A.; Sokal, R.R. Numerical Taxonomy: The Principles and Practice of Numerical Classification; WF Freeman & Co.: San Francisco, CA, USA, 1973; 573p. [Google Scholar]
  47. Suzuki, R.; Shimodaira, H. An application of multiscale bootstrap resampling to hierarchical clustering of microarray data: How accurate are these clusters? In Proceedings of the 2004 Fifteenth International Conference on Genome Informatics, Yokohama, Japan, 13–15 December 2004; Available online: https://www.researchgate.net/publication/228851295_An_Application_of_Multiscale_Bootstrap_Resampling_to_Hierarchical_Clustering_of_Microarray_Data_How_Accurate_are_these_Clusters (accessed on 14 June 2025).
  48. Pritchard, J.K.; Stephens, M.; Donnelly, P. Inference of population structure using multilocus genotype data. Genetics 2000, 155, 945–959. [Google Scholar] [CrossRef] [PubMed]
  49. Earl, D.A.; von Holdt, B.M. STRUCTURE HARVESTER: A website and program for visualizing STRUCTURE output and implementing the Evanno method. Conserv. Genet. Resour. 2012, 4, 359–361. [Google Scholar] [CrossRef]
  50. Evanno, G.; Regnaut, S.; Goudet, J. Detecting the number of clusters of individuals using the software STRUCTURE: A simulation study. Mol. Ecol. 2005, 14, 2611–2620. [Google Scholar] [CrossRef]
  51. Szyp-Borowska, I.; Zawadzka, A.; Wojda, T.; Klisz, M. Analysis of the genetic diversity and population structures of black locust (Robinia pseudoacacia L.) stands in Poland based on simple sequence repeat markers. Folia For. Pol. 2023, 65, 187–198. [Google Scholar] [CrossRef]
  52. Surless, E.; Hamrickj, L.; Bongartenb, C. Mating systems in open-pollinated families of black locust (Robinia Pseudoacacia). Silvae Genet. 1990, 39, 35–40. [Google Scholar]
  53. Dooley, T. Lessons learned from eleven years of prescribed fire at the Albany Pine Bush Preserve. In Using fire to Control Invasive Plants: What’s New, What Works in the Northeast?—Proceedings of a Workshop; Bennett, P., Dibble, A.C., Patterson, W.A., Eds.; Urban Forestry Center: Portsmouth, NH, USA, 2003; pp. 7–10. [Google Scholar]
  54. Elliott, K.J.; Boring, L.R.; Swank, W.T. Changes in vegetation structure and diversity after grass-to-forest succession in a southern Appalachian watershed. Am. Midl. Nat. 1998, 140, 219–232. [Google Scholar] [CrossRef]
  55. Rice, S.K.; Westerman, B.; Federici, R. Impacts of the exotic, nitrogen-fixing black locust (Robinia pseudoacacia) on nitrogen-cycling in a pine–oak ecosystem. Plant Ecol. 2004, 174, 97–107. [Google Scholar] [CrossRef]
  56. Sterrett, J.P.; Chappell, W.E. The effect of auxin on suckering in black locust. Weeds 1967, 15, 323–326. [Google Scholar] [CrossRef]
  57. Böhm, C.H.; Quinkenstein, A.; Freese, D. Yield prediction of young black locust (Robinia pseudoacacia L.) plantations for woody biomass production using allometric relations. Ann. For. Res. 2011, 54, 215–227. Available online: https://www.afrjournal.org/index.php/afr/article/view/91/137 (accessed on 19 June 2025).
  58. Straker, K.C.; Quinn, L.D.; Voigt, T.B.; Lee, D.K.; Kling, G.J. Black locust as a bioenergy feedstock: A review. BioEnergy Res. 2015, 8, 1117–1135. [Google Scholar] [CrossRef]
  59. Olson, D.F. Robinia L.; locust. In Seeds of Woody Plants in the United States; Forest Service, United States Department of Agriculture: Washington, DC, USA, 1974; pp. 728–731. [Google Scholar]
  60. Roach, A.B. Black locust (Robinia pseudoacacia L.). In Silvics of Forest Trees of the United States; Fowells, H.A., Ed.; Agriculture Handbook 271; comp. U.S. Department of Agriculture: Washington, DC, USA, 1965; pp. 642–648. [Google Scholar]
  61. Petit, R.J.; Hampe, A. Some evolutionary consequences of being a tree. Annu. Rev. Ecol. Evol. Syst. 2006, 37, 187–214. [Google Scholar] [CrossRef]
  62. Guo, Q.; Cao, S.; Dong, L.; Li, X.; Zhang, J.; Zhang, Y.; Zhang, Z.; Sun, Y.; Long, C.; Fan, Y.; et al. Genetic diversity and population structure of Robinia pseudoacacia from six improved variety bases in China as revealed by simple sequence repeat markers. J. For. Res. 2022, 33, 611–621. [Google Scholar] [CrossRef]
  63. Chang, C.S.; Hamrickj, L.; Bongarten, C. Genetic structure of natural populations of black locust (Robinia pseudoacacia L.) at Coweeta, North Carolina. J. Plant Res. 1998, 111, 17–24. [Google Scholar] [CrossRef]
  64. Zhang, K.; Shen, Z.; Yang, X.; Ma, L.; Duan, J.; Li, Y. Spatial patterns in different stages of regeneration after clear-cutting of a black locust forest in central China. Forests 2019, 10, 1066. [Google Scholar] [CrossRef]
  65. Kunakh, O.; Ivanko, I.; Holoborodko, K.; Zhukov, O. A spontaneous spread of black locust (Robinia pseudoacacia L.): The importance of seed and vegetative reproduction. Folia Oecologica 2024, 51, 120–135. [Google Scholar] [CrossRef]
  66. Gyokusen, K.; Iijima, Y.; Yahata, H. Spatial distribution and morphological features of root sprouts in niseakashia (Robinia pseudoacacia) growing under a coastal black pine forest. Bull. Kyushu Univ. For. 1991, 54, 13–28. [Google Scholar]
  67. Negreros-Castillo, P.; Hall, R.B. Sprouting capability of 17 tropical tree species after overstory removal in Quintana Roo, Mexico. For. Ecol. Manag. 2000, 126, 399–403. [Google Scholar] [CrossRef]
  68. Keim, R.F.; Chambers, J.L.; Hughes, M.S.; Dimov, L.D.; Conner, W.H.; Shaffer, G.P.; Gardiner, E.S.; Day, J.W. Long-term success of stump sprouts in high-graded baldcypress–water tupelo swamps in the Mississippi delta. For. Ecol. Manag. 2006, 234, 24–33. [Google Scholar] [CrossRef]
  69. Guo, Q.; Li, X.Y.; Yang, S.H.; Yang, Z.H.; Sun, Y.H.; Zhang, J.T.; Cao, S.; Dong, L.; Uddin, S.; Li, Y. Evaluation of the genetic diversity and differentiation of black locust (Robinia pseudoacacia L.) based on genomic and expressed sequence tag-simple sequence repeats. Int. J. Mol. Sci. 2018, 19, 2492. [Google Scholar] [CrossRef] [PubMed]
  70. Von der Lippe, M.; Kowarik, I. Do cities export biodiversity? Traffic as dispersal vector across urban-rural gradients. Divers. Distrib. 2008, 14, 8–25. [Google Scholar] [CrossRef]
Figure 1. Route map of R. pseudoacacia stands investigated in this study. The numbers designate sampling sites (1–4 indicate the Dubrava branch of SFE and 5 the Kretinga branch of SFE).
Applbiosci 04 00033 g001
Figure 2. R. pseudoacacia genotype distribution in investigated sample plots (different genotype groups found in the plot are marked with different signs (genets), while single-copy unique genotypes are marked with green hexagons (other)).
Applbiosci 04 00033 g002aApplbiosci 04 00033 g002b
Figure 3. Nei genetic distance dendrogram of five Robinia pseudoacacia plots (the UPGMA grouping method and pairwise algorithm as well as the Euclidean distance similarity measurement (boot n = 1000) were used).
Applbiosci 04 00033 g003
Table 1. Robinia pseudoacacia SSR loci used in this study and their characteristics.
LocusPrimer SequenceFluorescent
Label
Repeat MotifFragment Size in bp
Rops 02F: CAGAACTGTGGAGAATAATTCTGAACCG6-Fam(AC)13(AT)4102–138
R: CGCCATCTGTTAGTTTGTTGC
Rops 05F: TGGTGATTAAGTCGCAAGGTGNed(AC)2GC(AC)7114–146
R: GTTGTGACTTGTACGTAAGTC
Rops 06F: CTAAGGAGGTGCTGACCCTCPet(GT)3ACA(GT)11112–146
R: TTAATCTGTGATGGGACACTG
Rops 08F: TTCTGAGGAAGGGTTCCGTGGVic(CA)8TA(CA)3190–206
R: GTTAAAGCAACAGGCACATGG
Table 2. Genetic diversity parameters calculated for Robinia pseudoacacia plots.
PlotNNaNeHoHeF
Vaišvydava 1998.75 ± 1.114.16 ± 0.790.80 ± 0.100.72 ± 0.06−0.09 ± 0.06
Vaišvydava 2496.00 ± 0.822.90 ± 0.250.80 ± 0.090.65 ± 0.03−0.23 ± 0.15
Vaišvydava 3766.00 ± 0.713.19 ± 0.170.92 ± 0.030.68 ± 0.02−0.35 ± 0.08
Vaišvydava 4457.00 ± 0.414.07 ± 0.260.86 ± 0.050.75 ± 0.02−0.14 ± 0.05
Juodkrantė 51106.75 ± 0.753.96 ± 0.340.78 ± 0.130.74 ± 0.02−0.03 ± 0.15
In total75.8 ± 6.06.9 ± 0.393.66 ± 0.210.83 ± 0.040.71 ± 0.02−0.17 ± 0.05
N—number of individuals; Na—number of different alleles; Ne—number of effective alleles; Ho—observed heterozygosity; He—expected heterozygosity; F—fixation index. All parameters are given with their standard error values.
Table 3. Number of genotypes, single-copy genes, and the average gene size in Robinia pseudoacacia plots.
PlotPlot Size,
ha
No. of
Individuals
No. of Unique GenotypesNo. of
Genets with Only One Ramet
Proportion of Clonal Plants in the Plot %Average Gene Size
Vaišvydava 15.5994529704.37
Vaišvydava 21.0492111773.8
Vaišvydava 31.0761149410.28
Vaišvydava 41.0452314683.44
Juodkrantė 53.0110198929.27
In total11.537911966835.9
Table 4. Nei genetic distances (lower part of the table) and FST values (upper part of the table) between pairs of investigated Robinia pseudoacacia populations in Lithuania (in brackets are FST values calculated using a data set reduced to one copy of each genotype).
Vaišvydava 1-0.181 ***
(0.135 ***)
0.190 ***
(0.096 ***)
0.109 *** (0.057 ***)0.132 *** (0.075 ***)
Vaišvydava 20.705-0.180 ***
(0.031 *)
0.180 *** (0.129 ***)0.167 *** (0.116 ***)
Vaišvydava 30.8460.604-0.133 *** (0.070 ***)0.153 *** (0.053 **)
Vaišvydava 40.4540.7500.512-0.139 *** (0.091 ***)
Juodkrantė 50.5690.6570.6240.694-
PlotVaišvydava 1Vaišvydava 2Vaišvydava 3Vaišvydava 4Juodkrantė 5
Significance of Fst coefficient values * p < 0.05; ** p < 0.01; *** p < 0.001.
Table 5. Results of multilocus AMOVA genetic analysis for Robinia pseudoacacia (data in brackets are AMOVA results with the reduced data set).
Source of VariationDegrees of Freedom (df)Sum of SquaresComponents of VariationPercentage of DiversityFixation Indexp Value
Among research plots4 (4)160.478 (33.376)0.264 (0.154)14% (9%)0.155
(0.091)
0.001
(0.001)
Within research plots379 (119)623.5 (193)1.645 (1.622)86% (91%)--
Total383 (123)783.977 (226.376)1.909 (1.775)100% (100%)--
Disclaimer/Publisher’s Note: The statements, opinions and data contained in all publications are solely those of the individual author(s) and contributor(s) and not of MDPI and/or the editor(s). MDPI and/or the editor(s) disclaim responsibility for any injury to people or property resulting from any ideas, methods, instructions or products referred to in the content.

