Article

Multi-Sensor Comparison for Nutritional Diagnosis in Olive Plants: A Machine Learning Approach

by
Catarina Manuelito
1,*,
João de Deus
2,
Miguel Damásio
2,3,
André Leitão
4,
Luís Alcino Conceição
5,
Rocío Arias-Calderón
6,
Carla Inês
1,
António Manuel Cordeiro
1,
Eduardo Fernandes
4,
Luís Albino
4,
Miguel Barbosa
4,
Filipe Fonseca
4 and
José Silvestre
2,7
1
INIAV I.P., Instituto Nacional de Investigação Agrária e Veterinária, Polo de Elvas, Estrada de Gil Vaz, Apartado 6, 7351-901 Elvas, Portugal
2
INIAV I.P., Instituto Nacional de Investigação Agrária e Veterinária, Polo de Inovação de Dois Portos, Quinta da Almoinha, 2565-191 Dois Portos, Portugal
3
GI-1716, Proyectos y Planificación, Departamento Ingeniería Agroforestal, Escola Politécnica Superior de Enxeñaría, Universidade de Santiago de Compostela, Rúa Benigno Ledo s/n, 27002 Lugo, Spain
4
SISCOG SA, Sistemas Cognitivos, Campo Grande, 378-3º, 1700-097 Lisboa, Portugal
5
VALORIZA—Research Center for Endogenous Resource Valorization, Polytechnic Institute of Portalegre, 7300-110 Portalegre, Portugal
6
Institute for Regional Development (IDR), Agroforestry and Cartography Precision, Castilla-La Mancha University, Campus Universitario s/n, 02071 Albacete, Spain
7
GREEN-IT Bioresources4sustainability, ITQB NOVA, Av. da República, 2780-157 Oeiras, Portugal
*
Author to whom correspondence should be addressed.
Appl. Biosci. 2025, 4(3), 32; https://doi.org/10.3390/applbiosci4030032
Submission received: 27 February 2025 / Revised: 20 May 2025 / Accepted: 18 June 2025 / Published: 2 July 2025

Abstract

The intensification of olive growing has raised environmental concerns, particularly regarding nutrient loss from excessive fertiliser use. In line with the European Union’s Farm to Fork strategy, which aims to halve the soil nutrient losses by 2030, this study evaluates the effectiveness of two sensor-based approaches—proximal sensing with a FLAME spectrometer and remote sensing via UAV-mounted multispectral imaging—compared with foliar chemical analyses as the reference standard, for diagnosing the nutritional status of olive trees. The research was conducted in Elvas, Portugal, between 2022 and 2023, across three olive cultivars (‘Azeiteira’, ‘Arbequina’, and ‘Koroneiki’) subjected to different fertilisation regimes. Machine learning (ML) models showed strong correlations between sensor data and nutrient levels: the multispectral sensor performed best for phosphorus (P) (determination coefficient [ R 2 ] = 0.75) and potassium (K) ( R 2 = 0.73), while the FLAME spectrometer was more accurate for nitrogen (N) ( R 2 = 0.64). These findings underscore the potential of sensor-based technologies for non-destructive, real-time nutrient monitoring, with each sensor offering specific strengths depending on the target nutrient. This work contributes to more sustainable and data-driven fertilisation strategies in precision agriculture.

1. Introduction

In Europe, olive groves cover approximately six million hectares, with Spain, Italy, Greece, and Portugal being the leading producers [1]. In Portugal, olive cultivation holds significant agricultural, economic, and cultural importance. It represents a major component of the country’s agricultural production, particularly in the Alentejo region, where modern irrigation systems, such as the Alqueva project, have supported the expansion of intensive and super-intensive olive groves, occupying around 61% of this irrigation perimeter, equivalent to 68 659 ha [2]. Portugal ranks among the top global producers of olive oil, which is a vital export that supports rural economies and generates employment across the value chain—from cultivation to processing and distribution. Beyond its economic role, olive trees are well suited to the Mediterranean climate and poor soils, thriving in semi-arid regions where other crops may struggle. Culturally, olive production is deeply embedded in Portuguese heritage, with centuries-old traditions and several olive oils that hold a Protected Designation of Origin (PDO) status. Environmentally, olive trees are relatively drought-resistant and contribute to sustainable farming practices through low water demands and potential carbon sequestration, making them valuable in the context of climate change and ecological preservation, with relatively low phytosanitary requirements [2].
Olive production in Portugal, while economically and culturally vital, faces several key challenges that threaten its sustainability and long-term productivity. The intensification of olive cultivation, particularly through high-density hedge systems, has raised significant environmental concerns. Excessive or inappropriate use of mineral fertilisers contributes to ecosystem pollution and degrades soil and water quality [3,4]. Despite being essential for ensuring competitive yields, fertilisation strategies must consider soil and foliar analyses and align with the crop’s phenological stages to ensure nutrient efficiency and reduce environmental risks [3]. Considering the heterogeneity of olive groves, the adoption of site-specific fertilisation strategies, such as variable rate application (VRT), can improve resource efficiency and promote environmental sustainability [5], as over-fertilisation compromises soil structure and microbiological function and contributes to nutrient leaching and eutrophication of water bodies [6]. Soil plays a fundamental role in sustaining life and ecosystem functions, with its health being essential for biodiversity and sustainable agriculture. Although modern agriculture heavily depends on chemical fertilisers (nitrogen [N], phosphorus [P], and potassium [K]) to increase crop productivity and soil fertility, its overuse leads to a decrease in soil organic matter and pollution, degrading soil quality, suppressing microbial activity, and harming overall environmental health. Long-term use of chemical fertilisers alters soil properties, shifts pH, encourages pests, and increases greenhouse gas emissions, ultimately threatening soil biodiversity and ecosystem well-being [7]. Climatic variability, particularly drought and irregular precipitation, has a direct impact on yields, notably in southern regions, such as Alentejo, where irrigation is indispensable. Additional pressures include soil nutrient depletion, biotic stresses (e.g., Bactrocera oleae and fungal pathogens), rising costs of agricultural inputs, and compliance with evolving environmental regulations, such as the EU’s Farm to Fork strategy. These challenges underscore the urgent need for the adoption of more precise, efficient, and sustainable management practices in the sector, hence the importance of promoting Precision Agriculture to address these challenges [8,9].
Technological advances are transforming agriculture by providing accurate data for improved management and decision-making. These technologies help to understand soil type, optimise water use, manage nutrients and protect crops from pests and diseases. Remote sensing, artificial intelligence and machine learning (ML) are particularly valuable for early detection and prediction of pest outbreaks, enabling targeted, sustainable pest management that reduces reliance on pesticides and minimises environmental impact. Despite challenges with data quality and access to technology, the integration of these tools has the potential to increase agricultural resilience and sustainability [10]. In recent years, ML techniques have significantly impacted the development of agricultural decision support systems. These techniques make use of multi-source data to create models that provide valuable agricultural insights, estimate or classify essential plant status indicators, and predict crop outputs. Some examples of applications, as reviewed by Benos et al. [11], include stress physiology [12], stress phenotyping [13], plant identification [14], plant system biology [15], plant breeding [16], plant genetic engineering [17], pathogen identification [18] and in vitro culture [19].
Fertilisation, although being extremely important, represents a high percentage of the crop production costs [20]. Given this cost constraint, precision fertilisation management for olive growing aims to develop crop monitoring tools that allow immediate diagnosis, shifting from parcel-level analysis to targeted monitoring throughout the crop cycle [21]. The first studies that evaluated the use of remote sensing in quantifying stress derived from N content were based on empirical relationships with spectral indices sensitive to chlorophyll content [22]. In 2017, Martínez M [23]’s analysis of leaf N, P, and K content in various crops showed a strong correlation with spectral indices derived from both the spectrometer and satellite images, especially in indices involving the red band. In contrast to N, research into the development of non-invasive methods for determining the P and K content in leaves is scarce, underscoring the need for additional research. However, studies conducted under controlled laboratory conditions using leaf-scale analysis have shown that non-invasive methods, such as hyperspectral imaging and chemometric modelling, can accurately predict P and K levels in plant tissues. These findings highlight the strong potential of advanced sensing techniques for precise macronutrient monitoring, eliminating the need for destructive sampling [24,25].
A wide range of sensors is being used for the sustainable management of fertilisation. Roma et al. [6] developed a methodology on a GIS platform, using GEOBIA algorithms fed by spectral data collected with a multispectral camera mounted on an unmanned aerial vehicle (UAV), to construct prescription maps for variable rate N fertiliser application in an olive grove, and they managed to reduce the application of N fertiliser by around 31%. Brambilla et al. [26] applied a low-cost RGB sensor to assess the nutritional status of basil, and the results demonstrated that the sensor effectively tracked plant development in response to varying N application rates (0, 2.5 mM and 10 mM N with different NO3/NH4+ ratios), showing a clear correlation between the sensor readings and the different levels of N applied. Chungcharoen et al. [27] applied ML to determine the nutritional status in oil palm leaves using proximal multispectral images and provided statistically significant predictions for chlorophyll and macronutrient levels (N and K) in leaves. Using drone images of a wheat field, Lysenko et al. [28] obtained a strong relationship between the colour intensity of wheat leaves and N content. Also, for the estimation of the N nutritional index in a rice crop, Qiu et al. [29] achieved a determination coefficient ( R 2 ) circa 0.9, by combining the random forest regression method with vegetative indices extracted from RGB images from a drone, while Zha et al. [30] achieved a R 2 value of up to 0.79 using multispectral data. By extending the estimation to more nutrients, Noguera et al. [5] estimated the quantity of the primary macronutrients using neural networks applied to images of an olive grove, obtained using a multispectral camera attached to a drone, and achieved an R 2 value of 0.63 for N, 0.89 for P, and 0.93 for K.
The aim of this work was (i) to validate the data collected with both a proximal sensor (FLAME spectrometer) and a remote detection sensor (multispectral) assembled to a UAV, using as reference the ground-truth data from foliar chemical analyses of the olive grove, and (ii) to use ML techniques to assess the nutritional status of olive trees, minimising reliance on time-consuming, invasive methods.

2. Materials and Methods

2.1. Experimental Design

The experimental trial was conducted in a 2.77-hectare hedgerow olive grove oriented southwest–northeast, located at Herdade do Reguengo (INIAV I.P.) in Elvas (Alentejo, Portugal), which has a Mediterranean “Csa” climate—hot, dry summers and cold winters. Between 1971 and 2000, the region averaged 535 mm of annual precipitation, 70% relative humidity, and a mean temperature of 16.3 °C [31]. The hedge olive grove was established on “Aac” soils, characterised as “Inceptisols - Modern Alluviosols, Limestone (Para-Limestone Soils) with heavy texture,” and “Ac” soils, described as “Inceptisols-Modern Alluviosols, Limestone (Para-Limestone Soils) with medium texture” [32]. The experimental field was planted in 2004, featuring two different planting spacings: C1 (3.75 m × 1.80 m) and C2 (3.75 m × 1.35 m). The irrigation system consists of localised drip irrigation, with a flow rate of 2.2 L ha−1 and a spacing of 1 m between emitters. Deficit irrigation was applied, with an annual irrigation depth of 1000 m3 ha−1, along with fertigation. In this trial, three different fertiliser application treatments were implemented in each spacing, namely No Fertilising Application (T0a) and Over-Recommended Fertilising (T2) in C1, and No Fertilising Application (T0b) and Recommended Fertilising (T1) in C2. T1 corresponded to fertilisation levels suited for an expected yield of 6–8 tonnes ha−1, which according to Veloso et al. [33], was 80–100 kg of N per ha, 30–40 kg of P2O5 per ha and 60–90 kg of K2O per ha. Table 1 presents the nutrient-specific fertiliser applications conducted in 2022 and 2023.
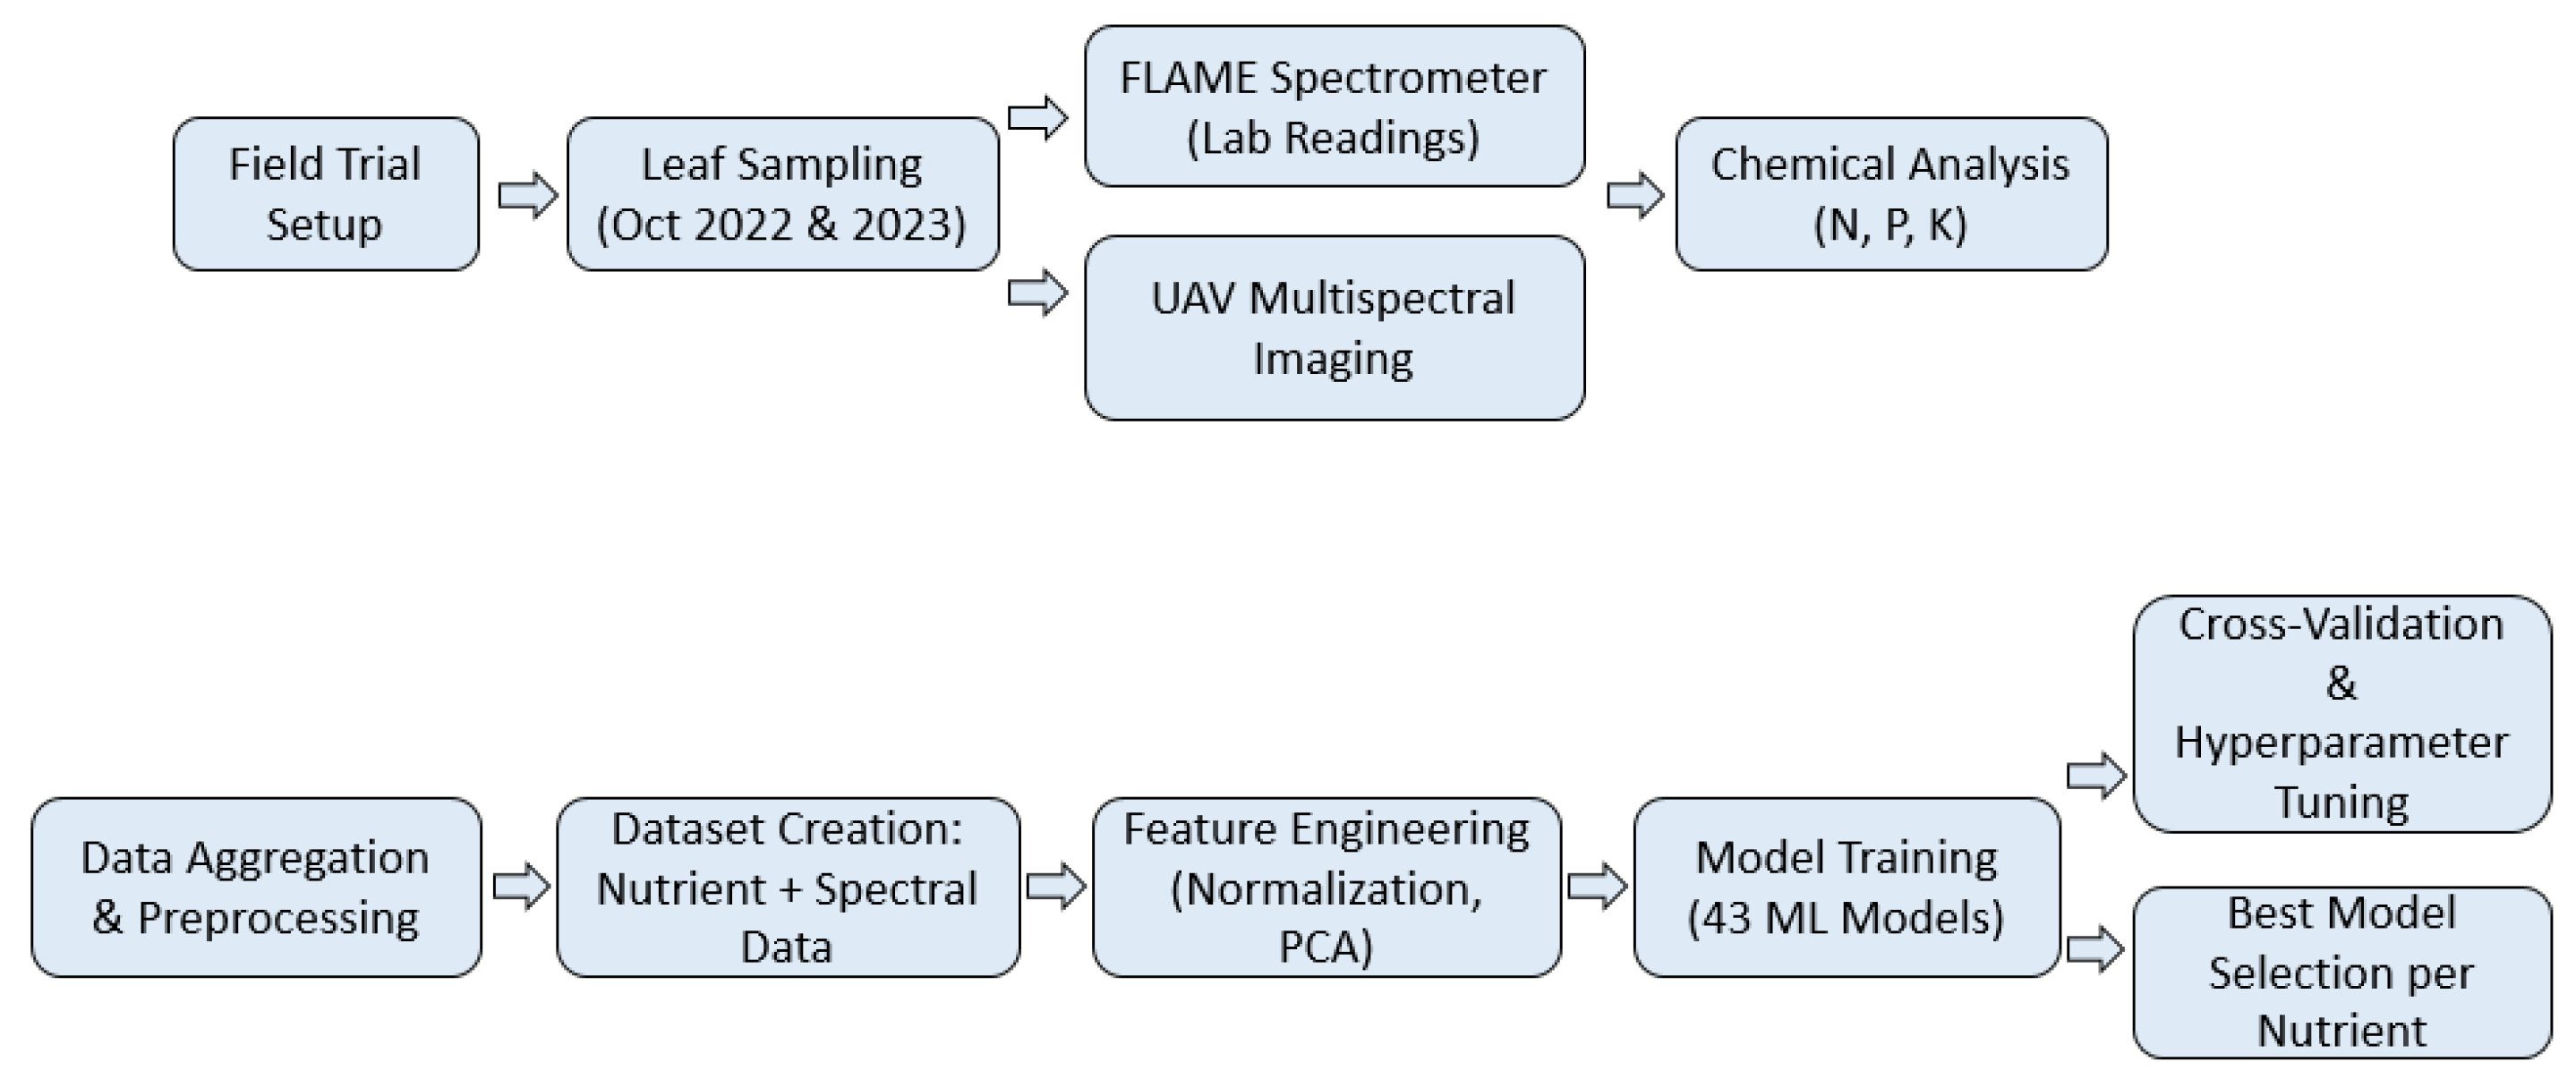
To provide a clearer overview of the experimental design and procedures, a flowchart summarising the overall methodology is presented in Figure 1.
Three olive cultivars were selected for this study: the Portuguese ‘Azeiteira’, due to its agronomic relevance and evaluation in hedge systems, and the widely used ‘Arbequina’ (Spanish) and ‘Koroneiki’ (Greek), both common in Portuguese hedge groves. A long-term evaluation of olive cultivars in a super high-density orchard under cold climate conditions [34] found that ‘Koroneiki’ has the highest growth rate, a narrow hedge architecture, and high productivity in both fruit and oil. ‘Arbequina’ and ‘Koroneiki’ are both vigorous cultivars known for their high productivity. In contrast, ‘Azeiteira’ has a wide hedgerow architecture and is not recommended for hedgerow planting due to high production alternation, low yield, and susceptibility to damage during mechanical harvesting. The trial included 10 blocks per treatment, spacing, and cultivar, with each block consisting of two trees. Each cultivar is represented by three rows, with two treatments installed in each row. Border rows were not included, and only the centre row was considered.

2.2. Field Plant Material Collection

Leaves were sampled from the middle third of the current year’s growth in October 2022 and October 2023, following the methodology of Veloso et al. [33], when the olive trees were at principal growth stage 8 (fruit maturity), as defined by the BBCH scale adapted by Sanz-Cortés et al. [35]. For each block, 120 leaves were collected—30 from each side of the hedge per tree, totalling 60 leaves per tree. The collected leaves were placed in appropriately labelled bags and immediately transported to the laboratory, where sensor readings were performed.

2.3. Sensor Readings

For the leaf reflectance evaluation, two types of sensors were used: a multispectral five-band camera (MicaSense RedEdge-MX, AgEagle Aerial Systems Inc., Wichita, KS, USA) and a high-resolution spectrometry sensor from Ocean Insight (FLAME-T-XR1).

2.3.1. The High-Resolution Sensor

The high-resolution sensor covers a spectral range from 200 to 1025 nm (Ocean Optics, 2015). For spectral data acquisition, 10 leaves were randomly selected from the 120 leaves collected per block, and measurements were performed on individual leaves. Three readings were taken per leaf—near the petiole, at the centre, and at the apex—to ensure representative coverage. OceanART (OceanART v1.0.1, Ocean Optics Inc., Orlando, FL, USA) software was used to operate this sensor, along with a light source (AvaLight-Hal), the fibre (QR 400–7–SR–BX), the specular reflectance standard (WS-1) for spectrometer calibration upon startup, and the reflection probe holder (RPH-1).

2.3.2. Multispectral Sensor

Multispectral imagery of the UAV was performed with a five-band multispectral camera (MicaSense RedEdge-MX, AgEagle Aerial Systems Inc., Wichita, KS, USA) installed on a gimbal at the bottom of the UAV (HEIFU®, Beyond Vision, Lisboa, Portugal ). The camera captures images in five spectral bands—blue, green, red, red edge, and near-infrared—with 12-bit resolution per channel and a global shutter synchronised across all bands.
The ambient light and sun angle were measured continuously within the flight with a MicaSense Downwelling Light Sensor (DLS 2, AgEagle Aerial Systems Inc., Wichita, KS, USA), which includes an integrated GPS, connected to the multispectral camera and coupled to the UAV.
Two flights were performed, the first in October 2022 and the second in October 2023. They were pre-programmed to cover the entire field of the study at an altitude of 45 m, at a velocity of 7.3 m s−1, and with a photointerval of 1 s, which produced 1037 images per flight, with 3.1 cm pixel−1 and 75 % overlap.
The multispectral images were processed using ArcGIS Drone2Map (version 2023.1.0), from which the orthophotos were created (one orthophoto for each flight). Orthophotos were then processed with ArcGIS PRO (version 2.2.4).

2.4. Chemical Analysis Preparation and Testing

After completion of the readings with the respective sensors, the plant material was prepared for further chemical analysis. For this purpose, the methodology described by Silva et al. [36], Carmo et al. [37], Faquin [38] and da Silva [39], subsequently cited by Galeriani et al. [40], was applied to prevent contamination of the plant material samples with dust and/or spray residues. Subsequently, the samples were sent to the laboratory, where chemical analyses (N, P, and K) were performed. N (%) was evaluated using the Kjeldahl method [41], and P (%) and K (%) were evaluated using the ICP-OES method [42].

2.5. Machine Learning Methodology

In our modelling approach, we considered leaf nutrient contents as the target variables, whereas spectral reflectance and olive cultivar were the predictor variables. We applied various combinations of feature engineering methods; for each data transformation, multiple ML regression models were trained on those data to each nutrient independently (N, P, and K). The evaluation process was conducted in three steps, detailed in Section 2.5.5.

2.5.1. Dataset Cleansing

The creation of the dataset for the ML models involved gathering the following information:
  • Plant description (olive cultivar, fertilising treatment, planting spacing);
  • Spectral reflectance (multispectral and spectrometer);
  • Year;
  • Leaf nutrient content for N, P, and K.
The wavelengths from the spectrometer data ranged from 192.7 nm to 1039.8 nm with 3646 bands. However, after analysing the dataset, both spectrum extremes showed high variance between samples, which could be explained by the noise captured by the instrument at lower and higher frequencies. Therefore, for all bands, the outliers were removed. These outliers were defined according to the following thresholds: data with a variance higher than 1000, which included 4.416%, or 161 bands of the dataset, preserving all bands from 197,445 nm to 1010.667 nm. This approach also proved useful to the performance of the principal component analysis (PCA) conducted in the later stages, as the method would assign greater weight to wavelengths with higher variance.
Aggregated multiple-instance regression was employed due to the numerous instances of spectral reflectance data for each laboratory result. Arithmetic averaging was performed on each band and vegetation index for spectrometer and multispectral data. This resulted in two tables, one per spectral instrument, containing a row for each block specifying the average reflectance across all bands. Multispectral data provided reflectance averaged over 100 points on each band for each leaf analysed. In contrast, spectrometer data provided reflectance values of the 3485 bands for the ten leaves from each block taken to the laboratory, totalling an average of 10 measures on each wavelength.
The final dataset combined the aforementioned spectral data with nutritional status, olive cultivar, and year, although the latter was not used as an input variable for training the ML models but rather to group blocks. Each block, comprising nutritional status and spectral reflectance measured in years, was assigned to either the train or test set. Furthermore, the dataset was partitioned based on the olive cultivar in a balanced manner, where approximately 75% of each olive cultivar was assigned to the train set and 25% to the test set, with an additional constraint to ensure that the test set’s leaf content of N, P, and K fell within the range of the train set. This approach ensured that both sets had similar distributions and allowed the collected data to be more representative. Overall, our dataset was structured as follows:
  • A total of 175 samples for the train set: 59 samples of ’Azeiteira’, 59 samples of ’Arbequina’, and 57 samples of ’Koroneiki’.
  • A total of 58 samples for the test set: 20 of ’Azeiteira’, 20 of ’Arbequina’, and 18 of ’Koroneiki’.

2.5.2. Feature Engineering

Several combinations of non-supervised data pre-processing methods [43] were also tested for each ML model, following a grid search strategy comprising the following:
  • Normalisation: Min–max scaling, where each feature is rescaled to make the minimum and maximum values 0 and 1, respectively. Standard scaling, where the data are rescaled to mean 0 and standard deviation 1. Row normalisation, where each row is scaled to add up to one.
  • PCA and singular value decomposition (SVD) for feature transformation and dimensionality reduction.
  • Feature discretisation to partition continuous features into 10 equally distributed width bins.
Spectrometer data underwent a stricter selection of pre-processing methods due to its high dimensionality. Consequently, PCA was always applied to maintain equal variance across all variables. Moreover, since features with larger scales may dominate the PCA, we firstly ensured that all reflectances contribute equally to the analysis, either by using the standard scaling or by applying a whitening transformation. Concerning multispectral data, PCA was an optional step as the dimensionality was much smaller and therefore easier to interpret.

2.5.3. Evaluation Methodology

As previously mentioned, our objective in the modelling approach was to predict leaf nutrient content, which posed a supervised regression problem. As a result, we evaluated most of the regression models in the Scikit-learn library, 43 in total, to attain a comprehensive understanding of which off-the-shelf models perform best in predicting N, P, and K.
This methodology ensured an unbiased starting point for all models, combined with pre-processing techniques, ranging from standard linear models and support vector machines to artificial neural networks and ensemble models.
In terms of model evaluation, R 2 (Equation (1)) was the primary metric used to compare and evaluate the models. It is unit-independent, robust to poor fits, and assesses the extent to which the model successfully reproduces the response variable. Nonetheless, several other metrics for regression tasks were also measured for analysis and validation purposes, such as mean absolute error (MAE) (Equation (2)), reported in a percentage as per the units presented in Section 2.4.
R 2 = 1 i = 1 n y i y ^ i 2 i = 1 n y i y ¯ 2
M A E = 1 n i = 1 n y i y ^ i
where y i is the observed value for the sample i, y ^ i is the predicted value for the i-th sample, y ¯ is the average of the observed data, and n is the number of samples.

2.5.4. Vegetation Indices

Vegetation indices are mathematical combinations of spectral bands used to assess plant health, vigour, and biomass, and they are widely applied in agriculture for crop monitoring, yield prediction, and soil condition analysis. The vegetation indices used were the Normalised Difference Vegetation Index (NDVI) [44] (Equation (3)), Soil-Adjusted Vegetation Index (SAVI) [45] (Equation (4)), Green Index (GI) [46] (Equation (5)), Renormalised Difference Vegetation Index (RDVI) [47] (Equation (6)), Optimised Soil-Adjusted Vegetation Index (OSAVI) [47] (Equation (7)), Modified Soil-Adjusted Vegetation Index (MSAVI) [45] (Equation (8)), Difference Vegetation Index (DVI) [48] (Equation (9)), Green Normalised Difference Vegetation Index (GNDVI) [48] (Equation (10)), and Green Vegetation Index (GVI) [49] (Equation (11)).
N D V I = N I R R e d N I R + R e d
S A V I = N I R R e d N I R + R e d + L ( 1 + L )
G I = G r e e n R e d
R D V I = N I R R e d N I R + R e d
O S A V I = N I R R e d N I R + R e d + Y ( 1 + Y )
M S A V I = 2 N I R + 1 ( 2 N I R + 1 ) 2 8 ( N I R R e d ) 2
D V I = N I R R e d
G N D V I = N I R G r e e n N I R + G r e e n
G V I = N I R G r e e n
where Green, Red and NIR are the values of each corresponding band, and L and Y are soil adjustment factors: L = 0.5 and Y = 0.16 in this study.

2.5.5. Machine Learning Workflow

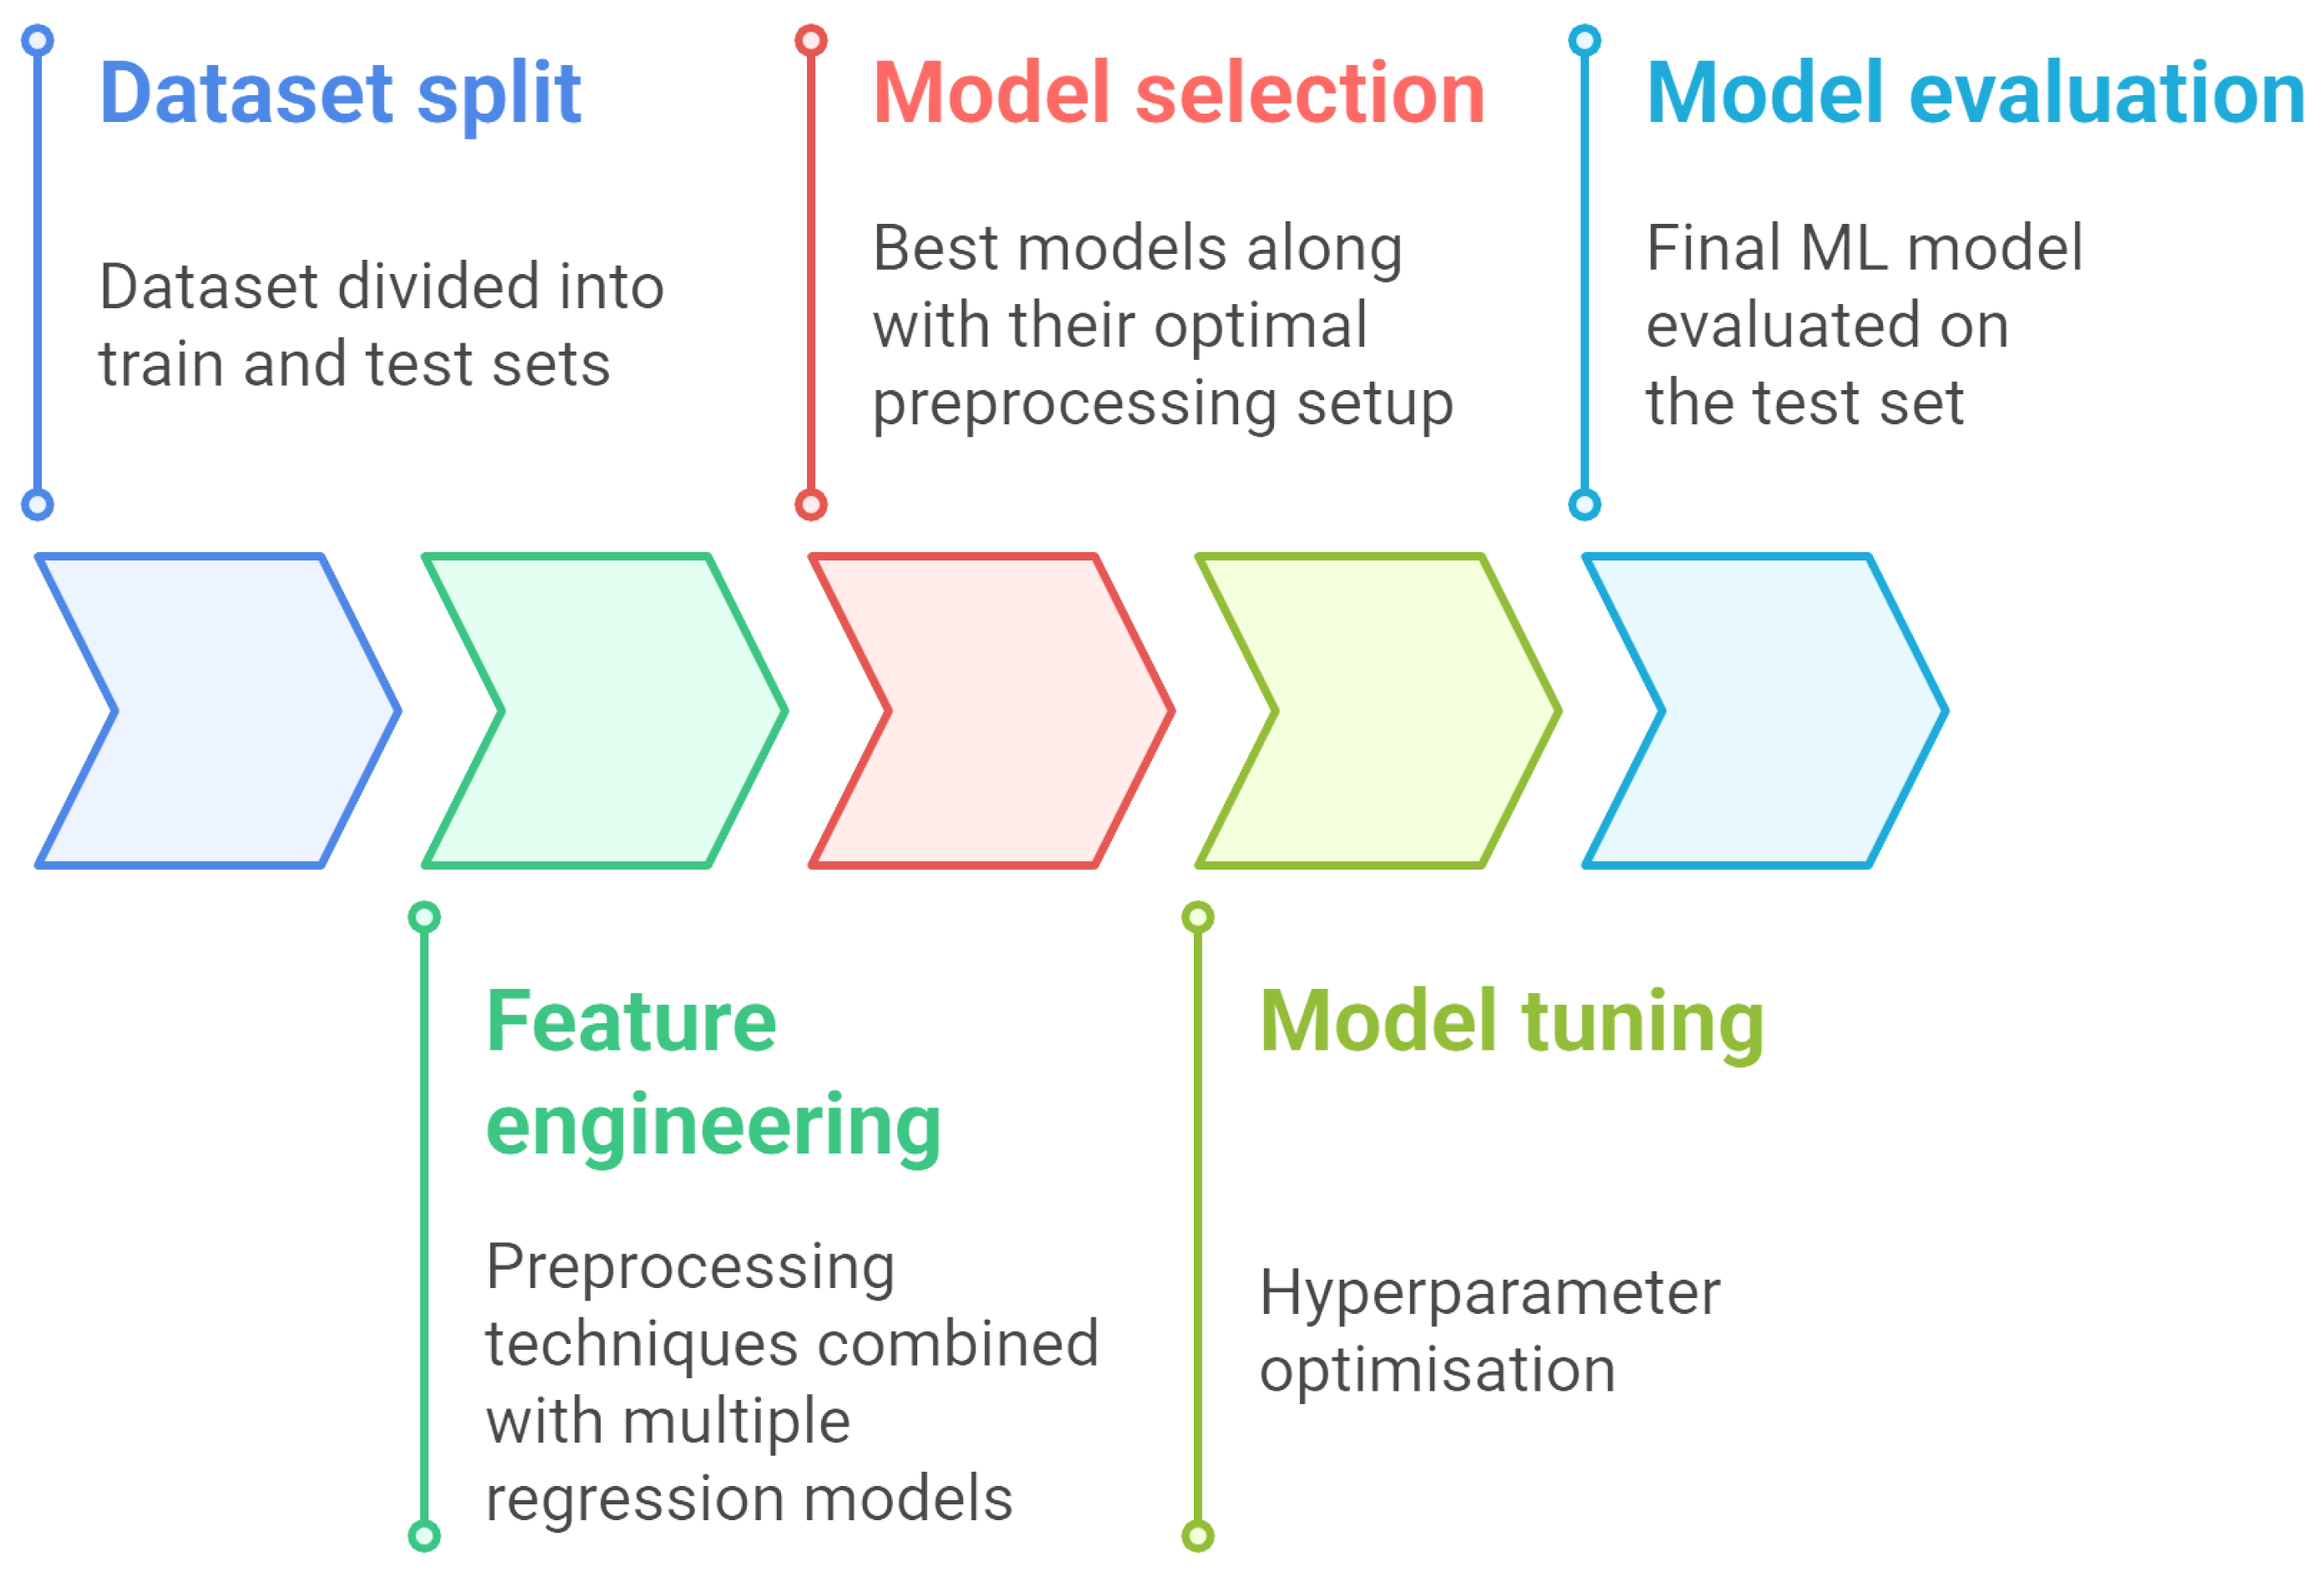
The data science methodology is applied for each nutrient independently to model separate, individual relationships between spectral reflectance and nutrient content. It is depicted in Figure 2, and it can be segmented into three stages:
  • Pre-processing techniques and model ranking.
  • Hyperparameter optimisation.
  • Final model evaluation.
The first stage follows the methodology described in Section 2.5.2, where the models are sorted in descending order of R 2 , and the top five are selected for the next step. Accordingly, each regression model from the Scikit-learn (1.3.0), with default hyperparameters, was evaluated with all valid combinations of distinct pre-processing techniques applied to the train set only, as well as with the train data with no transformation at all. As the train set was small and the grid search was computationally expensive, five-fold cross-validation was performed, overcoming selection bias and overfitting [50]. This involves partitioning the training data into five uniform subsets, with 80% of the data used to train a model instance and the remaining 20% of the data, corresponding to one of the partitions and aiding in evaluating the instance. This evaluation process is repeated iteratively for the remaining partitions, so that the metrics obtained for the five model instances are averaged [51]. In the context of feature transformation, for each iteration, the data were fitted on all folds but one, the validation subset, and then applied to the training and validation sets. This approach helps to avoid data leakage and more accurately assess model performance by ensuring that the validation data remain unseen during the training process. Finally, for each regression model, only the best combination of pre-processing techniques is retained before sorting.
Figure 2. Diagram of the machine learning workflow.
Applbiosci 04 00032 g002
In the hyperparameter optimisation step for model tuning, our main goal was to find the set of hyperparameter values that maximised the R 2 score of the selected models. During this step, we also conducted k-fold cross-validation, k = 5 , on the training set, to assess the hyperparameter configurations.
Once the previous two steps were finally completed, the fine-tuned model with the highest R 2 value was trained on the entire training set, transformed by the corresponding combination of pre-processing techniques, and evaluated on the test dataset. Only at this stage was the test set made available in order to accurately assess how the models would perform on new, unseen data.

3. Results

3.1. Nutritional Status

In 2022, fertilisation treatments did not significantly affect the leaf’s N content in ’Koroneiki’, while K levels did not show differences regardless of the cultivar (Table 2). In 2023, the fertilisation had no impact on the content of P and K for ’Koroneiki’.

3.2. Principal Component Analysis

PCA was performed with the FLAME spectrometer data.
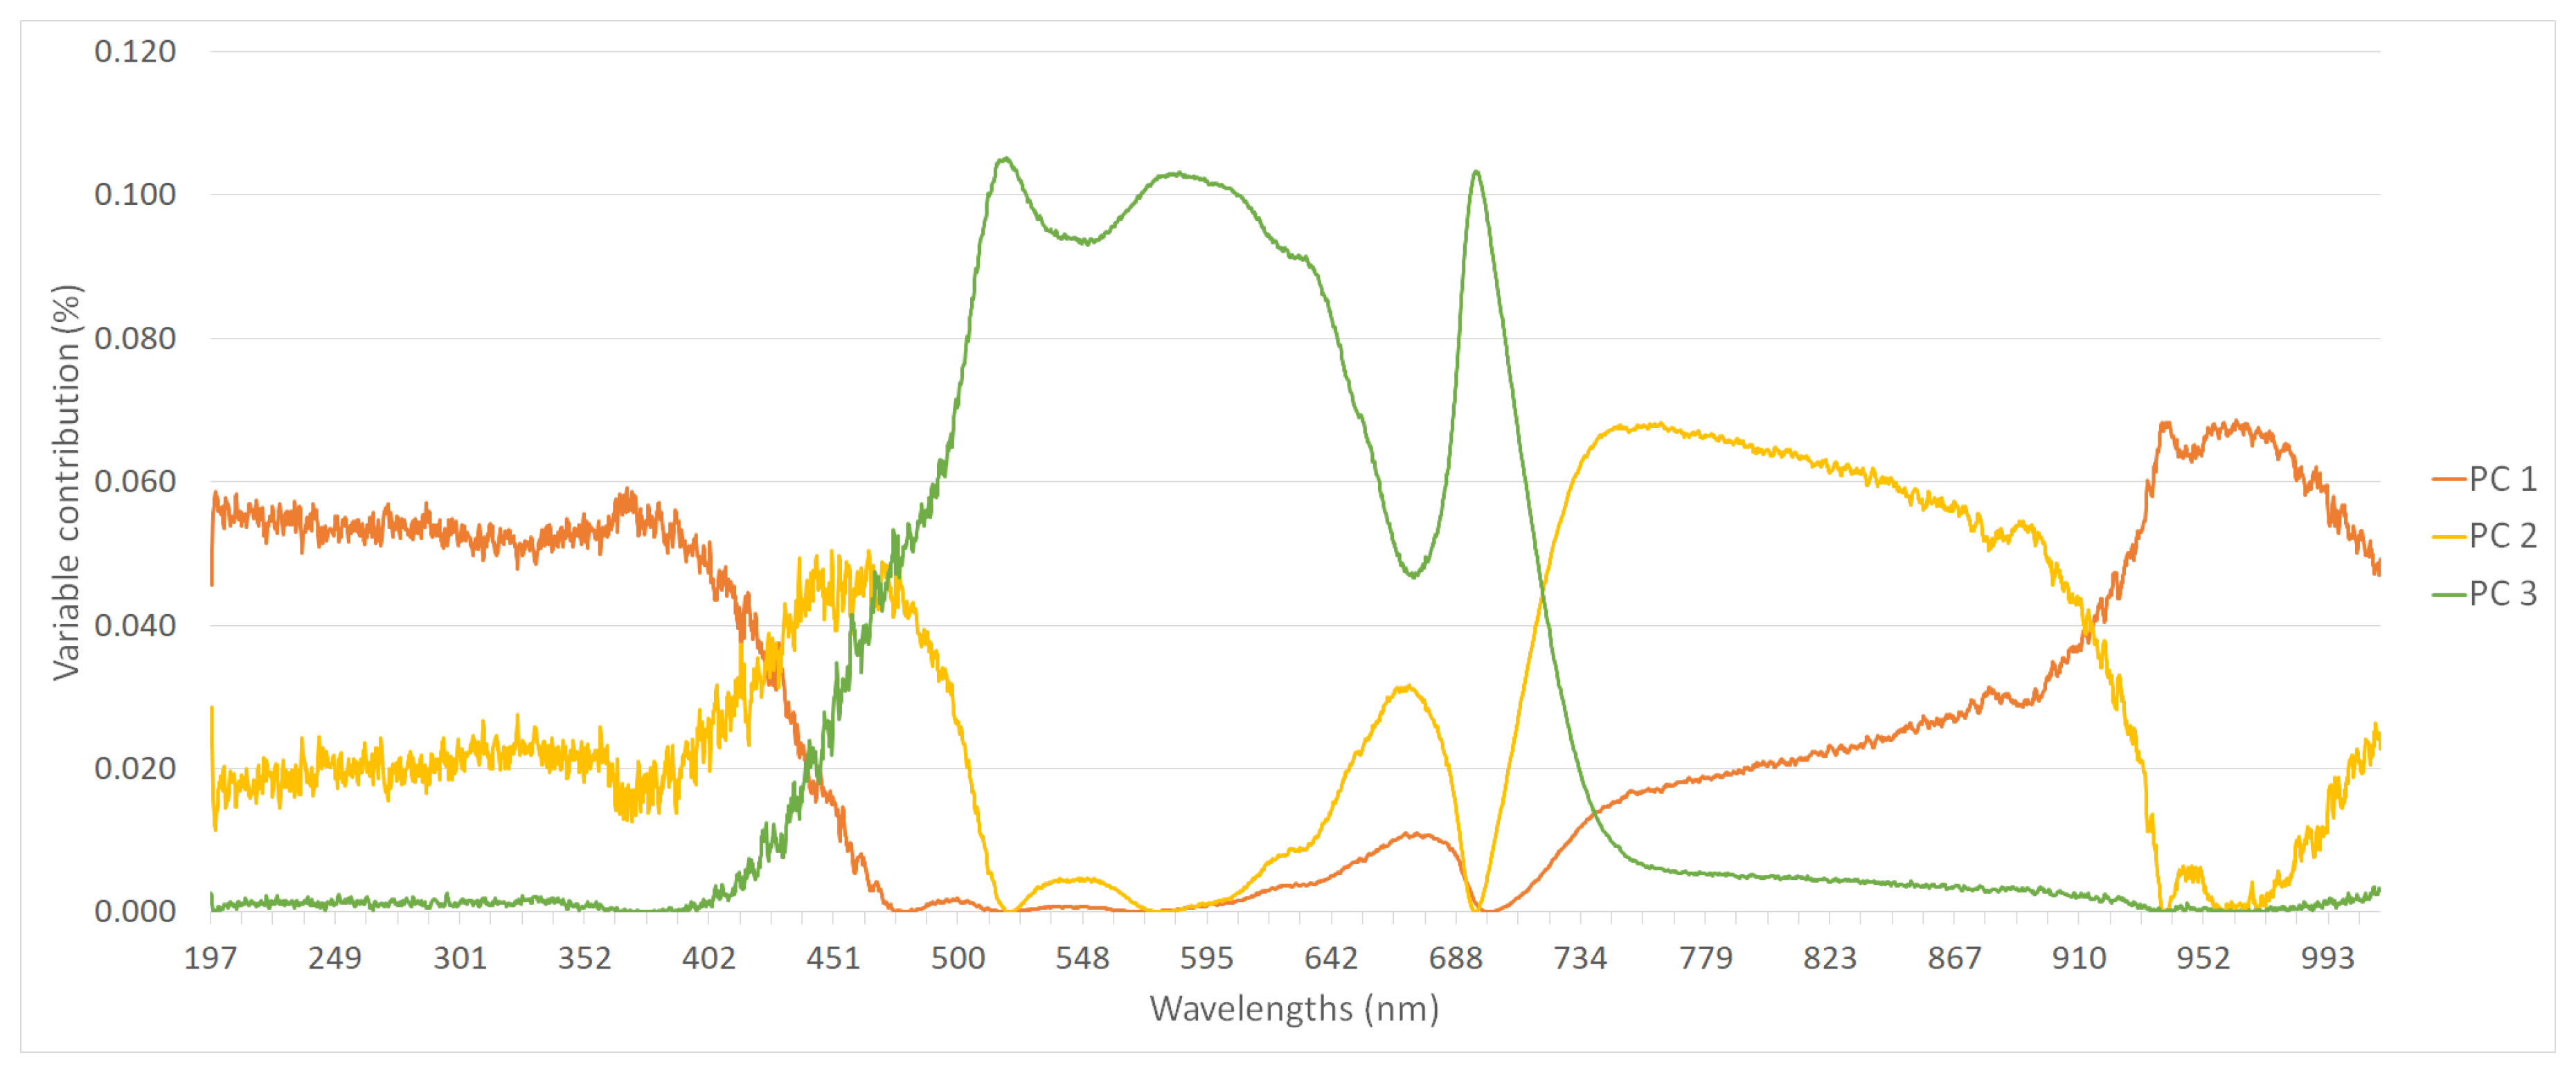
For illustration purposes, Figure 3 shows the contribution of each wavelength along the spectral range for the first three principal components when PCA was applied to the entire training set. Three principal components were sufficient to explain more than 95% of the total variance in the data, whereas the first seven principal components describe 99% of the total variance.

3.3. Model Evaluation

In the following subsections, the relationship established by ML models between sensor data—from the FLAME spectrometer and multispectral sensor—and lab-analysed plant nutrient content is evaluated.
All valid combinations of feature engineering techniques were applied to each regression model from the Scikit-learn library, which in turn were evaluated using cross-validation. The combination of techniques that maximised the R 2 for each model was retained, and the top five performing models were chosen for hyperparameter optimisation. The best set of parameters was then fixed, and the model with the highest R 2 on the validation set was finally assessed using the test set.
The results of the cross-validation and the test set evaluation can be found in Table 3 and Table 4 for multispectral and FLAME spectrometer data, respectively. Each row corresponds to a model trained and evaluated for a given nutrient, all independently and separately, and the “Model” column corresponds to the regression model with the best cross-validation performance.
These results show no overfitting with the training data, as there was generally no decline in the performance from the cross-validation to evaluation on the test set. The models are, therefore, able to generalise to data that have never been used in learning without being over-fitted to the training set.
Concerning the pre-processing techniques and the multispectral dataset, SVD with six components was applied to N, whereas PCA aided in the data transformation to predict P (with six components) and K (with five components). On the other hand, for the spectrometer dataset, the whitening transformation was performed to model K estimation, and the remaining nutrients attained z-score normalisation. Thirty principal components were kept for N and P as well as for 99% of the explained variance for K.
According to Table 5 with respect to N, removing all but five bands (R, G, B, NIR and RE) from the spectrometer data reduced the R 2 from 0.64 to 0.39, which is closer to the value obtained with the multispectral dataset with the same wavelengths, 0.45.
Since we had obtained the reflectance values per pixel of the orthophoto, it was also possible to extract the vegetative indices for the multispectral dataset. Table 6 shows the results when vegetation indices replace the bands in the dataset, while Table 7 includes both the bands and the indices extracted from them as input variables.
Lastly, the results were filtered by year. The metrics were calculated for the same models evaluated separately for the years 2022 and 2023. For both the multispectral dataset and the spectrometer dataset (Table 8 and Table 9, respectively), the models performed better with data from 2022 than from 2023.

4. Discussion

The objectives of this research were as follows: (i) To validate the information collected with two different sensors—a proximal sensor (FLAME spectrometer) and a remote detection sensor (multispectral), coupled to a UAV—using the ground-truth data obtained from foliar chemical analyses as references. (ii) To train predictive models through ML techniques. With these two objectives in mind, we intended to be able to determine the nutritional status of our crop via remote and/or proximal sensing data, specifically regarding its main macronutrients: N, P, and K.
In evaluating the sensors used to assess the nutritional status of olive trees, the FLAME spectrometer demonstrated the highest accuracy for estimating N content (Table 4). For P and K, both the FLAME and multispectral sensors showed comparable performance (Table 3 and Table 4). The difference in data acquisition methods partly explains these results. The multispectral sensor captures imagery from an altitude of 45 m, providing a vertical perspective that primarily samples the upper canopy area, characterised by active vegetative growth. In contrast, the leaves used for the FLAME spectrometer readings were fully developed leaves on the lateral sides of the canopy, where nutrient concentrations of N, P, and K differ from those found in younger top-canopy, as noted by Fernández-Escobar et al. [52]. Also, the FLAME spectrometer operates in controlled laboratory conditions, where measurements are taken directly from individual leaves. This eliminates noise from external environmental factors, like light variability, dust and canopy shading, leading to more reliable nutrient estimations [53]. Its superior performance in estimating N may also stem from its broader spectral range (200–1025 nm) compared to the narrower range of the multispectral sensor (475–717 nm). Hyperspectral sensors operating in the short-wave infrared (SWIR) range from 1000 to 2500 nm are known to outperform those in the visible–near-infrared (VNIR) range (400–1000 nm) for N detection [54]. Because the FLAME spectrometer encompasses a wider range of wavelengths, it captures more detailed spectral information, resulting in enhanced predictive accuracy. As noted by Sandino et al. [55], higher spectral resolution improves data quality and analytical outcomes. This advantage is further reinforced by the fact that the FLAME measurements were taken from the same leaves analysed for chemical composition, providing direct correspondence between spectral and laboratory data. Additionally, Table 5 highlights that certain wavelength bands used by the spectrometer, but not available in the multispectral camera, are more sensitive to variations in N levels, further explaining the FLAME sensor’s superior performance.
The application of the PCA to our data, even though it allows the dimensionality to be reduced by around 99.8% while preserving 99% of the explained variance, consists of an unsupervised method, where the selection of axes does not necessarily comprise the weighted sum of the wavelengths with the most significant importance for estimating the leaf nutrient contents. When filtering the data from the FLAME spectrometer to cover only the five bands that make up the multispectral sensor (Table 5), the results of N and K were slightly lower than those of the multispectral one. This suggests that for the FLAME spectrometer, there are additional critical bands outside the 475–717 nm range that are essential for the estimation of key macronutrients that were hidden in the filtering process.
The improved performance of ensemble learning models, such as Extra Trees and Gradient Boosting, as well as NuSVR, Partial Least Squares (PLS) and K-Neighbors, can be attributed to their respective strengths in handling small datasets with low features, as seen in Table 3 and Table 4. Even under such conditions, ensemble learning models are robust when learning complex patterns. Extra Trees reduce variance by averaging predictions from multiple randomised decision trees and are therefore good at preventing overfitting [56], whereas Gradient Boosting reduces bias by summing up successive improvement in predictions using additive modelling [57,58]. Likewise, NuSVR, a ν -parametrised support vector regression (SVR) model, is famous for its robustness in high-bias, low-variance conditions [59]. PLS regression, which projects predictors into a lower-dimensional space before modelling, is also suitable for small, collinear datasets [60]. Lastly, the K-Neighbors model, while simple, can be highly effective when the local data structure is informative [61]. Overall, the success of these models underscores the merit of model selection based on dataset properties, especially when working with limited data.
The models used had the highest correlation when estimating the leaf concentration of the main macronutrients, P and K, and were slightly less accurate for N, in line with the results obtained by Noguera et al. [5]. The lower precision ( R 2 ) in estimating N can be explained by several factors that affect the spectral reflectance of leaves, particularly under field conditions. One possible explanation could be related to the leaf morphological structure, and the fact that deficit irrigation is practised in the olive grove where the study was carried out (1000 m3 ha−1 per year). In Eucalyptus grandis, the spectral reflectance of fresh leaves is strongly influenced by the water content and the internal structure of the leaves [62]. This interference may be even more pronounced due to the unique leaf characteristics of each plant species, such as a thick cuticle and high drought tolerance, which affect the reflectance and make it difficult to accurately estimate N. Regarding green leaves, the layer that corresponds to the spongy mesophyll controls the amount of near-infrared energy that is reflected [63]. Rico et al. [64] intended to estimate the main macronutrients in olive cultivation by using multispectral data obtained by a UAV and creating models to predict leaf nutrient content in olive trees, applying SVR. Their results showed good precision for estimating N, P, and K, with R 2 varying from 0.76 to 0.91 for the ‘Hojiblanca’ cultivar, and from 0.79 to 0.80 for ‘Picual’. In a vineyard, Peng et al. [65] reported R 2 values of 0.81 for N, 0.77 for P and 0.80 for K, and in ’Valencia’, they reported orange values of 0.91 for N, 0.77 for P and 0.76 for K [66].
Regarding Table 6 and Table 7, we observed that the R 2 values in both cases indicate that, overall, the models do not establish a stronger relationship between vegetative indices and nutrient quantity than when the bands of the spectrum alone are considered alternatively.

5. Conclusions

Good plant nutrition is essential to achieve high yields, in both quantitative and qualitative ways. As such, plant and/or soil fertilisation procedures are the main cultural practices being used to regulate the quantity of nutrients available to plants. To optimise the use of fertilisers, it is essential to measure the plant nutritional status. However, the classic destructive methods are highly time-consuming and require a lot of physical labour in order to have a precise and high representative sample of a field. Therefore, the methods presented in this paper, based on non-destructive, remote or proximal analyses, are a valuable tool for olive growers for evaluating the nutritional status of plants. This study demonstrates the potential of non-destructive sensing technologies—namely the FLAME spectrometer (proximal) and multispectral UAV imagery (remote)—as powerful alternatives for evaluating N, P, and K levels in olive trees. The FLAME spectrometer showed superior accuracy in estimating N content due to its broader spectral range and controlled data acquisition, while both sensors performed comparably in estimating P and K. These methods also enable spatially precise nutrient mapping, which supports variable-rate fertilisation, ensuring that nutrients are applied where and when they are needed most. The methods presented also have the advantage of making it easy to evaluate the spatial variability of fields, enabling the application of a fertiliser at variable rates, enabling the plants to receive sufficient and optimal amounts of fertiliser where they need it. Through VRT, it is possible to optimise resource usage in order to mitigate environmental issues such as nutrient runoff and soil degradation. Both methods provided results with great potential for the farmers, and each one could be more targeted to the farmer’s economic dimension, their willingness to invest in technology, and the level of training. Although these results are promising, more research is needed to explore various environmental conditions, olive varieties and growth stages. Compared to the current methods, this technique is a step forward towards a system for the continuous monitoring of nutrient levels in olive orchards, ultimately leading to smarter and more efficient fertilisation practices, increasing the productivity and profitability of olive orchards, contributing to more sustainable agriculture, and promoting environmentally conscious practices. In the context of modern olive production, which faces pressures such as resource limitations, soil degradation, and the need to reduce fertiliser overuse, these sensor-based approaches offer a timely solution by not only improving the efficiency and sustainability of fertilisation practices but also by reducing our environmental impact. Ultimately, integrating these technologies into routine orchard management can enhance productivity, reduce costs, and contribute to more sustainable and environmentally responsible agriculture. Future research should focus on validating these methods across diverse environmental conditions, olive varieties, and growth stages to further improve their robustness and applicability.
Author Contributions

Conceptualisation, C.M., R.A.-C., A.M.C. and J.S.; methodology, C.M., J.d.D., M.D., A.L., E.F., L.A., M.B. and F.F.; software, A.L., E.F., L.A. and M.B.; validation, C.M., J.d.D., M.D., A.L., E.F., L.A., M.B. and J.S.; formal analysis, J.S.; investigation, C.M., J.d.D., M.D., A.L., E.F., L.A. and J.S.; resources, J.S.; data curation, C.M., J.d.D., M.D. and J.S.; writing—original draft preparation, C.M., J.d.D., M.D., A.L., L.A.C., R.A.-C., C.I., A.M.C., E.F., L.A., M.B. and J.S.; writing—review and editing, C.M., J.d.D., M.D., A.L., C.I., E.F., L.A. and J.S.; visualisation, C.M., J.d.D., M.D., A.L., C.I., E.F., L.A. and J.S.; supervision, F.F. and J.S.; project administration, F.F. and J.S.; funding acquisition, J.S. All authors have read and agreed to the published version of the manuscript.

Funding

This research work was developed in the context of the project AI4RealAg—Artificial Intelligence and Data Science solutions for the implementation and democratisation of digital agriculture, which was funded by both the Operacional Competitividade e Internacionalização program (POCI-01-0247-FEDER-069670) and by the Operacional Regional de Lisboa 2020 program (LISBOA-01-0247-FEDER-069670). This project aims to help the agricultural sector transition into the new digital era, through the adoption of artificial intelligence methods—particularly data science techniques. This project was formed by a consortium of three entities: Promotor: SISCOG, a world-leading technological company in the development of AI applications in the transportation sector, with more than 140 highly experienced technical professionals;. Co-Promotor: INIAV, a Portuguese national institute which holds domain expertise about agriculture, experimental farms, equipment and necessary laboratories for data validation. Co-Promotor: BEYOND VISION, a technological company which specialises in the production of drones, holding vast experience in the area of image processing and fusion (in both the software and hardware ends) and being capable of integrating data from multiple sensors.

Institutional Review Board Statement

Not applicable.

Informed Consent Statement

Not applicable.

Data Availability Statement

The raw data supporting the conclusions of this article will be made available by the authors on request.

Conflicts of Interest

The authors declare no conflicts of interest.

References

  1. Pinto, L.; Cabral, R.; Gonçalves, J.M. Olival Tradicional: Situação e Perspectivas; Technical Report; InforCNA: Coimbra, Portugal, 2021. [Google Scholar]
  2. EDIA. Relatório da Campanha de Rega|2020; Technical Report; EDIA—Empresa de Desenvolvimento e Infraestruturas do Alqueva, S.A.: Beja, Portugal, 2021. [Google Scholar]
  3. Patanita, M.I.; Tomaz, A.; Patanita, M. Olivicultura—O Desafio da Sustentabilidade; Repositório IPBeja: Beja, Portugal, 2021. [Google Scholar]
  4. Głodowska, M.; Wozniak, M. Changes in soil microbial activity and community composition as a result of selected agricultural practices. Agric. Sci. 2019, 10, 330. [Google Scholar] [CrossRef]
  5. Noguera, M.; Aquino, A.; Ponce, J.M.; Cordeiro, A.; Silvestre, J.; Arias-Calderón, R.; da Encarnação Marcelo, M.; Jordão, P.; Andújar, J.M. Nutritional status assessment of olive crops by means of the analysis and modelling of multispectral images taken with UAVs. Biosyst. Eng. 2021, 211, 1–18. [Google Scholar] [CrossRef]
  6. Roma, E.; Laudicina, V.A.; Vallone, M.; Catania, P. Application of precision agriculture for the sustainable management of fertilization in olive groves. Agronomy 2023, 13, 324. [Google Scholar] [CrossRef]
  7. Dar, G.H.; Bhat, R.A.; Mehmood, M.A.; Hakeem, K.R. Microbiota and Biofertilizers; Springer: Cham, Switzerland, 2021; Volume 2. [Google Scholar]
  8. Kremen, C. Ecological intensification and diversification approaches to maintain biodiversity, ecosystem services and food production in a changing world. Emerg. Top. Life Sci. 2020, 4, 229–240. [Google Scholar] [CrossRef] [PubMed]
  9. Dores, R. A Revolução Digital na Agricultura à Boleia de Drones e Satélites. Diário de Notícias, 2 December 2021. [Google Scholar]
  10. Aziz, D.; Rafiq, S.; Saini, P.; Ahad, I.; Gonal, B.; Rehman, S.A.; Rashid, S.; Saini, P.; Rohela, G.K.; Aalum, K.; et al. Remote sensing and artificial intelligence: Revolutionizing pest management in agriculture. Front. Sustain. Food Syst. 2025, 9, 1551460. [Google Scholar] [CrossRef]
  11. Benos, L.; Tagarakis, A.C.; Dolias, G.; Berruto, R.; Kateris, D.; Bochtis, D. Machine learning in agriculture: A comprehensive updated review. Sensors 2021, 21, 3758. [Google Scholar] [CrossRef] [PubMed]
  12. Jafari, M.; Shahsavar, A. The application of artificial neural networks in modeling and predicting the effects of melatonin on morphological responses of citrus to drought stress. PLoS ONE 2020, 15, e0240427. [Google Scholar] [CrossRef]
  13. Gill, T.; Gill, S.K.; Saini, D.K.; Chopra, Y.; de Koff, J.P.; Sandhu, K.S. A comprehensive review of high throughput phenotyping and machine learning for plant stress phenotyping. Phenomics 2022, 2, 156–183. [Google Scholar] [CrossRef]
  14. Grinblat, G.L.; Uzal, L.C.; Larese, M.G.; Granitto, P.M. Deep learning for plant identification using vein morphological patterns. Comput. Electron. Agric. 2016, 127, 418–424. [Google Scholar] [CrossRef]
  15. Hesami, M.; Alizadeh, M.; Jones, A.M.P.; Torkamaneh, D. Machine learning: Its challenges and opportunities in plant system biology. Appl. Microbiol. Biotechnol. 2022, 106, 3507–3530. [Google Scholar] [CrossRef]
  16. van Dijk, A.D.J.; Kootstra, G.; Kruijer, W.; de Ridder, D. Machine learning in plant science and plant breeding. Iscience 2021, 24. [Google Scholar] [CrossRef]
  17. Hesami, M.; Alizadeh, M.; Naderi, R.; Tohidfar, M. Forecasting and optimizing Agrobacterium-mediated genetic transformation via ensemble model-fruit fly optimization algorithm: A data mining approach using chrysanthemum databases. PLoS ONE 2020, 15, e0239901. [Google Scholar] [CrossRef]
  18. Mishra, B.; Kumar, N.; Mukhtar, M.S. Systems biology and machine learning in plant–pathogen interactions. Mol. Plant-Microbe Interact. 2019, 32, 45–55. [Google Scholar] [CrossRef] [PubMed]
  19. Hesami, M.; Jones, A.M.P. Application of artificial intelligence models and optimization algorithms in plant cell and tissue culture. Appl. Microbiol. Biotechnol. 2020, 104, 9449–9485. [Google Scholar] [CrossRef] [PubMed]
  20. Gabinete de Planeamento, Políticas e Administração Geral. Análise Setorial Azeite; Technical Report; GPP: Lisboa, Portugal, 2020. [Google Scholar]
  21. Marques, P.; Pádua, L.; Sousa, J.J.; Fernandes-Silva, A. Advancements in remote sensing imagery applications for precision management in olive growing: A systematic review. Remote Sens. 2024, 16, 1324. [Google Scholar] [CrossRef]
  22. Peñuelas, J.; Gamon, J.; Fredeen, A.; Merino, J.; Field, C. Reflectance indices associated with physiological changes in nitrogen-and water-limited sunflower leaves. Remote Sens. Environ. 1994, 48, 135–146. [Google Scholar] [CrossRef]
  23. Martínez M, L.J. Relationship between crop nutritional status, spectral measurements and Sentinel 2 images. Agron. Colomb. 2017, 35, 205–215. [Google Scholar] [CrossRef]
  24. Malmir, M.; Tahmasbian, I.; Xu, Z.; Farrar, M.B.; Bai, S.H. Prediction of macronutrients in plant leaves using chemometric analysis and wavelength selection. J. Soils Sediments 2020, 20, 249–259. [Google Scholar] [CrossRef]
  25. Pandey, P.; Ge, Y.; Stoerger, V.; Schnable, J.C. High throughput in vivo analysis of plant leaf chemical properties using hyperspectral imaging. Front. Plant Sci. 2017, 8, 1348. [Google Scholar] [CrossRef]
  26. Brambilla, M.; Romano, E.; Buccheri, M.; Cutini, M.; Toscano, P.; Cacini, S.; Massa, D.; Ferri, S.; Monarca, D.; Fedrizzi, M.; et al. Application of a low-cost RGB sensor to detect basil (Ocimum basilicum L.) nutritional status at pilot scale level. Precis. Agric. 2021, 22, 734–753. [Google Scholar] [CrossRef]
  27. Chungcharoen, T.; Donis-Gonzalez, I.; Phetpan, K.; Udompetaikul, V.; Sirisomboon, P.; Suwalak, R. Machine learning-based prediction of nutritional status in oil palm leaves using proximal multispectral images. Comput. Electron. Agric. 2022, 198, 107019. [Google Scholar] [CrossRef]
  28. Lysenko, V.; Opryshko, O.; Komarchuk, D.; Pasichnyk, N.; Zaets, N.; Dudnyk, A. Information Support of the Remote Nitrogen Monitoring System in Agricultural Crops. Int. J. Comput. 2018, 17, 47–54. [Google Scholar] [CrossRef]
  29. Qiu, Z.; Ma, F.; Li, Z.; Xu, X.; Ge, H.; Du, C. Estimation of nitrogen nutrition index in rice from UAV RGB images coupled with machine learning algorithms. Comput. Electron. Agric. 2021, 189, 106421. [Google Scholar] [CrossRef]
  30. Zha, H.; Miao, Y.; Wang, T.; Li, Y.; Zhang, J.; Sun, W.; Feng, Z.; Kusnierek, K. Improving unmanned aerial vehicle remote sensing-based rice nitrogen nutrition index prediction with machine learning. Remote Sens. 2020, 12, 215. [Google Scholar] [CrossRef]
  31. IPMA. Normais Climatológicas. In Instituto Português do Mar e da Atmosfera; IPMA: Lisboa, Portugal, 2023. [Google Scholar]
  32. Cardoso, J. Os Solos de Portugal—Sua Classificação, Caracterização e Génese (I - A Sul do Rio Tejo); Secretaria De Estado Da Agricultura, Direção-Geral Dos Serviços Agrícolas: Lisboa, Portugal, 1965. [Google Scholar]
  33. Veloso, A.; Sempiterno, C.; Calouro, F.; Rebelo, F.; Pedra, F.; Castro, I.V.; da Conceição Gonçalves, M.; da Encarnação Marcelo, M.; Pereira, P.; Fareleira, P.; et al. Manual de Fertilização das Culturas; Instituto Nacional de Investigação Agrária e Veterinária, I.P.—INIAV: Oeiras, Portugal, 2022. [Google Scholar]
  34. Centeno, A.; Hueso, A.; Gómez-del Campo, M. Long-term evaluation of growth and production of olive cultivars in super high-density orchard under cold-weather conditions. Sci. Hortic. 2019, 257, 108657. [Google Scholar] [CrossRef]
  35. Sanz-Cortés, F.; Martinez-Calvo, J.; Badenes, M.L.; Bleiholder, H.; Hack, H.; Llácer, G.; Meier, U. Phenological growth stages of olive trees (Olea europaea). Ann. Appl. Biol. 2002, 140, 151–157. [Google Scholar] [CrossRef]
  36. Silva, E.; Nogueira, F.D.; Gimarães, P.T.G. Análise de Cloreto em Tecido Vegetal; UFLA: Lavras, Brazil, 1999. [Google Scholar]
  37. Carmo, C.A.F.d.S.d.; Araújo, W.S.d.; Bernardi, A.C.d.C.; Saldanha, M.F.C. Métodos de Análise de Tecidos Vegetais Utilizados na Embrapa Solos; Technical Report; Embrapa Solos: Recife, Brazil, 2000. [Google Scholar]
  38. Faquin, V. Diagnose do Estado Nutricional das Plantas; UFLA/FAEPE: Lavras, Brazil, 2002; Volume 1, p. 77. [Google Scholar]
  39. da Silva, F.C. Manual de Análises Químicas de Solos, Plantas e Fertilizantes; Embrapa: Brasília, Brazil, 2009. [Google Scholar]
  40. Galeriani, T.M.; Cosmo, B.M.N.; Beneton, A.M.G. Preparo de amostras de tecido vegetal. Rev. Agron. Bras. 2020, 4, 1–7. [Google Scholar] [CrossRef]
  41. Sáez-Plaza, P.; Navas, M.J.; Wybraniec, S.; Michałowski, T.; Asuero, A.G. An overview of the Kjeldahl method of nitrogen determination. Part II. Sample preparation, working scale, instrumental finish, and quality control. Crit. Rev. Anal. Chem. 2013, 43, 224–272. [Google Scholar] [CrossRef]
  42. Bartos, J.M.; Boggs, B.L.; Falls, J.H.; Siegel, S.A. Determination of phosphorus and potassium in commercial inorganic fertilizers by inductively coupled plasma-optical emission spectrometry: Single-laboratory validation. J. AOAC Int. 2014, 97, 687–699. [Google Scholar] [CrossRef]
  43. Han, J.; Pei, J.; Tong, H. Data Mining: Concepts and Techniques; Morgan Kaufmann: Burlington, MA, USA, 2011. [Google Scholar]
  44. Huang, S.; Tang, L.; Hupy, J.P.; Wang, Y.; Shao, G. A commentary review on the use of normalized difference vegetation index (NDVI) in the era of popular remote sensing. J. For. Res. 2021, 32, 1–6. [Google Scholar] [CrossRef]
  45. Qi, J.; Chehbouni, A.; Huete, A.R.; Kerr, Y.H.; Sorooshian, S. A modified soil adjusted vegetation index. Remote Sens. Environ. 1994, 48, 119–126. [Google Scholar] [CrossRef]
  46. Bhandari, M.; Ibrahim, A.M.; Xue, Q.; Jung, J.; Chang, A.; Rudd, J.C.; Maeda, M.; Rajan, N.; Neely, H.; Landivar, J. Assessing winter wheat foliage disease severity using aerial imagery acquired from small Unmanned Aerial Vehicle (UAV). Comput. Electron. Agric. 2020, 176, 105665. [Google Scholar] [CrossRef]
  47. He, J.; Zhang, N.; Su, X.; Lu, J.; Yao, X.; Cheng, T.; Zhu, Y.; Cao, W.; Tian, Y. Estimating leaf area index with a new vegetation index considering the influence of rice panicles. Remote Sens. 2019, 11, 1809. [Google Scholar] [CrossRef]
  48. Vidican, R.; Mălinaș, A.; Ranta, O.; Moldovan, C.; Marian, O.; Ghețe, A.; Ghișe, C.R.; Popovici, F.; Cătunescu, G.M. Using remote sensing vegetation indices for the discrimination and monitoring of agricultural crops: A critical review. Agronomy 2023, 13, 3040. [Google Scholar] [CrossRef]
  49. Kumakoshi, Y.; Chan, S.Y.; Koizumi, H.; Li, X.; Yoshimura, Y. Standardized green view index and quantification of different metrics of urban green vegetation. Sustainability 2020, 12, 7434. [Google Scholar] [CrossRef]
  50. Refaeilzadeh, P.; Tang, L.; Liu, H. Cross-Validation; Springer: New York, NY, USA, 2009; pp. 532–538. [Google Scholar]
  51. Bergstra, J.; Bardenet, R.; Bengio, Y.; Kégl, B. Algorithms for hyper-parameter optimization. In Proceedings of the 25th International Conference on Neural Information Processing Systems, Granada, Spain, 12–15 December 2011; NIPS’11. pp. 2546–2554. [Google Scholar]
  52. Fernández-Escobar, R.; Moreno, R.; Garcıa-Creus, M. Seasonal changes of mineral nutrients in olive leaves during the alternate-bearing cycle. Sci. Hortic. 1999, 82, 25–45. [Google Scholar] [CrossRef]
  53. Gautam, D.; Pagay, V. A review of current and potential applications of remote sensing to study the water status of horticultural crops. Agronomy 2020, 10, 140. [Google Scholar] [CrossRef]
  54. Liu, H.; Bruning, B.; Garnett, T.; Berger, B. The performances of hyperspectral sensors for proximal sensing of nitrogen levels in wheat. Sensors 2020, 20, 4550. [Google Scholar] [CrossRef] [PubMed]
  55. Sandino, J.; Pegg, G.; Gonzalez, F.; Smith, G. Aerial mapping of forests affected by pathogens using UAVs, hyperspectral sensors, and artificial intelligence. Sensors 2018, 18, 944. [Google Scholar] [CrossRef] [PubMed]
  56. Geurts, P.; Ernst, D.; Wehenkel, L. Extremely randomized trees. Mach. Learn. 2006, 63, 3–42. [Google Scholar] [CrossRef]
  57. Friedman, J.H. Greedy function approximation: A gradient boosting machine. Ann. Stat. 2001, 29, 1189–1232. [Google Scholar] [CrossRef]
  58. Hastie, T.; Tibshirani, R.; Friedman, J. Boosting and Additive Trees. In The Elements of Statistical Learning: Data Mining, Inference, and Prediction; Springer: New York, NY, USA, 2009; pp. 337–387. [Google Scholar] [CrossRef]
  59. Chang, C.C.; Lin, C.J. Training v-Support Vector Regression: Theory and Algorithms. Neural Comput. 2002, 14, 1959–1977. [Google Scholar] [CrossRef] [PubMed]
  60. Abdi, H. Partial least squares regression and projection on latent structure regression (PLS Regression). WIREs Comput. Stat. 2010, 2, 97–106. [Google Scholar] [CrossRef]
  61. Cover, T.M.; Hart, P.E. Nearest neighbor pattern classification. IEEE Trans. Inf. Theory 1967, 13, 21–27. [Google Scholar] [CrossRef]
  62. Masemola, C.; Cho, M.A. Estimating leaf nitrogen concentration from similarities in fresh and dry leaf spectral bands using a model population analysis framework. Int. J. Remote Sens. 2019, 40, 6841–6860. [Google Scholar] [CrossRef]
  63. Schultz, B.; Augusto, G.; Mataveli, G.; Oliveira, B.S.; Martins, R.; Ferreira, P.; Frank, T.; Formaggio, A.R. Influência de Distintos Tipos Espectrais de Solos Sobre as Respostas de Diferentes Porcentagens de Cobertura Vegetal; Simpósio Brasileiro de Sensoriamento Remoto: Paraná, Brazil, 2013. [Google Scholar]
  64. Rico, S.I.; Marchal, P.C.; Gila, D.M.; García, J.G. Multiple instance regression for the estimation of leaf nutrient content in olive trees using multispectral data taken with UAVs. Biosyst. Eng. 2024, 242, 91–99. [Google Scholar] [CrossRef]
  65. Peng, X.; Chen, D.; Zhou, Z.; Zhang, Z.; Xu, C.; Zha, Q.; Wang, F.; Hu, X. Prediction of the nitrogen, phosphorus and potassium contents in grape leaves at different growth stages based on UAV multispectral remote sensing. Remote Sens. 2022, 14, 2659. [Google Scholar] [CrossRef]
  66. Osco, L.P.; Ramos, A.P.M.; Faita Pinheiro, M.M.; Moriya, É.A.S.; Imai, N.N.; Estrabis, N.; Ianczyk, F.; Araújo, F.F.d.; Liesenberg, V.; Jorge, L.A.d.C.; et al. A machine learning framework to predict nutrient content in valencia-orange leaf hyperspectral measurements. Remote Sens. 2020, 12, 906. [Google Scholar] [CrossRef]
Figure 1. Workflow summarising the methodology used in the study, from field setup to model evaluation.
Applbiosci 04 00032 g001
Figure 3. Contribution of the three principal components of the training set to the PCA along the spectrum. The three principal components were sufficient to explain more than 95% of the total variance in the data.
Applbiosci 04 00032 g003
Table 1. Fertiliser quantities, divided by each macronutrient, for each spacing and treatment in 2022 and 2023. T0a and T0b correspond to No Fertilising Application in C1 and C2, respectively, T1 corresponds to Recommended Fertilisation and T2 corresponds to Over-Recommended Fertilisation. The values are expressed in kg ha−1.
SpacingTreatmentNPK
202220232022202320222023
C1T0a000000
T24716192737108
C2T0b000000
T137747122750
Table 2. ANOVA p-values for treatment class grouped by cultivar. p-values in bold represent significant differences, for a significance level of <0.05.
CultivarNPK
202220232022202320222023
’Azeiteira’0.0030.0000.0030.0000.1140.040
’Arbequina’0.0000.0000.0030.0000.1730.000
’Koroneiki’0.6060.0000.0010.3400.4610.502
Table 3. Validation and test set metrics of the best algorithm after hyperparameter optimisation for multispectral data.
NutrientModelValidationTest
R 2 MAE(%) R 2 MAE (%)
NExtra Trees0.32311.850.45013.02
PExtra Trees0.7122.710.7462.52
KNuSVR0.6628.230.7338.26
Table 4. Validation and test set metrics of the best algorithm after hyperparameter optimisation for the FLAME spectrometer data.
NutrientModelValidationTest
R 2 MAE(%) R 2 MAE (%)
NGradient Boosting0.46311.010.64410.49
PPLS0.7212.870.6323.31
KK-Neighbors0.5948.770.7108.27
Table 5. Validation and test set metrics of the best algorithm after hyperparameter optimisation for the spectrometer data when filtered to include only the five bands utilised by the multispectral camera.
NutrientModelValidationTest
R 2 MAE(%) R 2 MAE (%)
NExtra Trees0.14113.720.39113.30
PK-Neighbors0.7172.920.7982.43
KExtra Trees0.5928.830.5959.25
Table 6. Test set metrics for vegetation indices extracted from the multispectral camera.
NutrientModel R 2 MAE (%)
NAutomatic Relevance Determination0.22216.11
PNuSVR0.7042.91
KHistogram-based Gradient Boosting0.6678.31
Table 7. Test set metrics for the reflectance values and derived vegetation indices extracted from the multispectral camera.
NutrientModel R 2 MAE (%)
NExtra-Trees0.30914.93
PNuSVR0.6382.81
KNuSVR0.7547.99
Table 8. Results for the multispectral test set split by year.
Nutrient20222023
R 2 MAE (%) R 2 MAE (%)
N0.43214.080.37511.95
P0.7732.690.6552.35
K0.7129.210.5657.30
Table 9. Results for the spectrometer test set split by year.
Nutrient20222023
R 2 MAE (%) R 2 MAE (%)
N0.6789.380.5487.15
P0.63210.880.59510.08
K0.7303.280.4053.35
Disclaimer/Publisher’s Note: The statements, opinions and data contained in all publications are solely those of the individual author(s) and contributor(s) and not of MDPI and/or the editor(s). MDPI and/or the editor(s) disclaim responsibility for any injury to people or property resulting from any ideas, methods, instructions or products referred to in the content.