Article

Refractance Window Drying as an Alternative Method for Brewer’s Spent Grain Preservation

by
Neiton C. Silva
,
Andressa O. Santos
,
Claudio R. Duarte
and
Marcos A. S. Barrozo
*
Faculty of Chemical Engineering, Federal University of Uberlândia, Block K, Santa Monica Campus, Uberlandia 38400-902, Minas Gerais, Brazil
*
Author to whom correspondence should be addressed.
Appl. Biosci. 2024, 3(1), 71-86; https://doi.org/10.3390/applbiosci3010005
Submission received: 23 November 2023 / Revised: 11 January 2024 / Accepted: 22 January 2024 / Published: 1 February 2024

Abstract

:
Brewer’s spent grain (BSG) is a residue that holds significant potential for various applications. Given its inherently high moisture levels, it becomes imperative to explore methods for preserving it. This study investigates the use of refractance window (RW) for drying BSG. The final moisture content, water activity, and drying kinetics were assessed. Various kinetic models were analyzed, including Lewis, Page, Overhults, Brooker, and Midilli. Employing a central composite design, this study also investigated the effects of the variables temperature (55.9 to 84.1 °C) and drying time (1.6 to 4.4 h) on the quality of the dried product. The quality was assessed based on the content of bioactive compounds: phenolics, flavonoids, citric acid, and ascorbic acid. The results suggest that refractance window (RW) drying can yield a product with reduced moisture content and water activity levels (lower than 10.0% and 0.600, respectively). The phenolic, flavonoid, and citric acid higher contents were found at 70 °C and 3 to 4 h of drying. The best ascorbic acid results were found at 55 to 65 °C after 3 h of drying. The use of RW emerges as an interesting alternative for processing BSG, offering a sustainable approach to better utilize this residue.

1. Introduction

Beer is one of the most popular and widely consumed beverages globally. The primary raw material in the brewing process is barley, which undergoes a series of steps such as malting, maceration, and mashing, ultimately yielding brewer’s wort. This liquid undergoes fermentation and maturation processes to achieve the final product. Through this brewing journey, a by-product is generated in significant quantities, commonly known as beer bagasse and internationally recognized as “brewer’s spent grain” [1,2,3].
Brewer’s spent grain (BSG) stands as the most abundant by-product generated from the brewing process, constituting approximately 85% of the total residues generated. It comprises the insoluble components of barley grains, including husks, pericarp, and fragments, obtained post-mashing. Roughly 20 kg of wet BSG is generated from every 100 L of brewed beer, accounting for an average of 30% of the original weight of the barley used in the process. Historically, BSG has been directed toward two main outlets: disposal in landfills or utilization as low-value feed for livestock. However, recent studies have explored alternative applications for BSG [4,5,6,7].
The primary constituents of BSG include fibers (30–50% w/w) and proteins (19–30%), which are fundamental nutritional components in the human diet, rendering this material appealing for enhancing the nutritional value of food [8,9,10]. BSG has been identified as rich in minerals such as calcium, magnesium, silicon, and phosphorus, along with vitamins from the E and B groups, including B1, B2, B3, B5, B6, B7, B8, and B9. Amino acids such as leucine, valine, alanine, serine, glycine, glutamic, and aspartic acids are also present in this material [2,6]. Additionally, antioxidant compounds such as phenolic acids, flavonoids, tannins, and proanthocyanidins have been identified in brewer’s spent grain, garnering increased attention for their potential health and nutraceutical benefits [11,12,13,14,15].
However, a limitation in the utilization of BSG arises from its high moisture content, which, coupled with its rich fiber and protein content, renders the material susceptible to rapid microbial growth and spoilage. Therefore, a preservation methodology such as drying becomes necessary [2,4,16]. The most prevalent technique for drying brewer’s spent grain (BSG) involves convective drying, utilizing hot air through methods such as oven drying and fixed bed drying. However, studies have indicated that optimal quality results are typically achieved at lower temperatures (above 60 °C) using these methods, leading to extended drying times and imposing limitations on the overall process [4,15]. Although research on alternative drying methods for brewer’s spent grain is limited in the literature, notable mentions include the use of freeze-drying [16] and superheated steam [17]. However, these methods are constrained by their high associated costs.
Refractance window (RW) drying emerges as an innovative and promising methodology. In this technique, the material is spread on the upper surface of a flexible support, commonly made of plastic films, such as Mylar®, while its lower surface is in contact with a hot fluid (e.g., hot water or steam). This system is commonly employed for converting liquid, pasty foods, viscous suspensions, and other related biomaterials into films, powders, sheets, or flakes with added value [18,19,20,21]. Importantly, it holds potential for use with various materials, including brewer’s spent grain.
The RW drying process involves the active participation of all three modes of heat transfer: conduction, convection, and radiation. The thermal energy in the RW is derived from the heated fluid, transmitted through the film by means of conduction and radiation. When a high-moisture material is spread over the film, the refractive index between the water and material approaches, reducing reflection at the interface and increasing the transmissivity of radiant energy to the product. This configuration forms a “window” through which radiation can pass. The thermal damage is minimized during drying stages with lower moisture content, as the film is typically a poor conductor of heat [19,22,23].
In general, temperatures experienced by the material during the initial and intermediate stages of drying are approximately 20 to 25 °C lower than those of the hot fluid, preventing overheating. Compared to conventional methods such as convective and freeze-drying, RW drying boasts shorter processing times and higher energy efficiency [19,22,23]. The refractance window technique has demonstrated success in processing a diverse range of biomaterials, including tomatoes [22], strawberries [24], carrots [24], mangoes [25], açaí [26], guavas [27], passion fruit [28], bananas [29], onion [30], apples [31], and even unconventional items like yogurt [32] and microalgae [33].
The objective of this study was to investigate the application of refractance window (RW) drying for processing brewer’s spent grain (BSG), with a focus on analyzing the effects of operating variables on moisture removal, water activity (aw), and kinetics. Additionally, the quality of the resulting product was assessed by quantifying bioactive compounds, including total phenolics, total flavonoids, citric acid, and ascorbic acid contents.

2. Materials and Methods
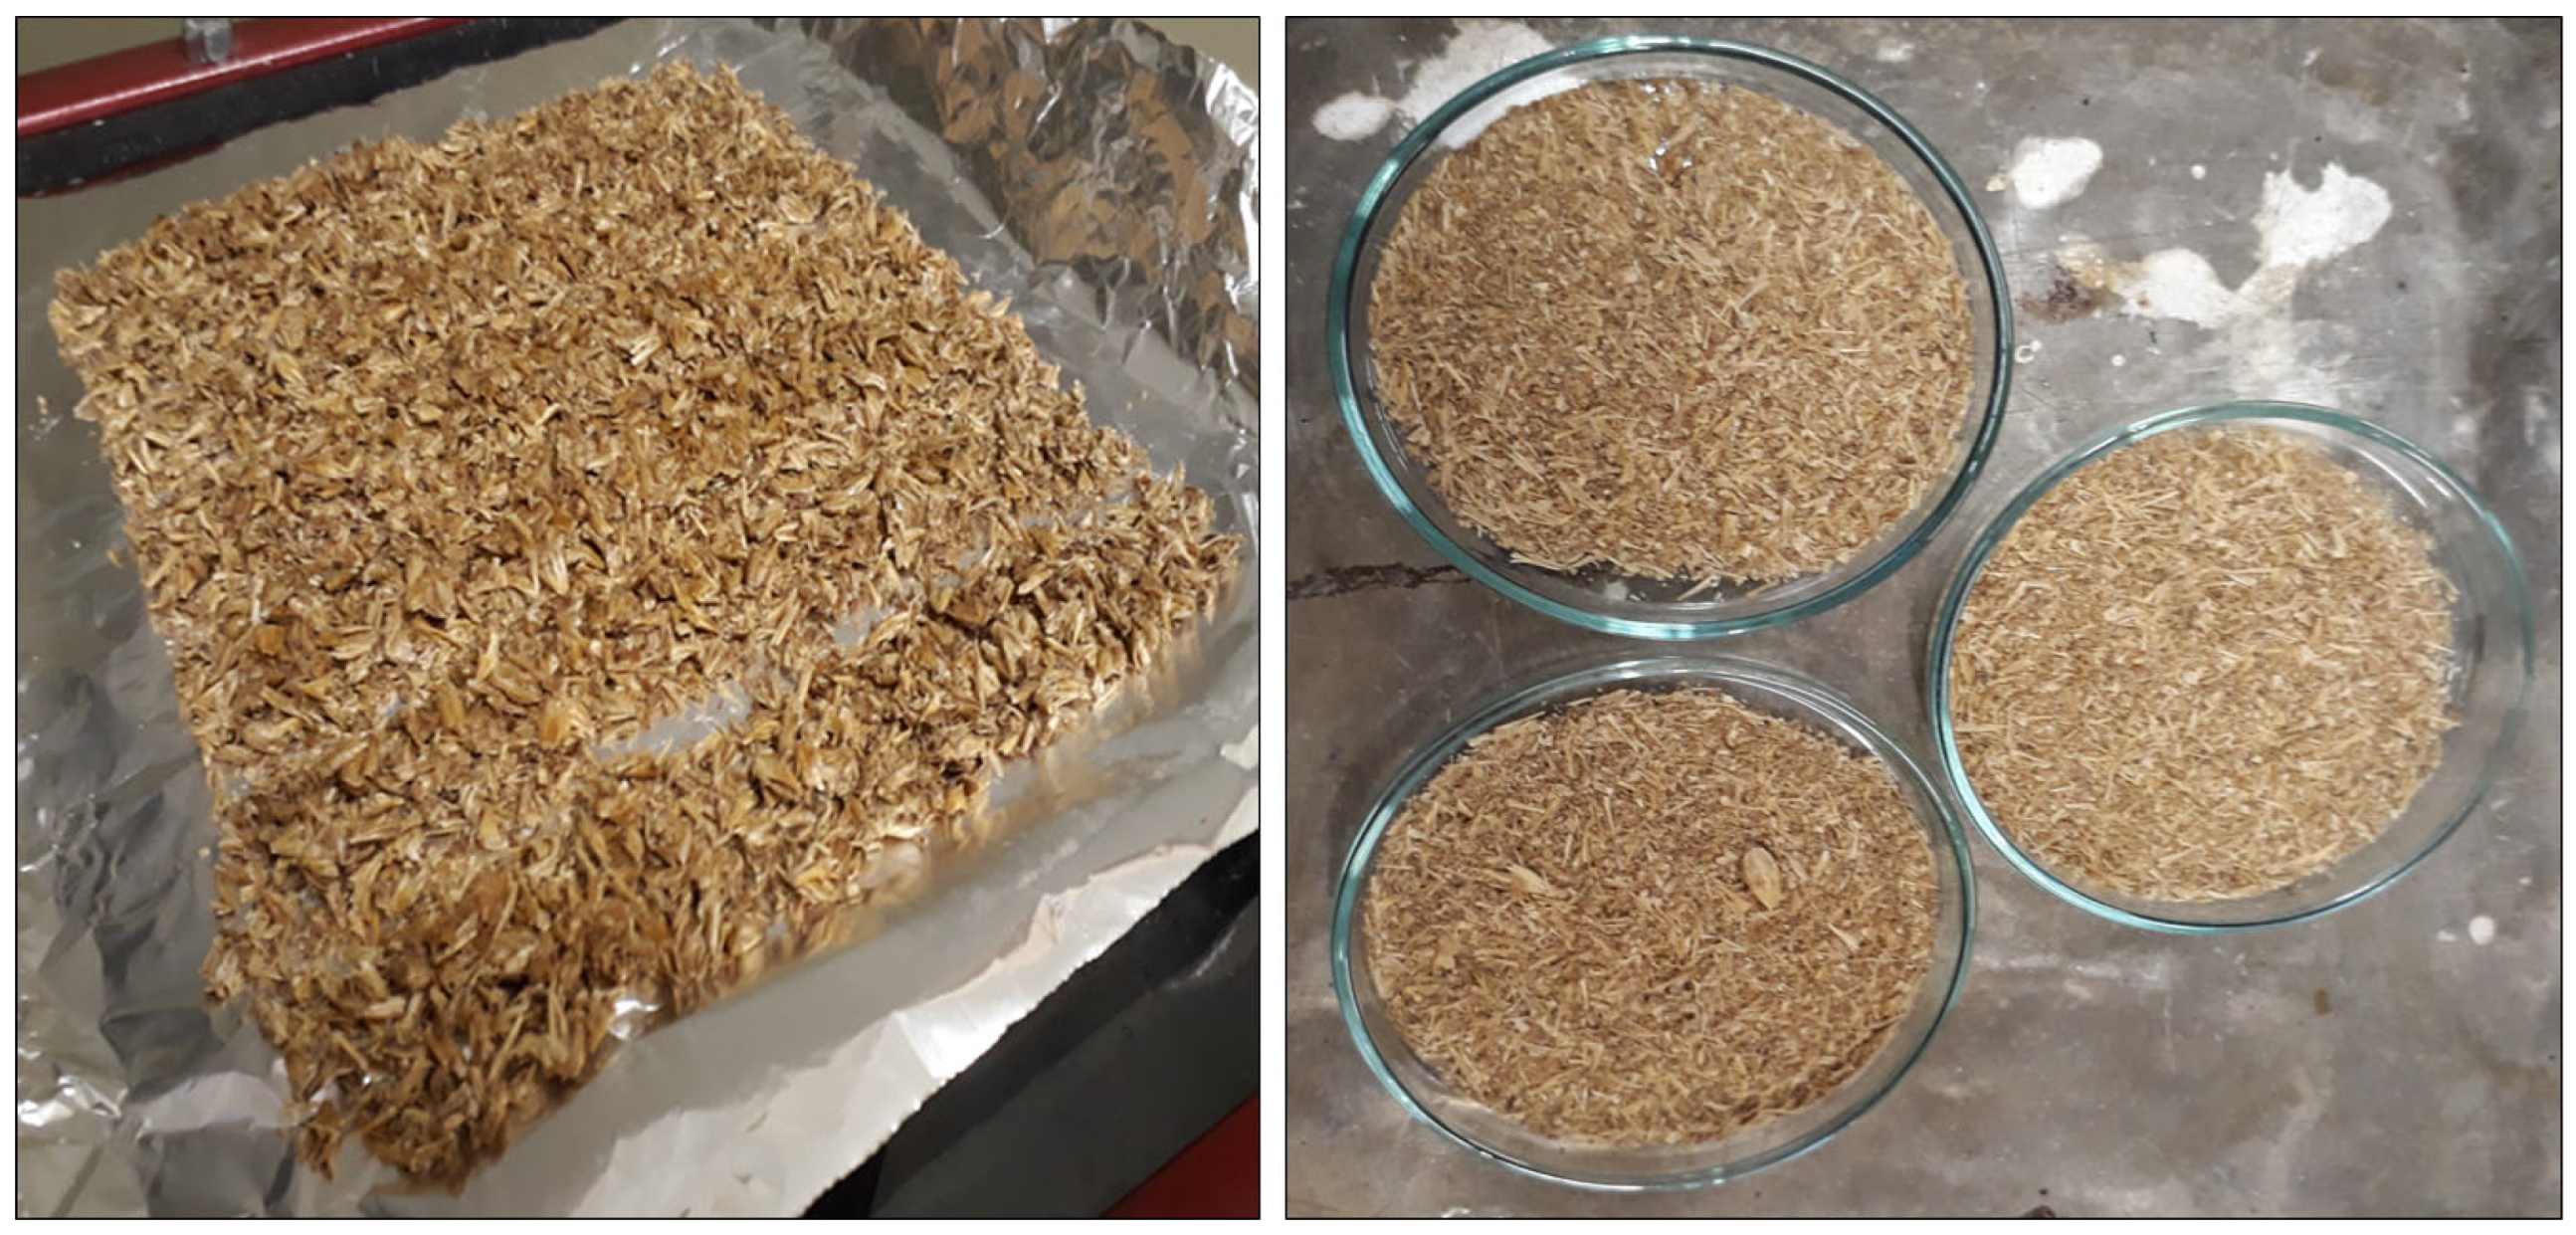
2.1. Raw Material

The brewer’s spent grain utilized in this study was sourced from Überbräu brewery, located in Uberlândia, Minas Gerais state, Brazil. The material was obtained following the mashing and filtration of a wort composed of 100% barley malt, with no presence of adjuncts such as corn or grits. Before its utilization in the experiments, the material was stored in sealed polyethylene packages in small portions and kept frozen in a freezer at −18 °C until the commencement of the experiments.

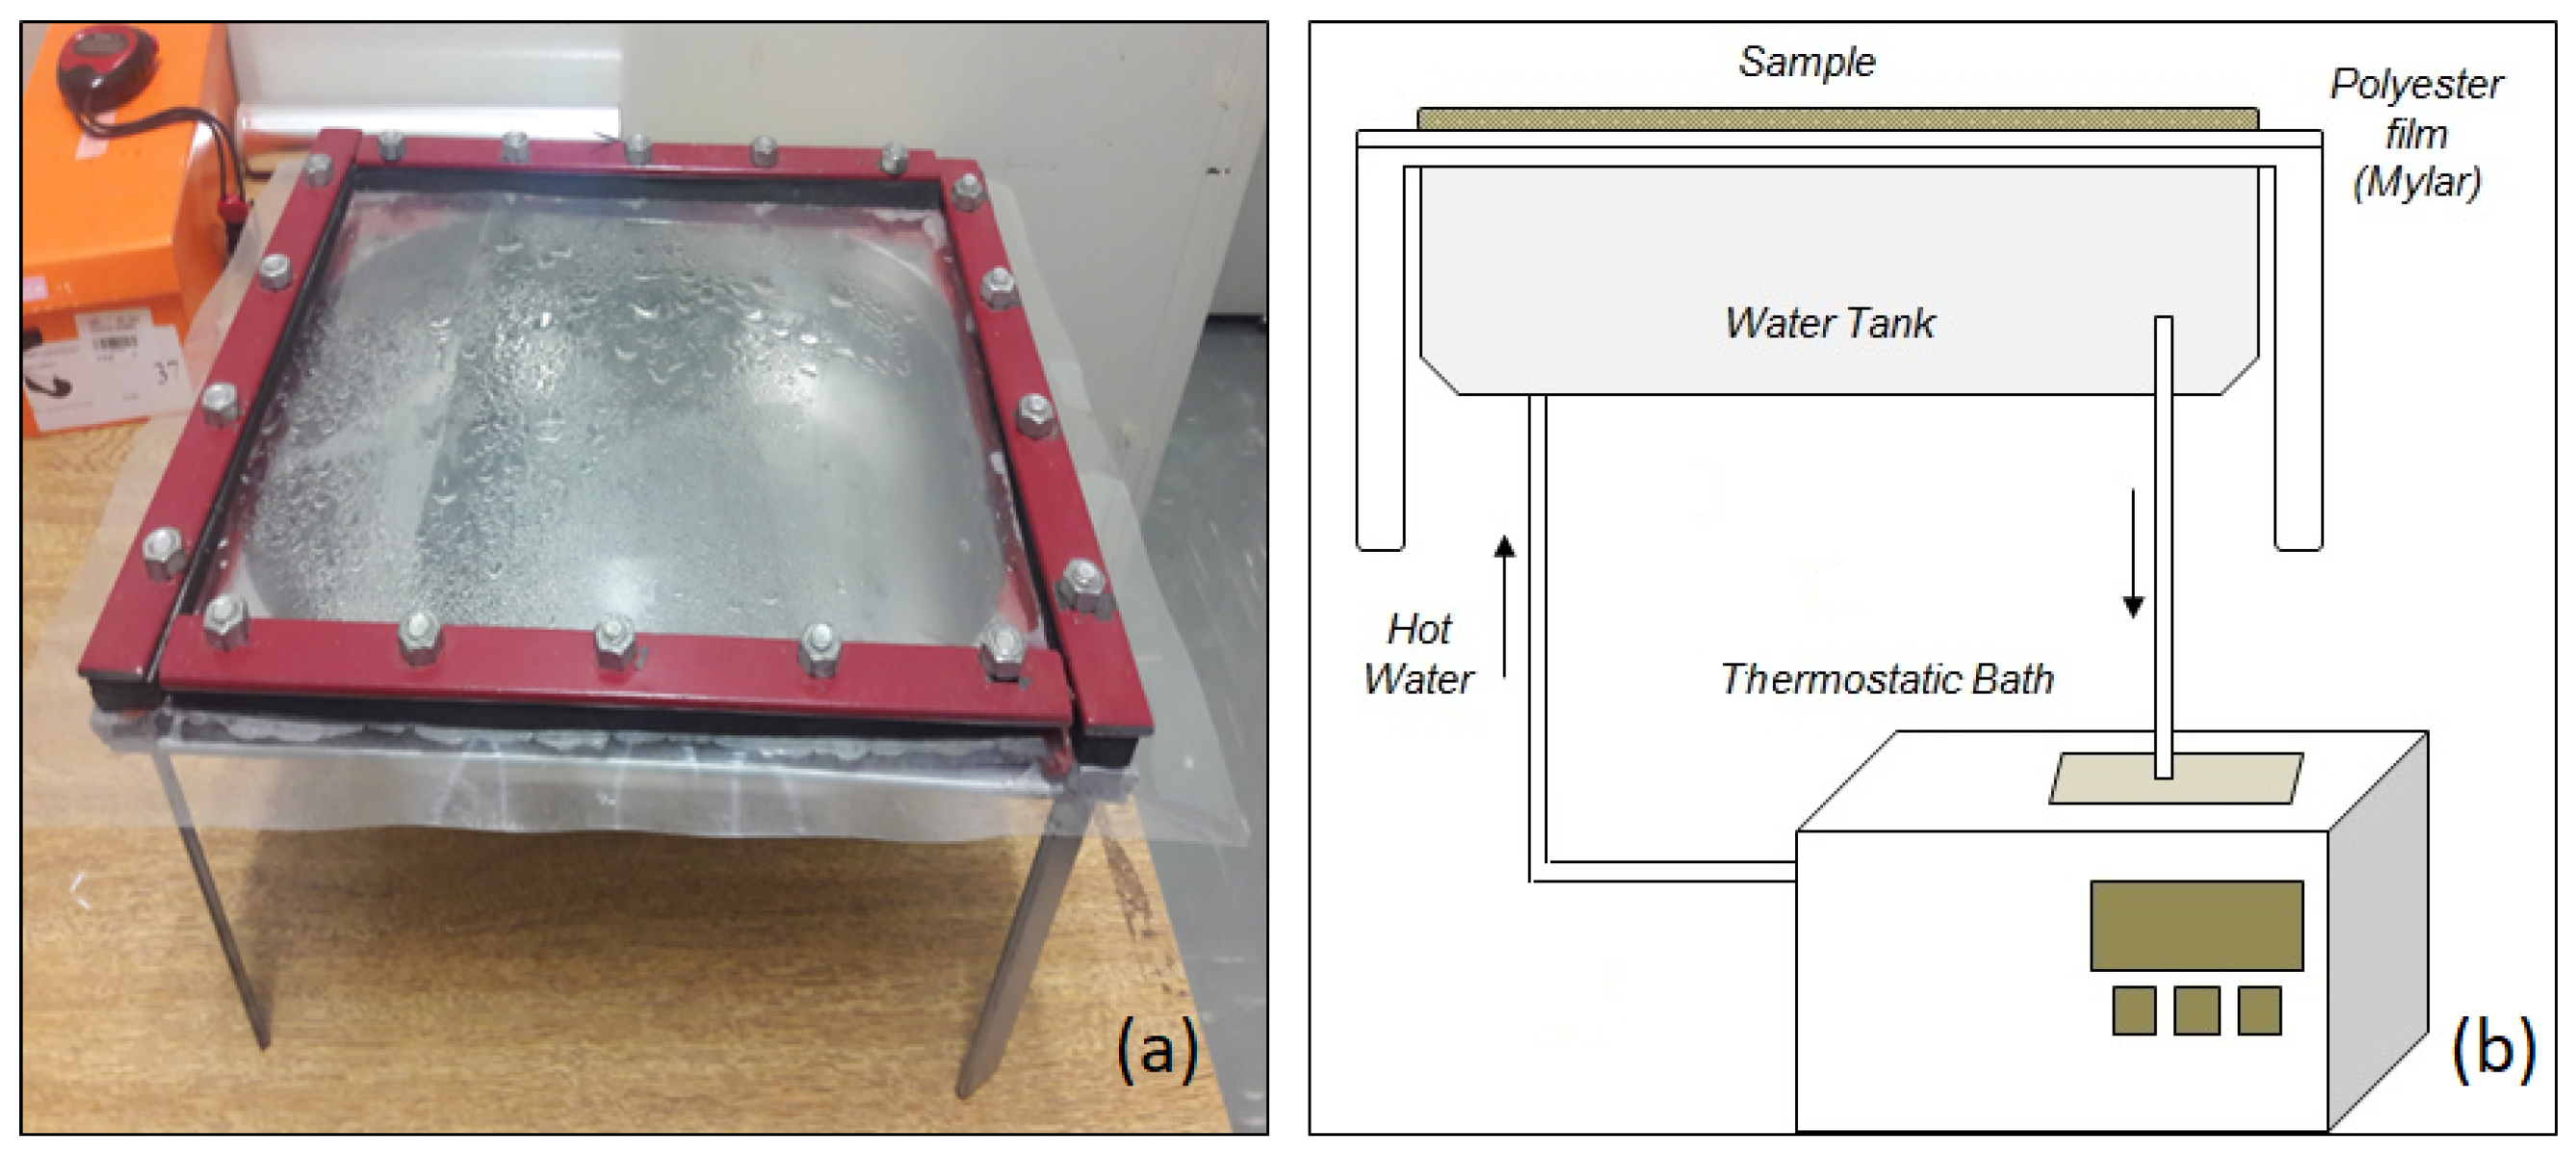
2.2. Experimental Apparatus

The lab-scale batch dryer utilizing refractance window (RW) technology, as employed in this study, is depicted in Figure 1. The apparatus comprised an aluminum reservoir (28.0 cm × 20.0 cm × 8.0 cm), filled with circulating hot water supplied by a thermostatic bath (Tecnal, TE-184, Piracicaba, SP, Brazil), operating within a closed system. The chosen support for this equipment was the polyester film Mylar® type D (DuPont, Wilmingron, DE, USA), with a thickness of 0.25 mm. The film was secured on the top of the reservoir frame, ensuring the complete contact of the film’s bottom surface with the hot water. The water temperature was regulated and monitored by the temperature control system of the thermostatic bath (±0.1 °C).
For each experiment, approximately 75.0 g of fresh brewer’s spent grain was utilized. The samples were arranged on an aluminum foil placed over the Mylar® film, which was divided into rectangles with 15.0 × 2.0 cm with a thickness of 0.50 cm, using a plastic support. The inclusion of aluminum foil aimed to ease the sample collection and facilitate the measurement of moisture level and kinetics during the tests. The samples were weighed during the experiments. This procedure has been previously employed successfully in the RW drying of other materials, and its application did not significantly impact the results [33].

2.3. Experimental Design

Initial tests were conducted at three different hot water temperatures (60, 70 and 80 °C) to assess the moisture removal behavior of BSG during refractance window drying. Subsequent to the analysis of these initial tests, an experimental design was implemented to assess the effects of operating variables on the content of bioactive compounds. The experiments were arranged in a rotational central composite design (CCD) comprising 10 experiments, with the effects of two independent variables analyzed: hot water temperature (T) and drying time (t). Table 1 presents the coded and real values for the independent variables.

2.4. Moisture and Water Activity (aw) Analysis

The moisture of both fresh and dried samples (wet basis) was determined using the oven method at 105 ± 3 °C for 24 h, following the Association of Official Analytical Chemists methodology (AOAC) [34]. Water activity (aw) was measured using a Novasina LabSwift RS 232/RTD-200 m (Novasina, Zurich, Switzerland), a portable water activity device. This equipment calculates the aw using a temperature control system integrated with an infrared sensor, and the aw results are provided on a scale of 0.000 to 1.000, with a precision of ±0.001. All measurements were conducted in triplicate.
The combined analysis of moisture and water activity (aw) is crucial for assessing the physic, chemical, and microbiologic stability of dried brewer’s spent grain samples. Existing research suggests that BSG dried to moisture levels below 10% is suitable for processing, storage, and transportation [1,35]. However, it is also imperative for food and biological materials to be dried to water activity levels below 0.600 [36,37]. At this point, the activity and growth of most bacteria, fungi, and yeast are inhibited. Simultaneously, aw levels lower than 0.200 may indicate excessive drying, potentially promoting undesirable reactions in the material, such as lipid oxidation [36,37].

2.5. Drying Kinetics

The dehydration kinetic equations are typically expressed in the form of the variation of a dimensionless moisture number, known as the moisture ratio (MR), as a function of time. The moisture ratio ( M R ) is given by Equation (1):
M R = M M e q M 0 M e q   ,
where M is the moisture content at any time, M e q   is the equilibrium moisture content, and M 0 is the initial moisture content.
A multitude of empirical and semiempirical equations have been proposed in the literature to characterize the drying kinetics of biological materials [38,39]. Table 2 provides the drying kinetic equations assessed in this study, with k, n, A, and B representing the model parameters. The selection of the most appropriate kinetic model for predicting the refractance window experimental results was based on a statistical analysis, taking into account the correlation coefficient (R2), the significance of parameters, the distribution of residues, and statistical parameters such as the sum of the squared error (SSE) and mean square error (RMSE) [40,41].

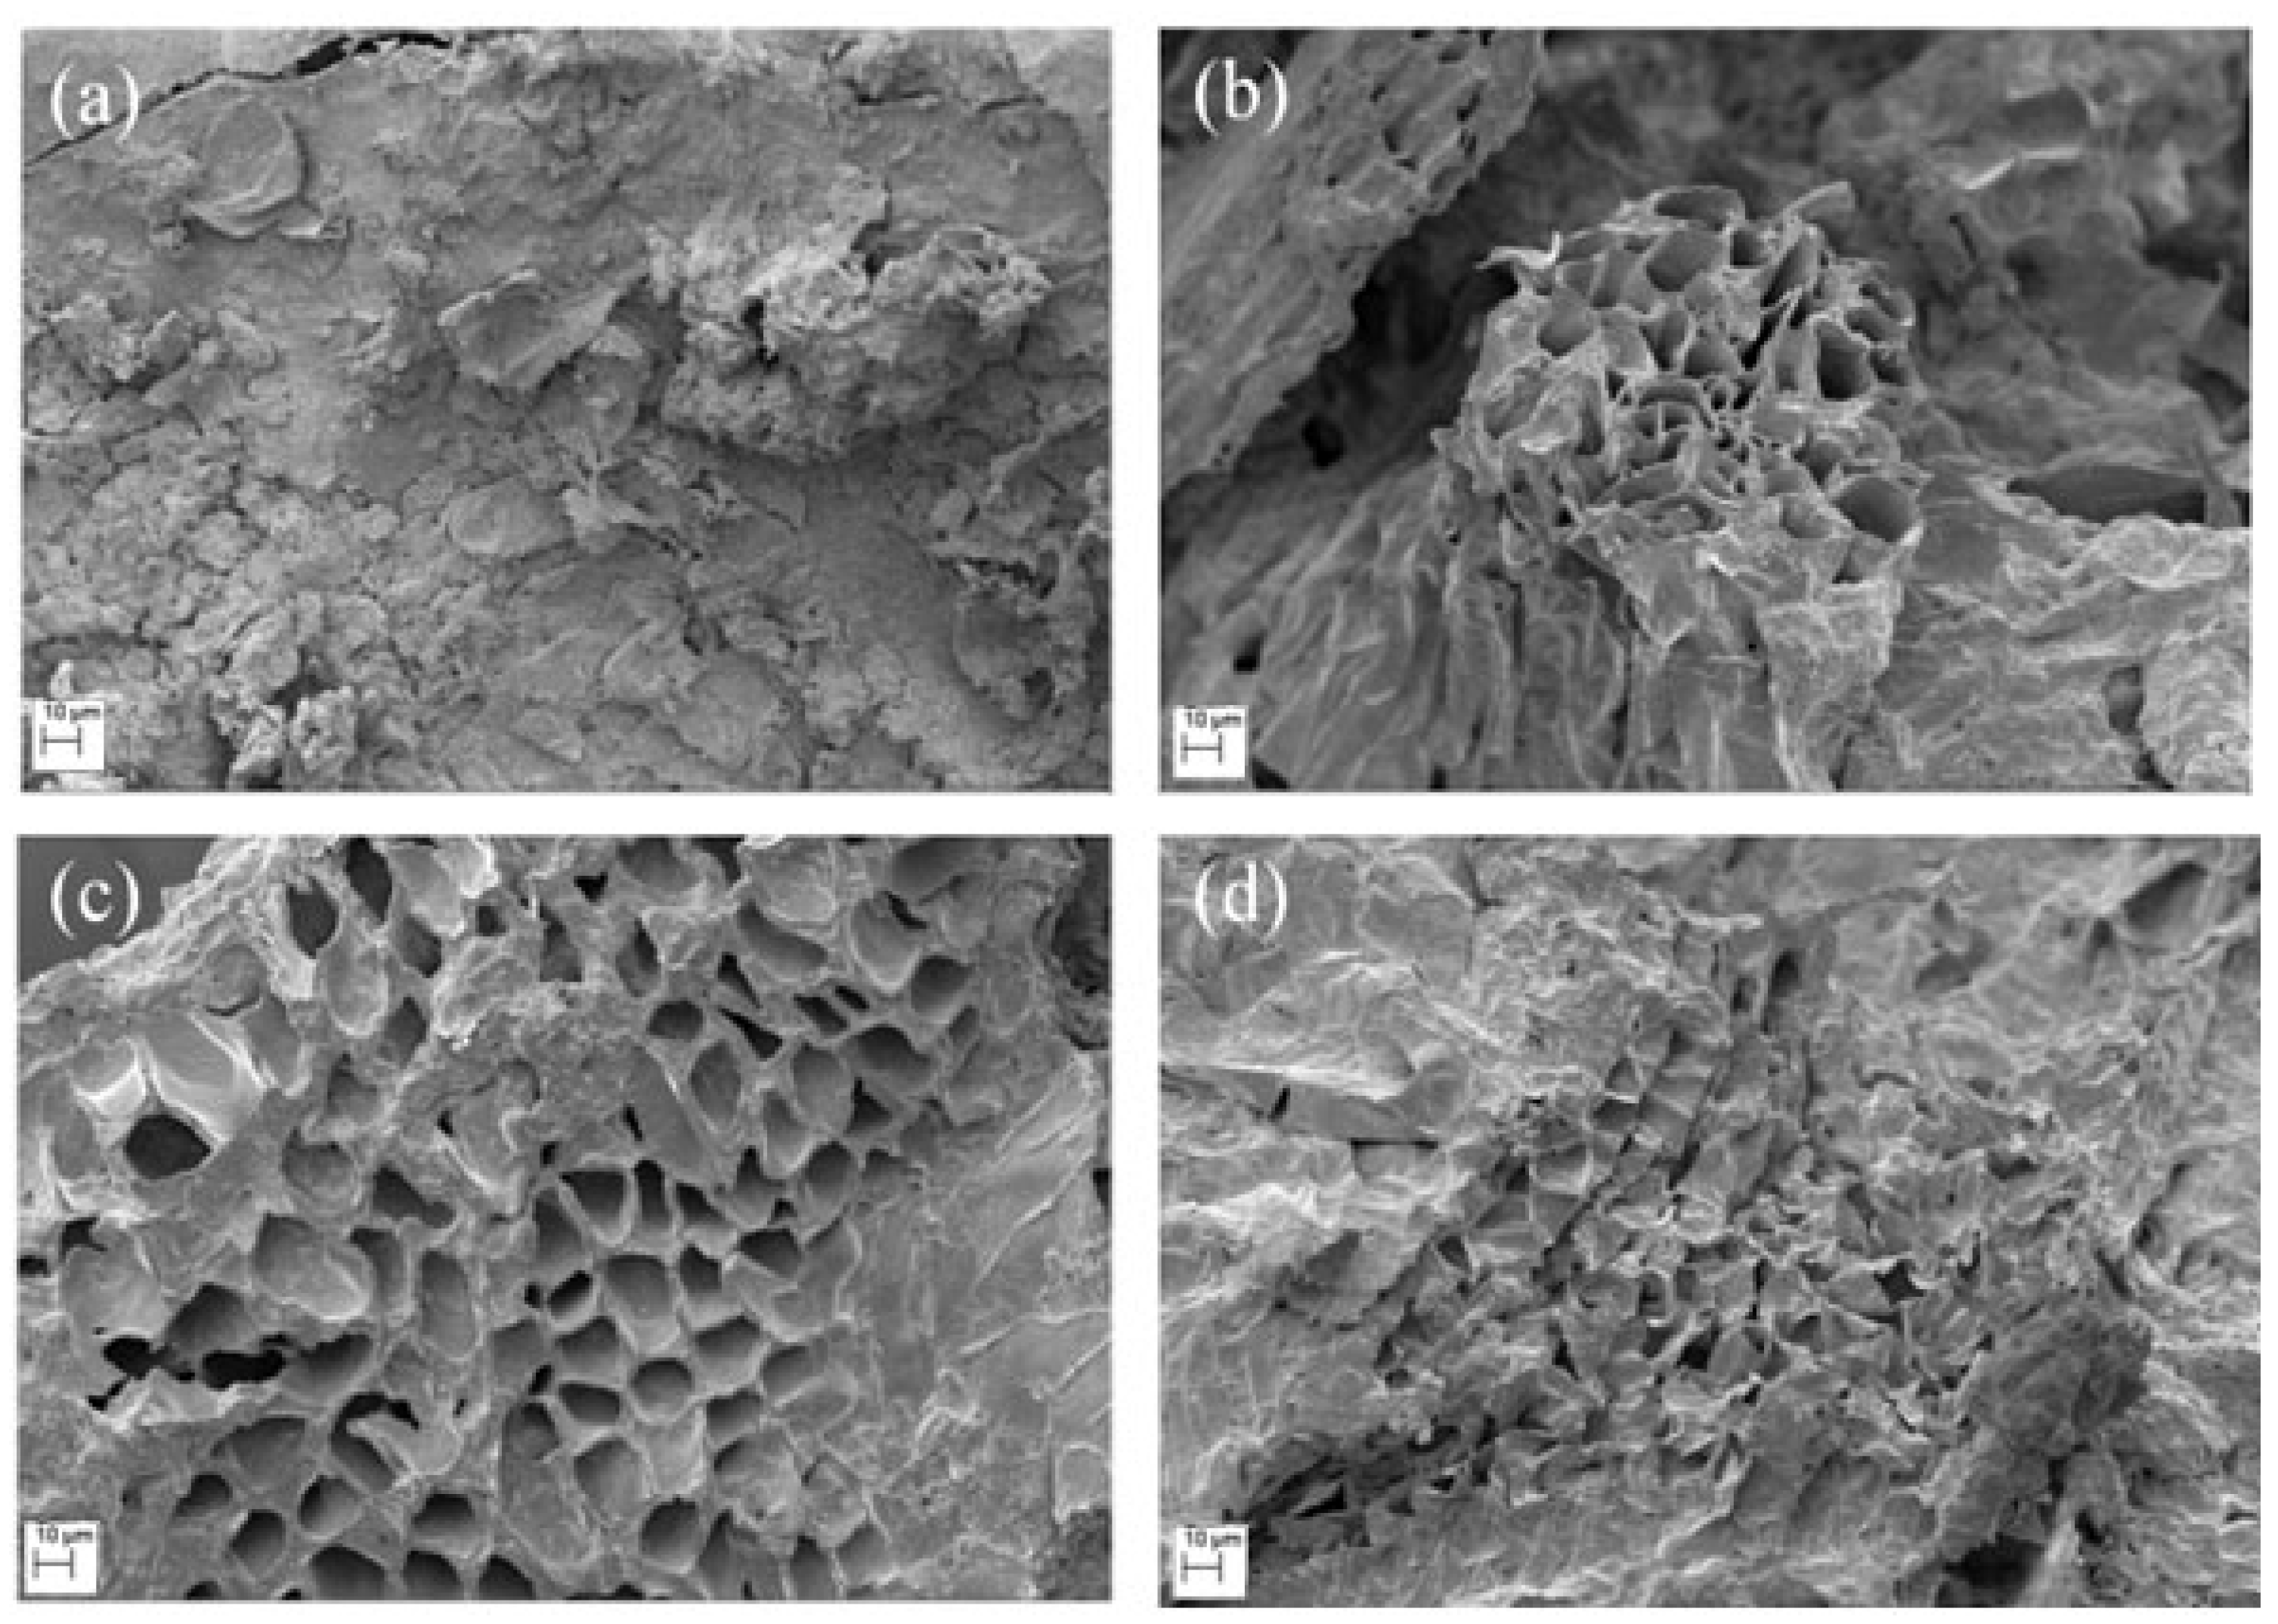
2.6. Scanning Electron Microscopy (SEM)

The scanning electron microscopy (SEM) technique was employed to assess the microstructural characteristics of the samples and identify any potential physical changes occurring during RW drying [37]. Fresh and dried BSG were examined using a Carl Zeiss microscope, EVO MA 10. The samples were affixed to microscope supports using conductive carbon tape and subsequently metallized with gold (Leica, SCD 050). A 10-kV acceleration voltage was applied during the SEM analysis.

2.7. Analysis of Bioactive Compounds

The measurement of bioactive compound content in brewer’s spent grain samples aimed to assess the influence of RW operational conditions on the quality of the final product. All analyses were conducted in triplicate, and the content of bioactive compounds was expressed as the mean value ± standard deviation. The results underwent evaluation through multifactorial analysis of variance (ANOVA) with a 90% confidence level. For each response, a multiple regression equation was fitted and analyzed using response surface methodology (RSM). Statistical parameters as R2, SSE, RMSE, and p-value were evaluated. Statistical analyses were performed using the Statistica v.12 software package (Statsoft).

2.7.1. Total Phenolic Content (TPC)

The total phenolic content was determined with the Folin–Ciocalteau method [47], using gallic acid (C7H6O5) as the standard. Spectrophotometric readings were performed at 622 nm (V1200 spectrophotometer, VWR, Leuven, Belgium). The results are expressed in milligrams of gallic acid per 100 g of sample (dry matter).

2.7.2. Total Flavonoid Content (TFC)

The quantification of total flavonoid content was conducted using the colorimetric method described by Zhishen et al. [48], with rutin (C27H30O16) as the standard. Spectrophotometric readings were taken at 450 nm (V1200 spectrophotometer, VWR, Leuven, Belgium). The results are expressed in milligrams of rutin per 100 g of sample (dry matter).

2.7.3. Acidity or Citric Acid Content (CA)

The analysis of citric acid (C6H8O7) content in the samples, expressed as total titratable acidity, was conducted through titration using standardized 0.1 N sodium hydroxide (NaOH), following the AOAC’s official method [34]. The results were expressed in milligrams of citric acid per 100 g of sample (dry matter).

2.7.4. Ascorbic Acid Content (AA)

The determination of ascorbic acid or vitamin C (C6H8O6) content was conducted using the titration method, which relies on the reduction of standardized 2,6-dichloroindophenol (C12H7NCl2O2) in the presence of oxalic acid (C2H2O4) [34]. The results were expressed in milligrams of ascorbic acid per 100 g of sample (dry matter).

3. Results and Discussion

3.1. General Considerations

The dried BSG obtained through refractance window drying exhibited a favorable appearance, color, and odor similar to those observed in the fresh material, as depicted in Figure 2. The material visibly reduced its moisture levels without apparent shrinkage or adherence on aluminum foil, facilitating easy removal at the end of the process.
No indications of browning, carbonization regions, or the release of undesirable odors were observed during the experiments, in contrast to observations made with BSG dried using conventional hot air drying techniques, as reported in the literature [2,4,16]. This was notable even when experiments were conducted at higher temperatures. The absence of these undesirable effects during the moisture removal process underscores the potential of refractance window drying as an alternative methodology for drying BSG. This technique demonstrated the capability to dry brewer’s spent grain with minimal physical damage, consistent with findings reported in other studies for other materials [19,20,24].

3.2. Initial Tests

The drying times, final moisture content (wet basis), and water activity (aw) obtained in the initial experiments at 60, 70, and 80 °C are presented in Table 3. The initial moisture content and aw of fresh BSG were 75.89% (wet basis) and 0.977, respectively, highlighting the need for a preservation method to facilitate the processing, storage, and transport of this material, as previously mentioned. The initial tests demonstrated that it was possible to reduce BSG moisture and aw levels to suitable conditions through RW drying, achieving moisture levels and aw below 10% and 0.600, respectively, both suitable for a dried material [1,35,36,37]. As anticipated, higher temperatures (T) resulted in shorter drying times (t), with a reduction of 44% observed when the temperature increased from 60 °C to 80 °C, for example.
Figure 3 illustrates scanning electron microscope (SEM) images of both the fresh and dried BSG samples The observation reveals that fresh brewer’s spent grain (BSG) (Figure 3a) exhibits a uniform and homogeneous structure, justifiably so, given that BSG is predominantly composed of barley husks, solid, and resistant vegetal structures [1,2,4]. In the BSG dried samples at 60, 70, and 80 °C (Figure 3b, Figure 3c, and Figure 3d, respectively), the material structure becomes porous with the presence of channels, a common indicator of the drying process as it signifies the paths through which water is removed. Another notable observation is that the images of the dried samples were quite similar, irrespective of the temperature employed in the experiments. This indicates that the refractance window (RW) methodology allows for a more uniform and homogeneous drying process, preventing issues such as overheating, as previously reported in the literature [22,23].
The estimated parameters and the analysis of variance of the drying kinetic models evaluated in this study are presented in Table 4. The model that most accurately represented the experimental data was the one by Midilli et al. [46], with a higher value of R2 and better statistical parameters. The results indicate that, for this model, as the temperature increased from 60 to 80 °C, the kinetic constant (k) demonstrated an increase of approximately 550%. This observation aligns with the understanding that this parameter is linked to the diffusivity of water through the material during the moisture removal process. It is well documented in the literature that diffusivity is highly influenced by temperature [49]. The kinetic curves obtained for the Midilli et al. [46] model are depicted in Figure 4.

3.3. Experimental Design Results

3.3.1. Moisture and Water Activity (aw)

After the initial tests, a new set of experiments was conducted to assess the effects of different temperatures (T) and drying times (t) on the content of bioactive compounds present in BSG after RW drying. The experimental design and the results of moisture content and water activity (aw) are presented in Table 5.
As observed and anticipated, conditions with lower temperatures and shorter processing times resulted in a product with higher moisture content and aw levels. For instance, in Experiment 1, with a moisture content of 35.20%, the aw was 0.947, close to that observed in fresh BSG (0.977, with a moisture of 75.89%). In Experiment 2, a moisture content of 10.80% led to a water activity above 0.600, which favors the growth of microorganisms and diminishes the shelf life of the product [36,37]. These findings align with recommendations in the literature, emphasizing that BSG should be dried to moisture levels below 10% [1,2,16].
Another noteworthy observation from the experiments was the sensibility of water activity results to small variations in moisture content. For example, in Experiment 2, with a moisture content of 10.80%, the aw was 0.648, whereas in Experiments 3, 9, and 10, with moisture levels ranging from 5.35 and 6.31%, the aw ranged from 0.428 to 0.525, values deemed suitable for dried material according to the literature [36,37]. However, in Experiments 8 and 4, with a moisture content of 4.85 and 2.87%, respectively, the aw was 0.195 and 0.151, indicating excessive drying time and the potential occurrence of undesirable reactions [36,37]. This emphasizes the need to maintain the moisture content within the range of 5 to 10% to ensure the quality of the dried material, underscoring the importance of meticulous control over drying variables during the moisture removal process, to avoid both inefficiency and excessive processing.

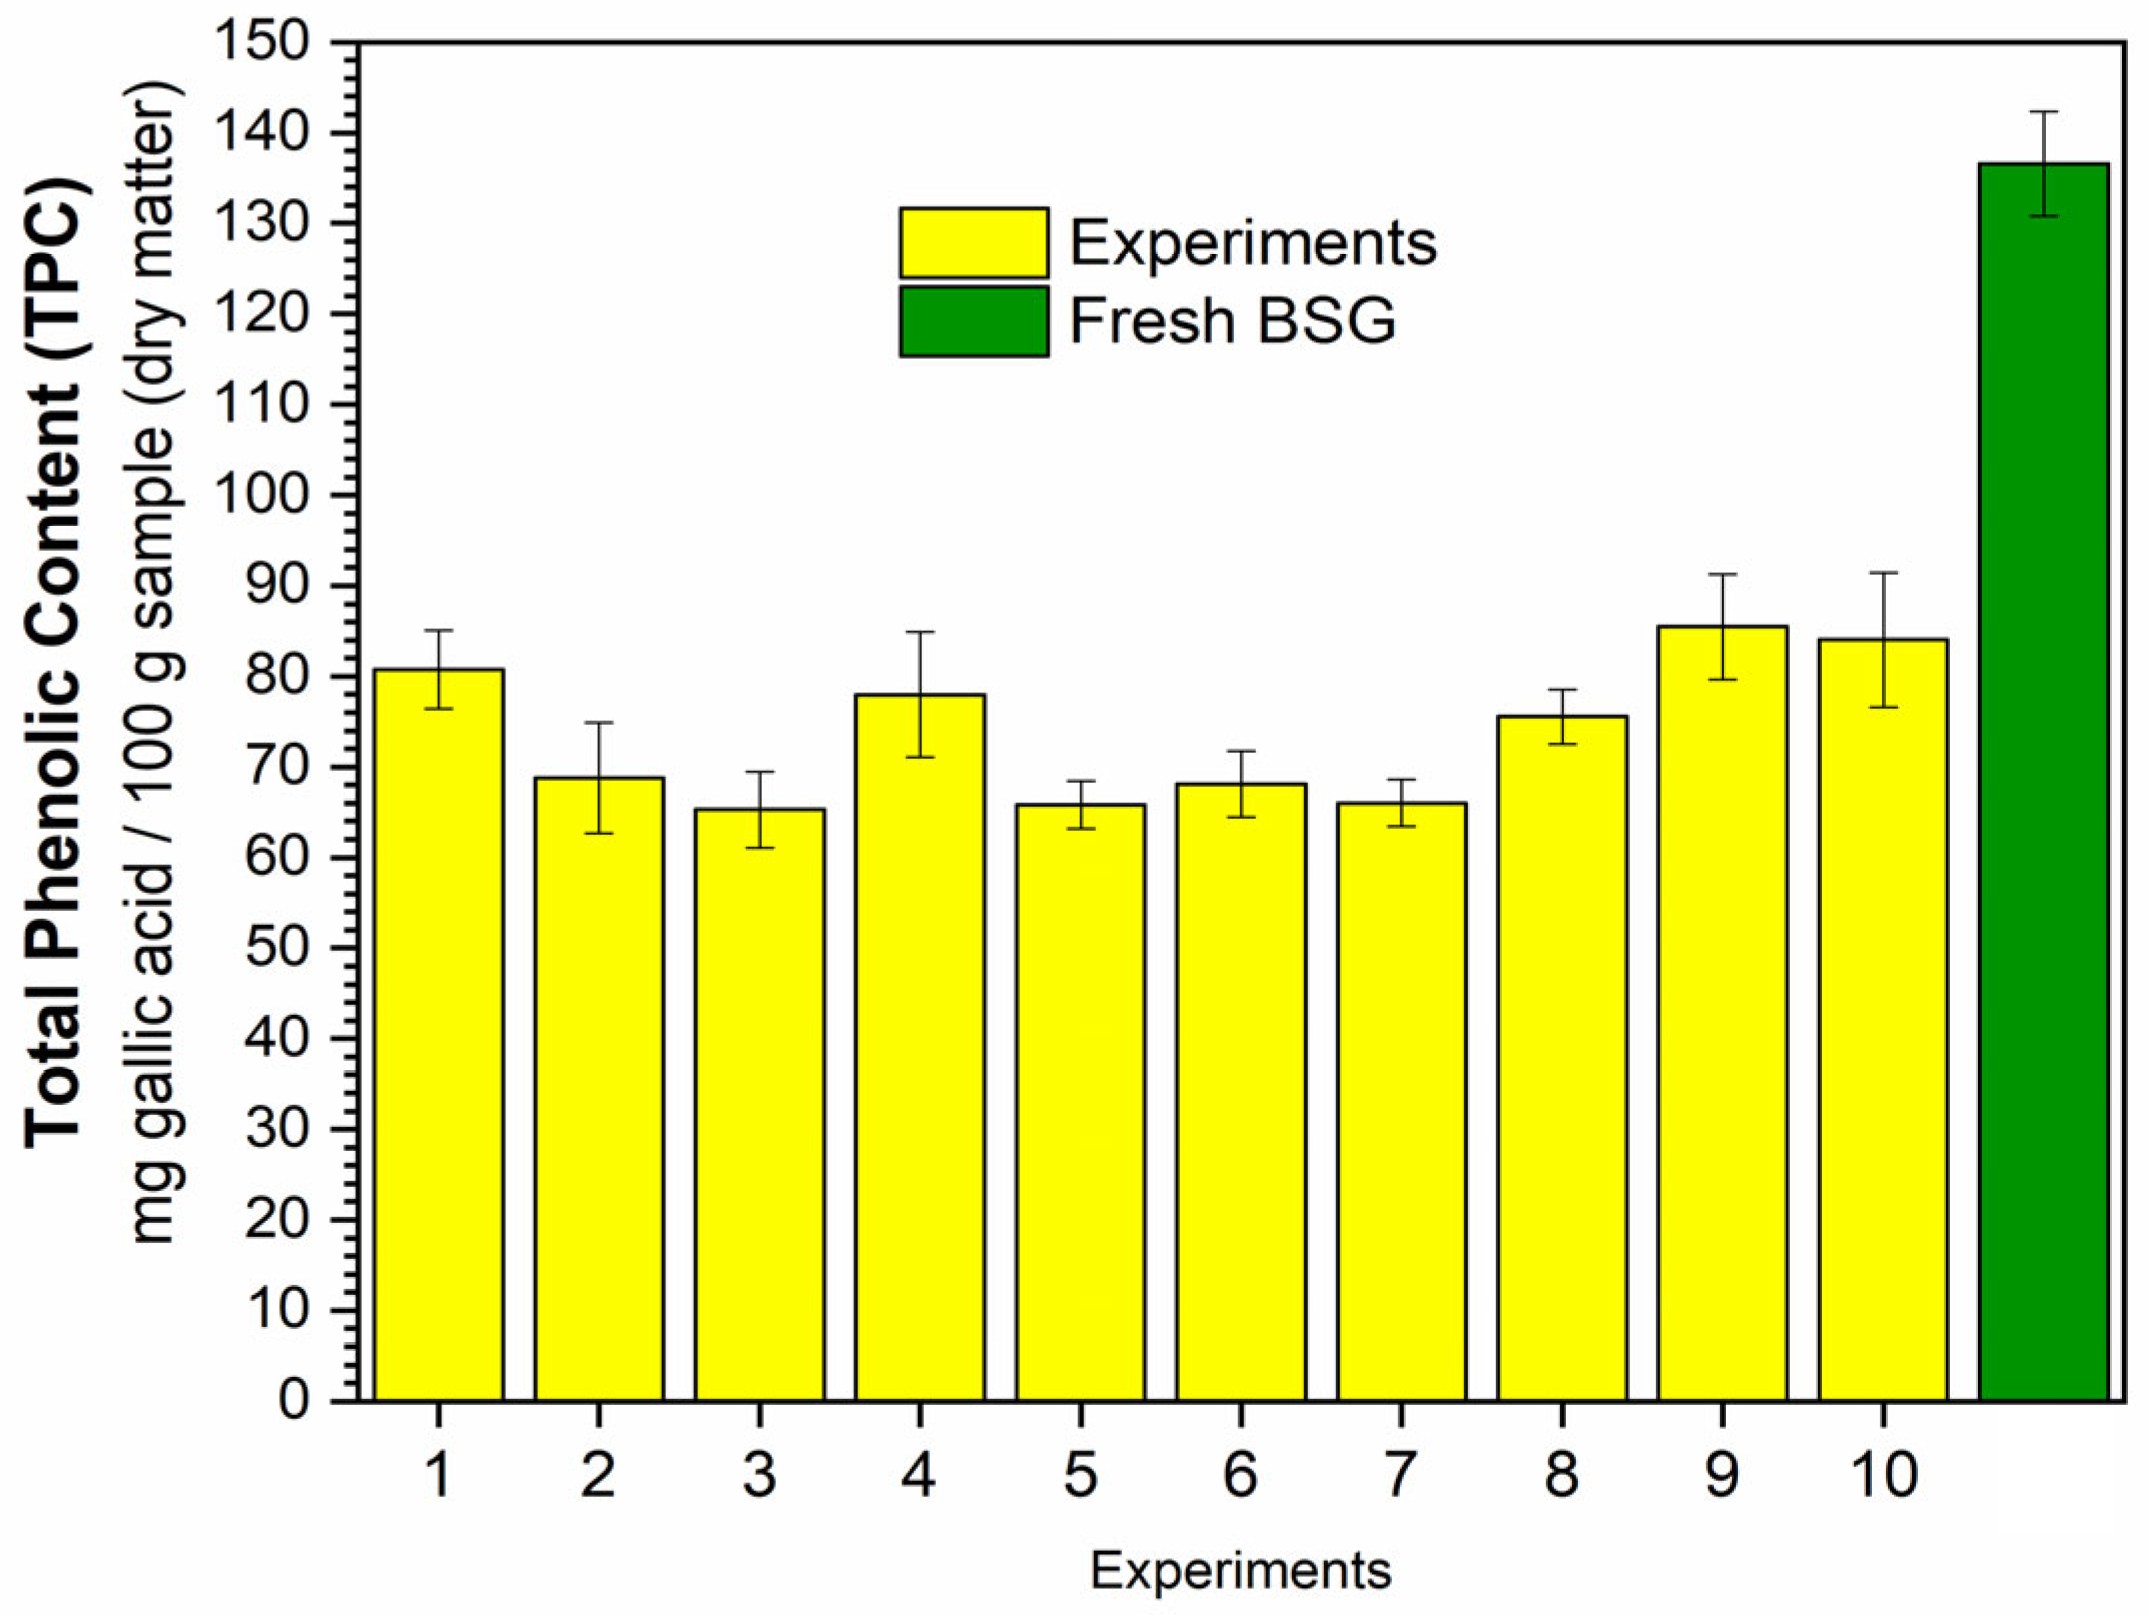
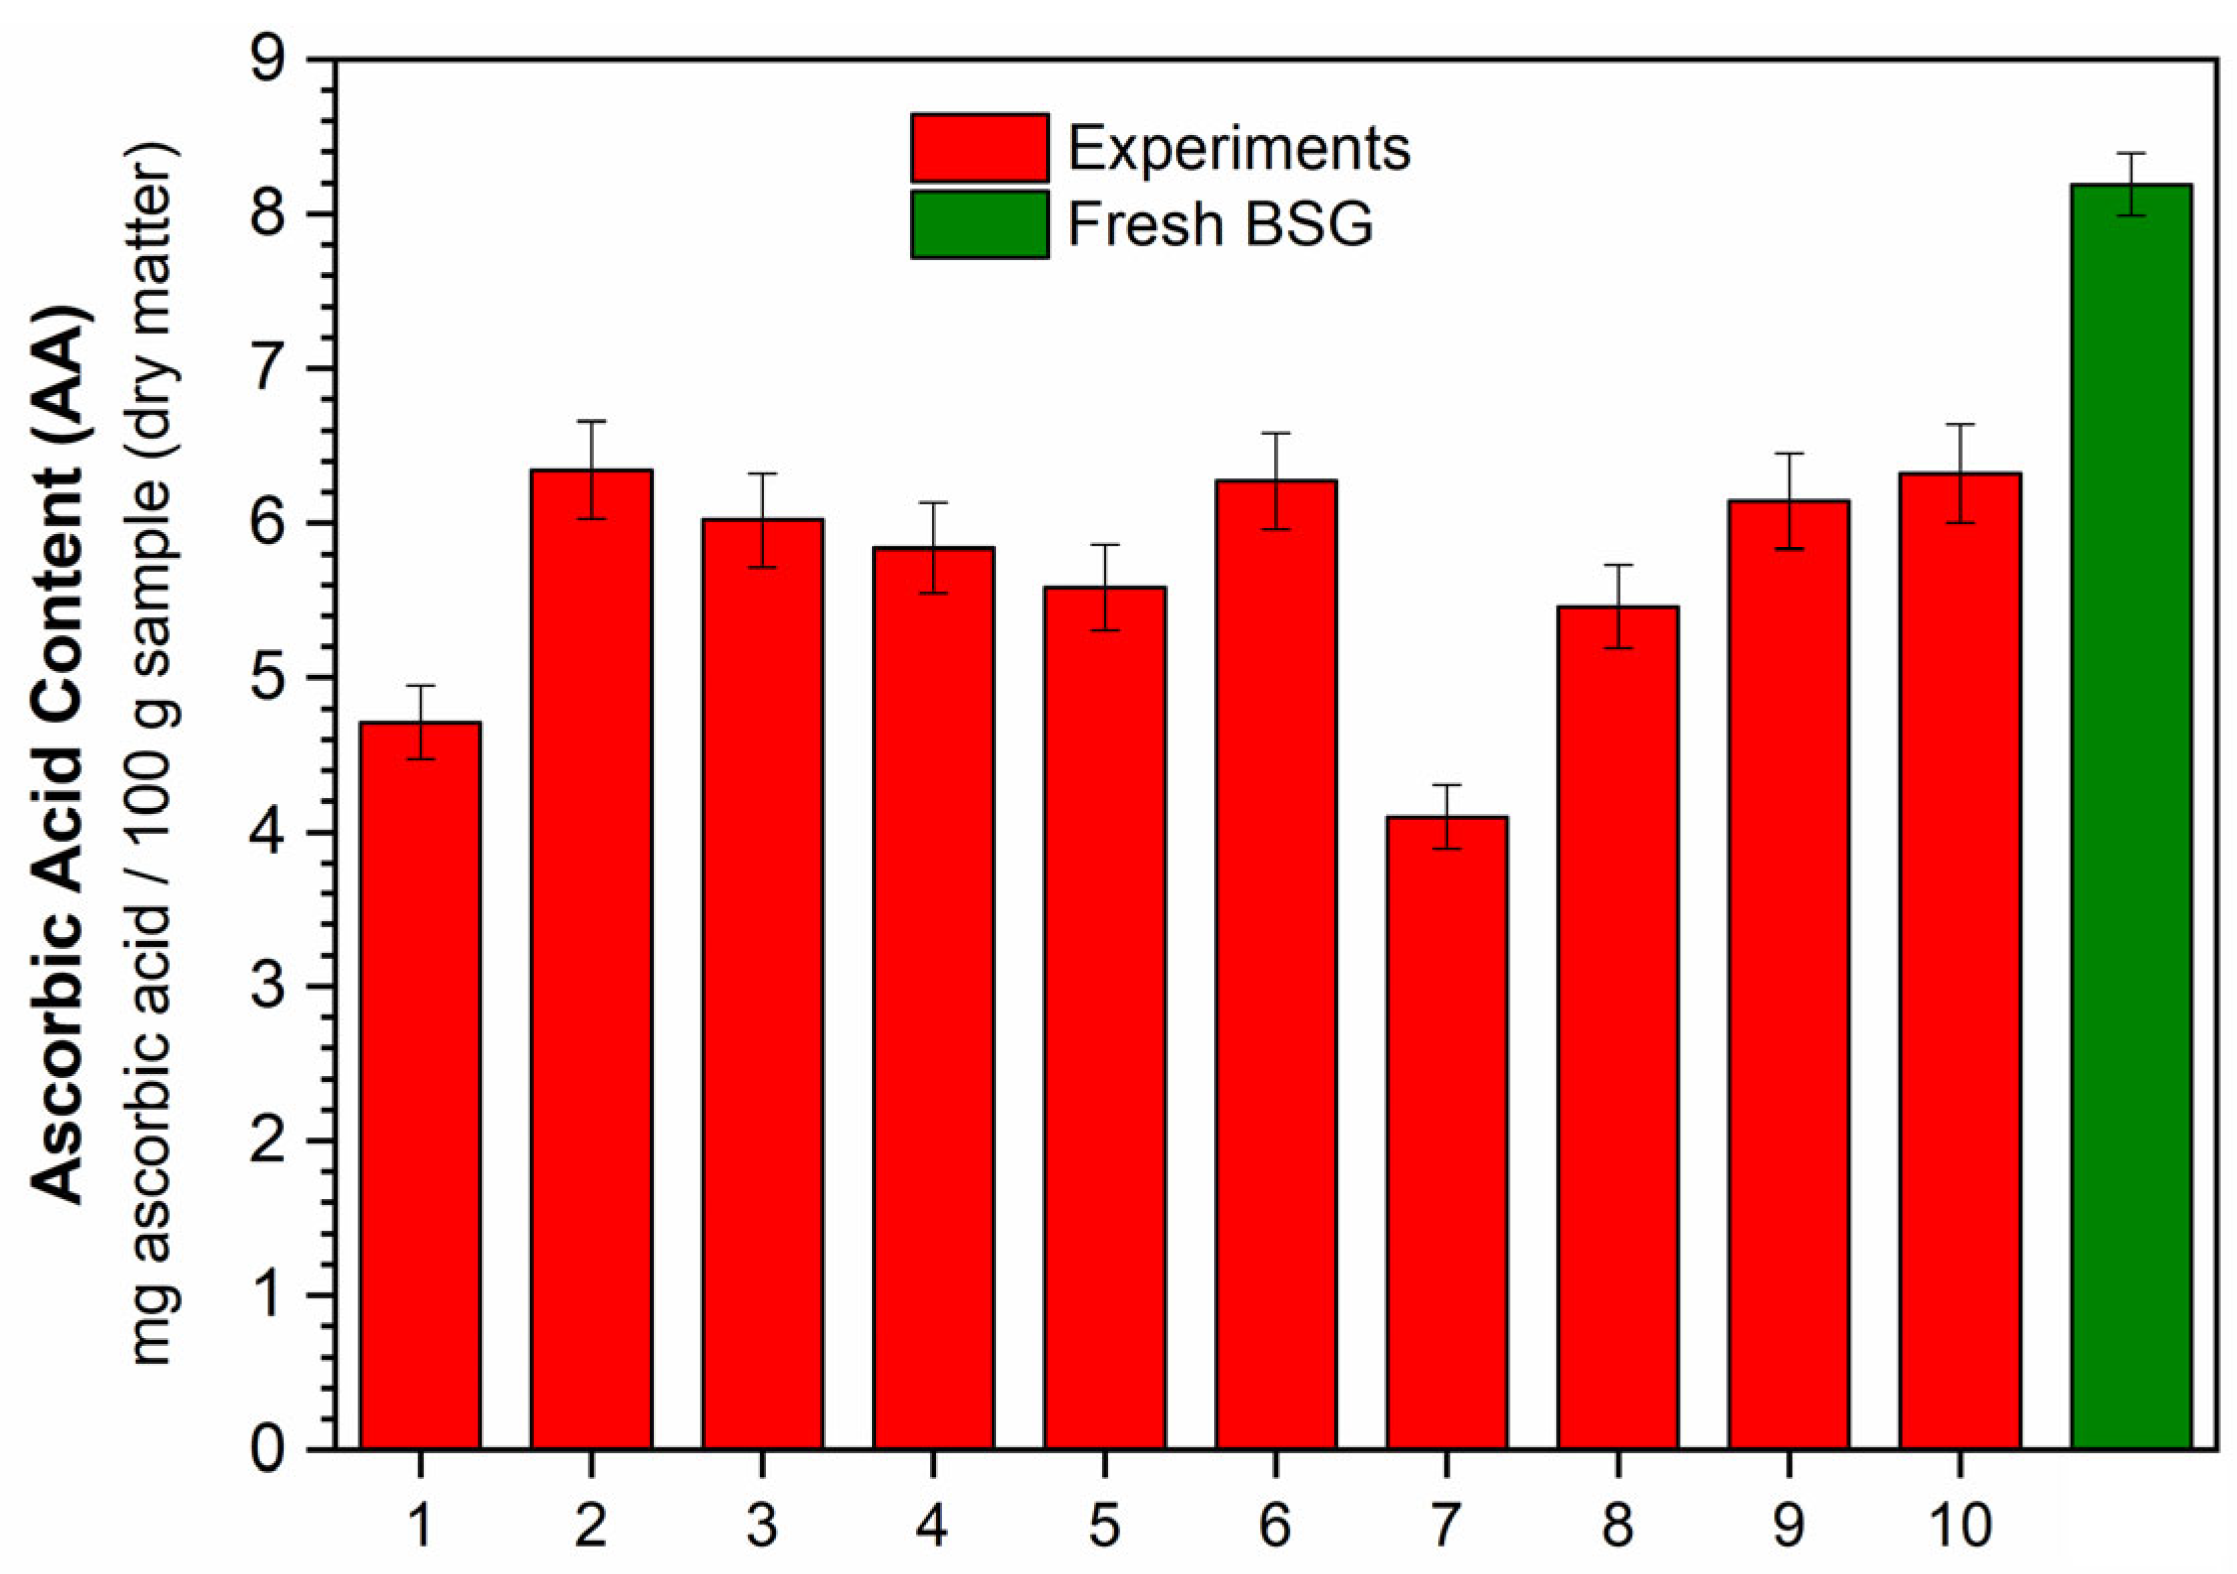
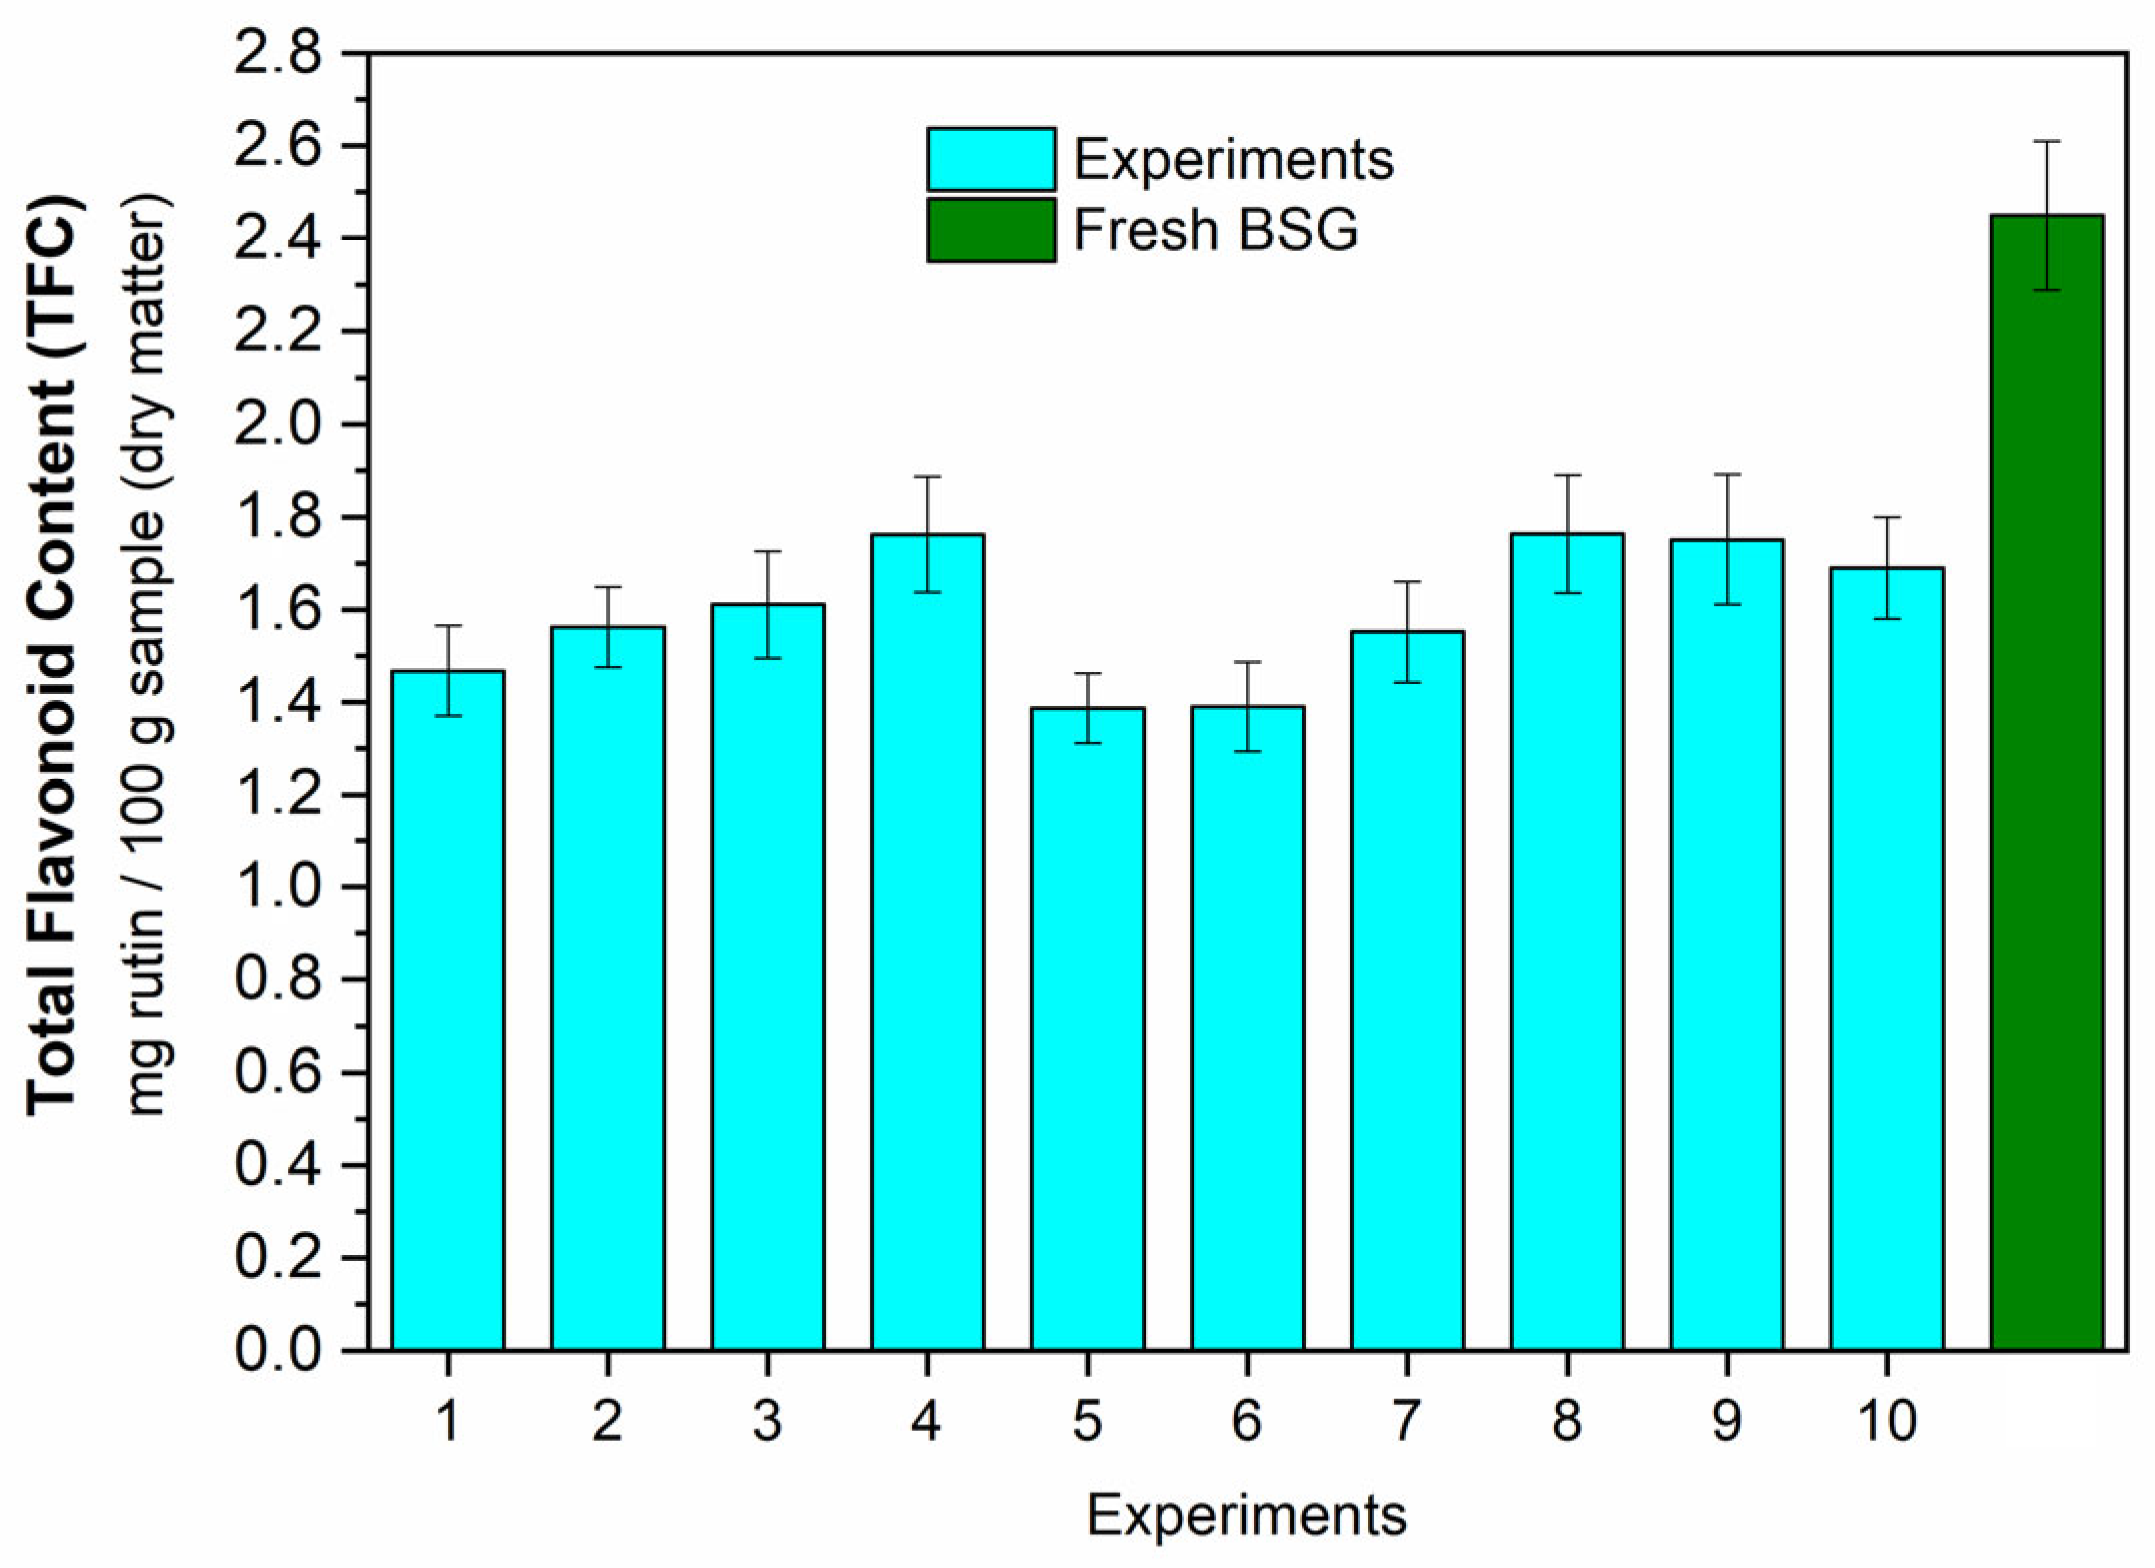
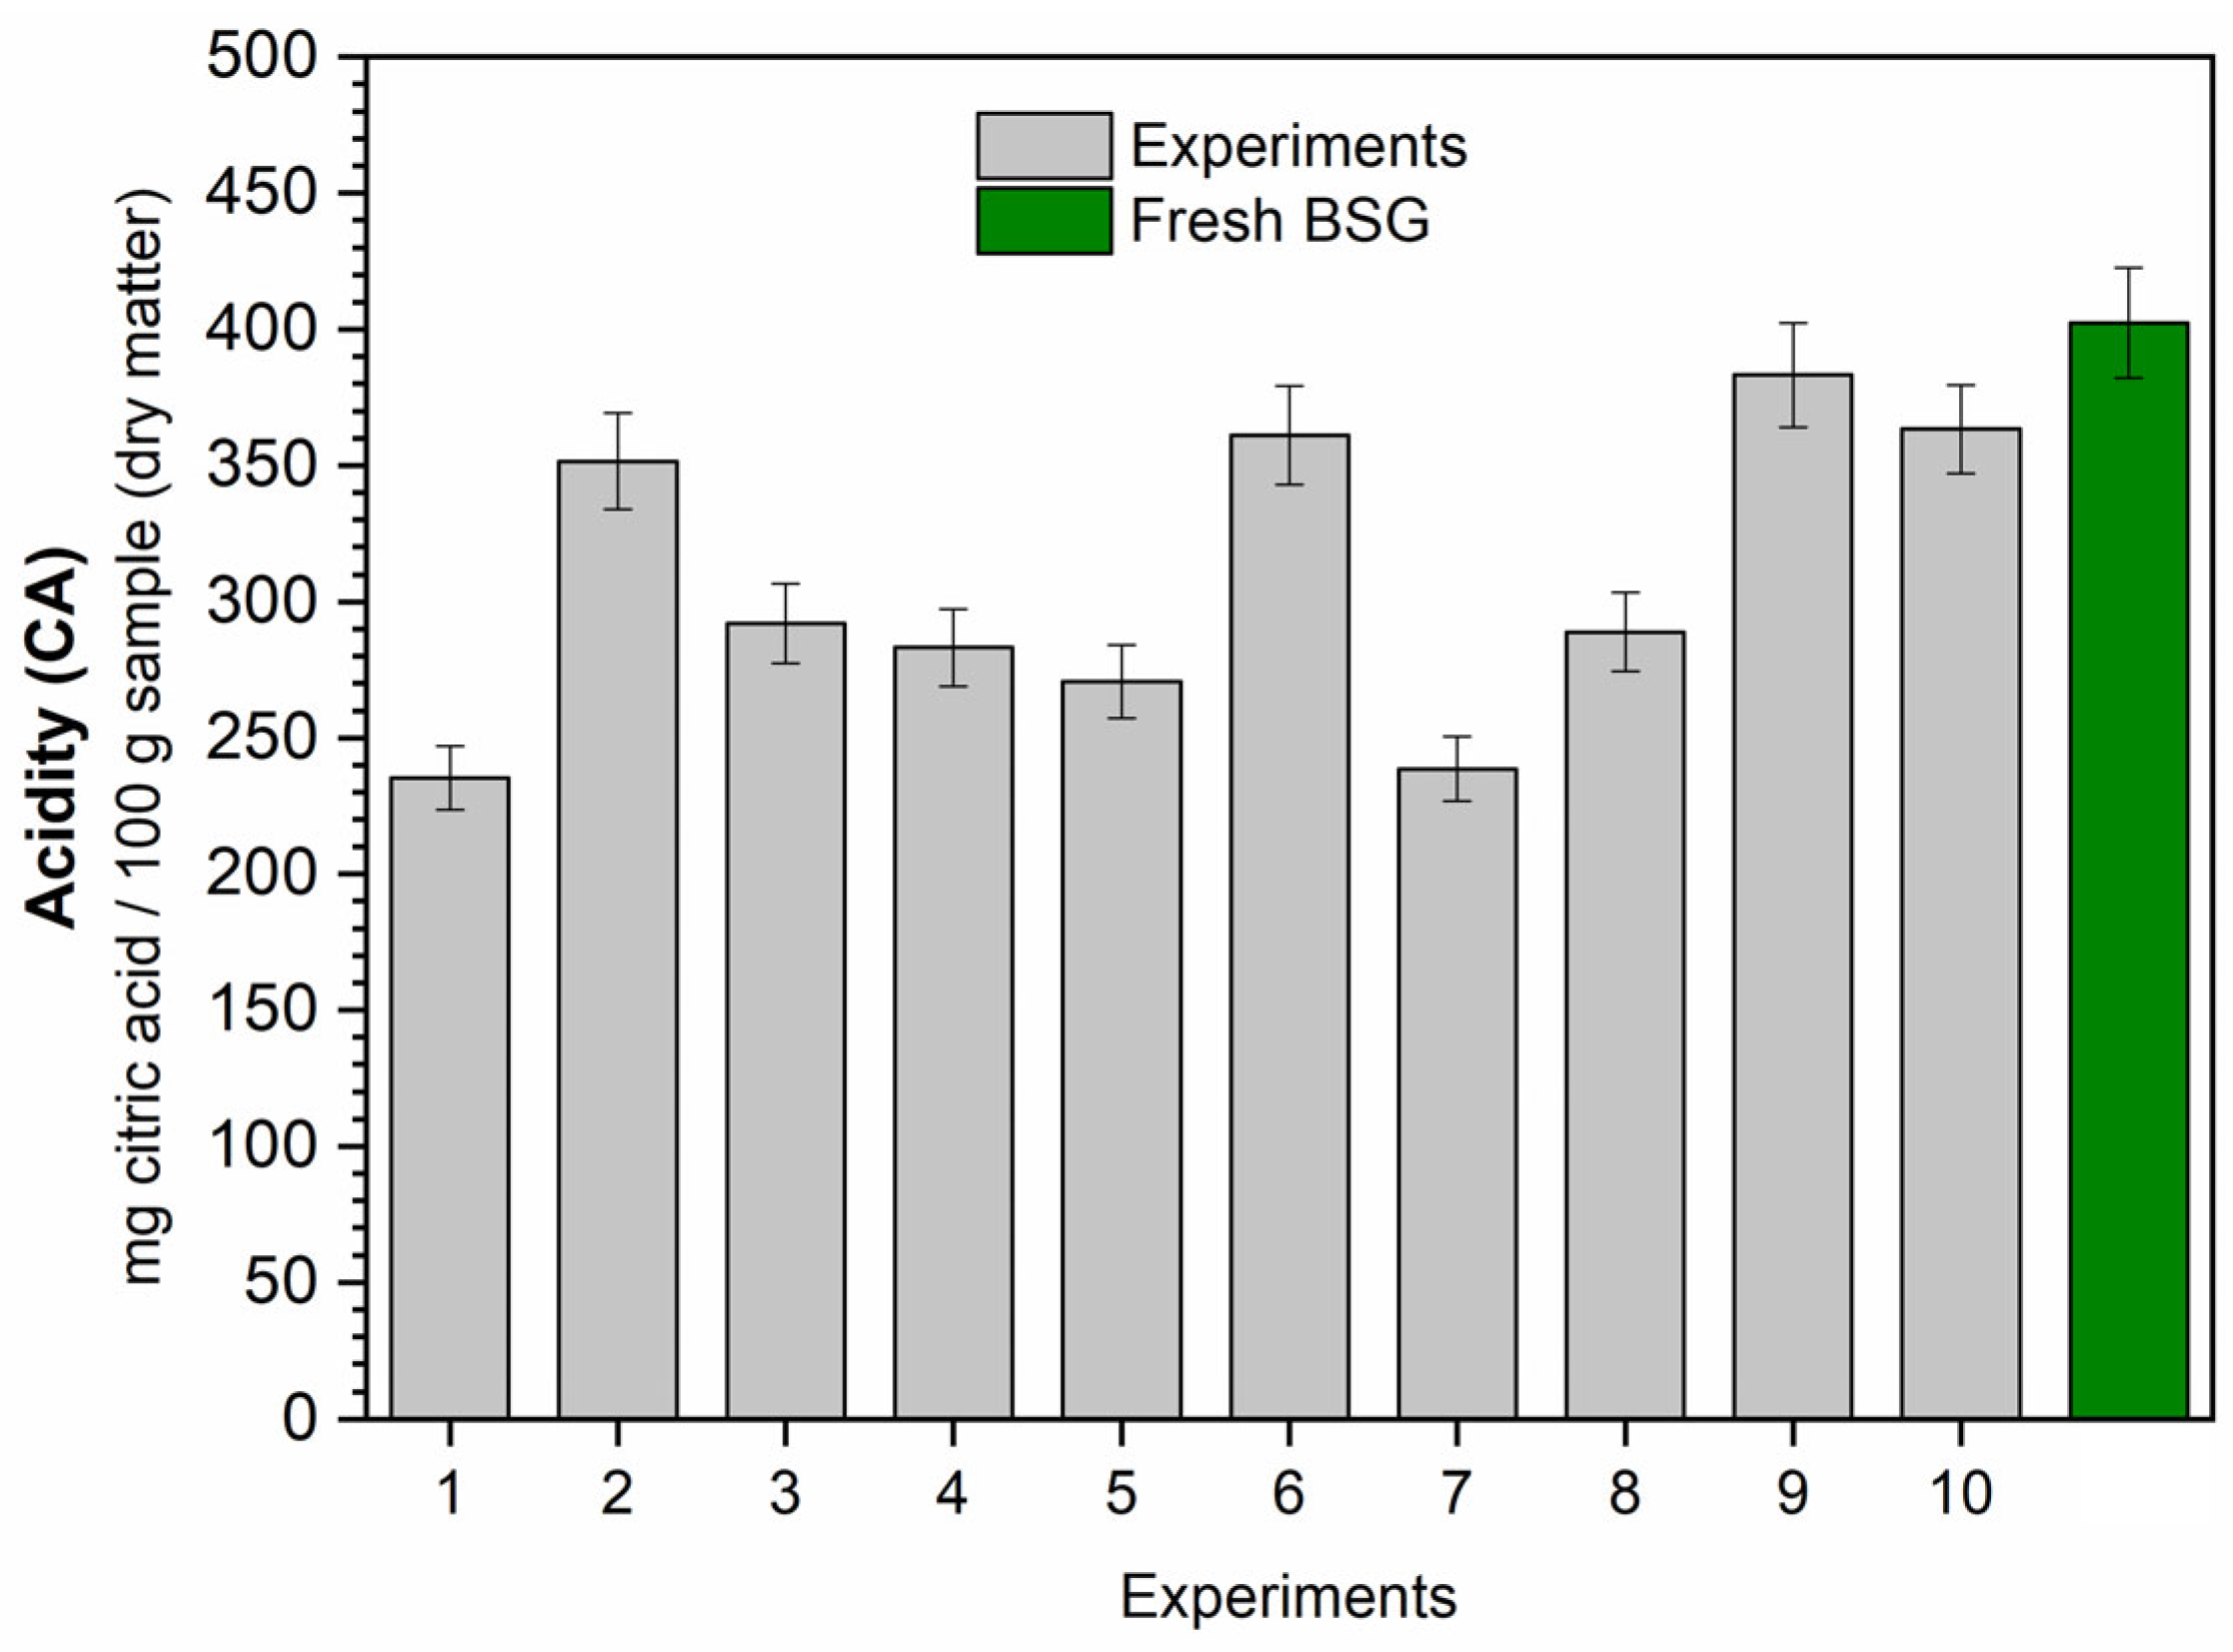
3.3.2. Bioactive Compounds

The total phenolic (TPC), total flavonoid (TFC), acidity (CA), and ascorbic acid (AA) contents after each experiment of the experimental design (as per the conditions outlined in Table 5) are presented in Figure 5, Figure 6, Figure 7, and Figure 8, respectively. Regression equations (Equations (2), (4)–(6)) were fitted to the experimental data for each assessed bioactive compound, aiming to quantify the effect of the independent variables temperature (T) and drying time (t) on the bioactive compounds. Utilizing these equations, response surfaces were generated, as illustrated in Figure 9.
The analysis of the effects of temperature and drying time on bioactive compounds holds significant importance in the investigation of drying methods. This is crucial as it can yield valuable information regarding the effects of these conditions on the final product’s quality. Beyond achieving a dried product with appropriate moisture and water activity levels, it is imperative that the samples maintain bioactive compound concentrations comparable to those observed in the fresh material. This indicates that the drying method did not induce a substantial degradation of these compounds during the moisture removal process, for example. If the specific operational conditions under which this scenario is evident can be identified, it becomes possible to define the best conditions for conducting the drying process.
Brewer’s spent grain has been recognized as a valuable natural source of phenolic compounds exhibiting potent antioxidant activity. These compounds have the potential to safeguard against the oxidant-induced DNA damage while addressing nutritional and health requirements in organisms. Furthermore, these extractable compounds can be isolated, purified, concentrated, and employed as functional ingredients in the food and pharmaceutical industries [8,50,51].
Figure 5 illustrates the total phenolic content (TPC) obtained after each RW experiment. It is evident that the samples exhibit a reduced total phenolic content after drying compared to the levels found in the fresh brewer’s spent grain (136.57 mg gallic acid/100 g sample in dry matter). This decrease indicates the sensitivity of these compounds during the drying process. The most favorable results were observed in Experiments 9 and 10 (70 °C and 3 h), representing the central conditions of the experimental design. However, the TPC values in these experiments were approximately 60% of the original content of the samples.
The equation fitted for TPC is presented as Equation (2) (R2 = 0.8295), considering the linear, quadratic, and interaction effects of temperature (T) and time (t). In this equation, as well as in Equations (4)–(6), for TFC, CA, and AA, respectively, the variables are presented in coded form using Equation (3), provided below. The variables T and t represent temperature in degrees Celsius (°C) and time in hours (h), respectively.
T P C = 84.76 7.81 x 1 2 5.91 x 2 2 + 6.17 x 1 x 2   ,
where :   x 1 = T 70.0 10.0   a n d   x 2 = t 3.0 1.0
The surface response generated by Equation (2) is depicted in Figure 9a. The significance of both studied variables, both in their independent and combined form, is evident in the results. The best values were achieved under intermediate conditions: a temperature of 70 °C and a drying time of 3 h, as previously mentioned. These conditions represent the most favorable operational conditions for maximizing phenolic compound content, while simultaneously maintaining appropriate levels of moisture and water activity, as outlined in Table 5.
The flavonoid compounds exhibit significant biological properties, encompassing antioxidant, anti-inflammatory, and antimicrobial activities [52]. While the literature rarely reports the presence of flavonoids in brewer’s spent grain (BSG), some studies have successfully identified these compounds in this residue [53,54]. Figure 6 illustrates the TFC observed in BSG after refractance window (RW) drying. It is evident that the flavonoid content post drying is diminished compared to that observed in the fresh material (2.45 mg rutin per 100 g sample in dry matter). The highest levels of flavonoid compounds were observed in Experiments 4 (80 °C and 4 h) and 8 (70 °C and 4.4 h), with a TFC of 1.76 mg rutin per 100 g sample (dry matter), approximately 28% lower than that observed in fresh brewer’s spent grain.
Equation (4) presents the fitted equation (R2 = 0.7695), highlighting the influence of both independent variables studied. The results demonstrate a quadratic effect of temperature (T) and a linear effect of the drying time (t). Figure 9b illustrates that the temperature range between 70 °C and 80 °C, when combined with longer drying times, has the optimal values for total flavonoid content (TFC).
T F C = 1.71 0.14 x 1 2 + 0.07 x 2
Acidity (CA) is characterized by the content of citric acid, an antioxidant compound and the most versatile acidulant used in the industry [55,56]. Although more commonly found in fruits and vegetables, citric acid is also present in brewer’s spent grain, emphasizing the significance of its evaluation [57,58].
Figure 7 illustrates the acidity levels in BSG samples after the drying process. In contrast to the observations for phenolic and flavonoid compounds, citric acid proved to be less sensitive to the RW drying process It was possible to obtain a content closer to that observed in the fresh material (402.42 mg citric acid per 100 g sample in dry matter) under specific operational conditions. These conditions corresponded to the central values of the experimental design for temperature and drying time, represented by Experiments 9 and 10 (70 °C and 3 h), with a CA of approximately 370.0 mg citric acid per 100 g sample (dry matter). This represents about 92% of the original citric acid content in the BSG samples.
The fitted equation for CA is presented as Equation (5), and its corresponding surface response is depicted in Figure 9c. It is evident that both variables studied exerted a significant effect on the obtained results. The highest CA values are observed in experiments conducted at temperatures ranging between 70 °C and 80 °C, coupled with drying times within the range of 3.0 to 4.0 h.
C A = 373.28 28.51 x 1 2 + 22.34 x 2 54.59 x 2 2 31.28 x 1 x 2
Ascorbic acid, commonly known as vitamin C, is a potent antioxidant compound that serves as a preservative agent in foods, preventing browning and other oxidative reactions [59]. Since various types of vitamins have been identified in brewer’s spent grain [1,2,6], it is also interesting to evaluate the presence of vitamin C and the effects of RW drying on its levels. The results for the ascorbic acid content (AA) are displayed in Figure 8. Similar to the observations for the other bioactive compounds in this study, ascorbic acid also demonstrated a sensitivity during the drying process. The best results of AA were obtained in a range of 6.0 to 6.4 mg ascorbic acid per 100 g of sample (in dry matter), approximately 25% lower than the initial content of AA observed in the BSG samples (8.19 mg ascorbic acid per 100 g of sample in dry matter).
The fitted equation for the results of ascorbic acid (AA) is presented as Equation (6) (R2 = 0.9314), and its surface response is illustrated in Figure 9d. Once again, temperature (T) and time (t) demonstrated statistical significance in the obtained results, with the best AA values achieved at temperatures ranging between 55 and 65 °C and drying times exceeding 3.0 h. These findings indicate that this compound was more affected by process temperatures than by drying times, suggesting a higher sensitivity to temperature compared to the other analyzed compounds. The temperature sensitivity of vitamin C is a well-documented phenomenon in the literature [60], and this behavior was also observed during the refractance window drying of brewer’s spent grain.
A A = 6.17 + 0.22 x 1 + 0.42 x 2 0.61 x 2 2 0.45 x 1 x 2  
The analysis of variance of the prediction equations (Equations (2), (4)–(6)), with the significative parameters, R2, SSE, RMSE, and p-value, is presented in Table 6.

4. Conclusions

The application of the refractance window method proved to be an effective conservation technique for processing brewer’s spent grain. This method facilitated the production of dried material with minimal alterations, maintaining a visual aspect similar to that observed in the fresh residue. The samples, with moisture levels ranging from 5 to 10%, exhibited activity water values between 0.400 and 0.600. These values are ideal for inhibiting microbial growth and preventing undesirable reactions, such as lipid oxidation. The investigation into the kinetic behavior of BSG revealed that the model proposed by Midilli et al. was the most accurate in predicting the experimental data.
The analysis of the effect of operating variables (temperature and drying time) revealed noteworthy results. The best content of phenolic compounds was found in samples dried under intermediate process conditions: 70 °C and 3.0 h. Conversely, the highest total flavonoid content was obtained in experiments conducted within the temperature range of 70 to 80 °C and with extended drying times (superior to 4 h). Citric acid content also exhibited best results in samples dried at a temperature range of 70 to 80 °C, but with intermediate drying times (3.0 to 4.0 h). Ascorbic acid was identified in the BSG samples, and it demonstrated a high thermal sensitivity. The best results for this compound were observed at temperatures between 5565 °C, coupled with drying times exceeding 3 h.
Based on the aforementioned results, it can be concluded that refractance window is an efficient drying methodology for processing brewer’s spent grain. This method produces dried material with suitable levels of moisture, water activity, and bioactive compounds when conducted under appropriate conditions. Compared with conventional hot air techniques for processing brewer’s spent grain as reported in the literature, refractance window drying also yielded a dried material with suitable conditions for storage and handling. The ample availability and low cost of BSG, coupled with the effectiveness of this drying method, open up new possibilities for the utilization of this residue in the food and nutraceutical industries.

Author Contributions

Conceptualization, N.C.S., C.R.D. and M.A.S.B.; methodology, N.C.S.; software, N.C.S.; validation, C.R.D. and M.A.S.B.; formal analysis, N.C.S. and M.A.S.B.; investigation, N.C.S. and A.O.S.; resources, M.A.S.B.; data curation, N.C.S. and A.O.S.; writing—original draft preparation, N.C.S.; writing—review and editing, M.A.S.B.; visualization, N.C.S., C.R.D. and M.A.S.B.; supervision, C.R.D. and M.A.S.B.; project administration, M.A.S.B.; funding acquisition, M.A.S.B. All authors have read and agreed to the published version of the manuscript.

Funding

This research was funded by the Brazilian research funding agencies CNPq (Brazilian National Council for Scientific and Technological Development), CAPES (Brazilian Federal Agency for the Support and Improvement of Higher Education), and FAPEMIG (State of Minas Gerais Research Support Foundation).

Institutional Review Board Statement

Not applicable.

Informed Consent Statement

Not applicable.

Data Availability Statement

The raw data supporting the conclusions of this article will be made available by the authors on request.

Acknowledgments

We would like to thank the Faculty of Chemical Engineering (FEQUI) and the Federal University of Uberlândia for their support.

Conflicts of Interest

The authors declare no conflicts of interest.

References

  1. Kunze, W. Technology Brewing & Malting, 4th ed.; International Edition; VLB: Berlin, Germany, 2010; 1057p. [Google Scholar]
  2. Mussatto, S.I.; Dragone, G.; Roberto, I.C. Brewer’ spent grain: Generation, characteristics and potential applications. J. Cereal Sci. 2006, 43, 1–14. [Google Scholar] [CrossRef]
  3. Lamas, D.L.; Gende, L.B. Valorization of brewer’s spent grain for the development of novel beverage and food products. Appl. Food Res. 2023, 3, 100314. [Google Scholar] [CrossRef]
  4. Lynch, K.M.; Steffen, E.J.; Arendt, E.K. Brewers’ spent grain: A review with an emphasis on food and health. J. Inst. Brew. 2016, 122, 553–568. [Google Scholar] [CrossRef]
  5. Nigam, P.S. An overview: Recycling of solid barley waste generated as a by-product in distillery and brewery. Waste Manag. 2017, 62, 255–261. [Google Scholar] [CrossRef]
  6. Qazanfarzadeh, Z.; Ganesan, A.R.; Mariniello, L.; Conterno, L.; Kumaravel, V. Valorization of brewer’s spent grain for sustainable food packaging. J. Clean. Prod. 2023, 385, 135726. [Google Scholar] [CrossRef]
  7. Marcus, A.; Fox, G. Fungal Biovalorization of a Brewing Industry Byproduct, Brewer’s Spent Grain: A Review. Foods 2021, 10, 2159. [Google Scholar] [CrossRef]
  8. Mussatto, S.I. Brewer’s spent grain: A valuable feedstock for industrial applications. J. Sci. Food Agric. 2014, 94, 1264–1275. [Google Scholar] [CrossRef]
  9. Guarda, E.C.; Oliveira, A.C.; Antunes, S.; Freitas, F.; Castro, P.M.L.; Duque, A.F.; Reis, M.A.M. A Two-Stage Process for Conversion of Brewer’s Spent Grain into Volatile Fatty Acids through Acidogenic Fermentation. Appl. Sci. 2021, 11, 3222. [Google Scholar] [CrossRef]
  10. Gutiérrez-Barrutia, M.B.; del Castillo, M.D.; Arcia, P.; Cozzano, S. Feasibility of Extruded Brewer’s Spent Grain as a Food Ingredient for a Healthy, Safe, and Sustainable Human Diet. Foods 2022, 11, 1403. [Google Scholar] [CrossRef]
  11. Meneses, N.G.T.; Martins, S.; Teixeira, J.A.; Mussatto, S.I. Influence of extraction solvents on the recovery of antioxidant phenolic compounds from brewer’s spent grains. Sep. Purif. Technol. 2013, 108, 152–158. [Google Scholar] [CrossRef]
  12. Bazsefidpar, N.; Yazdi, A.P.G.; Karimi, A.; Yahyavi, M.; Amini, M.; Gavlighi, H.A.; Simal-Gandara, J. Brewers spent grain protein hydrolysate as a functional ingredient for muffins: Antioxidant, antidiabetic, and sensory evaluation. Food Chem. 2024, 435, 137565. [Google Scholar] [CrossRef]
  13. Becker, D.; Bakuradze, T.; Hensel, M.; Beller, S.; Yélamos, C.C.; Richling, E. Influence of Brewer’s Spent Grain Compounds on Glucose Metabolism Enzymes. Nutrients 2021, 13, 2696. [Google Scholar] [CrossRef]
  14. Iadecola, R.; Ciccoritti, R.; Ceccantoni, B.; Bellincontro, A.; Amoriello, T. Optimization of Phenolic Compound Extraction from Brewers’ Spent Grain Using Ultrasound Technologies Coupled with Response Surface Methodology. Sustainability 2022, 14, 3309. [Google Scholar] [CrossRef]
  15. Birsan, R.I.; Wilde, P.; Waldron, K.W.; Rai, D.K. Anticholinesterase Activities of Different Solvent Extracts of Brewer’s Spent Grain. Foods 2021, 10, 930. [Google Scholar] [CrossRef] [PubMed]
  16. Santos, M.; Jiménez, J.J.; Bartolomé, B.; Gómez-Cordovéz, C.; Del Nozal, M.J. Variability of brewers’ spent grain with in a brewery. Food Chem. 2003, 80, 17–21. [Google Scholar] [CrossRef]
  17. Stroem, L.K.; Desai, D.K.; Hoadley, A.F.A. Superheated steam drying of Brewer’s spent grain in a rotary drym. Adv. Powder Technol. 2009, 20, 240–244. [Google Scholar] [CrossRef]
  18. Clarke, P.T. Refractance WindowTM–“Down under”. In Proceedings of the International Drying Symposium (IDS 2004) B, São Paulo, Brazil, 22–25 August 2004; pp. 813–820. [Google Scholar]
  19. Nindo, C.I.; Tang, J. Refractance Window dehydration technology: A novel contact drying method. Dry. Technol. 2007, 25, 37–48. [Google Scholar] [CrossRef]
  20. Raghavi, L.M.; Moses, J.A.; Anandharamakrishnan, C. Refractance window drying of foods: A review. J. Food Eng. 2018, 222, 267–275. [Google Scholar] [CrossRef]
  21. Múnera-Tangarife, R.D.; Solarte-Rodríguez, E.; Vélez-Pasos, C.; Ochoa-Martínez, C.I. Factors Affecting the Time and Process of CMC Drying Using Refractance Window or Conductive Hydro-Drying. Gels 2021, 7, 257. [Google Scholar] [CrossRef] [PubMed]
  22. Castoldi, M.; Zotarelli, M.F.; Durigon, A.; Carciofi, B.A.M.; Laurindo, J.B. Production of tomato powder by refractance window drying. Dry. Technol. 2015, 33, 1463–1473. [Google Scholar] [CrossRef]
  23. Ortiz-Jerez, M.J.; Gulati, T.; Datta, A.K.; Ochoa-Martínez, C.I. Quantitative understanding of Refractance WindowTM Drying. Food Bioprod. Process. 2015, 95, 237–253. [Google Scholar] [CrossRef]
  24. Abonyi, B.I.; Feng, H.; Tang, J.; Edwards, C.G.; Chew, B.P.; Mattinson, D.S.; Fellman, J.K. Quality Retention in Strawberry and Carrot Purees Dried with Refractance WindowTM System. J. Food Sci. 2002, 67, 1051–1056. [Google Scholar] [CrossRef]
  25. Caparino, O.A.; Tang, J.; Nindo, C.I.; Sablani, S.S.; Powers, J.R.; Fellman, J.K. Effect of drying methods on the physical properties and microstructures of mango (Philippine ‘Carabao’ Vr.) powder. J. Food Eng. 2012, 111, 135–148. [Google Scholar] [CrossRef]
  26. Pavan, M.A.; Schmidt, S.J.; Feng, H. Water sorption behavior and thermal analysis of freeze-dried, Refractance Window-dried and hot-air dried açaí (Euterpe oleracea Martius) juice. LWT–Food Sci. Technol. 2012, 48, 75–81. [Google Scholar] [CrossRef]
  27. Frabetti, A.C.C.; Durigon, A.; Laurindo, J.B. Effect of process variables on the drying of guava pulp by cast-tape drying. LWT–Food Sci. Technol. 2018, 96, 620–626. [Google Scholar] [CrossRef]
  28. Asiimwe, A.; Kigozi, J.B.; Baidhe, E.; Muyonga, J.H. Optimization of refractance window drying conditions for passion fruit puree. LWT–Food Sci. Technol. 2022, 154, 112742. [Google Scholar] [CrossRef]
  29. Dadhaneeya, H.; Nayak, P.K.; Saikia, D.; Kondareddy, R.; Ray, S.; Kesavan, R.K. The impact of refractance window drying on the physicochemical properties and bioactive compounds of malbhog banana slice and pulp. Appl. Food Res. 2023, 3, 100279. [Google Scholar] [CrossRef]
  30. Zalpouri, R.; Singh, M.; Kaur, P.; Kaur, A.; Gaikwad, K.K.; Singh, A. Drying Kinetics, Physicochemical and Thermal Analysis of Onion Puree Dried Using a Refractance Window Dryer. Processes 2023, 11, 700. [Google Scholar] [CrossRef]
  31. Núñez, H.; Jaques, A.; Belmonte, K.; Córdova, A.; Lafuente, G.; Ramírez, C. Effect of CO2 Laser Microperforation Pretreatment on the Dehydration of Apple Slices during Refractive Window Drying. Foods 2023, 12, 2187. [Google Scholar] [CrossRef] [PubMed]
  32. Tontul, I.; Ergin, F.; Eroglu, E.; Kuçukçetin, K.; Topuz, A. Physical and microbiological properties of yogurt powder produced by refractance window drying. Int. Dairy J. 2018, 85, 169–176. [Google Scholar] [CrossRef]
  33. Silva, N.C.; Freitas, L.V.D.; Silva, T.C.; Duarte, C.R.; Barrozo, M.A.S. Use of Refractance Window Drying as an Alternative Method for Processing the Microalga Spirulina platensis. Molecules 2023, 28, 720. [Google Scholar] [CrossRef] [PubMed]
  34. AOAC, Association of Official Analytical Chemists. Official Methods of Analysis of the Association of Official Analytical Chemists, 16th ed.; AOAC: Gaithersburg, MD, USA, 1995; Volume 1. [Google Scholar]
  35. Tang, Z.; Cenkowski, S.; Muir, W.E. Modelling the Superheated-steam Drying of a Fixed Bed of Brewer’s Spent Grain. Biosyst. Eng. 2004, 87, 67–77. [Google Scholar] [CrossRef]
  36. Bhandari, B.R.; Adhikari, B.P. Water activity in food processing and preservation. In Drying Technologies in Food Processing; Chen, X.D., Mujumdar, A.S., Eds.; Blackwell Publishing Ltd.: Hoboken, NJ, USA; John Wiley & Sons: West Sussex, UK, 2008; p. 55. [Google Scholar]
  37. Chen, X.D.; Patel, K.C. Biological changes during food drying processes. In Drying Technologies in Food Processing; Chen, X.D., Mujumdar, A.S., Eds.; Blackwell Publishing Ltd.: Hoboken, NJ, USA; John Wiley & Sons: West Sussex, UK, 2008; p. 90. [Google Scholar]
  38. Barrozo, M.A.S.; Sartori, D.J.M.; Freire, J.T. A Study of the Statistical Discrimination of the Drying Kinetics Equation. Food Bioprod. Process. 2004, 82, 219–225. [Google Scholar] [CrossRef]
  39. Freire, F.B.; Barrozo, M.A.S.; Sartori, D.J.M.; Freire, J.T. Study of the drying kinetics in thin layer: Fixed and moving bed. Dry. Technol. 2007, 23, 1451–1464. [Google Scholar] [CrossRef]
  40. Barrozo, M.A.S.; Sartori, D.J.M.; Freire, J.T.; Achcar, J.A. Discrimination of Equilibrium Moisture Equations For Soybean Using Nonlinearity Measures. Dry. Technol. 2007, 14, 1779–1794. [Google Scholar] [CrossRef]
  41. Felipe, C.A.S.; Barrozo, M.A.S. Drying of soybean seeds in a concurrent moving bed: Heat and mass transfer and quality analysis. Dry. Technol. 2003, 21, 439–456. [Google Scholar] [CrossRef]
  42. Lewis, W.K. The rate of drying of solid materials. Indian Chem. Eng. 1921, 13, 427. [Google Scholar] [CrossRef]
  43. Page, G.E. Factors Influencing the Maximum Rates of Air Drying Shelled Corn in Thin-Layer; Purdue University: West Lafayette, IN, USA, 1949. [Google Scholar]
  44. Overhults, D.G.; White, G.M.; Hamilton, H.E.; Ross, I.J. Drying soybeans with heated air. Trans. ASAE 1973, 16, 112–113. [Google Scholar] [CrossRef]
  45. Brooker, D.B.; Bakker-Arkema, F.W.; Hall, C.W. Drying Cereal Grains; Avi: Westport, CT, USA, 1974. [Google Scholar] [CrossRef]
  46. Midilli, A.; Kucuk, H.; Yapar, Z. A new model for single-layer drying. Dry. Technol. 2002, 20, 1503–1513. [Google Scholar] [CrossRef]
  47. Singleton, V.L.; Orthofer, R.; Lamuela-Raventós, R.M. Analysis of total phenols and other oxidation substrates and antioxidants by means of folin–ciocalteu reagent. Methods Enzymol. 1999, 299, 52–178. [Google Scholar] [CrossRef]
  48. Zhishen, J.; Mengcheng, T.; Jianming, W. The determination of flavonoid contents in mulberry and their scavenging effects on superoxide radicals. Food Chem. 1999, 64, 555–559. [Google Scholar] [CrossRef]
  49. Silva, N.C.; Duarte, C.R.; Barrozo, M.A.S. Effects of dehydration methods on quality characteristics of yellow passion fruit coproducts. J. Sci. Food Agric. 2017, 97, 4750–4759. [Google Scholar] [CrossRef] [PubMed]
  50. Moreira, M.M.; Morais, S.; Carvalho, D.O.; Barros, A.A.; Delerue-Matos, C.; Guido, L.F. Brewer’s spent grain from different types of malt: Evaluation of the antioxidant activity and identification of the major phenolic compounds. Food Res. Int. 2013, 54, 382–388. [Google Scholar] [CrossRef]
  51. Oyedeji, A.B.; Wu, J. Food-based uses of brewers spent grains: Current applications and future possibilities. Food Biosci. 2023, 54, 102774. [Google Scholar] [CrossRef]
  52. Chaaban, H.; Ioannou, I.; Chebil, L.; Slimane, M.; Gérardin, C.; Paris, C.; Charbonnel, C.; Chekir, L.; Ghoul, M. Effect of heat processing on thermal stability and antioxidant activity of six flavonoids. J. Food Process. Preserv. 2017, 41, e13203. [Google Scholar] [CrossRef]
  53. Spinelli, S.; Conte, A.; Nobile, M.A.D. Microencapsulation of extracted bioactive compounds from brewer’s spent grain to enrich fish burguers. Food Bioprod. Process. 2016, 100 Pt A, 450–456. [Google Scholar] [CrossRef]
  54. Shon, Y.J.; Kim, W.C.; Lee, S.-H.; Hong, S.; Kim, S.-Y.; Park, M.H.; Lee, P.; Lee, J.; Park, K.H.; Lim, W.; et al. Antimelanogenic potential of brewer’s spent grain extract through modulation of the MAPK/MITF axis. Sustain. Mater. Technol. 2023, 38, e00721. [Google Scholar] [CrossRef]
  55. Podsedek, A. Natural antioxidant and antioxidant capacity of Brassica vegetables: A review. LWT-Food Sci. Technol. 2007, 40, 1–11. [Google Scholar] [CrossRef]
  56. Hansuld, M.K.; Briant, A.M. The effect of citric acid on selected edible starches and flours. J. Food Sci. 1954, 19, 581–589. [Google Scholar] [CrossRef]
  57. Cooray, S.T.; Chen, W.N. Valorization of brewer’s spent grain using fungi solid-state fermentation to enhance nutritional value. J. Funct. Foods 2018, 42, 85–94. [Google Scholar] [CrossRef]
  58. Shetty, R.; Petersen, F.R.; Podduturi, R.; Molina, G.E.S.; Wätjen, A.P.; Madsen, S.K.; Zioga, E.; Øzmerih, S.; Hobley, T.J.; Bang-Berthelsen, C.H. Fermentation of brewer’s spent grain liquids to increase shelf life and give an organic acid enhanced ingredient. LWT-Food Sci. Technol. 2023, 182, 114911. [Google Scholar] [CrossRef]
  59. Njus, D.; Kelley, P.M.; Tu, Y.-J.; Schlegel, H.B. Ascorbic acid: The chemistry underlying its antioxidant properties. Free Radic. Biol. Med. 2020, 159, 37–43. [Google Scholar] [CrossRef]
  60. Sablani, S.S.; Rahman, M.S. Fundamentals of Food Dehydration. In Food Drying Science and Technology; Hui, Y.H., Clary, C., Farid, M.M., Fasina, O.O., Noomhorm, A., Welti-Chanes, J., Eds.; DEStech Publication, Inc.: Lancaster, PA, USA, 2008; Chapter 1; pp. 1–42. [Google Scholar]
Figure 1. Refractance window drying experimental apparatus: (a) RW dryer; (b) schematic figure.
Applbiosci 03 00005 g001
Figure 2. Brewer’s spent grain after refractance window (RW) drying.
Applbiosci 03 00005 g002
Figure 3. Scanning electron microscopy (SEM) images of brewer’s spent grain (BSG) dried using refractance window. Magnification of 1000 times for (a) fresh BSG and BSG dried at (b) 60 °C, (c) 70 °C, and (d) 80 °C.
Applbiosci 03 00005 g003
Figure 4. Drying kinetics: experimental results and prediction by the Midilli et al. [46] kinetic model.
Applbiosci 03 00005 g004
Figure 5. Total phenolic content (TPC).
Applbiosci 03 00005 g005
Figure 6. Total flavonoid content (TFC).
Applbiosci 03 00005 g006
Figure 7. Acidity or citric acid content (CA).
Applbiosci 03 00005 g007
Figure 8. Ascorbic acid content (AA).
Applbiosci 03 00005 g008
Figure 9. Surface responses for TPC (a), TFC (b), CA (c), and AA (d).
Applbiosci 03 00005 g009
Table 1. Coded and real values of the experimental design.
Independent Variables−1.414−10+1+1.414
Temperature (°C)55.960.070.080.084.1
Time (h)1.62.03.04.04.4
Table 2. Drying kinetic models.
Equation in the LiteratureReference
M R = exp ( k t ) Lewis [42]
M R = exp ( k t n ) Page [43]
M R = exp [ k t n ] Overhults et al. [44]
M R = A exp ( k t ) Brooker et al. [45]
M R = A . exp k t n + B t Midilli et al. [46]
Table 3. Initial tests results.
Exp.TemperatureMoisture (%)Water Activity (aw)Drying Time (min)
160 °C8.36 ± 0.180.527250
270 °C5.85 ± 0.460.425170
380 °C5.10 ± 0.220.352140
Fresh BSG75.89 ± 1.31%0.977-
Table 4. Statistical parameters of drying kinetic equations.
ModelExp.Parameters of the ModelsStatistical Analysis
KnABR2SSERMSE
Lewis [38]60 °C6.99 × 10−3---0.88570.32760.1122
70 °C1.02 × 10−2---0.88660.23090.1133
80 °C1.42 × 10−2---0.90370.17200.1071
Page [39]60 °C6.40 × 10−51.95--0.99070.02660.0320
70 °C1.19 × 10−41.97--0.99240.01550.0293
80 °C3.36 × 10−41.87--0.99110.01590.0326
Overhults et al. [40]60 °C7.06 × 10−31.95--0.99070.02660.0320
70 °C1.03 × 10−21.97--0.99240.01550.0293
80 °C1.39 × 10−21.87--0.99110.01590.0326
Brooker
et al. [41]
60 °C8.18 × 10−3-1.1566-0.91760.23630.0953
70 °C1.19 × 10−2-1.1508-0.91720.16860.0968
80 °C1.62 × 10−2-1.1350-0.92650.13130.0936
Midilli
et al. [42]
60 °C1.07 × 10−41.770.9808−7.29 × 10−40.99910.00240.0097
70 °C1.80 × 10−41.820.9832−8.50 × 10−40.99860.00280.0125
80 °C4.81 × 10−41.730.9787−8.28 × 10−40.99750.00450.0172
Table 5. Experimental design results.
Exp.Temp. (T) °CTime (t) hMoisture (%)Water Activity
(aw)
160.02.035.20 ± 0.590.947
260.04.010.80 ± 0.090.648
380.02.05.75 ± 0.240.448
480.04.02.87 ± 0.120.151
555.93.021.27 ± 0.280.876
684.13.02.92 ± 0.120.188
770.01.626.00 ± 0.710.919
870.04.44.85 ± 0.050.195
970.03.06.31 ± 0.060.505
1070.03.05.35 ± 0.300.428
Table 6. Statistical results of bioactive compound content prediction.
Bioactive CompoundStatistical Analysis
R2SSERMSESignificative Parametersp-Value
TPC0.829548.33222.1985 x 1 2 0.00587
x 2 2 0.01975
x 1 x 2 0.02160
TFC0.76950.04500.0671 x 1 2 0.00406
x 2 0.04739
CA0.8284400.27826.3268 x 1 2 0.09753
x 2 0.08877
x 2 2 0.01146
x 1 x 2 0.09114
AA0.93140.34610.1860 x 1 0.06231
x 2 0.00623
x 2 2 0.00278
x 1 x 2 0.01852
Disclaimer/Publisher’s Note: The statements, opinions and data contained in all publications are solely those of the individual author(s) and contributor(s) and not of MDPI and/or the editor(s). MDPI and/or the editor(s) disclaim responsibility for any injury to people or property resulting from any ideas, methods, instructions or products referred to in the content.

