Abstract
Genomics-based diagnostic data (GBDD) are becoming increasingly important for laboratory diagnostics. Due to the large quantity of data and their heterogeneity, GBDD poses a big data challenge. Current analysis tools for GBDD are primarily designed for research and do not meet the requirements of laboratory diagnostics for automation, reliability, transparency, reproducibility, robustness, and accessibility. This makes it difficult for laboratories to use these tools in tests that need to be validated according to regulatory frameworks and to execute tests in a time- and cost-efficient manner. In order to better address these requirements, we propose an event-driven workflow-based architecture as the basis for a processing platform that is highly scalable using container technologies and microservices. A prototype implementation of this approach, called GenomicInsights, has been developed and evaluated to demonstrate its feasibility and suitability for laboratory diagnostics.
Keywords:
genomics; diagnostics; architecture; containerization; scalability; big data; genomic insights 1. Introduction
Genomics-based diagnostic data (GBDD) are medical data generated from a range of genomic technologies, including sequencing, qPCR, or microarrays. They are used in many areas such as gene expression analysis or metagenomics and has become an important aspect of modern laboratory medicine. GBDD can be used to diagnose diseases and optimize treatments, thus offering immense potential for personalized medicine and precision diagnostics. GBDD have been used in a range of medical fields such as human development, lifestyle, immunity, and diseases [1,2,3]. Depending on the diagnostic application, these data can comprise several hundred gigabytes for a single patient sample [4]. The speed at which these data are generated is also increasing due to reduced costs and improved technology [5]. Furthermore, GBDD can vary widely depending on the use case, necessitating the application of different analysis methods. Consequently, genomics is considered a big data problem, characterized by these three essential properties: volume, velocity, and variety [5,6].
Medical laboratories face the challenge of wanting to use the latest diagnostic technologies as soon as possible while also needing automated, reproducible, and reliable processes [7]. At the same time, it must be possible to trace in detail at any time how a particular diagnosis was determined to verify the accuracy and validity of the results as required by regulatory frameworks such as the In Vitro Diagnostic Regulation (IVDR) of the European Union or comparable international regulations [8,9]. Common tools for processing GBDD, on the other hand, are primarily designed for research purposes where individual experiments with variable parameters can be performed and where automation, standardization, and reproducibility are less essential [7,10]. For example, these tools may allow for individual experiments with variable parameters, making it difficult to achieve the necessary level of standardization required for clinical diagnostics. The focus on research is also noticeable in areas such as result visualization and communication, which is not usually tailored toward individual patients [7]. In a clinical setting, it is essential to convey complex data to patients and physicians in a way that is easy to understand and actionable.
This leads to the question of how an automated analysis platform can be designed and implemented that allows automated processing of GBDD for medical laboratories. To answer this question, Section 2 first summarizes the relevant state of the art. Section 3 proposes a technical architecture for automated genomic data processing in medical laboratories to address the outlined challenges. Then, a prototypical implementation is discussed and evaluated in Section 4 and Section 5. The paper concludes with a summary and outlook in Section 6.
2. State of the Art
In Krause et al. [11,12], we have introduced the GenDAI model for the processing and analysis of GBDD, which abstracts the different process steps and discusses necessary components and concepts to meet the requirements of GBDD processes. Figure 1 shows an overview of the GenDAI conceptual model. The model is based on the AI2VIS4BigData model of Reis et al. [13] and distinguishes the aspects data collection, management, and curation; analytics, interaction, and perception; insights and effectuation; and persistence. At its core, the model uses a workflow-based approach, allowing laboratory processes to be dynamically defined and configured as a combination of multiple independent tasks [14].
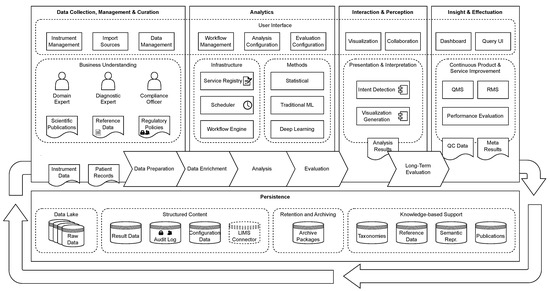
Figure 1.
GenDAI Conceptual Model. © 2021 IEEE. Reprinted, with permission, from Krause et al. [11].
The state of the art relevant to the system’s development can be partly categorized based on this conceptual model. However, due to its scope, only aspects strictly required for demonstrating the technical architecture and prototype will be considered here. In addition, technical aspects and architectural issues that are not reflected in the conceptual model must also be considered.
The following sections will thus first take a look at various analysis tools that can answer genomic questions and can be attributed to the area of analytics in the GenDAI conceptual model. Next, the state of the art for the visualization and reporting of GBDD and laboratory test results is discussed, which is covered in the GenDAI conceptual model by the interaction and perception domain. Subsequently, a consideration of general big data frameworks is interesting, which enables the processing of large quantities of data without being specifically specialized in medical or laboratory diagnostic questions. Closely following this are distributed storage systems that allow for the reliable persistence of large quantities of data and can be assigned to the persistence sub-aspect in the model. Workflow management systems (WMS) are worthy of attention as an independent category because they enable processes to be mapped and automated in a structured manner. For the development of custom solutions, consideration of paradigms and architectures for distributed systems is also essential. As a particular area of interest, Event-driven architectures (EDAs) can be considered, which are particularly suitable for the development of transparent and reliable distributed systems [15]. Finally, deployment strategies and specifically container-based deployment methods are considered.
2.1. Genomic Analysis Tools
For the analysis of GBDD, some tools are specifically designed for certain types of data or specific application areas, while generic bioinformatics platforms serve as the basis for many different analyses. The transitions between the two are fluid.
BLAST [16] is a collection of specialized tools for sequence alignment of nucleotide or protein sequences and forms an important building block for many genomic questions. BLAST calculates the match between a query sequence and the sequences contained in a database. Significant matches are evaluated and returned. Thus, it can be determined whether the query sequence is part of a known sequence. In metagenomics, for example, BLAST can be used to identify microorganisms in a sample. SILVA and RDP are two other well-known databases with associated alignment tools that focus on matching sequences to a taxonomy and phylogeny and are thus also frequently used in metagenomics [17].
QIIME2 [18] is a platform for metagenomic applications. Based on raw sequencing data, metagenomic questions can be answered, e.g., on the taxonomy of microorganisms or functional analysis [19]. Qiita [20] (pronounced “cheetah”) is an open-source platform for the management, processing, and analysis of metagenomic data. It supports multiple workflows using analysis plugins, including QIIME2. It aims for high comparability between studies by collecting suitable metadata, thus facilitating metastudies. Galaxy [21] is a workflow-based platform for processing and persisting bioinformatics data. It has a large collection of tools for different domains. ASaiM [22] is a Galaxy distribution that is set up with metagenomic tools and workflows.
A detailed discussion of various tools for qPCR analysis and their potential use for laboratory diagnostics is found in Krause et al. [7,10]. The tools examined are of limited suitability for medical laboratories as they were primarily designed for research, cover only part of the laboratory process, and have not been validated for diagnostic use according to regulatory legislation [9]. The same limitations also apply to the other tools discussed in this section.
2.2. Reporting and Visualization
In genomics, there is a strong need for visualization because of the dimension, complexity, and heterogeneity of data [23]. For example, attempts to use visualization in metagenomic analyses have been made by many researchers. GutMeta contains more than 90 projects and makes available several visualization techniques to reveal relationships among biological data. Specifically, it shows a correlation matrix and a radial tree as central techniques [24]. Another technique employed is the horizon chart technique, which consists of a compact stacked area chart representation that helps to find patterns over time [25]. In general, a single visualization is not enough to support the analysis process, thus multiple coordinated visualizations are mandatory in this context [26,27]. This is also reflected by existing surveys on biovisualization that mostly focus on specific aspects of the data or specific biological analysis tasks. Kerren and Schreiber [28] presented a survey focused on network visualization, with a specific focus on cellular networks. They review existing biological approaches and highlight how analysis and visualization tools for biological networks are increasingly available. One example is the KEGG pathway maps that detail molecular interactions and reactions [28,29]. Another survey focused on visualizing medical data using glyphs [30]. They provide six guidelines for the usage of the glyph technique. Suschnigg et al. [31] propose a multivariate synchronized visualization that also uses glyphs to visualize anomalies in cyclic time series data. Even if the domain they explore is in the automotive sector, their tool can be adapted to the biological domain. When high-dimensional data must be analyzed, glyphs can be combined with dimensionality reduction techniques such as principal component analysis (PCA) or t-distributed stochastic neighbor embedding (t-SNE) [32].
These visualizations are important for research but are not adapted for visualizing GBDD of individual patients. Traditionally, results from medical laboratories are visualized only in a very simplistic way, if at all. For example, many laboratory parameters have a reference range, and the visualization is limited to representing this reference range along with the measured value. However, such simplistic visualizations quickly reach their limits with GBDD, since many results cannot be represented in 1D. Moreover, software for creating laboratory reports is often a fixed part of laboratory information management systems (LIMS) and is thus only adaptable and expandable to a limited extent.
2.3. Big Data Frameworks
Big data frameworks allow the processing and storage of large quantities of data. To make this possible, they allow data to be processed and stored on distributed systems. Through dynamic scaling, additional resources can be added as needed. Other typical characteristics of big data frameworks are their fault tolerance, the provision of efficient algorithms for the analysis and processing of distributed data, and the management of large, heterogeneous data sets. The most popular frameworks are Hadoop, Spark, and Flink [33].
Apache Hadoop is used for big data processing and storage and is characterized by fault tolerance, scalability, and parallel processing of computations [34]. Structured and unstructured data sets can be processed. Hadoop consists of the core components HDFS, YARN, and MapReduce. HDFS is the storage of a Hadoop cluster and forms the distributed storage layer. YARN is responsible for cluster resource management within a Hadoop cluster and takes care of workload scheduling. MapReduce facilitates the efficient processing and analysis of extensive data sets through a parallel programming model.
Apache Spark is a distributed and high-performance data processing platform comprising several components accessible via an API [34]. Spark’s high-level architecture includes the Cluster Manager, Driver Program, and Executor. The Cluster Manager manages the servers in the cluster that run Spark applications, while the Driver Program is responsible for running the Spark application and communicating with the Cluster Manager and Executors in the Spark cluster. The Executors are processes that run on the worker nodes and process the tasks assigned by the Driver while reporting the status and their results to the Driver.
The Spark ecosystem includes Spark Core, Spark Streaming, Spark SQL, GraphX, MLib, SparkR, and standard libraries for various programming languages. Spark Core contains the system for parallel data processing, while the other components are extensions for specific functions, such as streaming, SQL, and machine learning. Spark has a large user base and an active development community.
Apache Flink allows parallel stream and batch processing [33]. It has a data flow programming model that performs operations such as aggregation, filtering, and mapping on data streams. Savepoints and checkpoints, with resume or recovery, respectively, provide fault tolerance [35]. These streams can come from several sources, including but not limited to Apache Kafka and Cassandra and HDFS. Flink also offers an SQL-like API. It is sometimes compared to Spark as both systems employ a lambda architecture.
Other noticeable frameworks include Apache Beam and Apache Samza. Apache Samza has an API that unifies batch and stream processing in real time and fault tolerance capabilities [36], while Apache Beam offers a unified programming model for runners implemented in multiple runtimes such as Spark, Samza, and Flink [37].
2.4. Distributed Storage Systems
For the persistence of GBDD, storage systems are required that allow fast access from distributed systems and are easy to expand if necessary.
HDFS is the distributed and scalable file system used in Hadoop [34]. An HDFS cluster consists of a name node, which manages the metadata of the files, and any number of data nodes, which manage the actual data in the form of blocks. Due to the redundant storage of blocks on multiple nodes, HDFS can guarantee a high level of fault tolerance.
Ceph is a general-purpose distributed file system that also scales across many nodes [38]. It offers several storage types and APIs for accessing data. Data and metadata are stored redundantly on several nodes to achieve higher fault tolerance.
2.5. Workflow Management Systems
Workflow management systems (WMS) are tools that support the automation of processes. They allow users to define, execute, and monitor workflows. Workflows consist of a series of tasks that can depend on each other. WMS support the transparency of processes, in which they can make the individual steps and the status of workflow visible. By dividing processes into individual tasks, workflows also enable improved resilience because, depending on the WMS, individual steps that have failed can be repeated [14]. Workflow definition languages like CWL [14] allow the sharing of workflows across different WMS and execution environments.
Airflow is a WMS that was initially developed by Airbnb and is now being further developed as part of the Apache Software Foundation. Workflows are defined in code using Python. In principle, tasks can be defined in any language, as long as they are executable via the shell. Apache Airflow has a large community and is actively developed further [39].
Luigi is a WMS developed by Spotify that enables the orchestration of complex data pipelines and tasks [40]. Tasks define their dependencies and are executed when all of them are satisfied. Luigi is known for its easy learning curve and has a large and active community. Compared to Apache Airflow, Luigi is easier to set up. However, the comparatively simplistic user interface and the lack of integrated features for parallelization and scaling of tasks are disadvantages.
Depending on the use case, commercial cloud-based WMSs such as AWS Step Functions and Azure Logic Apps might also be considered [41]. They offer scalability and easy integration with other cloud services, making them a logical choice for workflows that involve cloud-based tasks.
2.6. Distributed System Paradigms
Representational state transfer (REST) is a software architecture for creating web services characterized by six typical properties [42]. A uniform interface is used to access resources in the system. Resources are addressed via a URL and queried or modified using the HTTP protocol and HTTP verbs such as GET and POST. A client–server architecture separates the responsibilities between client and server and lets them work independently. Statelessness denotes the absence of session-based functions, i.e., the management of client state on the server. Each request is thus considered on its own and contains all the information needed to process the request. Cacheability refers to the possibility of declaring responses as cacheable and thus allowing the temporary storage of responses on the client in order to improve performance. The use of layered systems allows an abstraction where the client does not need to know the exact processing logic behind the API. Code on demand allows code (e.g., Javascript) to be transmitted through the interface and executed on the client. The latter criterion is optional and is not used in many APIs.
Microservices are an architectural style in which an application is structured as a collection of loosely coupled services [43]. Each microservice is responsible for a specific task and can be deployed and scaled independently, which can provide greater flexibility and resilience than more monolithic architectures. This can be beneficial in complex systems where different components have different requirements or are developed by different teams. For example, a system might use one microservice for user authentication, another for data analysis, and a third for generating reports. By breaking down the system into smaller components, it can be easier to develop, deploy, and maintain the application. Microservices also manage their own state, e.g., by using and having exclusive access to a database tailored to the application purpose. This makes microservices very modular and easy to replace without affecting other parts of the application. Access to and communication between microservices is done via defined APIs. Microservices are often used together with container technologies such as Docker and Kubernetes, as these can significantly simplify the deployment of many services. The advantages of microservices can thus be summarized in better scalability, higher flexibility, increased resilience, faster deployment, and improved efficiency of the development teams [43,44].
2.7. Event-Driven Architecture
Event-driven architecture (EDA) is a design approach in which application components communicate with each other using events [45]. An event is a message that describes a state change and can be triggered both by external actions, such as user interactions, and by internal mechanisms, such as timers or other scheduled processes. In an EDA, event-producing components are called producers and event-receiving components are called consumers. Components can be producers and consumers at the same time.
Closely related to EDA is the technique of event sourcing, which involves storing all state changes in the system as events in an event log [43]. The current state of the system can be reconstructed by replaying these events, enabling reproducibility and transparency. Event sourcing also provides an audit trail of all changes to the system, making it easier to identify the source of errors and debug issues [15].
EDA is a flexible and scalable design paradigm, which is particularly well suited for the development of distributed systems [15,43]. Among other attributes, the advantage of an EDA lies in the decoupling of components and the associated modularity and reusability. Producers and consumers do not need to know about each other’s existence, which makes it easier to add new components to the system without affecting existing ones. Combined with event sourcing, EDA also enables reproducibility and transparency. An EDA can be implemented well with microservices since they also emphasize modularity and the independence of components. EDA can be used in practice in many ways, such as implementing event-driven workflows, processing data in real time, and integrating systems with different architectures.
To support EDA, event brokers can be used to provide communication channels for events, route events to the appropriate consumers, and persist events for future processing. Examples of event brokers include Apache Kafka, RabbitMQ, Azure Service Bus, Azure Event Grid, and Amazon EventBridge. By providing a standardized interface for handling events, they simplify the implementation of EDA and make it easier to manage and scale distributed systems.
2.8. Deployment
GBDD applications require suitable technologies to deploy the individual components and the application as a whole. They ensure that applications can be run effectively, with minimal downtime and high scalability. Due to their flexibility, container-based approaches have been particularly prominent in recent years. Containers isolate applications from the running operating system by providing a consistent and predictable environment. Container-based approaches allow developers to package an application with all its dependencies into a container image that can run on any machine, making it easier to move the application across different environments.
Docker [46] is the most popular container platform and the foundation for many other tools. Docker enables the development, deployment, and execution of container-based applications on many operating systems. Docker Compose enables the definition and execution of applications that consist of multiple containers. Docker Swarm is used for distributed execution and scaling of Docker containers on a cluster. Kubernetes performs a similar function but offers extended functionalities and is thus also suitable for more complex applications.
3. Technical Architecture
To meet the requirements of laboratory diagnostics better and more comprehensively, a technical architecture based on the GenDAI conceptual model and the discussed technologies for EDA-based systems and big data processing can be designed. The model presented here uses an EDA-based approach that embeds existing analysis tools into a common architecture and is also easy to deploy using containers. The approach allows the development of a scalable, reliable, and efficient platform for the analysis of GBDD.
The use of an EDA enables a high level of transparency for all relevant actions performed, as event communication between components can be observed and recorded. Additionally, inputs and outputs can be tracked. By carefully designing the components, processing can also occur deterministically, enabling the reproducibility of all analyses. Event sourcing also allows the local data of individual microservices to be restored at any time.
Figure 2 shows an overview of the technical architecture with the event hub as the core of the EDA. The components are orchestrated with the help of a WMS in which the workflows are defined. This makes it possible to react flexibly to new requirements and to use existing and established tasks. For the same reason, the use of workflows also represents the core of the GenDAI conceptual model. Within the EDA, the WMS reacts to events and triggers new events that cause components to execute tasks. A modular web app acts as a front to enable the management of data, workflows, and results. To be as independent as possible from specific execution environments and to simplify deployment, a web application is used that communicates with the backend using microservices.
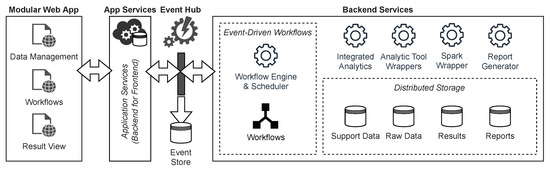
Figure 2.
Technical Architecture of the Solution.
Tasks are implemented as microservices. This allows them to be developed independently from the rest of the system, which facilitates the implementation of new requirements. It also enables them to be deployed and scaled separately based on their demands, thus improving the system’s scalability as a whole. In order to avoid having to reimplement existing analysis procedures from scratch, they can be wrapped in microservices using a mediator-wrapper approach. In contrast, implementing less complex analyses directly is another viable option. For more complex analyses that need to process large quantities of data in parallel and for which there are no ready-made tools, Apache Spark can be integrated via wrapper microservices. Apache Spark was chosen for its ease of use and large community [47], but other big data frameworks such as Hadoop or Flink could be used as well. The reporting and visualization of test results are also implemented as a separate microservice and thus enable both the integration of existing software through wrappers and the implementation of new approaches. These services support the interaction and perception aspect of the GenDAI conceptual model [11].
A distributed storage system is used to store input data, output data, intermediate results, and auxiliary data, which can be accessed by the components either directly or via suitable microservices. This storage system maps to the persistence layer in the GenDAI conceptual model. Using a distributed storage system for persistence allows the system to scale beyond the storage capabilities of a single computer.
To facilitate deployment and enable dynamic scaling of each component and the system as a whole, a container orchestration solution is used.
Figure 3 shows a more detailed overview of the respective components and their interdependencies. The front end allows new data to be added by calling a storage microservice, which stores the data in the distributed storage. The front end also allows new workflows to be triggered in the WMS. State transitions in the workflow are triggered by events and can trigger new events. These events are processed by the event hub and can be queried by interested consumers. Analytics microservices subscribe to events that trigger the start of an analysis and execute the required analyses. If the microservice is a wrapper, the wrapped tool is executed accordingly. When an analysis is completed, the results are stored in the distributed storage, and an event is generated and forwarded to the event hub. This event can again lead to a change in the state of the workflow, which can trigger additional components, such as the reporting microservice. The results stored in the distributed storage can be viewed via the front end after the workflow is complete.
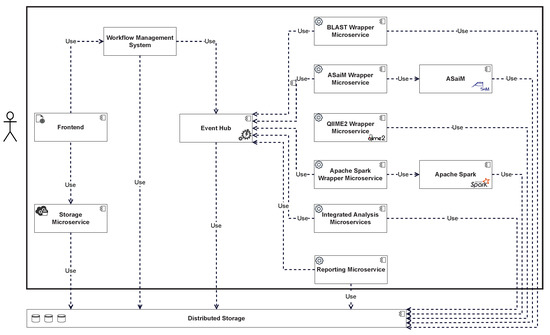
Figure 3.
Component Overview and Dependencies.
Figure 4 shows an example of a simple workflow for performing an analysis and then generating a report as an activity diagram with rounded rectangles representing action tasks in the workflow and diamonds representing waiting tasks to be triggered by external events. Figure 5 expands this to show the associated communication between the components involved with the same example workflow. The events sent and received in the system are shown as rectangles in the “Events” row.
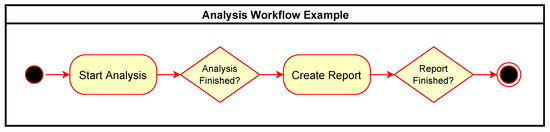
Figure 4.
Simple analysis workflow example.
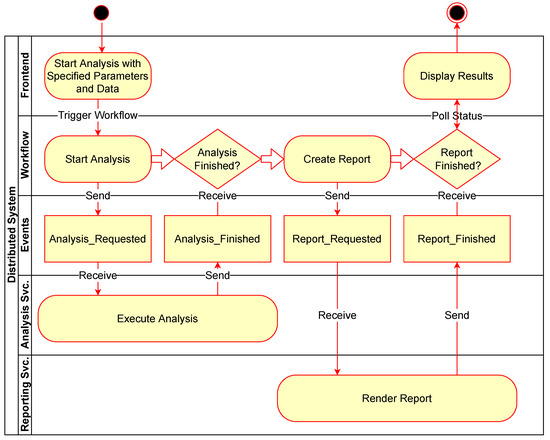
Figure 5.
Flow of events with coresponding workflow and principal components.
In summary, the technical architecture presented here provides a scalable, reliable, and efficient platform for the analysis of GBDD that is designed to meet the requirements of laboratory diagnostics, such as high transparency and reproducibility.
4. GenomicInsights Prototype
A prototype called “GenomicInsights” was developed, which implements a subset of the components and functions discussed above (Figure 6) to test the proposed model. The source code has been published on GitHub [48]. GenomicInsights uses Apache Kafka as the event broker and Apache Airflow as the workflow engine due to its high scalability. Two workflows were implemented in this framework. The first workflow performs a calculation of the GC content of an input file and outputs the distribution graphically. For this purpose, a microservice is used that performs the calculation directly within the service. The second workflow performs a BLAST analysis. For this, a BLAST microservice wrapper is used, which executes the BLAST command line tool with the input file and stores the results. In both cases, the results are collected by a simple report microservice and made available to the user interface. To simplify the development and deployment of the initial prototype and because the primary focus was on the event communication infrastructure, there is no analysis task implemented to use Apache Spark yet. However, this is planned for future implementation.
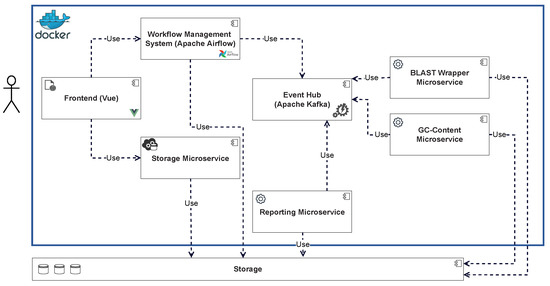
Figure 6.
Implemented components of the GenomicInsights prototype.
Workflows in Apache Airflow are defined in Python. An example workflow, as shown in Figure 4, can be implemented as shown in Listing 1. The PythonOperator tasks send defined events to a Kafka topic while the PythonSensor tasks wait for specific events. Sequential workflows can be defined by sequencing the two task types using the >> operator. Figure 7 shows the workflow in the Apache Airflow web interface.
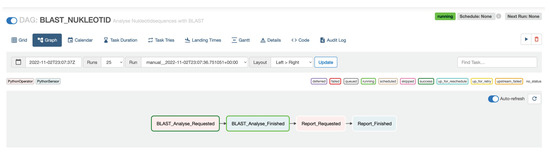
Figure 7.
Workflow in Apache Airflow.
| Listing 1. Apache Airflow workflow definition in GenomicInsights. |
with DAG("BLAST_NUKLEOTID", ...) as dag: |
t1 = PythonOperator(task_id="BLAST_Analysis_Requested", ...) |
t2 = PythonSensor(task_id="BLAST_Analysis_Finished", ...) |
t3 = PythonOperator(task_id="Report_Requested", ...) |
t4 = PythonSensor(task_id="Report_Finished", ...) |
t1 >> t2 >> t3 >> t4 |
A web-based user interface was developed with Vue [49], which can be used to upload data, start analyses, and view results. To achieve this, the user interface has access to the REST-based Apache Airflow API to list available workflows, start workflows, and monitor currently running workflows. It also has access to the storage system to upload input data and view result data.
For simplicity, a real distributed storage system was not used in GenomicInsights. Instead, a simple file share was used, and a microservice was developed that allows access to this storage from the user interface. The storage microservice was implemented in a way that allows easy switching to a real distributed storage system without requiring changes in the client.
Figure 8 shows a sequence diagram that exemplifies the communication between the respective components. The user uploads data from the front end, which invokes the storage microservice. The user can then request a list of available workflows, which is queried from Apache Airflow and displayed in the user interface (Figure 9). A list of available data files that have previously been uploaded is also queried from the storage service. After the user selects a workflow, such as “BLAST”, and a matching data file, the workflow is triggered using Apache Airflow. The user interface then switches to a detailed view that monitors the invoked workflow and regularly polls the current state. As part of the BLAST workflow, Apache Airflow sends a BLAST_Analysis_Requested to the event bus and waits for a corresponding BLAST_Analysis_Finished event. The event data contains all parameters to execute the analysis and to match the events to the correct workflow instance. The BLAST microservice is triggered by listening to BLAST_Analysis_Requested events and executes the analysis. Upon finishing the analysis, the service sends a BLAST_Analysis_Finished event, which triggers the continuation of the workflow in Apache Airflow. As a second task in the BLAST workflow, a report is requested using the Report_Requested event that is subsequently received and evaluated by the reporting microservice. The reporting microservice summarizes the results of the analysis and prepares a downloadable report that is persisted in storage. The service then sends a Report_Finished event, which terminates the workflow in Apache Airflow. After polling the workflow state, the user interface enables the operator to download the report file using the storage microservice (Figure 10).
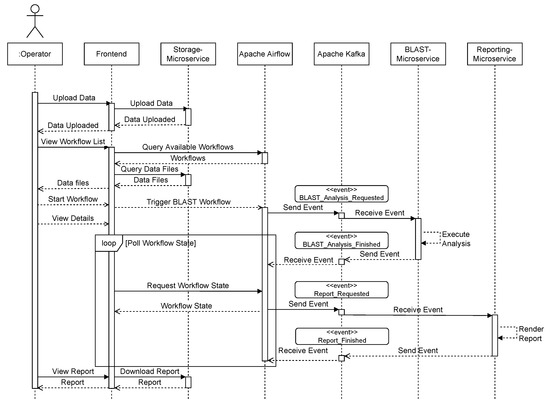
Figure 8.
Sequence of events in GenomicInsights for BLAST workflow example run.
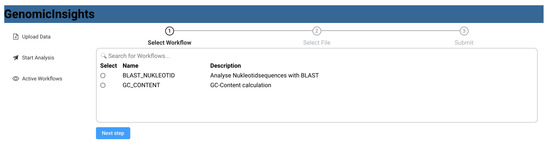
Figure 9.
GenomicInsights: List of available workflows.
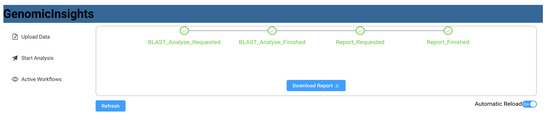
Figure 10.
GenomicInsights: finished analysis and report download.
For the deployment of the solution, Docker Compose was used as it is easy to set up and the advanced features of Docker Swarm or Kubernetes were not needed for the first iteration of GenomicInsights. Wherever possible, existing Docker images were used as base images and then configured for each individual component. Docker Compose files were used to manage multiple dependent Docker containers, their network, and volumes.
In summary, GenomicInsights enables the execution and monitoring of user-defined workflows in an EDA and provides example implementations for standard analysis tasks and reporting that can be used in workflows. Overall, it demonstrates the feasibility of the proposed EDA model for genomic data analysis and the potential benefits of using EDAs for scientific computing in laboratory diagnostics.
5. Evaluation
The evaluation of GenomicInsights and the model was conducted qualitatively and quantitatively. For the qualitative evaluation, functional tests were performed using sample data to validate the results against the expected results. Quantitatively, the performance of the solution was evaluated by measuring the times for different analyses.
For the evaluation of the GC content workflow, a test dataset from the NIH Human Microbiome Project [50] was used. Each file in the dataset was about 15 gigabytes in size and took approximately 40 min to process on a Macbook Pro (2021 model, M1 Pro CPU, 32GB RAM). The performance was primarily determined by the Biopython library [51] that was used in the analysis microservice. For the BLAST workflow, a test dataset (“Seq2”) from a guide of National Library of Medicine [52] was used and matched with the partial database “NT.00” from [53]. Due to the small file size, the BLAST analysis required only 45 s on the same Macbook Pro. The results were compared and found consistent with the results of an online BLAST search. An excerpt from the generated BLAST report for the test dataset is shown in Figure 11.
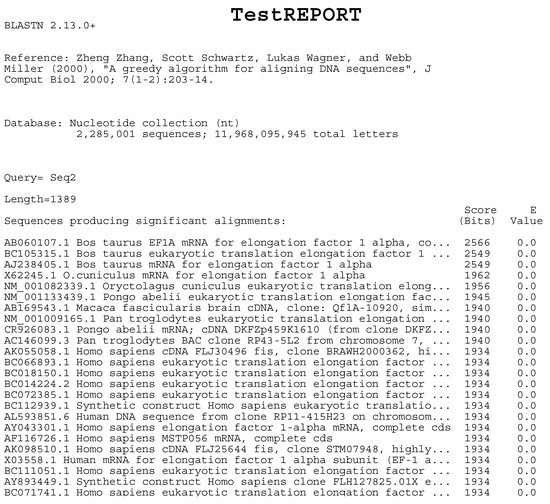
Figure 11.
BLAST result example (excerpt).
Although the user interface was not the focus of GenomicInsights, a rudimentary usability analysis was performed using a cognitive walkthrough. Several areas of improvement were identified, such as the lack of an overview of all running workflows with a detailed display of progress and error states. Additionally, the navigation, layout, and ease of use could be improved to make the platform more user-friendly.
It should be noted that the evaluation of GenomicInsights was limited in scope and focused primarily on functionality and performance. Further evaluation would be required to assess the scalability and robustness of GenomicInsights under different conditions. Examples could include tests using multiple large datasets that are beyond the capabilities of a single system and load tests using multiple concurrent users to test the scalability of the system. Systematic tests of failure conditions and recovery mechanisms, such as outages of the involved services, would also be required to assess the robustness.
6. Conclusions and Future Work
GBDD play a major role in laboratory medicine. Thus, computer systems that process GBDD efficiently and reliably are essential. Transparency and reproducibility play a particularly important role in ensuring the reliability of such systems. An EDA offers favorable conditions to implement these requirements. GenomicInsights is based on an EDA and was developed for GBDD analyses. It demonstrates the feasibility of this approach and could serve as a foundational model for a scalable, dependable, and efficient platform that fulfills the requirements of laboratory diagnostics for automation, reliability, transparency, reproducibility, robustness, and accessibility in the analysis of GBDD. The combination with container-based deployment technologies allows rapid deployment of the platform across diverse computing environments and facilitates scalability. A limitation of the GenomicInsights prototype is that it focuses on the general event architecture and the implementation of example workflows. To actually address many of the challenges that were outlined, future work is needed.
In the future, GenomicInsights needs to be further developed and evaluated on larger data sets and concurrent use. In order to demonstrate the actual scalability of the approach, load tests must be carried out with large data volumes that exceed the capacities of individual computers. In this course, the storage solution used in GenomicInsights must be replaced with a truly distributed storage system based on CEPH. Additionally, when appropriate, analysis tasks should be implemented in Apache Spark or other big data frameworks such as Hadoop or Flink. To demonstrate the advantage of using an EDA, more complex workflows from real laboratory use cases should be evaluated. The use of Kubernetes could further simplify deployment and introduce automatic load-based scaling.
Other sub-areas of the GenDAI model that were not considered in GenomicInsights should also be looked at in the future. These include, for example, the required long-term archiving of all data and the use of artificial intelligence (AI) to support and perform analyses. In this context, new challenges also arise for the visualization of test results, which must present complex data in a simple way and, at the same time, make the AI-supported diagnoses comprehensible and explainable.
Usability improvements can be made by developing a comprehensive user interface that includes enhanced monitoring capabilities to increase the transparency of GenomicInsights and allow users to easily track the progress of their analyses to identify any errors that occur. Future work should also investigate ways to integrate external services, such as LIMS.
Author Contributions
Conceptualization, T.K. and M.Z.; methodology, M.H.; software, M.Z.; validation, M.Z.; investigation, T.K. and M.Z.; writing—original draft preparation, T.K.; writing—review and editing, S.B., T.R., P.B., M.K. and P.M.K.; visualization, T.K. and M.Z.; supervision, M.H. and M.X.B.; project administration, T.K. and M.Z. All authors have read and agreed to the published version of the manuscript.
Funding
This research received no external funding.
Institutional Review Board Statement
Not applicable.
Informed Consent Statement
Not applicable.
Data Availability Statement
Not applicable.
Conflicts of Interest
The authors declare no conflict of interest.
References
- Behrouzi, A.; Nafari, A.H.; Siadat, S.D. The significance of microbiome in personalized medicine. Clin. Transl. Med. 2019, 8, 16. [Google Scholar] [CrossRef] [PubMed]
- Krause, T.; Wassan, J.T.; Mc Kevitt, P.; Wang, H.; Zheng, H.; Hemmje, M. Analyzing Large Microbiome Datasets Using Machine Learning and Big Data. BioMedInformatics 2021, 1, 138–165. [Google Scholar] [CrossRef]
- Krause, T.; Glau, L.; Jolkver, E.; Leonardi-Essmann, F.; Mc Kevitt, P.; Kramer, M.; Hemmje, M. Design and Development of a qPCR-based Mitochondrial Analysis Workflow for Medical Laboratories. BioMedInformatics 2022, 2, 643–653. [Google Scholar] [CrossRef]
- Liu, Y.X.; Qin, Y.; Chen, T.; Lu, M.; Qian, X.; Guo, X.; Bai, Y. A practical guide to amplicon and metagenomic analysis of microbiome data. Protein Cell 2021, 12, 315–330. [Google Scholar] [CrossRef]
- Stephens, Z.D.; Lee, S.Y.; Faghri, F.; Campbell, R.H.; Zhai, C.; Efron, M.J.; Iyer, R.; Schatz, M.C.; Sinha, S.; Robinson, G.E. Big Data: Astronomical or Genomical? PLoS Biol. 2015, 13, e1002195. [Google Scholar] [CrossRef] [PubMed]
- Chen, X.W.; Lin, X. Big Data Deep Learning: Challenges and Perspectives. IEEE Access 2014, 2, 514–525. [Google Scholar] [CrossRef]
- Krause, T.; Jolkver, E.; Mc Kevitt, P.; Kramer, M.; Hemmje, M. A Systematic Approach to Diagnostic Laboratory Software Requirements Analysis. Bioengineering 2022, 9, 144. [Google Scholar] [CrossRef]
- Grömminger, S. IVDR—In-Vitro-Diagnostic Device Regulation. Available online: https://www.johner-institute.com/articles/regulatory-affairs/ivd-regulation-ivdr/ (accessed on 30 May 2023).
- The European Parliament and the Council of the European Union. In Vitro Diagnostic Regulation. 2017. Available online: http://data.europa.eu/eli/reg/2017/746/2017-05-05 (accessed on 30 May 2023).
- Krause, T.; Jolkver, E.; Bruchhaus, S.; Kramer, M.; Hemmje, M. An RT-qPCR Data Analysis Platform. In Proceedings of the Collaborative European Research Conference (CERC 2021), Cork, Ireland, 9–10 September 2021; Afli, H., Bleimann, U., Burkhardt, D., Hasanuzzaman, M., Loew, R., Reichel, D., Wang, H., Zheng, H., Eds.; 2021. [Google Scholar]
- Krause, T.; Jolkver, E.; Bruchhaus, S.; Kramer, M.; Hemmje, M. GenDAI—AI-Assisted Laboratory Diagnostics for Genomic Applications. In Proceedings of the 2021 IEEE International Conference on Bioinformatics and Biomedicine (BIBM), Houston, TX, USA, 9–12 December 2021. [Google Scholar] [CrossRef]
- Krause, T.; Jolkver, E.; Bruchhaus, S.; Mc Kevitt, P.; Kramer, M.; Hemmje, M. A Preliminary Evaluation of “GenDAI”, an AI-Assisted Laboratory Diagnostics Solution for Genomic Applications. BioMedInformatics 2022, 2, 332–344. [Google Scholar] [CrossRef]
- Reis, T.; Bornschlegl, M.X.; Hemmje, M. AI2VIS4BigData: A Reference Model for AI-Based Big Data Analysis and Visualization. In Proceedings of the Advanced Visual Interfaces, Ischia, Italy, 9 June 2020; Reis, T., Bornschlegl, M.X., Angelini, M., Hemmje, M., Eds.; Springer Nature: Berlin/Heidelberg, Germany, 2021; Volume 12585, pp. 1–18. [Google Scholar] [CrossRef]
- Perkel, J.M. Workflow systems turn raw data into scientific knowledge. Nature 2019, 573, 149–150. [Google Scholar] [CrossRef]
- Kleppmann, M.; Beresford, A.R.; Svingen, B. Online Event Processing. Queue 2019, 17, 116–136. [Google Scholar] [CrossRef]
- Camacho, C.; Coulouris, G.; Avagyan, V.; Ma, N.; Papadopoulos, J.; Bealer, K.; Madden, T.L. BLAST+: Architecture and applications. BMC Bioinform. 2009, 10, 421. [Google Scholar] [CrossRef]
- Balvočiūtė, M.; Huson, D.H. SILVA, RDP, Greengenes, NCBI and OTT—How do these taxonomies compare? BMC Genom. 2017, 18, 114. [Google Scholar] [CrossRef]
- Bolyen, E.; Rideout, J.R.; Dillon, M.R.; Bokulich, N.A.; Abnet, C.C.; Al-Ghalith, G.A.; Alexander, H.; Alm, E.J.; Arumugam, M.; Asnicar, F.; et al. Reproducible, interactive, scalable and extensible microbiome data science using QIIME 2. Nat. Biotechnol. 2019, 37, 852–857. [Google Scholar] [CrossRef] [PubMed]
- Krause, T.; Andrade, B.G.N.; Afli, H.; Wang, H.; Zheng, H.; Hemmje, M. Understanding the Role of (Advanced) Machine Learning in Metagenomic Workflows. In Proceedings of the Advanced Visual Interfaces, Ischia, Italy, 9 June 2020; Reis, T., Bornschlegl, M.X., Angelini, M., Hemmje, M., Eds.; Springer Nature: Berlin/Heidelberg, Germany, 2021; Volume 12585, pp. 56–82. [Google Scholar]
- Gonzalez, A.; Navas-Molina, J.A.; Kosciolek, T.; McDonald, D.; Vázquez-Baeza, Y.; Ackermann, G.; DeReus, J.; Janssen, S.; Swafford, A.D.; Orchanian, S.B.; et al. Qiita: Rapid, web-enabled microbiome meta-analysis. Nat. Methods 2018, 15, 796–798. [Google Scholar] [CrossRef]
- Afgan, E.; Baker, D.; Batut, B.; van den Beek, M.; Bouvier, D.; Čech, M.; Chilton, J.; Clements, D.; Coraor, N.; Grüning, B.A.; et al. The Galaxy platform for accessible, reproducible and collaborative biomedical analyses: 2018 update. Nucleic Acids Res. 2018, 46, W537–W544. [Google Scholar] [CrossRef] [PubMed]
- Batut, B.; Gravouil, K.; Defois, C.; Hiltemann, S.; Brugère, J.F.; Peyretaillade, E.; Peyret, P. ASaiM: A Galaxy-based framework to analyze raw shotgun data from microbiota. bioRxiv 2017, 183970. [Google Scholar] [CrossRef]
- Nusrat, S.; Harbig, T.; Gehlenborg, N. Tasks, Techniques, and Tools for Genomic Data Visualization. Comput. Graph. Forum 2019, 38, 781–805. [Google Scholar] [CrossRef] [PubMed]
- Jiang, Y.; Wang, Y.; Che, L.; Zhou, Q.; Li, S. GutMeta: Online Microbiome Analysis and Interactive Visualization with Build-In Curated Human Gut Microbiome Database. bioRxiv 2022. [Google Scholar] [CrossRef]
- Fink, I.; Abdill, R.J.; Blekhman, R.; Grieneisen, L. BiomeHorizon: Visualizing Microbiome Time Series Data in R. mSystems 2022, 7. [Google Scholar] [CrossRef]
- O’Donoghue, S.I.; Gavin, A.C.; Gehlenborg, N.; Goodsell, D.S.; Hériché, J.K.; Nielsen, C.B.; North, C.; Olson, A.J.; Procter, J.B.; Shattuck, D.W.; et al. Visualizing biological data-now and in the future. Nat. Methods 2010, 7, S2–S4. [Google Scholar] [CrossRef]
- Cruz, A.; Arrais, J.P.; Machado, P. Interactive and coordinated visualization approaches for biological data analysis. Briefings Bioinform. 2019, 20, 1513–1523. [Google Scholar] [CrossRef] [PubMed]
- Kerren, A.; Schreiber, F. Network Visualization for Integrative Bioinformatics. In Approaches in Integrative Bioinformatics; Chen, M., Hofestädt, R., Eds.; Springer: Berlin/Heidelberg, Germnay, 2014; pp. 173–202. [Google Scholar] [CrossRef]
- Kanehisa, M.; Furumichi, M.; Sato, Y.; Kawashima, M.; Ishiguro-Watanabe, M. KEGG for taxonomy-based analysis of pathways and genomes. Nucleic Acids Res. 2023, 51, D587–D592. [Google Scholar] [CrossRef] [PubMed]
- Ropinski, T.; Oeltze, S.; Preim, B. Survey of glyph-based visualization techniques for spatial multivariate medical data. Comput. Graph. 2011, 35, 392–401. [Google Scholar] [CrossRef]
- Suschnigg, J.; Mutlu, B.; Koutroulis, G.; Sabol, V.; Thalmann, S.; Schreck, T. Visual Exploration of Anomalies in Cyclic Time Series Data with Matrix and Glyph Representations. Big Data Res. 2021, 26, 100251. [Google Scholar] [CrossRef]
- Kammer, D.; Keck, M.; Grunder, T.; Maasch, A.; Thom, T.; Kleinsteuber, M.; Groh, R. Glyphboard: Visual Exploration of High-Dimensional Data Combining Glyphs with Dimensionality Reduction. IEEE Trans. Vis. Comput. Graph. 2020, 26, 1661–1671. [Google Scholar] [CrossRef]
- Nazari, E.; Hasan Shahriari, M.; Tabesh, H. BigData Analysis in Healthcare: Apache Hadoop, Apache spark and Apache Flink. Front. Health Inform. 2019, 8, 14. [Google Scholar] [CrossRef]
- Benlachmi, Y.; El Yazidi, A.; Hasnaoui, M.L. A Comparative Analysis of Hadoop and Spark Frameworks using Word Count Algorithm. Int. J. Adv. Comput. Sci. Appl. 2021, 12. [Google Scholar] [CrossRef]
- Rao, T.R.; Mitra, P.; Bhatt, R.; Goswami, A. The big data system, components, tools, and technologies: A survey. Knowl. Inf. Syst. 2019, 60, 1165–1245. [Google Scholar] [CrossRef]
- Noghabi, S.A.; Paramasivam, K.; Pan, Y.; Ramesh, N.; Bringhurst, J.; Gupta, I.; Campbell, R.H. Samza: Stateful scalable stream processing at LinkedIn. Proc. VLDB Endow. 2017, 10, 1634–1645. [Google Scholar] [CrossRef]
- The Apache Software Foundation. Apache Beam. Available online: https://beam.apache.org/ (accessed on 26 February 2023).
- Weil, S.; Brandt, S.A.; Miller, E.L.; Long, D.D.E.; Maltzahn, C. Ceph: A Scalable, High-Performance Distributed File System. In Proceedings of the 7th Conference on Operating Systems Design and Implementation (OSDI ’06), Seattle, WA, USA, 6–8 November 2006. [Google Scholar]
- Haines, S. Workflow Orchestration with Apache Airflow. In Modern Data Engineering with Apache Spark; Haines, S., Ed.; Apress: Berkeley, CA, USA, 2022; pp. 255–295. [Google Scholar] [CrossRef]
- Bernhardsson, E.; Freider, E. Luigi. Available online: https://github.com/spotify/luigi (accessed on 27 February 2023).
- Kumar, M. Serverless Architectures Review, Future Trend and the Solutions to Open Problems. Am. J. Softw. Eng. 2019, 6, 1–10. [Google Scholar] [CrossRef]
- Fielding, R.T.; Taylor, R.N. Principled design of the modern Web architecture. ACM Trans. Internet Technol. 2002, 2, 115–150. [Google Scholar] [CrossRef]
- Gilbert, J. Software Architecture Patterns for Serverless Systems, 1st ed.; Packt Publishing Limited: Birmingham, UK, 2021. [Google Scholar]
- Dragoni, N.; Giallorenzo, S.; Lafuente, A.L.; Mazzara, M.; Montesi, F.; Mustafin, R.; Safina, L. Microservices: Yesterday, Today, and Tomorrow. In Present and Ulterior Software Engineering; Mazzara, M., Meyer, B., Eds.; Springer: Cham, Switzerland, 2017; pp. 195–216. [Google Scholar] [CrossRef]
- Fowler, M. What Do You Mean by “Event-Driven”? Available online: https://martinfowler.com/articles/201701-event-driven.html (accessed on 19 April 2022).
- Bashari Rad, B.; Bhatti, H.; Ahmadi, M. An Introduction to Docker and Analysis of its Performance. IJCSNS Int. J. Comput. Sci. Netw. Secur. 2017, 173, 8. [Google Scholar]
- Capuccini, M.; Dahlö, M.; Toor, S.; Spjuth, O. MaRe: Processing Big Data with application containers on Apache Spark. GigaScience 2020, 9. [Google Scholar] [CrossRef] [PubMed]
- Krause, T.; Zickfeld, M.; Müller, K. GenomicInsights GitHub Repository. Available online: https://github.com/aKzenT/GenomicInsights (accessed on 9 May 2023).
- You, E. Vue.js Developers. Vue 3. 2023. Available online: https://vuejs.org/ (accessed on 30 May 2023).
- NIH Human Microbiome Project. Data Portal—SRS012969. Available online: https://portal.hmpdacc.org/files/596fc2de57601ec08a01fdee59b509b1 (accessed on 12 February 2023).
- Cock, P.J.A.; Antao, T.; Chang, J.T.; Chapman, B.A.; Cox, C.J.; Dalke, A.; Friedberg, I.; Hamelryck, T.; Kauff, F.; Wilczynski, B.; et al. Biopython: Freely available Python tools for computational molecular biology and bioinformatics. Bioinformatics 2009, 25, 1422–1423. [Google Scholar] [CrossRef]
- National Library of Medicine. NCBI BLAST: Extra Exercises Part 1: Identifying Sequences. Available online: https://guides.nnlm.gov/tutorial/ncbi-blast-identify-and-compare-sequences-v2/single-page (accessed on 12 February 2023).
- National Center for Biotechnology Information. The BLAST Databases—Nucleotide Collection (nt). Available online: https://ftp.ncbi.nlm.nih.gov/blast/db/nt.00.tar.gz (accessed on 12 February 2023).


Disclaimer/Publisher’s Note: The statements, opinions and data contained in all publications are solely those of the individual author(s) and contributor(s) and not of MDPI and/or the editor(s). MDPI and/or the editor(s) disclaim responsibility for any injury to people or property resulting from any ideas, methods, instructions or products referred to in the content. |
© 2023 by the authors. Licensee MDPI, Basel, Switzerland. This article is an open access article distributed under the terms and conditions of the Creative Commons Attribution (CC BY) license (https://creativecommons.org/licenses/by/4.0/).