
Lower Limb Muscle Strength Matters: Effect of Relative Isometric Strength on Countermovement and Rebound Jump Performance in Elite Youth Female Soccer Players


Abstract
1. Introduction
2. Materials and Methods
2.1. Experimental Setup
2.2. Participants
2.3. Procedures
2.4. Data Analyses
2.5. Statistical Analyses
3. Results
4. Discussion
5. Conclusions
Author Contributions
Funding
Institutional Review Board Statement
Informed Consent Statement
Data Availability Statement
Conflicts of Interest
Abbreviations
| IMTP | Isometric mid-thigh pull |
| CMJ | Countermovement jump |
| CMJ-R | Countermovement rebound jump |
| PODS | Person, outcome, driver, strategy |
| mRSI | Modified reactive strength index |
| RSI | Reactive strength index |
| ICC | Intraclass correlation coefficient |
| CV | Coefficient of variation |
| 95CI | 95% confidence intervals |
| g | Hedges g effect size |
References
- FIFA. Women’s Football Member Association Survey Report. 2019. Available online: https://inside.fifa.com/womens-football/member-associations-survey-report-2023 (accessed on 16 June 2025).
- FIFA. Women’s Football Member Association Survey Report. 2023. Available online: https://digitalhub.fifa.com/m/28ed34bd888832a8/original/FIFA-Women-s-Football-MA-Survey-Report-2023.pdf (accessed on 26 September 2024).
- FIFA. Women’s Football Strategy. 2018. Available online: https://inside.fifa.com/womens-football/strategy (accessed on 13 May 2025).
- Union of European Football Associations (UEFA). Women’s Football Across the National Associations 2017. 2017. Available online: https://www.uefa.com/MultimediaFiles/Download/OfficialDocument/uefaorg/Women%27sfootball/02/43/13/56/2431356_DOWNLOAD.pdf (accessed on 13 May 2025).
- Union of European Football Associations (UEFA). Time for Action: UEFA Strategy 2019–2024. 2019. Available online: https://www.uefa.com/news-media/news/0251-0f8e6ba98884-3dd4ba899f93-1000--time-for-action-first-ever-uefa-women-s-football-strateg/ (accessed on 13 May 2025).
- Union of European Football Associations (UEFA). Together for the future of football: UEFA strategy 2019–2024. 2019. Available online: https://editorial.uefa.com/resources/0269-1267e6a556ce-3b9dd3e7e6ec-1000/together_for_the_future_of_football.pdf (accessed on 13 May 2025).
- Harkness-Armstrong, A.; Till, K.; Datson, N.; Myhill, N.; Emmonds, S. A systematic review of match-play characteristics in women’s soccer. PLoS ONE 2022, 17, e0268334. [Google Scholar] [CrossRef] [PubMed]
- Scott, D.; Haigh, J.; Lovell, R. Physical characteristics and match performances in women’s international versus domestic-level football players: A 2-year, league-wide study. Sci. Med. Footb. 2020, 4, 211–215. [Google Scholar] [CrossRef]
- Okholm Kryger, K.; Wang, A.; Mehta, R.; Impellizzeri, F.M.; Massey, A.; McCall, A. Research on women’s football: A scoping review. Sci. Med. Footb. 2022, 6, 549–558. [Google Scholar] [CrossRef] [PubMed]
- McQuilliam, S.J.; Clark, D.R.; Erskine, R.M.; Brownlee, T.E. Mind the gap! A survey comparing current strength training methods used in men’s versus women’s first team and academy soccer. Sci. Med. Footb. 2022, 6, 597–604. [Google Scholar] [CrossRef]
- Okholm Kryger, K.; Wang, A.; Mehta, R.; Impellizzeri, F.; Massey, A.; Harrison, M.; Glendinning, R.; McCall, A. Can we evidence-base injury prevention and management in women’s football? A scoping review. Res. Sports Med. 2023, 31, 687–702. [Google Scholar] [CrossRef]
- Patel, A.D.; Bullock, G.S.; Wrigley, J.; Paterno, M.V.; Sell, T.C.; Losciale, J.M. Does sex affect second ACL injury risk? A systematic review with meta-analysis. Br. J. Sports Med. 2021, 55, 873–882. [Google Scholar] [CrossRef]
- Emmonds, S.; Heyward, O.; Jones, B. The Challenge of Applying and Undertaking Research in Female Sport. Sports Med. Open 2019, 5, 51. [Google Scholar] [CrossRef]
- Randell, R.K.; Clifford, T.; Drust, B.; Moss, S.L.; Unnithan, V.B.; De Ste Croix, M.B.A.; Datson, N.; Martin, D.; Mayho, H.; Carter, J.M.; et al. Physiological Characteristics of Female Soccer Players and Health and Performance Considerations: A Narrative Review. Sports Med. 2021, 51, 1377–1399. [Google Scholar] [CrossRef]
- Nimphius, S. Exercise and Sport Science Failing by Design in Understanding Female Athletes. Int. J. Sports Physiol. Perform. 2019, 14, 1157–1158. [Google Scholar] [CrossRef]
- Martinez-Hernandez, D.; Quinn, M.; Jones, P. Most common movements preceding goal scoring situations in female professional soccer. Sci. Med. Footb. 2024, 8, 260–268. [Google Scholar] [CrossRef]
- Larruskain, J.; Lekue, J.A.; Diaz, N.; Odriozola, A.; Gil, S.M. A comparison of injuries in elite male and female football players: A five-season prospective study. Scand. J. Med. Sci. Sports 2018, 28, 237–245. [Google Scholar] [CrossRef] [PubMed]
- Lopez-Valenciano, A.; Raya-Gonzalez, J.; Garcia-Gomez, J.A.; Aparicio-Sarmiento, A.; Sainz de Baranda, P.; De Ste Croix, M.; Ayala, F. Injury Profile in Women’s Football: A Systematic Review and Meta-Analysis. Sports Med. 2021, 51, 423–442. [Google Scholar] [CrossRef] [PubMed]
- Lopez-Valenciano, A.; Raya-Gonzalez, J.; Garcia-Gomez, J.A.; Aparicio-Sarmiento, A.; Sainz de Baranda, P.; De Ste Croix, M.; Ayala, F. Response to Comment On: “Injury Profile in Women’s Football: A Systematic Review and Meta-Analysis”. Sports Med. 2021, 51, 2667–2670. [Google Scholar] [CrossRef] [PubMed]
- Werner, J.; Hagglund, M.; Ekstrand, J.; Walden, M. Hip and groin time-loss injuries decreased slightly but injury burden remained constant in men’s professional football: The 15-year prospective UEFA Elite Club Injury Study. Br. J. Sports Med. 2019, 53, 539–546. [Google Scholar] [CrossRef]
- Waldén, M.; Knudsen, M.; Lundblad, M.; Ekstrand, J. The Female Player: Special Considerations. In Return to Play in Football; Musahl, V., Karlsson, J., Krutsch, W., Mandelbaum, B., Espregueira-Mendes, J., d’Hooghe, P., Eds.; Springer: Berlin/Heidelberg, Germany, 2018; pp. 929–940. [Google Scholar]
- Robles-Palazon, F.J.; Lopez-Valenciano, A.; De Ste Croix, M.; Oliver, J.L.; Garcia-Gomez, A.; Sainz de Baranda, P.; Ayala, F. Epidemiology of injuries in male and female youth football players: A systematic review and meta-analysis. J. Sport. Health Sci. 2022, 11, 681–695. [Google Scholar] [CrossRef]
- Ryman Augustsson, S.; Ageberg, E. Weaker lower extremity muscle strength predicts traumatic knee injury in youth female but not male athletes. BMJ Open Sport. Exerc. Med. 2017, 3, e000222. [Google Scholar] [CrossRef]
- Comfort, P.; McMahon, J.J.; Lake, J.P.; Ripley, N.J.; Triplett, N.T.; Haff, G.G. Relative strength explains the differences in multi-joint rapid force production between sexes. PLoS ONE 2024, 19, e0296877. [Google Scholar] [CrossRef]
- Emmonds, S.; Till, K.; Redgrave, J.; Murray, E.; Turner, L.; Robinson, C.; Jones, B. Influence of age on the anthropometric and performance characteristics of high-level youth female soccer players. Int. J. Sports Sci. Coach. 2018, 13, 779–786. [Google Scholar] [CrossRef]
- Andersen, L.L.; Aagaard, P. Influence of maximal muscle strength and intrinsic muscle contractile properties on contractile rate of force development. Eur. J. Appl. Physiol. 2006, 96, 46–52. [Google Scholar] [CrossRef]
- Andersen, L.L.; Andersen, J.L.; Zebis, M.K.; Aagaard, P. Early and late rate of force development: Differential adaptive responses to resistance training? Scand. J. Med. Sci. Sports 2010, 20, e162–e169. [Google Scholar] [CrossRef]
- Lecce, E.; Romagnoli, R.; Frinolli, G.; Felici, F.; Piacentini, M.F.; Bazzucchi, I. Exerting force at the maximal speed drives the increase in power output in elite athletes after 4 weeks of resistance training. Eur. J. Appl. Physiol. 2025, 125, 327–338. [Google Scholar] [CrossRef] [PubMed]
- Suchomel, T.J.; Nimphius, S.; Stone, M.H. The Importance of Muscular Strength in Athletic Performance. Sports Med. 2016, 46, 1419–1449. [Google Scholar] [CrossRef] [PubMed]
- Linthorne, N.P. Analysis of Vertical Jumps using a force platform. Am. Assoc. Phys. Teach. 2001, 69, 1198–1204. [Google Scholar] [CrossRef]
- Weldon, A.; Duncan, M.J.; Turner, A.; Sampaio, J.; Noon, M.; Wong, D.P.; Lai, V.W. Contemporary practices of strength and conditioning coaches in professional soccer. Biol. Sport. 2021, 38, 377–390. [Google Scholar] [CrossRef]
- Merrigan, J.J.; Strang, A.; Eckerle, J.; Mackowski, N.; Hierholzer, K.; Ray, N.T.; Smith, R.; Hagen, J.A.; Briggs, R.A. Countermovement Jump Force-Time Curve Analyses: Reliability and Comparability Across Force Plate Systems. J. Strength Cond. Res. 2024, 38, 30–37. [Google Scholar] [CrossRef]
- Fahey, J.T.; Comfort, P.; Jones, P.; Ripley, N.J. Effect of 6-week single leg countermovement jump training on force time metrics in elite female youth footballers. J. Sports Sci. 2025, 43, 1196–1206. [Google Scholar] [CrossRef]
- Guthrie, B.; Jagim, A.R.; Jones, M.T. Ready or Not, Here I Come: A Scoping Review of Methods Used to Assess Player Readiness Via Indicators of Neuromuscular Function in Football Code Athletes. Strength Cond. J. 2023, 45, 93–110. [Google Scholar] [CrossRef]
- Harper, D.J.; Cohen, D.D.; Carling, C.; Kiely, J. Can Countermovement Jump Neuromuscular Performance Qualities Differentiate Maximal Horizontal Deceleration Ability in Team Sport Athletes? Sports 2020, 8, 76. [Google Scholar] [CrossRef]
- Pedley, J.; Lloyd, R.S.; Read, P.; Moore, I.; Oliver, J.L. Drop Jump: A Technical Model for Scientific Application. Strength Cond. J. 2017, 39, 36–44. [Google Scholar] [CrossRef]
- Komi, P.V.; Bosco, C. Utilization of stored elastic energy in leg extensor muscles by men and women. Med. Sci. Sports 1978, 10, 261–265. [Google Scholar]
- Costley, L.; Wallace, E.; Johnston, M.; Kennedy, R. Reliability of bounce drop jump parameters within elite male rugby players. J. Sports Med. Phys. Fit. 2018, 58, 1390–1397. [Google Scholar] [CrossRef] [PubMed]
- Comfort, P.; Dos’Santos, T.; Beckham, G.K.; Stone, M.H.; Guppy, S.N.; Haff, G.G. Standardization and Methodological Considerations for the Isometric Midthigh Pull. Strength Cond. J. 2019, 41, 57–79. [Google Scholar] [CrossRef]
- Soriano, M.A.; Paredes, V.; Comfort, P.; Jiménez-Ormeño, E.; Areces-Corcuera, F.; Giráldez-Costas, V.; Gallo-Salazar, C.; Alonso-Aubín, D.A.; Menchén-Rubio, M.; McMahon, J.J. “You Are Not Wrong About Getting Strong”: An Insight Into the Impact of Age Group and Level of Competition on Strength in Spanish Football Players. Int. J. Sports Physiol. Perform. 2024, 19, 629–636. [Google Scholar] [CrossRef] [PubMed]
- Thomas, C.; Comfort, P.; Chiang, C.Y.; Jones, P.A. Relationship between isometric mid-thigh pull variables and sprint and change of direction performance in collegiate athletes. J. Trainology 2015, 4, 6–10. [Google Scholar] [CrossRef]
- Emmonds, S.; Morris, R.; Murray, E.; Robinson, C.; Turner, L.; Jones, B. The influence of age and maturity status on the maximum and explosive strength characteristics of elite youth female soccer players. Sci. Med. Footb. 2017, 1, 209–215. [Google Scholar] [CrossRef]
- Emmonds, S.; Sawczuk, T.; Scantlebury, S.; Till, K.; Jones, B. Seasonal Changes in the Physical Performance of Elite Youth Female Soccer Players. J. Strength. Cond. Res. 2020, 34, 2636–2643. [Google Scholar] [CrossRef]
- Emmonds, S.; Scantlebury, S.; Murray, E.; Turner, L.; Robinson, C.; Jones, B. Physical characteristics of elite youth female soccer players characterized by maturity status. J. Strength Cond. Res. 2020, 38, 2321–2328. [Google Scholar] [CrossRef]
- Krzyszkowski, J.; Chowning, L.D.; Harry, J. Phase-Specific Predictors of Countermovement Jump Performance That Distinguish Good From Poor Jumpers. J. Strength Cond. Res. 2020, 36, 1257–1263. [Google Scholar] [CrossRef]
- Bernards, J.R.; Sato, K.; Haff, G.G.; Bazyler, C.D. Current Research and Statistical Practices in Sport Science and a Need for Change. Sports 2017, 5, 87. [Google Scholar] [CrossRef]
- Mengersen, K.L.; Drovandi, C.C.; Robert, C.P.; Pyne, D.B.; Gore, C.J. Bayesian Estimation of Small Effects in Exercise and Sports Science. PLoS ONE 2016, 11, e0147311. [Google Scholar] [CrossRef]
- Ripley, N.J.; Fahey, J.; Hassim, N.; Comfort, P. Effect of Relative Isometric Strength on Countermovement Jump Performance in Professional and Semi-Professional Soccer Players. Biomechanics 2025, 5, 32. [Google Scholar] [CrossRef]
- McKay, A.K.A.; Stellingwerff, T.; Smith, E.S.; Martin, D.T.; Mujika, I.; Goosey-Tolfrey, V.L.; Sheppard, J.; Burke, L.M. Defining Training and Performance Caliber: A Participant Classification Framework. Int. J. Sports Physiol. Perform. 2022, 17, 317–331. [Google Scholar] [CrossRef] [PubMed]
- Merrigan, J.J.; Stone, J.D.; Galster, S.M.; Hagen, J.A. Analyzing Force-Time Curves: Comparison of Commercially Available Automated Software and Custom MATLAB Analyses. J. Strength. Cond. Res. 2022, 36, 2387–2402. [Google Scholar] [CrossRef] [PubMed]
- Harry, J.; Blinch, J.; Barker, L.A.; Krzyszkowski, J.; Chowning, L.D. Low-Pass Filter Effects on Metrics of Countermovement Vertical Jump Performance. J. Strength Cond. Res. 2022, 36, 1459–1467. [Google Scholar] [CrossRef]
- McMahon, J.J.; Suchomel, T.J.; Lake, J.; Comfort, P. Understanding the Key Phases of the Countermovement Jump Force-Time Curve. Strength Cond. J. 2018, 40, 96–106. [Google Scholar] [CrossRef]
- Koo, T.K.; Li, M.Y. A Guideline of Selecting and Reporting Intraclass Correlation Coefficients for Reliability Research. J. Chiropr. Med. 2016, 15, 155–163. [Google Scholar] [CrossRef]
- van Doorn, J.; van den Bergh, D.; Bohm, U.; Dablander, F.; Derks, K.; Draws, T.; Etz, A.; Evans, N.J.; Gronau, Q.F.; Haaf, J.M.; et al. The JASP guidelines for conducting and reporting a Bayesian analysis. Psychon. Bull. Rev. 2021, 28, 813–826. [Google Scholar] [CrossRef]
- Hopkins, W.G. A scale of magnitudes for effect statistics. A New View Stat. 2002, 502, 321. [Google Scholar]
- McBride, J.M.; Kirby, T.J.; Haines, T.L.; Skinner, J. Relationship Between Relative Net Vertical Impulse and Jump Height in Jump Squats Performed to Various Squat Depths and with Various Loads. Int. J. Sports Physiol. Perofrmance 2010, 5, 484–496. [Google Scholar] [CrossRef]
- Barr, M.J.; Nolte, V.W. The importance of maximal leg strength for female athletes when performing drop jumps. J. Strength Cond. Res. 2014, 28, 373–380. [Google Scholar] [CrossRef]
- Cormie, P.; McGuigan, M.R.; Newton, R.U. Adaptations in athletic performance after ballistic power versus strength training. Med. Sci. Sports Exerc. 2010, 42, 1582–1598. [Google Scholar] [CrossRef] [PubMed]
- Cormie, P.; McGuigan, M.R.; Newton, R.U. Influence of strength on magnitude and mechanisms of adaptation to power training. Med. Sci. Sports Exerc. 2010, 42, 1566–1581. [Google Scholar] [CrossRef] [PubMed]
- Komi, P.V. Stretch-shortening cycle: A powerful model to study normal and fatigued muscle. J. Biomech. 2000, 33, 1197–1206. [Google Scholar] [CrossRef] [PubMed]
- Aagaard, p.; Simonsen, E.B.; Anderson, J.; Magnussen, P.; Dyhre-Poulsen, P. Neural adaptation to resistance training: Changes in evoked V-wave and H-reflex responses. J. Appl. Physiol. 1985, 92, 2309–2318. [Google Scholar] [CrossRef]
- Linthorne, N.P. The correlation between jump height and mechanical power in a countermovement jump is artificially inflated. Sports Biomech. 2020, 20, 3–21. [Google Scholar] [CrossRef]
- Bright, T.; Handford, M.J.; Hughes, J.D.; Mundy, P.D.; Lake, J.P.; Doggart, L. Development and Reliability of Countermovement Jump Performance in Youth Athletes at Pre-, Circa- and Post-Peak Height Velocity. Int. J. Strength Cond. 2023, 3, 1–14. [Google Scholar] [CrossRef]
- Thomas, C.; Jones, P.A.; Dos’Santos, T. Countermovement Jump Force-Time Curve Analysis between Strength-Matched Male and Female Soccer Players. Int. J. Environ. Res. Public Health 2022, 19, 3352. [Google Scholar] [CrossRef]


| Category | Metric |
|---|---|
| Person | Body mass (kg) |
| Outcome | Jump height (m) Rebound jump height (m) Jump momentum (kg.m/s−1) Rebound jump momentum (kg.m/s−1) mRSI (Au) RSI (Au) |
| Driver | Average braking force (N/kg) Rebound average braking force (N/kg) Average propulsive force (N/kg) Rebound average propulsive force (N/kg) Force at minimum displacement (N/kg) Rebound force at minimum displacement (N/kg) |
| Strategy | Braking phase duration (s) Propulsive phase duration (s) Time to take-off (s) Ground contact time (s) Countermovement depth (m) Rebound depth (m) |
| mRSI = modified reactive strength index, RSI = reactive strength index | |
| Metric | Jump Variant | ICC (95CI) | CV (95CI) |
|---|---|---|---|
| Person Metric | |||
| Body mass (kg) | CMJ | 1.000 (1.000, 1.000) | 0.25 (0.23, 0.27) |
| Outcome Metrics | |||
| Jump height (m) | CMJ | 0.927 (0.898, 0.927) | 3.89 (3.60, 4.18) |
| CMJ-R CMJ | 0.901 (0.863, 0.930) | 5.12 (4.74, 5.50) | |
| CMJ-RJ | 0.756 (0.675, 0.823) | 7.15 (6.61, 7.68) | |
| Jump momentum (kg·m/s−1) | CMJ | 0.992 (0.988, 0.992) | 1.77 (1.64, 1.90) |
| CMJ-RJ | 0.945 (0.924, 0.962) | 3.64 (3.37, 3.91) | |
| mRSI (Au) RSI | CMJ | 0.808 (0.742, 0.808) | 8.93 (8.270, 9.60) |
| CMJ-RJ | 0.747 (0.664, 0.816) | 9.19 (8.50, 9.87) | |
| Driver Metrics | |||
| Average braking force (N/kg) | CMJ | 0.792 (0.721, 0.850) | 5.56 (5.15, 5.98) |
| CMJ-RJ | 0.713 (0.623, 0.790) | 7.29 (6.75, 7.84) | |
| Average propulsive force (N/kg) | CMJ | 0.889 (0.848, 0.922) | 3.37 (3.12, 3.62) |
| CMJ-RJ | 0.703 (0.610, 0.782) | 6.26 (5.80, 6.73) | |
| Force at minimum displacement (N/kg) | CMJ | 0.852 (0.798, 0.895) | 5.78 (5.35, 6.21) |
| CMJ-RJ | 0.703 (0.611, 0.782) | 9.53 (8.82, 10.24) | |
| Strategy Metrics | |||
| Braking phase (s) | CMJ | 0.669 (0.606, 0.779) | 10.70 (9.90, 11.50) |
| Propulsive phase (s) | CMJ | 0.882 (0.838, 0.917) | 6.19 (5.73, 6.65) |
| Time to take-off (ms) Rebound ground contact time (ms) | CMJ | 0.755 (0.741, 0.862) | 7.69 (7.12, 8.26) |
| CMJ-RJ | 0.715 (0.625, 0.791) | 9.43 (8.73, 10.13) | |
| Countermovement depth (m) | CMJ | 0.883 (0.839, 0.917) | 7.92 (7.330, 8.51) |
| CMJ-RJ | 0.484 (0.360, 0.602) | −32.91 (−30.46, −35.36) | |
| Metric | Mean ± SD | BF10 | Bayes Interpretation | Hedges g (95CI) |
|---|---|---|---|---|
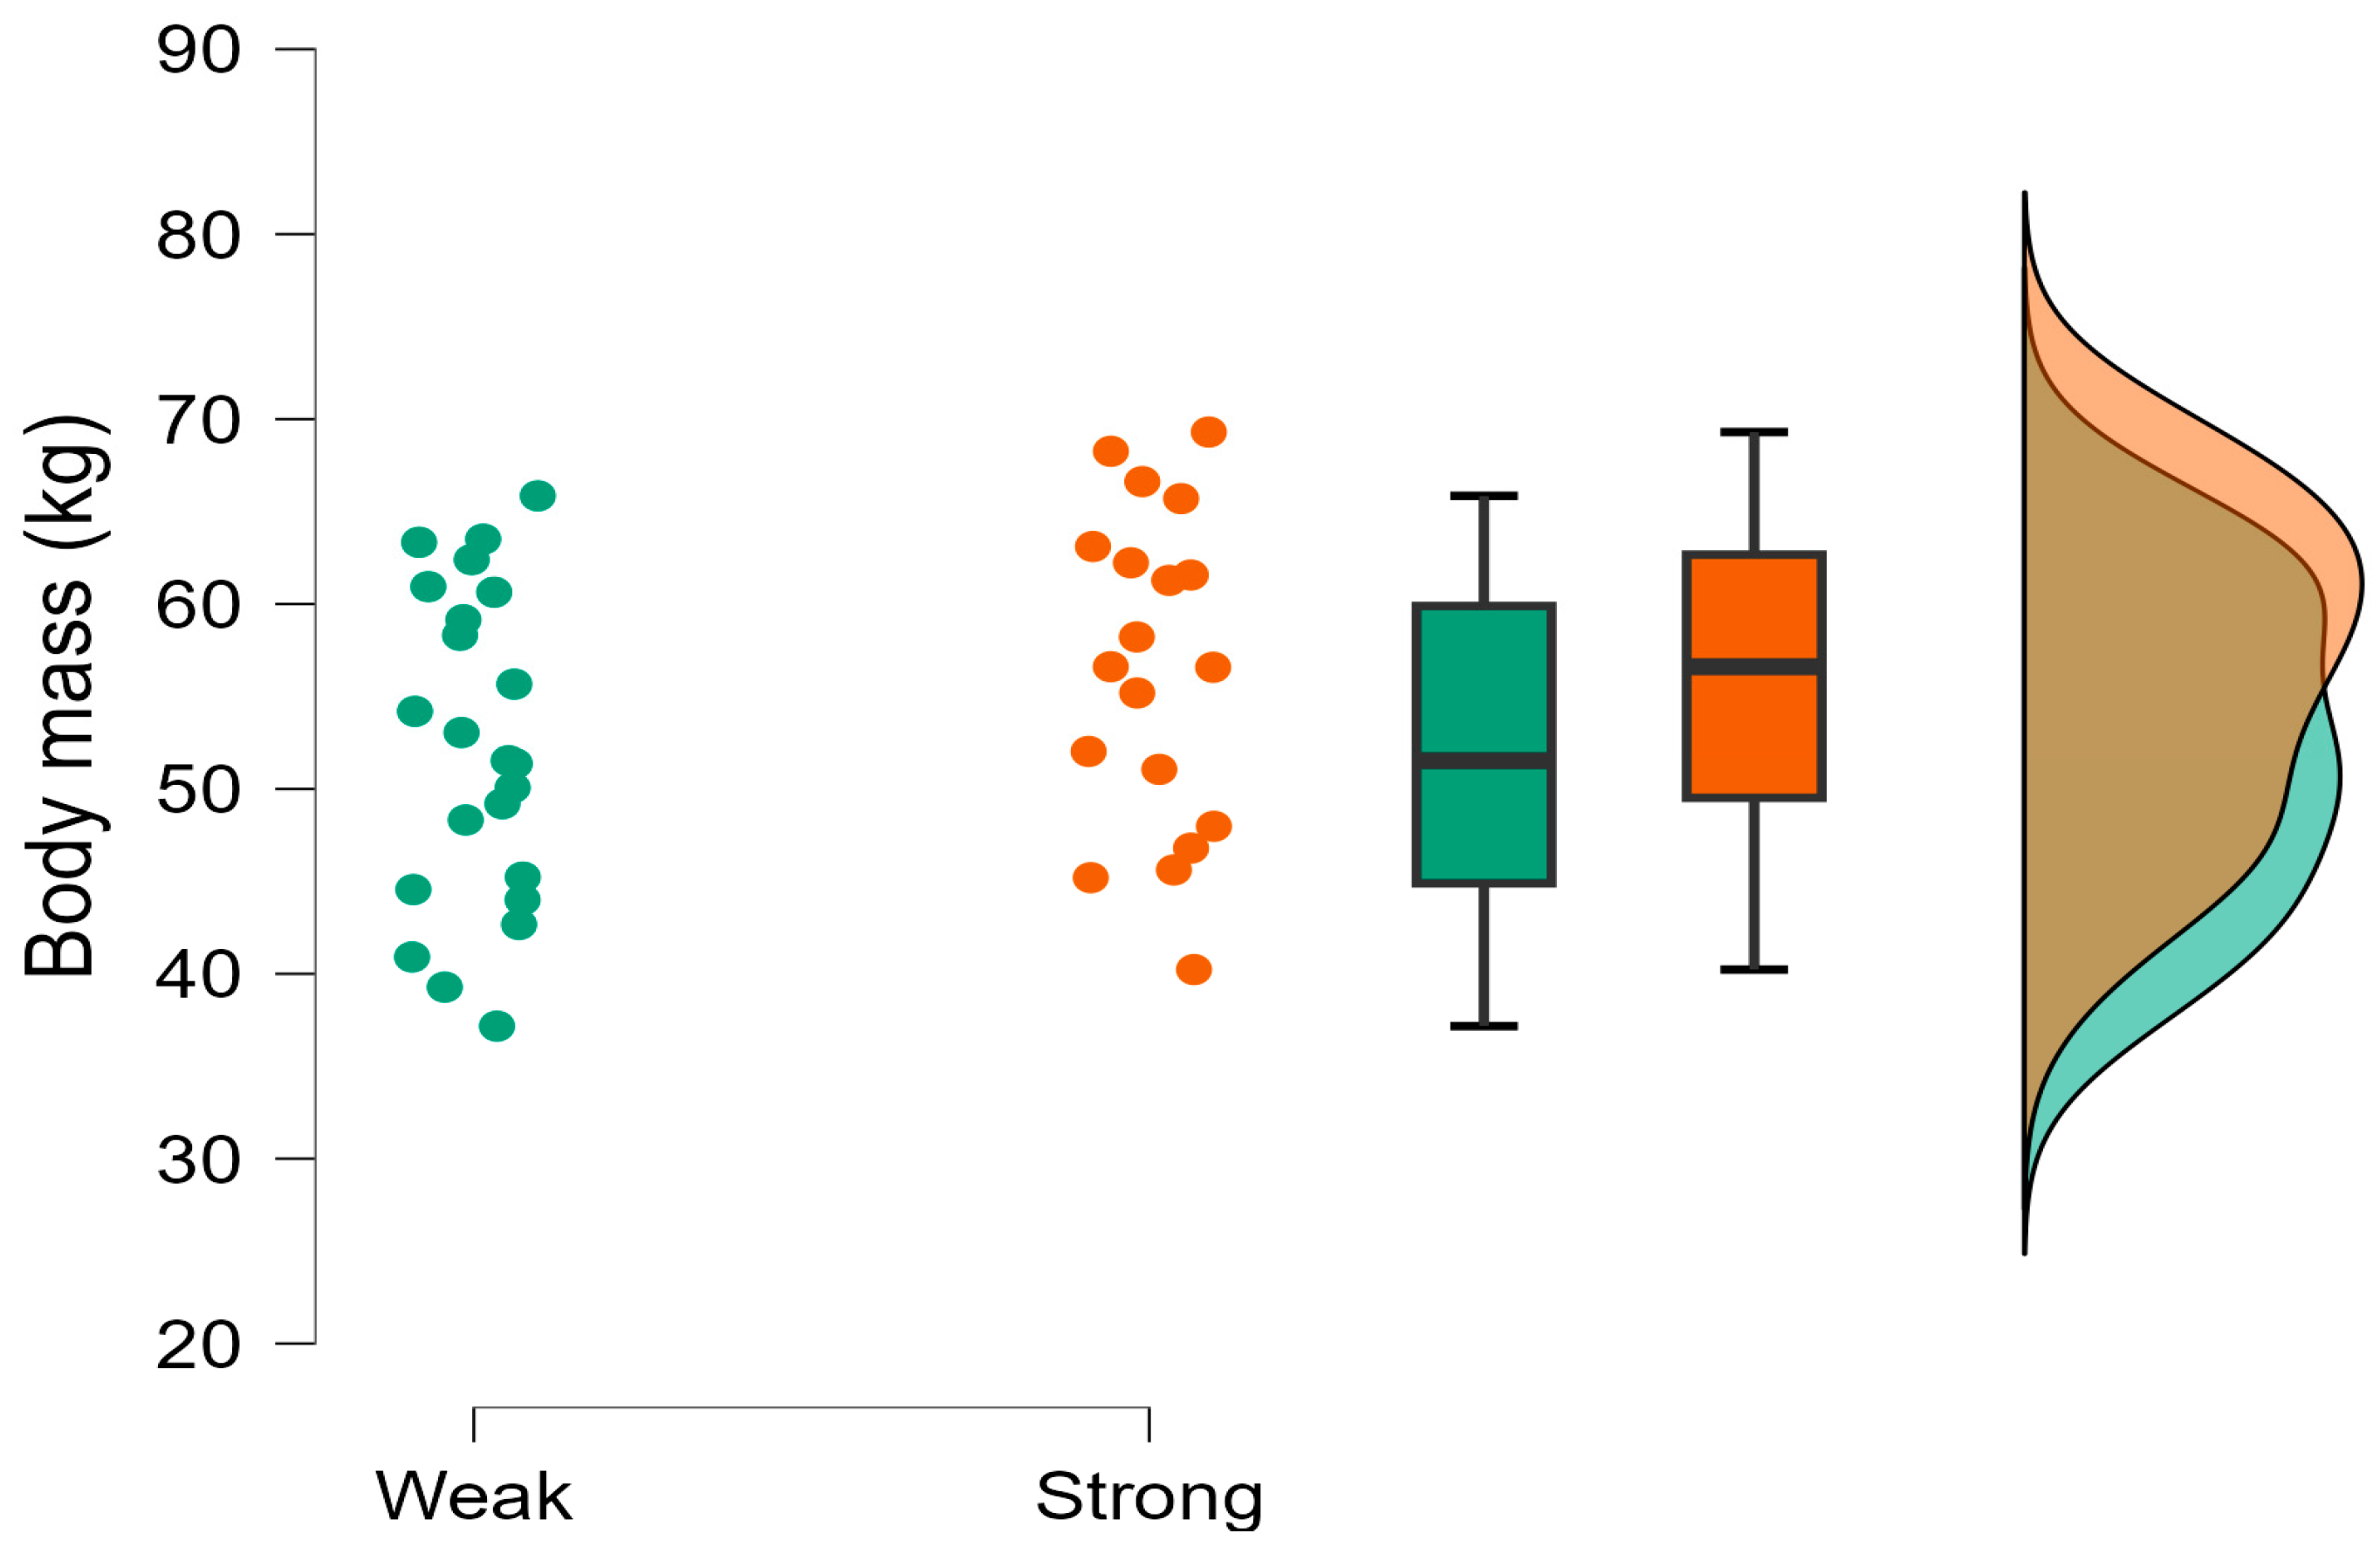
| Body Mass (kg) | Stronger = 56.51 ± 8.65, Weaker = 52.23 ± 8.55 | 1.542 | Weak evidence h1 | 0.50 (0.47, 0.54) |
| CMJ height (m) | Stronger = 0.27 ± 0.05, Weaker = 0.25 ± 0.05 | 1.204 | Weak evidence h1 | 0.68 (0.64, 0.72) |
| Rebound CMJ (m) | Stronger = 0.27 ± 0.04, Weaker = 0.22 ± 0.05 | 106.265 | Very Strong evidence h1 | 1.17 (1.11, 1.23) |
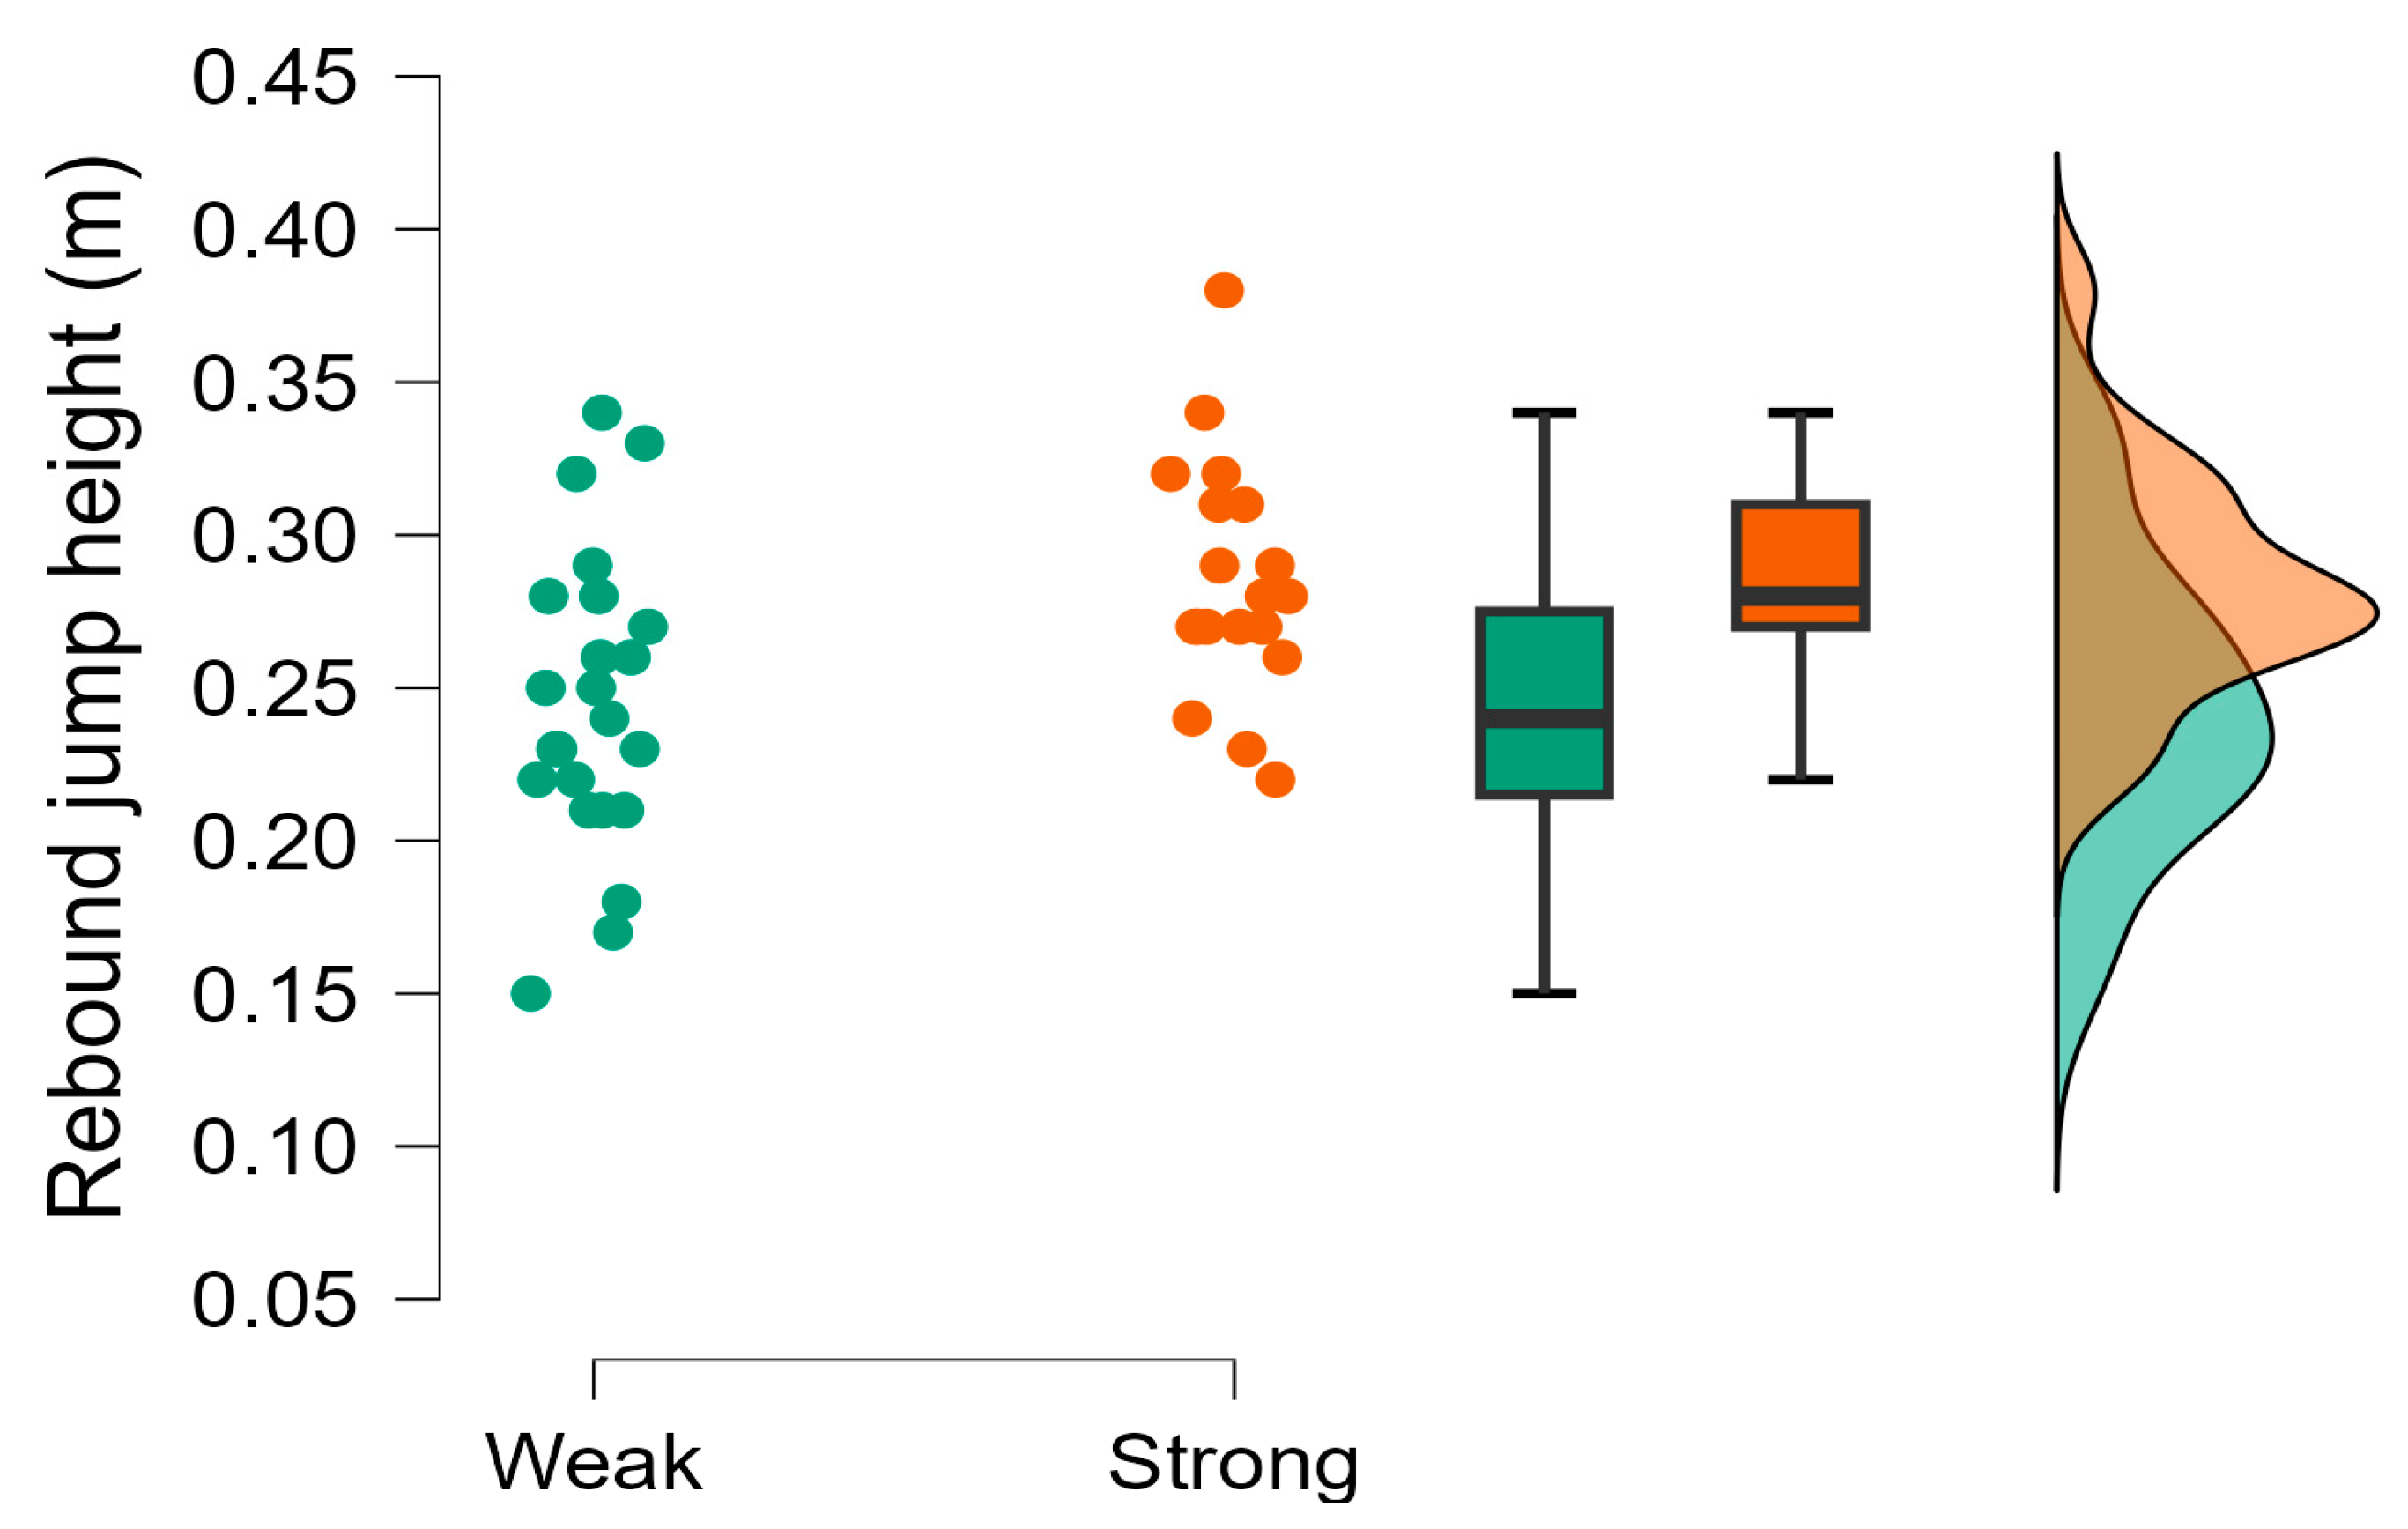
| Rebound jump height (m) | Stronger = 0.29 ± 0.04, Weaker = 0.25 ± 0.05 | 15.843 | Strong evidence h1 | 0.86 (0.82, 0.91) |
| CMJ momentum (kg.m/s−1) | Stronger = 129.63 ± 23.52, Weaker = 115.41 ± 24.39 | 2.415 | Weak evidence h1 | 0.72 (0.68, 0.76) |
| Rebound jump momentum (kg.m/s−1) | Stronger = 133.69 ± 23.66, Weaker = 114.44 ± 25.37 | 6.890 | Moderate evidence h1 | 0.77 (0.72, 0.81) |
| mRSI (Au) | Stronger = 0.41 ± 0.07, Weaker = 0.47 ± 0.14 | 0.130 | Moderate evidence h0 | −0.17 (−0.20, −0.14) |
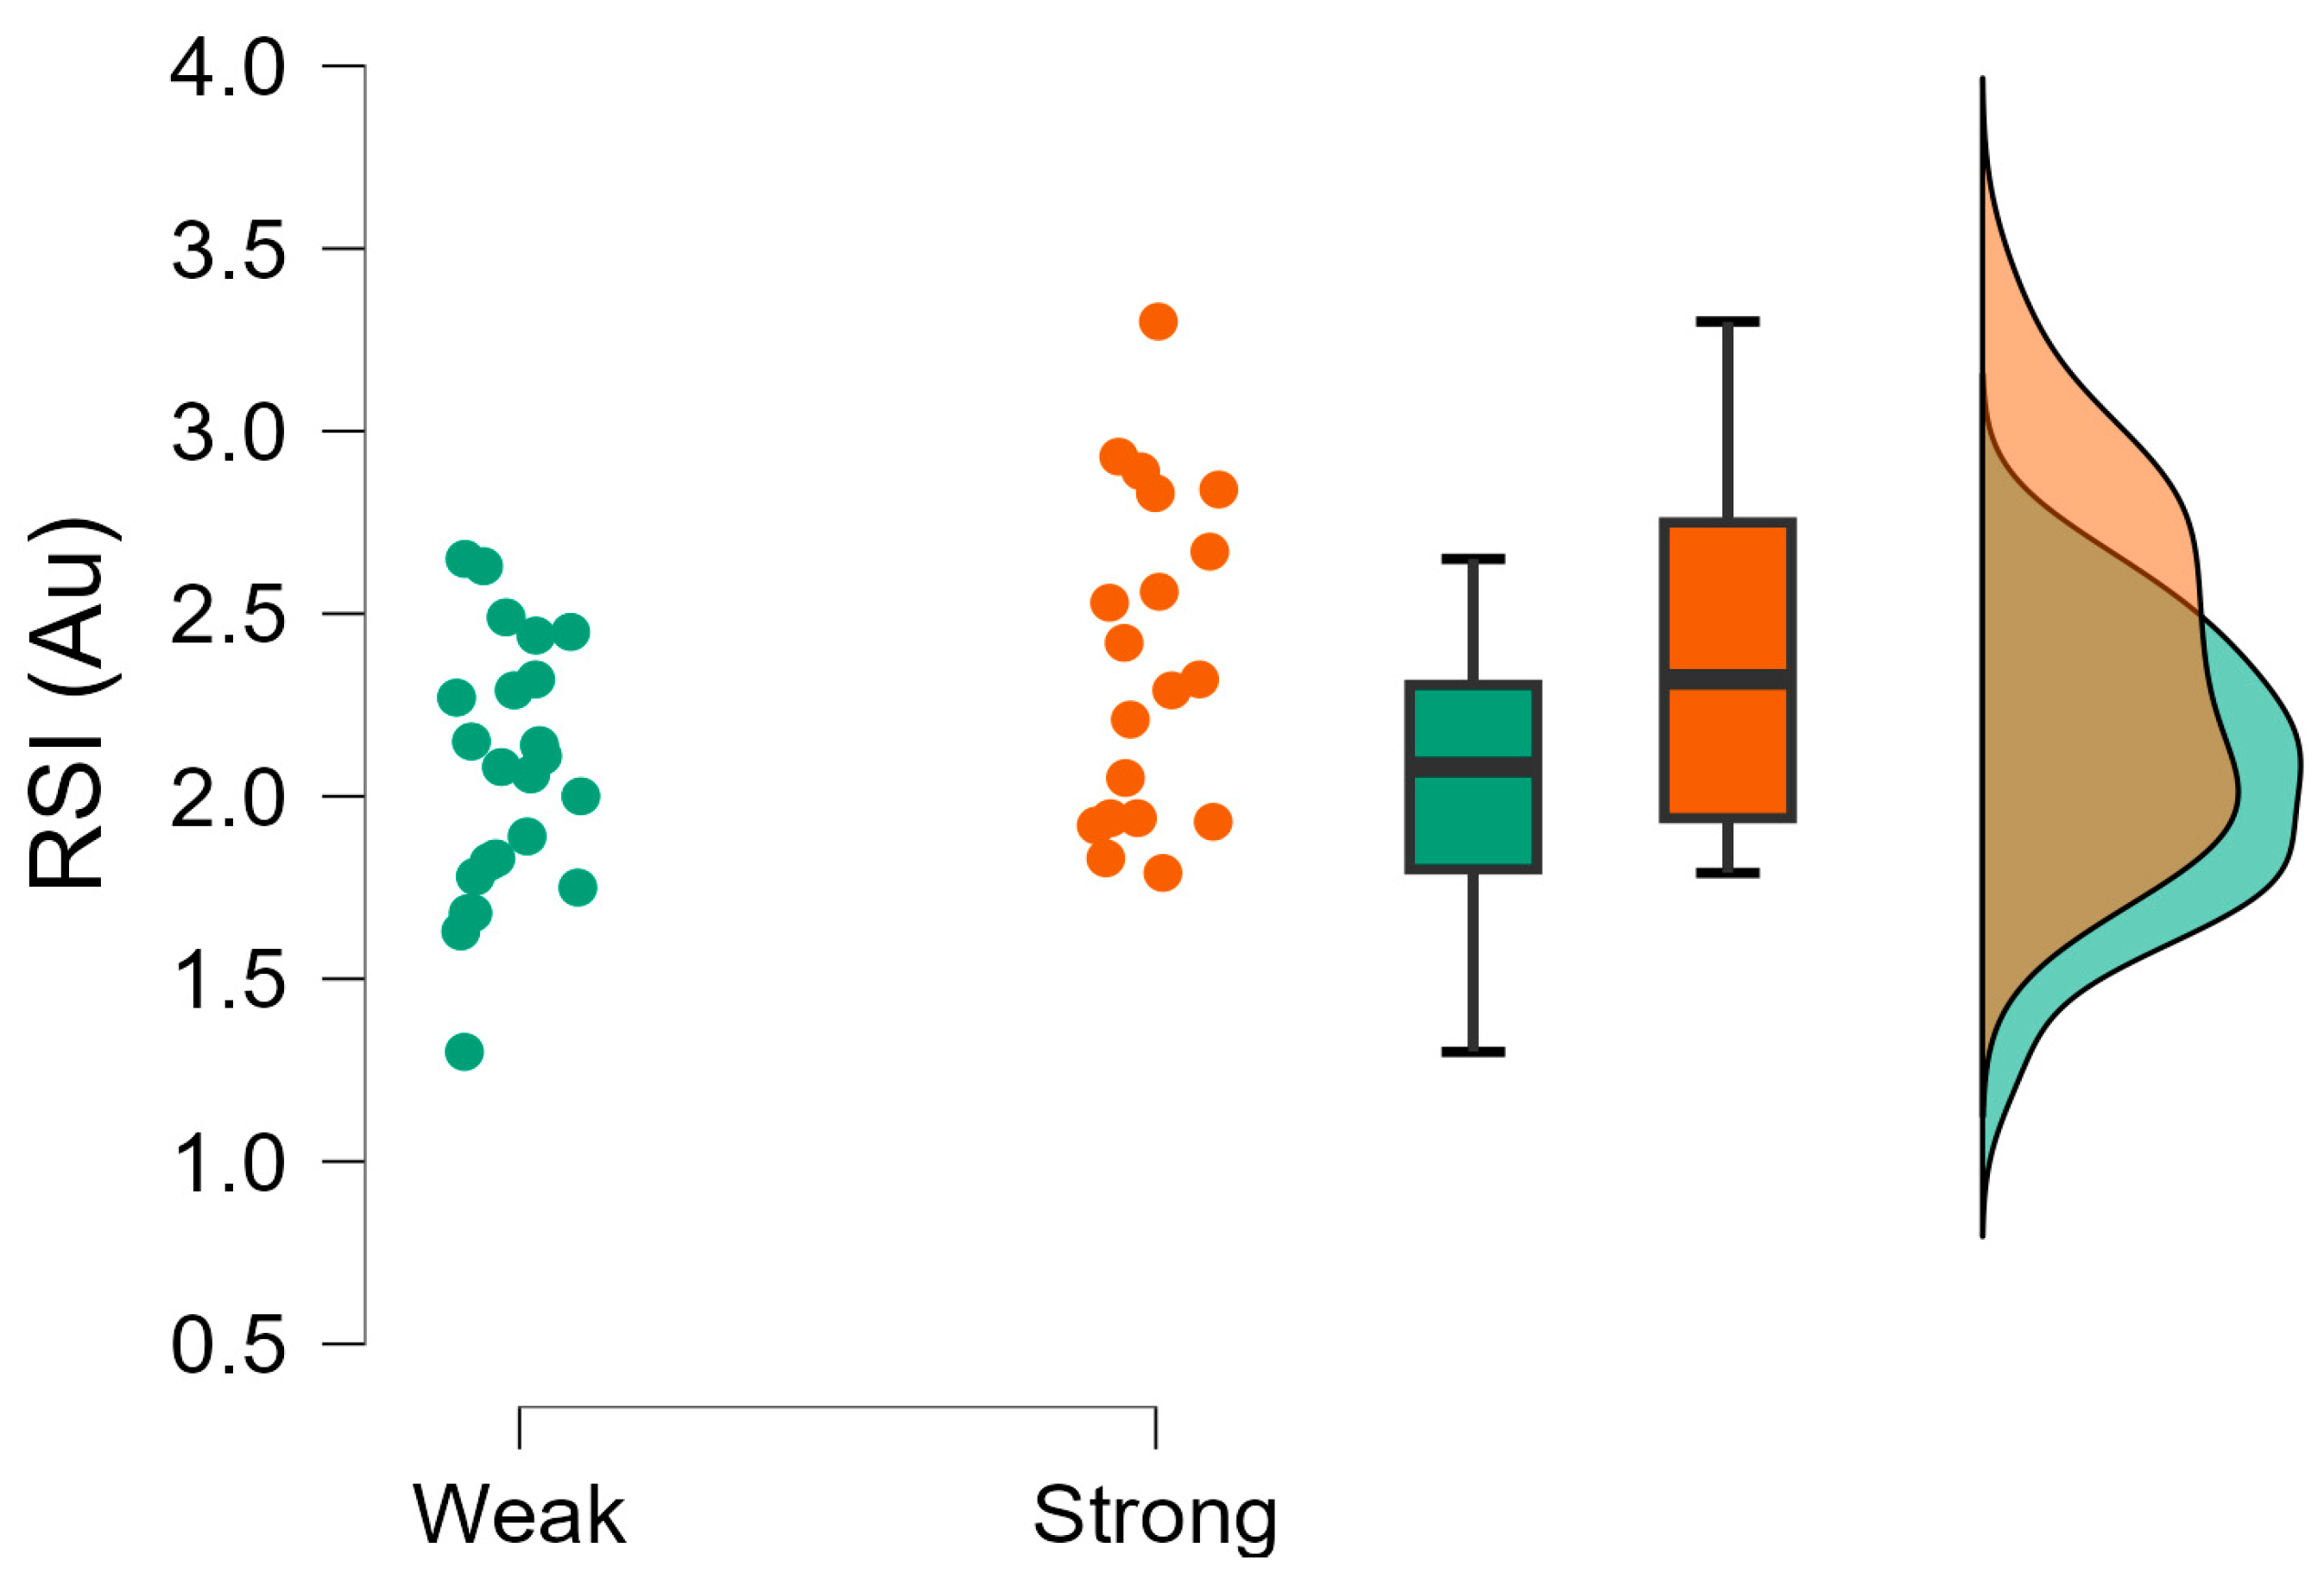
| RSI (Au) | Stronger = 2.38 ± 0.45, Weaker = 2.06 ± 0.35 | 7.580 | Moderate evidence h1 | 0.78 (0.74, 0.82) |
| CMJ average braking force (N/kg) | Stronger = 18.63 ± 2.02, Weaker = 19.80 ± 3.35 | 0.148 | Moderate evidence h0 | −0.48 (−0.52, −0.47) |
| Rebound average braking force (N/kg) | Stronger = 35.51 ± 5.42, Weaker = 31.82 ± 3.39 | 9.589 | Moderate evidence h1 | 0.82 (0.77, 0.86) |
| CMJ average propulsive force (N/kg) | Stronger = 19.28 ± 1.16, Weaker = 20.97 ± 2.99 | 0.106 | Moderate evidence h0 | −0.51 (−0.54, −0.47) |
| Rebound average propulsive force (N/kg) | Stronger = 30.59 ± 3.31, Weaker = 28.78 ± 3.51 | 1.785 | Weak evidence h1 | 0.52 (0.48, 0.55) |
| CMJ force at minimum displacement (N/kg) | Stronger = 23.53 ± 2.31, Weaker = 26.89 ± 5.36 | 0.100 | Moderate evidence h0 | −0.86 (−0.91, −0.81) |
| Rebound force at minimum displacement (N/kg) | Stronger = 51.55 ± 8.82, Weaker = 49.22 ± 7.59 | 0.667 | Weak evidence h0 | 0.28 (0.25, 0.31) |
| CMJ braking phase duration (ms) | Stronger = 144.74 ± 20.38, Weaker = 123.04 ± 45.27 | 2.491 | Weak evidence h1 | 0.78 (0.74, 0.83) |
| CMJ propulsive phase duration (ms) | Stronger = 244.74 ± 27.96, Weaker = 210.43 ± 49.03 | 9.778 | Moderate evidence h1 | 0.84 (0.80, 0.89) |
| CMJ time to take-off (ms) | Stronger = 663.68 ± 89.83, Weaker = 560.87 ± 128.41 | 15.902 | Strong evidence h1 | 0.84 (0.80, 0.89) |
| Rebound ground contact time (ms) | Stronger = 213.90 ± 34.98, Weaker = 219.36 ± 26.57 | 0.212 | Moderate evidence h0 | −0.17 (−0.20, −0.15) |
| CMJ countermovement depth (m) | Stronger = 0.26 ± 0.05, Weaker = 0.20 ± 0.06 | 55.734 | Very strong evidence h1 | −1.15 (−1.11, −1.00) |
| Rebound depth (m) | Stronger = 0.09 ± 0.03, Weaker = 0.08 ± 0.02 | 0.142 | Moderate evidence h1 | −0.43 (−0.47, −0.40) |
Disclaimer/Publisher’s Note: The statements, opinions and data contained in all publications are solely those of the individual author(s) and contributor(s) and not of MDPI and/or the editor(s). MDPI and/or the editor(s) disclaim responsibility for any injury to people or property resulting from any ideas, methods, instructions or products referred to in the content. |
© 2025 by the authors. Licensee MDPI, Basel, Switzerland. This article is an open access article distributed under the terms and conditions of the Creative Commons Attribution (CC BY) license (https://creativecommons.org/licenses/by/4.0/).
Share and Cite
Fahey, J.; Comfort, P.; Ripley, N.J. Lower Limb Muscle Strength Matters: Effect of Relative Isometric Strength on Countermovement and Rebound Jump Performance in Elite Youth Female Soccer Players. Muscles 2025, 4, 23. https://doi.org/10.3390/muscles4030023
Fahey J, Comfort P, Ripley NJ. Lower Limb Muscle Strength Matters: Effect of Relative Isometric Strength on Countermovement and Rebound Jump Performance in Elite Youth Female Soccer Players. Muscles. 2025; 4(3):23. https://doi.org/10.3390/muscles4030023
Chicago/Turabian StyleFahey, Jack, Paul Comfort, and Nicholas Joel Ripley. 2025. "Lower Limb Muscle Strength Matters: Effect of Relative Isometric Strength on Countermovement and Rebound Jump Performance in Elite Youth Female Soccer Players" Muscles 4, no. 3: 23. https://doi.org/10.3390/muscles4030023
APA StyleFahey, J., Comfort, P., & Ripley, N. J. (2025). Lower Limb Muscle Strength Matters: Effect of Relative Isometric Strength on Countermovement and Rebound Jump Performance in Elite Youth Female Soccer Players. Muscles, 4(3), 23. https://doi.org/10.3390/muscles4030023