1. Introduction
In Vietnam, brackish-water shrimp farming is a major coastal aquaculture sector, with Litopenaeus vannamei widely cultured because of its fast growth, high stocking-density tolerance, and adaptability to a broad range of salinity conditions. However, rapid shrimp aquaculture expansion generates large volumes of nutrient-rich wastewater. Expanding production scales increases effluent volumes and nutrient loads.
Shrimp aquaculture effluents are typically enriched with dissolved inorganic nitrogen (DIN), including ammonia (NH
3/NH
4+), nitrite (NO
2−), and nitrate (NO
3−), largely derived from uneaten feed residues and metabolic excretion of cultured organisms. In intensive and super-intensive systems, nitrogen loading can increase rapidly, frequently exceeding the assimilative capacity of receiving water bodies and thereby promoting eutrophication [
1,
2]. Among these nitrogen forms, ammonia is highly toxic to aquatic organisms even at relatively low concentrations, whereas nitrate, although less immediately toxic, tends to accumulate due to incomplete denitrification under suboptimal environmental conditions [
3].
The effectiveness of conventional wastewater treatment systems in removing nitrogen is often limited under saline and brackish conditions. Elevated salinity has been shown to inhibit the activity of nitrifying and denitrifying microbial communities, thereby reducing ammonia oxidation rates and disrupting nitrogen transformation pathways [
4,
5]. Although
S. portulacastrum has been studied for aquaculture wastewater treatment and has also been reported as an edible and medicinal halophyte, its direct integration into shrimp ponds as a floating-raft crop remains insufficiently evaluated. In particular, limited information is available on how
S. portulacastrum grows and recovers nutrients when cultivated directly in shrimp culture water across different salinity levels under the same light and temperature conditions. This gap is important because the practical value of the system depends not only on water-quality improvement, but also on identifying the salinity range that supports harvestable plant biomass for potential use as a vegetable or medicinal raw material while maintaining acceptable shrimp performance.
Current methods for shrimp pond wastewater treatment primarily rely on sedimentation tanks, oxidation ponds, or combined filtration–settling systems [
6]. However, these conventional systems often operate inefficiently under saline or brackish conditions, where elevated concentrations of chloride (Cl
−) and sodium (Na
+) ions inhibit microbial activity and reduce the effectiveness of biological nitrogen and phosphorus removal [
7]. In addition, conventional mechanical systems have high energy, maintenance, and monitoring costs. These systems are unsuitable for small-scale or household shrimp farms in the Mekong Delta [
8]. Constructed wetlands (CWs) are particularly promising for brackish environments, where halophytic plants can thrive and assist in nutrient removal. However, studies on CW performance under multi-salinity gradients in halophyte-shrimp co-cultivation systems are limited [
9]. This study therefore aimed to address this gap by assessing the nitrogen uptake capacity of
Sesuvium portulacastrum in multi-salinity constructed wetland systems compatible with
Litopenaeus vannamei shrimp culture.
Sesuvium portulacastrum L. (commonly known in Vietnam as “Sam biển”) is a perennial halophytic herb belonging to the family Aizoaceae. It is widely distributed along tropical and subtropical coastlines and is characterized by its creeping growth habit and extensive root system. The species demonstrates strong tolerance to salinity, drought, and nutrient-poor sandy substrates, reflecting its high ecological plasticity [
10]. Owing to specialized halophytic adaptations—particularly efficient osmotic regulation and salt-exclusion mechanisms—
S. portulacastrum can survive and grow across a broad salinity gradient, from freshwater conditions up to highly saline environments exceeding 40‰ [
11].
In addition to its high salinity tolerance,
S. portulacastrum demonstrates strong nutrient assimilation capacity, with effective uptake of nitrogen (N) and phosphorus (P), as well as accumulation of heavy metals such as Zn
2+, Cu
2+, and Fe
2+ in saline substrates [
11]. Recent studies have reported nitrogen removal efficiencies of 300–400 mg N m
−2 day
−1 in halophyte-based systems, which appear higher than some values reported for conventional wetland macrophytes such as
Phragmites australis (~15–30 mg N m
−2 day
−1) or mangrove species including
Rhizophora apiculata (~30–50 mg N m
−2 day
−1) [
12,
13,
14]. Moreover, S. portulacastrum has proven effective in treating effluents from Litopenaeus vannamei shrimp culture and tilapia-integrated recirculating aquaculture systems (RAS), achieving over 90% removal of total nitrogen and phosphorus while improving water quality and shrimp growth. Therefore,
S. portulacastrum can be integrated into constructed wetlands for brackish and saline aquaculture wastewater due to its salt tolerance and biofilter efficiency. This species removes excess nutrients and supports microbial and aquatic habitats [
11].
Although previous studies have investigated halophytic plants for saline wastewater treatment, including the use of S. portulacastrum in aquaculture wastewater systems, information remains limited on the performance of floating-raft S. portulacastrum systems directly integrated with intensive Litopenaeus vannamei culture under different salinity levels. In particular, few studies have simultaneously evaluated plant growth, shrimp biomass production, plant nutrient uptake, and nutrient partitioning across a controlled salinity gradient. Salinity may affect not only the growth and nutrient assimilation capacity of halophytic plants, but also the physicochemical conditions of the culture water and the growth performance of shrimp. These interacting responses may either support or constrain the overall performance of integrated shrimp–halophyte systems. The novelty of this study lies in evaluating a Vietnamese coastal ecotype of S. portulacastrum grown on floating rafts directly integrated with L. vannamei culture across a controlled salinity gradient. The study aimed to identify the salinity range that supports plant biomass production, nutrient uptake and recovery, and shrimp growth performance in an integrated shrimp–halophyte system.
This study focuses on evaluating the growth of floating-raft S. portulacastrum directly cultivated in L. vannamei shrimp culture water under different salinity levels of 5, 10, 15, 20, and 25‰, thereby assessing plant biomass production, N and P uptake through harvestable plant biomass, and shrimp growth performance in an integrated shrimp–halophyte system.
2. Materials and Methods
2.1. Experimental Materials and Setup
The halophytic plant Sesuvium portulacastrum was collected from the coastal salt-field margin of Ly Nhon, Can Gio District, Ho Chi Minh City, Vietnam. Uniform cuttings of 8 cm in length were selected and transplanted onto floating rafts (25 × 40 cm) made of foam sheets lined with wet absorbent fabric, with each raft containing 84 plants. Prior to the experiment, the plants were acclimated for 14 days in diluted seawater supplemented with Masterblend 5–12–25 and calcium nitrate (15.5–0–0) nutrient solution. The average initial plant height was 9.2 ± 1.5 cm, and the mean fresh weight was 2.0 g per plant. Whiteleg shrimp (Litopenaeus vannamei) were obtained from a certified hatchery. Healthy individuals free of visible diseases, with an average initial body weight of 1.2 ± 0.3 g, were stocked at a density of 200 individuals per cubic meter (100 shrimp per 0.5 m3 tank) to simulate intensive farming conditions. Shrimp were fed twice daily at 07:00 and 17:00 during the 28-day experiment. The commercial shrimp feed used in this experiment was analyzed for total nitrogen and total phosphorus before the mass-balance calculation. Feed N and P contents were 5.48% and 0.86%, respectively. These measured values were used to calculate total N and P input from the weekly feeding schedule. The feeding ration was adjusted weekly based on the expected increase in shrimp biomass, at approximately 5% of shrimp biomass per day. To standardize feed input among treatments, the same fixed feeding schedule was applied to all tanks: 7 g tank−1 day−1 during Week 1, 14 g tank−1 day−1 during Week 2, 25 g tank−1 day−1 during Week 3, and 43 g tank−1 day−1 during Week 4. Therefore, feed represented a continuous external nutrient input during the experiment and was included in the N and P mass-balance calculation.
Source water from the salt pans was diluted with freshwater to achieve the target salinities. Prior to use, the water was disinfected with 6 mg L−1 KMnO4 and allowed to settle for 72 h to remove suspended solids and reduce microbial load. Trace minerals were added to maintain nutrient balance, including zinc sulfate (~6.0 mg Zn2+ m−3), ferrous sulfate (~4.95 mg Fe2+ m−3), manganese sulfate (~1.95 mg Mn2+ m−3), copper sulfate (~1.5 mg Cu2+ m−3), and cobalt sulfate (~0.10 mg Co2+ m−3). The initial water parameters were adjusted to pH 7.6 ± 0.2 and dissolved oxygen (DO) above 6 mg L−1 with continuous aeration. The S. portulacastrum rafts were deployed first, and the shrimp were stocked after a 3-day plant acclimation period. Background concentrations of nitrogen species (NH4+, NO2−, NO3−) in the treated water were within acceptable ranges for aquaculture. Evaporation was compensated daily using tap water stored for at least 24 h to eliminate residual chlorine. The supplemental water used to compensate for water loss was municipal tap water. Because only a small volume was added during the experiment, its contribution to the total N and P balance was considered minor compared with the nutrient input from feed.
2.2. Experimental Design
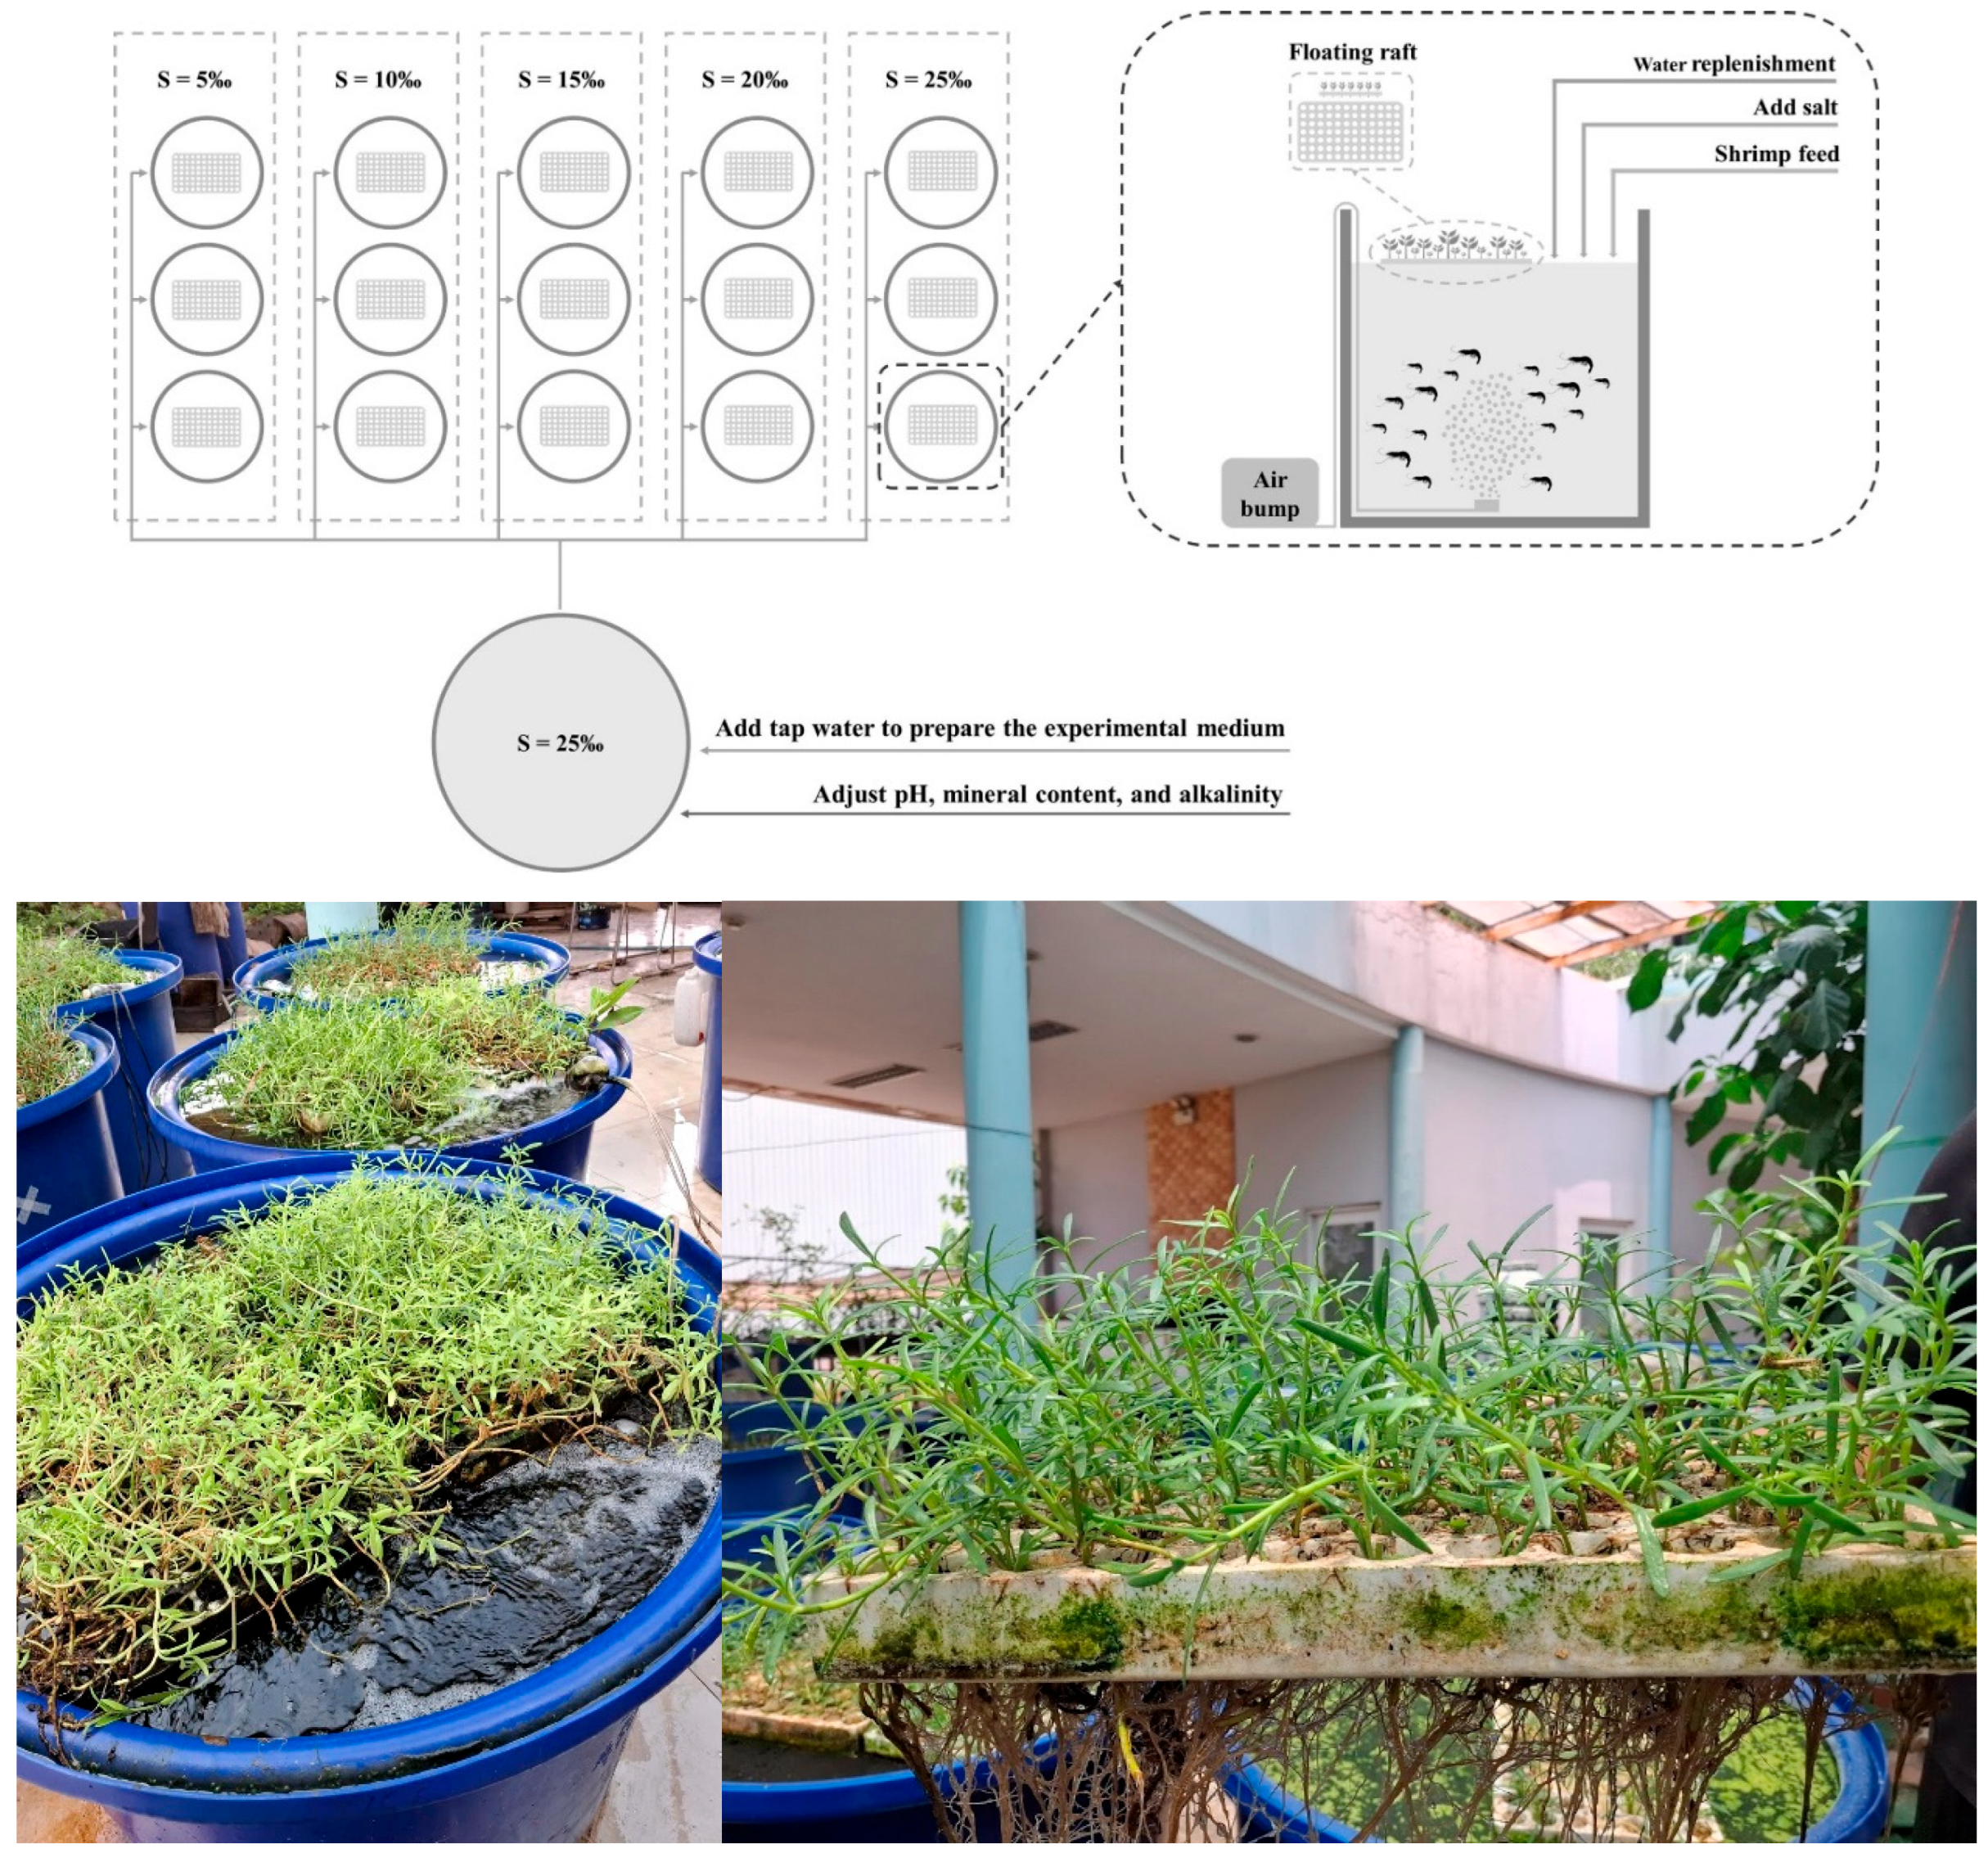
The experimental design and system configuration are illustrated in
Figure 1.
The experiment was conducted in the greenhouse of the Institute of Environment and Resources, Ho Chi Minh City, under natural light averaging over 8 h per day. The setup consisted of five constructed wetland (CW) systems at salinities of 5, 10, 15, 20, and 25‰. The experimental salinity range of 5–25‰ was selected to represent brackish-water conditions commonly used for
L. vannamei culture in coastal shrimp-farming areas of Vietnam. The salinity levels were selected to represent a practical brackish-water gradient relevant to intensive
L. vannamei culture and halophyte-based wastewater treatment. The 5‰ treatment represented low-salinity brackish conditions, 10–15‰ represented moderate salinity conditions commonly used for whiteleg shrimp culture, and 20–25‰ represented elevated salinity conditions under which salinity stress may affect plant growth, nutrient assimilation, microbial transformation, and shrimp performance. This gradient was therefore used to identify the salinity range in which the shrimp–halophyte floating-raft system could maintain both biological growth and nutrient recovery potential. The experiment was conducted for 28 days, corresponding to a four-week culture period. This duration was selected to allow measurable growth of both shrimp and
S. portulacastrum, to complete one short harvest cycle of plant biomass, and to maintain shrimp under stable high-density small-tank conditions. It was also appropriate for maintaining juvenile
L. vannamei at a relatively high stocking density (200 individuals m
−3) in small experimental tanks. Based on preliminary husbandry experience of the research team, shrimp at this developmental stage and within this time frame showed limited cannibalistic or aggressive behavior, thereby reducing potential bias in biomass and survival assessment. Longer-term trials may be required to evaluate repeated harvest cycles, system aging, plant senescence, sediment accumulation, and operational stability at pilot or commercial scale. Each treatment had three replicates (3 tanks per salinity), using a total of 15 tanks with an effective volume of 0.5 m
3 each. For each salinity, influent water was prepared in a 1.5 m
3 batch, mixed, and distributed evenly into the three replicate tanks. Each tank had two floating rafts containing 84
S. portulacastrum plants on the water surface, and
Litopenaeus vannamei shrimp were cultured in the water column below (
Figure 1). Continuous aeration was provided to each tank using a 35 W air pump (65 L·min
−1) to maintain dissolved oxygen stability. Salinity was maintained within ±0.5‰ through daily monitoring and adjustment. Evaporative losses of 1.2–1.5 L per tank per day were compensated daily by adding freshwater to maintain stable volume and salinity.
2.3. Analytical Methods
Water quality parameters, including pH, dissolved oxygen (DO), salinity, ammonium (NH4+), nitrite (NO2−), nitrate (NO3−), and total nitrogen (TN), were monitored periodically throughout the experiment. Salinity, pH, and alkalinity were measured weekly to monitor the effects of evaporation and water replenishment. Salinity was maintained within ±0.5‰ of target levels by adding freshwater. Plant growth parameters (biomass, leaf vitality, and root development) and shrimp health status were also recorded.
Chemical analyses followed standard methods. Biochemical oxygen demand (BOD
5) was determined by the dilution and seeding method (TCVN 6001-1:2008/ISO 5815-1:2003) [
15]. Chemical oxygen demand (COD) was analyzed using the dichromate method (SMEWW 5220C). Ammonium (NH
4+) was determined by the phenate method (4500–NH
3), nitrite (NO
2−) by diazotization (4500–NO
2−), and nitrate (NO
3−) by cadmium reduction (4500–NO
3−). Total nitrogen (TN) and total phosphorus (TP) were measured using a UV–Vis spectrophotometer after persulfate digestion.
Plant samples were collected at the end of the experiment. One floating raft (84 plants) was harvested from each tank, pooling 252 plants per salinity level. The harvested plant material was washed, oven-dried to constant weight, ground, and homogenized. A 1 g subsample was used for chemical analysis. All measurements were conducted in triplicate (n = 3), and results are expressed as mean ± standard deviation (SD).
2.3.1. Water/Sludge Sampling and Nutrient Analysis
For the final water-quality analysis, samples were collected from three vertical layers of each tank, including the surface, middle, and bottom layers. The bottom-layer sample included settled sludge and particulate material. These subsamples were mixed to obtain a representative water–sludge composite sample for each tank before TN and TP analysis. Therefore, the final water/sludge compartment represented dissolved nutrients as well as suspended and settled particulate fractions collected during sampling. However, sludge was not separated and quantified as an independent compartment.
2.3.2. Plant Growth, Biomass, and Tissue Nutrient Analysis
Plant growth was monitored non-destructively by measuring stem length before and during the experiment. Destructive sampling was not conducted before the end of the 28-day period because all plants were maintained for final harvest. At the end of the experiment, harvested S. portulacastrum biomass from each tank was weighed as fresh biomass and then dried at 60 °C to determine dry biomass. Fresh biomass was also estimated from plant length using the experimentally determined length–biomass relationship, and dry biomass was calculated using the experimentally determined dry matter coefficient.
For plant tissue nutrient analysis, dried plant samples were ground and homogenized as composite samples for each salinity treatment. These composite samples were analyzed for total nitrogen and total phosphorus. Plant tissue N and P concentrations were used to assess nutrient accumulation in harvestable biomass and the potential for nutrient recovery through plant biomass removal. Because plant tissue N and P were analyzed from treatment-level composite samples, these values were not treated as independent biological replicates for statistical comparison among salinity treatments.
2.3.3. Shrimp Biomass and Nutrient Estimation
Shrimp fresh biomass was measured at the beginning and at the end of the experiment. At the end of the experiment, shrimp samples were dried to determine dry biomass. Total N retained in shrimp biomass was estimated from fresh shrimp biomass using a published tissue N coefficient of 2.7% of fresh weight [
16]. Total P retained in shrimp biomass was estimated from fresh shrimp biomass using a conservative converted tissue P coefficient of 0.3% of fresh weight. This value was derived from a published P coefficient of 1.5% on a dry matter basis, assuming that dry matter accounts for approximately 20–22% of fresh shrimp biomass [
17]. Direct destructive analysis of shrimp tissue N and P was not conducted during the experiment.
2.4. Data Analysis
The nutrient removal efficiency (R, %) and biomass-specific removal efficiency (E, mg g
−1) were calculated using the following formulas:
where C0 and Ct are the initial and final concentrations (mg L
−1); V is the water volume (L); and B is the plant biomass (g) [
18].
An apparent mass-balance approach was used to describe N and P partitioning in the system. Total nutrient input included nutrients in initial shrimp biomass, initial S. portulacastrum biomass, initial culture water, and feed added during the 28-day experiment. Total nutrient output included nutrients in harvested shrimp biomass, harvested S. portulacastrum biomass, and the final water/sludge compartment.
The mass balance was calculated as follows:
where X represents either N or P. X_unaccounted represents the fraction of the nutrient that could not be accounted for by the measured mass-balance compartments and was therefore not attributed to any specific pathway [
19].
Final water samples were collected from the surface, middle, and bottom layers of each tank and mixed before analysis. Therefore, the final water/sludge compartment included dissolved nutrients and particulate fractions collected during sampling.
Data were organized using Microsoft Excel 2021. Statistical analysis of plant growth parameters was performed using XLSTAT. When independent replicate tank data were available, the tank was considered the experimental replicate unit. Data are presented as mean ± standard deviation (SD). Differences among salinity treatments were tested using one-way analysis of variance (ANOVA), followed by Tukey’s post hoc test when significant treatment effects were detected. Normality and homogeneity of variance were checked before ANOVA. Statistical significance was set at p < 0.05.
Water-quality variables, plant tissue nutrient concentrations, nutrient recovery coefficients, and nutrient mass-balance partitioning values derived from composite samples or treatment-level calculations were interpreted descriptively and were not subjected to inferential statistical testing.
Variables measured independently at the tank level are presented as mean ± standard deviation (SD), with each tank considered an independent experimental unit (n = 3 per salinity treatment). Initial water-quality values were measured from homogeneous stock solutions and are reported as single baseline values. Day 28 water-quality parameters, shrimp biomass, and plant biomass are reported as tank-level descriptive statistics to show variability among replicate tanks within each salinity treatment. Plant tissue N and P concentrations were measured from treatment-level composite samples analyzed in analytical triplicate; therefore, these analytical replicates were used to describe measurement precision and nutrient accumulation patterns but were not treated as independent biological replicates for inferential statistical comparisons. Because several key nutrient variables were derived from composite samples or mass-balance estimates rather than fully independent biological replicates, this study emphasizes descriptive comparison across salinity treatments rather than formal hypothesis testing.
3. Results and Discussion
3.1. Physico-Chemical Parameters and Biomass Production
During the 28-day experiment, pH and dissolved oxygen (DO) remained within suitable ranges for
Litopenaeus vannamei growth (pH 7.4–8.2; DO > 6 mg L
−1) across all treatments. The experimental values for all measured water quality parameters on Day 0 and Day 28 are summarized in
Table 1.
Biomass production and total feed input were also quantified to support the mass-balance analysis. The growth data for shrimp and
S. portulacastrum, along with the feed input for each treatment, are summarized in
Table 2. These measurements were used to evaluate the nutrient removal efficiency and transformation processes under different salinity conditions.
The results in
Table 1 and
Table 2 show salinity-dependent variations in water quality and biomass production. pH and dissolved oxygen remained stable across all treatments, but BOD and COD increased during the 28-day experiment. Nitrogen concentrations were characterized by low levels of NH
4+ and NO
2− alongside an accumulation of NO
3−. Shrimp and
S. portulacastrum biomass production also varied across the salinity gradient. The variations in these specific parameters are analyzed in the subsequent sections.
3.2. Variation in BOD and COD
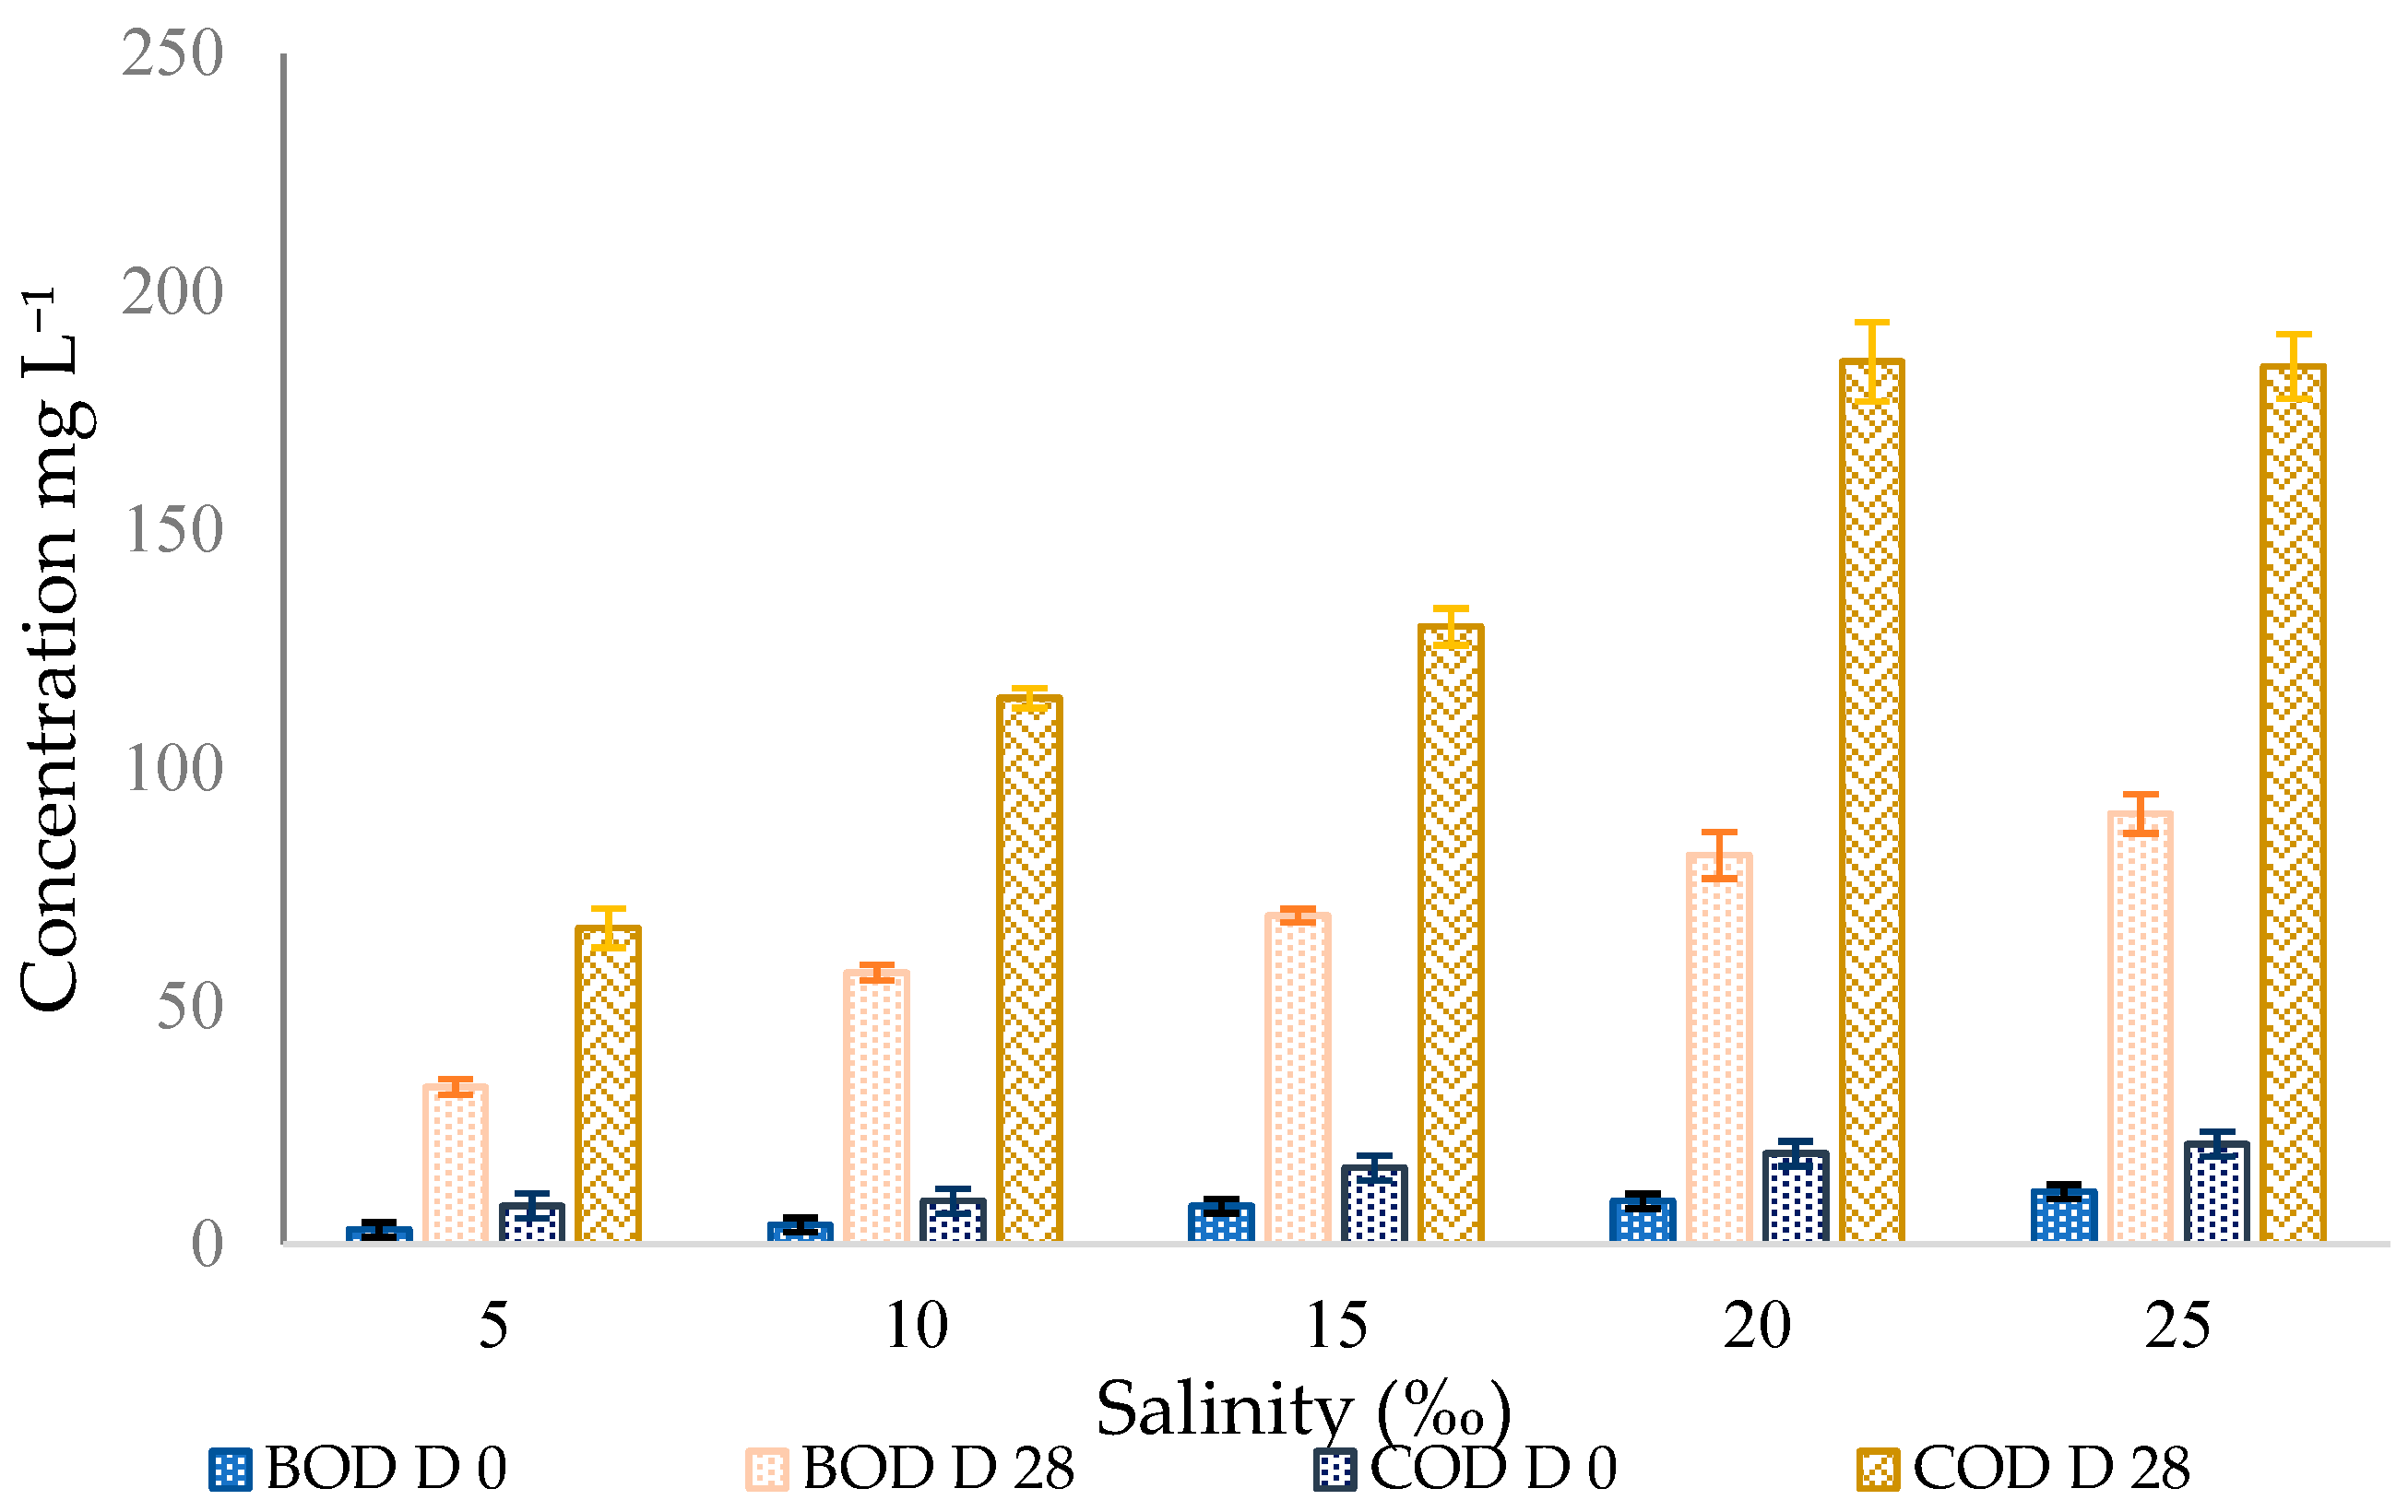
As shown in
Figure 2, both BOD and COD increased over the 28-day experimental period. BOD rose from 3–11 mg L
−1 to 33–90 mg L
−1, while COD increased from 8–21 mg L
−1 to 66–184 mg L
−1. This trend shows the accumulation of organic matter in the system, including dissolved and particulate fractions from uneaten feed and shrimp excreta.
COD represents the amount of oxidizable organic matter present in the water. In unfiltered samples, COD may include both dissolved and particulate organic fractions, including residual feed, fecal particles, detritus, and microbial biomass such as bacteria and algae. During COD analysis, unfiltered samples are subjected to strong oxidation conditions, which oxidize intact microbial cells and increase the total oxygen demand. Therefore, the increase in COD reflects both residual organic substrates and the development of microbial biomass within the system.
Across salinity treatments, BOD increased with salinity. COD rose from 5‰ to 20‰ and remained at a similar level at 25‰. These patterns indicate that elevated salinity, particularly ≥20‰, was associated with higher accumulation of oxygen-demanding organic matter.
Recent studies show that rising salinity reduces organic matter mineralization by suppressing freshwater heterotrophs and shifting microbial communities toward slower-growing halophiles [
11,
20]. This shift helps explain the higher BOD and COD observed at ≥20‰, a pattern also reported in saline aquaculture wetlands where osmotic stress inhibits key degraders, including nitrifiers and denitrifiers [
4]. Although halophyte wetlands such as
S. portulacastrum can stabilize organic loading, they cannot fully offset reduced microbial activity under elevated salinity [
21]. The elevated BOD and COD values observed at ≥20‰ are consistent with findings that rhizosphere oxygenation may only partially maintain aerobic microsites under saline stress [
22]. The results show that salinity regulates organic degradation efficiency in brackish aquaculture effluents. pH and dissolved oxygen (DO) remained stable within optimal ranges across all treatments, while ammonium and nitrite concentrations remained low, showing stable nitrification and control of toxic nitrogen forms. In contrast, BOD and COD increased with rising salinity, particularly at 20‰, which indicates reduced biodegradation efficiency. Nitrate accumulation occurred at higher salinities, showing partial inhibition of nitrogen transformation pathways. Additionally, nutrient removal efficiency and biological performance (plant growth and shrimp biomass) peaked at 10‰ salinity and declined at higher salinity levels. These patterns confirm that salinity determines overall system performance. BOD and COD increased during the 28-day culture period, indicating organic matter accumulation in the water/sludge compartment. This increase was expected in a shrimp-culture system with daily feed input and may reflect uneaten feed, shrimp feces, microbial biomass, algal growth, suspended particles, and settled organic sludge. Therefore, the present system should be interpreted mainly in terms of plant nutrient uptake and biomass recovery, rather than as a complete water-quality treatment system for all parameters.
3.3. Transformation of Nitrogen Species
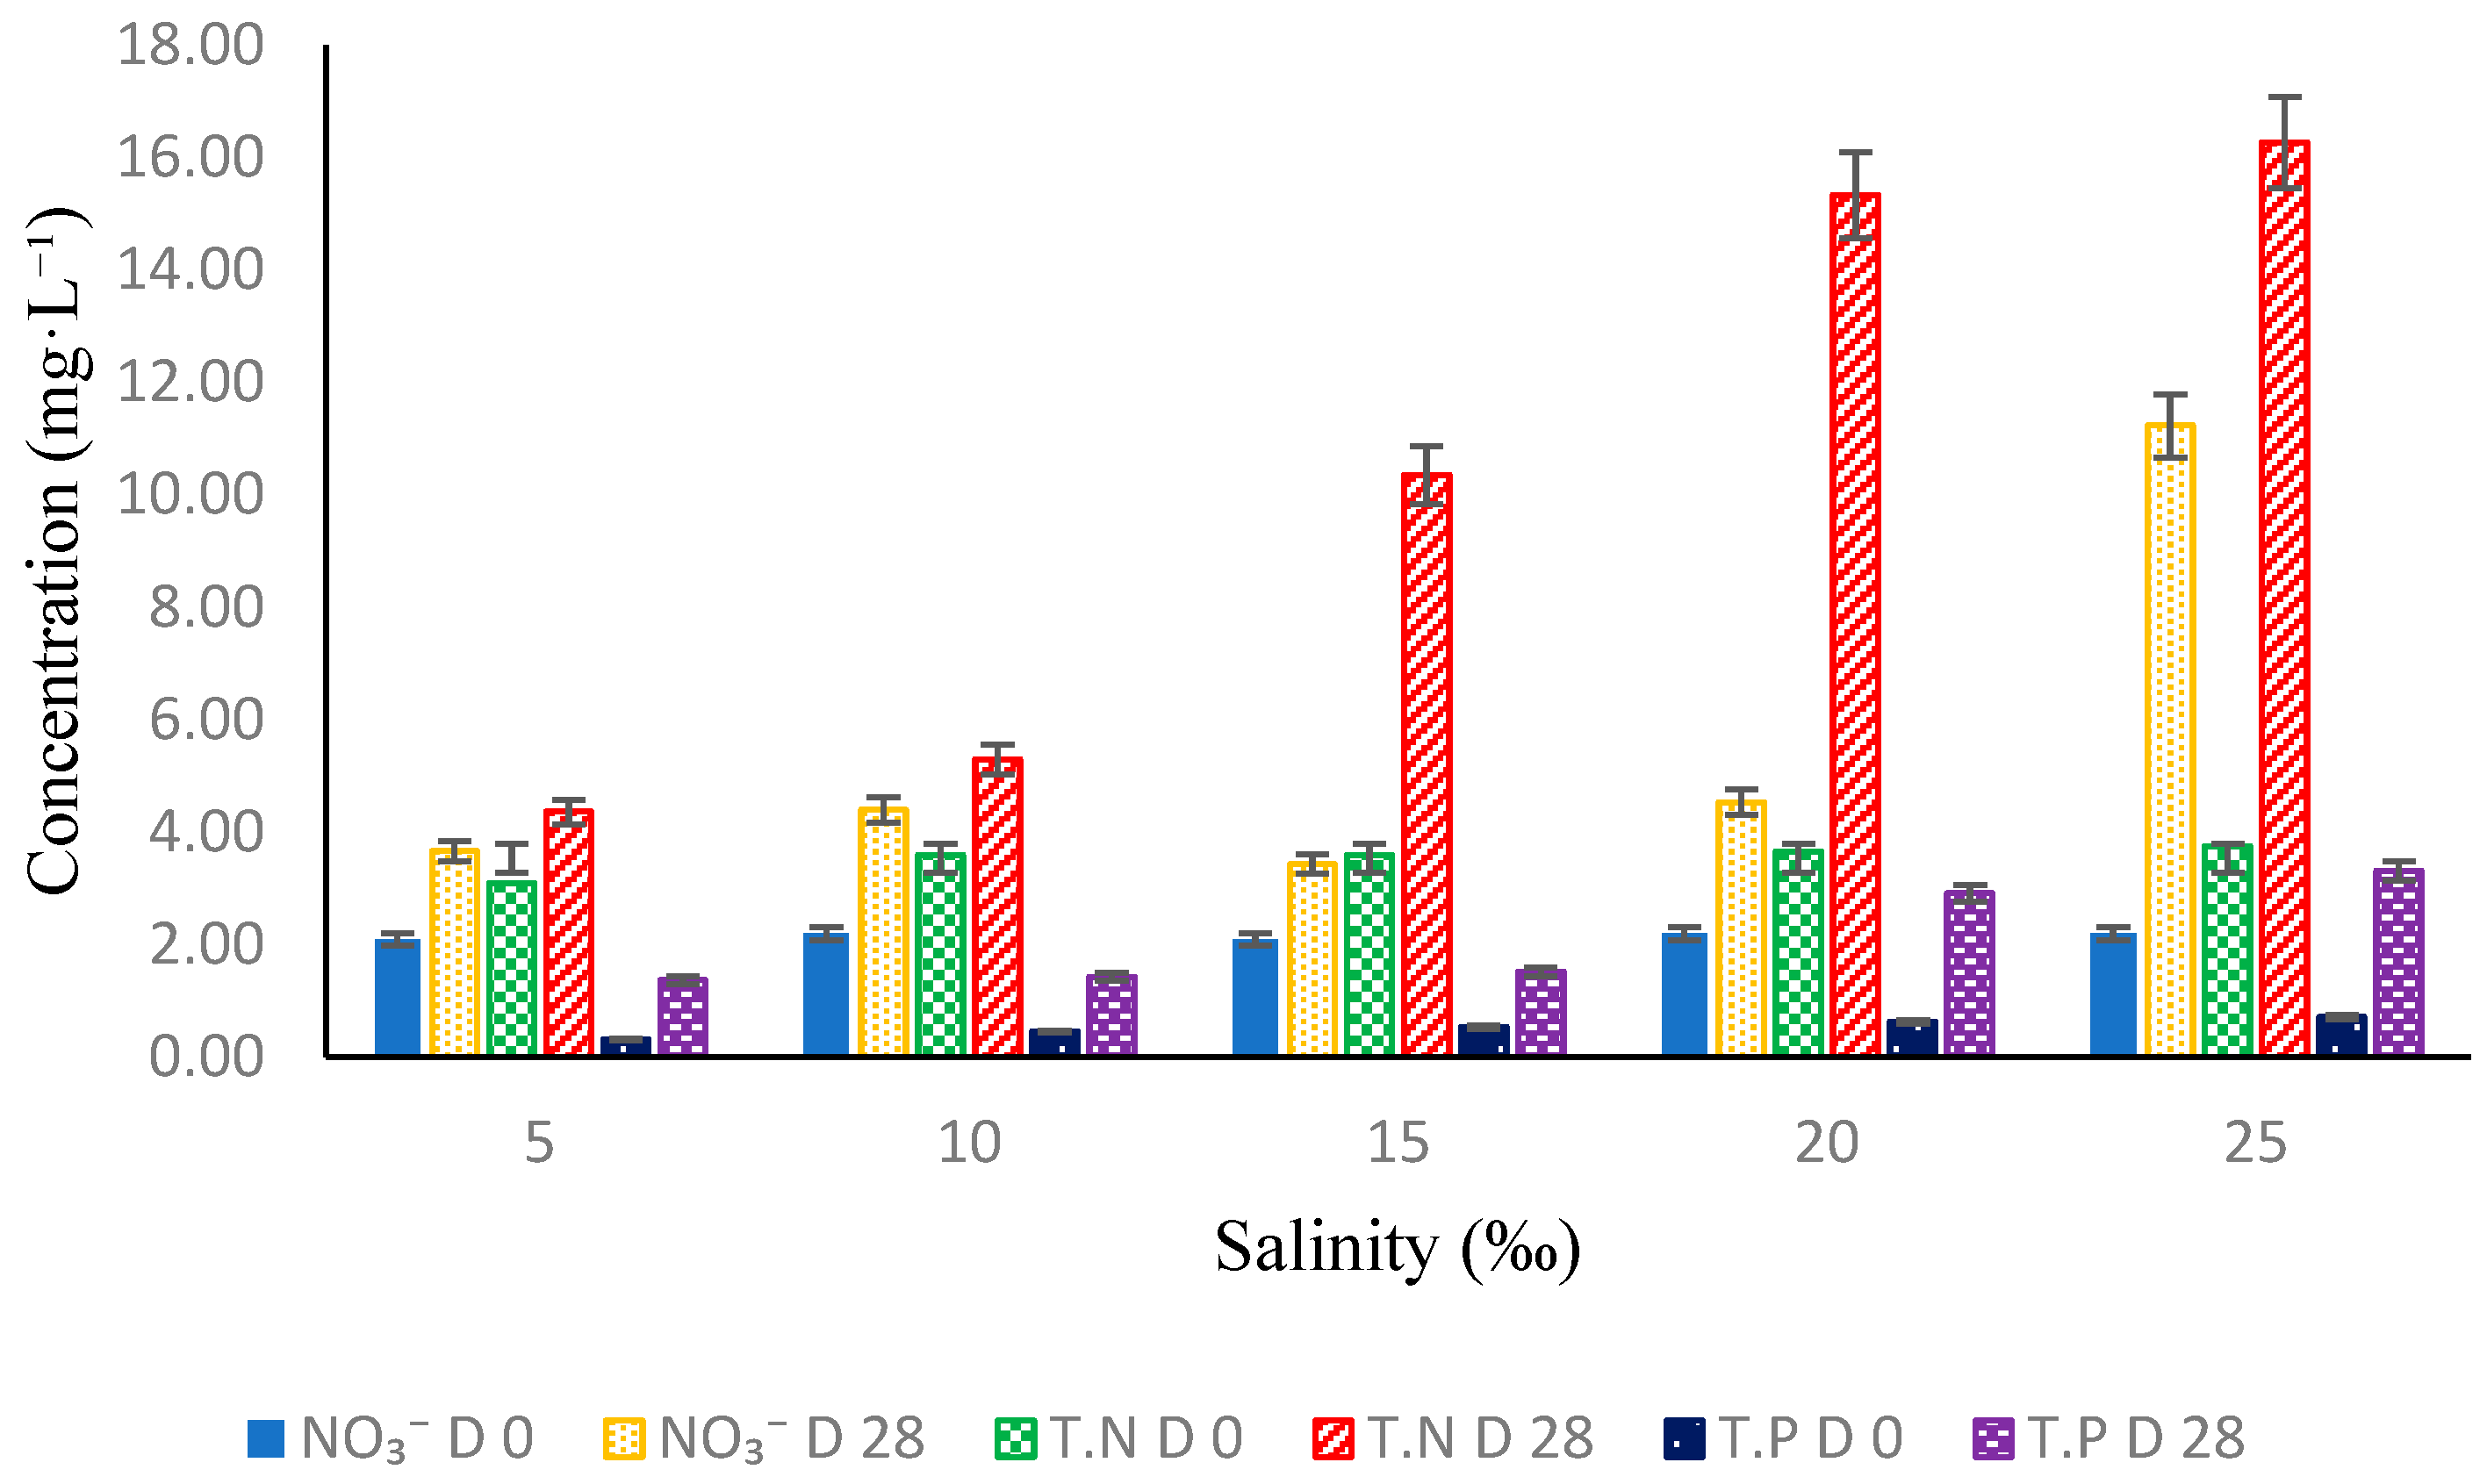
As shown in
Figure 3, NH
4+ and NO
2− remained below the detection limit (<0.03 mg L
−1) in all treatments. This result indicates that these two toxic inorganic nitrogen forms remained below detectable levels throughout the experiment, preventing precise quantification. Therefore, this result should be interpreted as non-detectable accumulation rather than complete absence of NH
4+ or NO
2−. In contrast, NO
3− concentrations increased from 2.1–2.2 mg L
−1 to 3.4–11.2 mg L
−1 by the end of the experiment.
The highest value occurred at 25‰, showing accumulation of oxidized nitrogen under elevated salinity. Because microbial communities were not analyzed, this profile should be interpreted as an indirect pattern, and the underlying biological pathways could not be confirmed [
3].
Based on the mass-balance framework, nitrogen was partitioned among shrimp biomass, plant biomass, residual water, and an unaccounted fraction. Gaseous emissions and sediment-associated nitrogen were not measured, so the residual fraction serves as an operational estimate.
The nitrogen profiles suggest that nitrogen transformation occurred under moderate salinities, whereas reduced transformation efficiency at 20–25‰ may have contributed to NO
3− accumulation [
3,
4,
5,
6,
7,
8,
9,
10,
11,
12,
13,
14,
15,
16,
17,
18,
19,
20,
21,
22,
23,
24]. Previous studies have shown that halotolerant nitrifying communities can remain functional under saline and ionic stress; however, the specific microbial groups involved in nitrogen transformation were not identified in the present study [
3,
23]. Plant tissue data support the role of
S. portulacastrum as a nitrogen sink through root uptake and biomass accumulation. The remaining nitrogen fraction is associated with unmeasured pathways, including denitrification and sediment retention [
22]. These results show that plant-associated processes contribute to nitrogen stabilization in brackish aquaculture effluents.
3.4. Growth Performance of S. portulacastrum
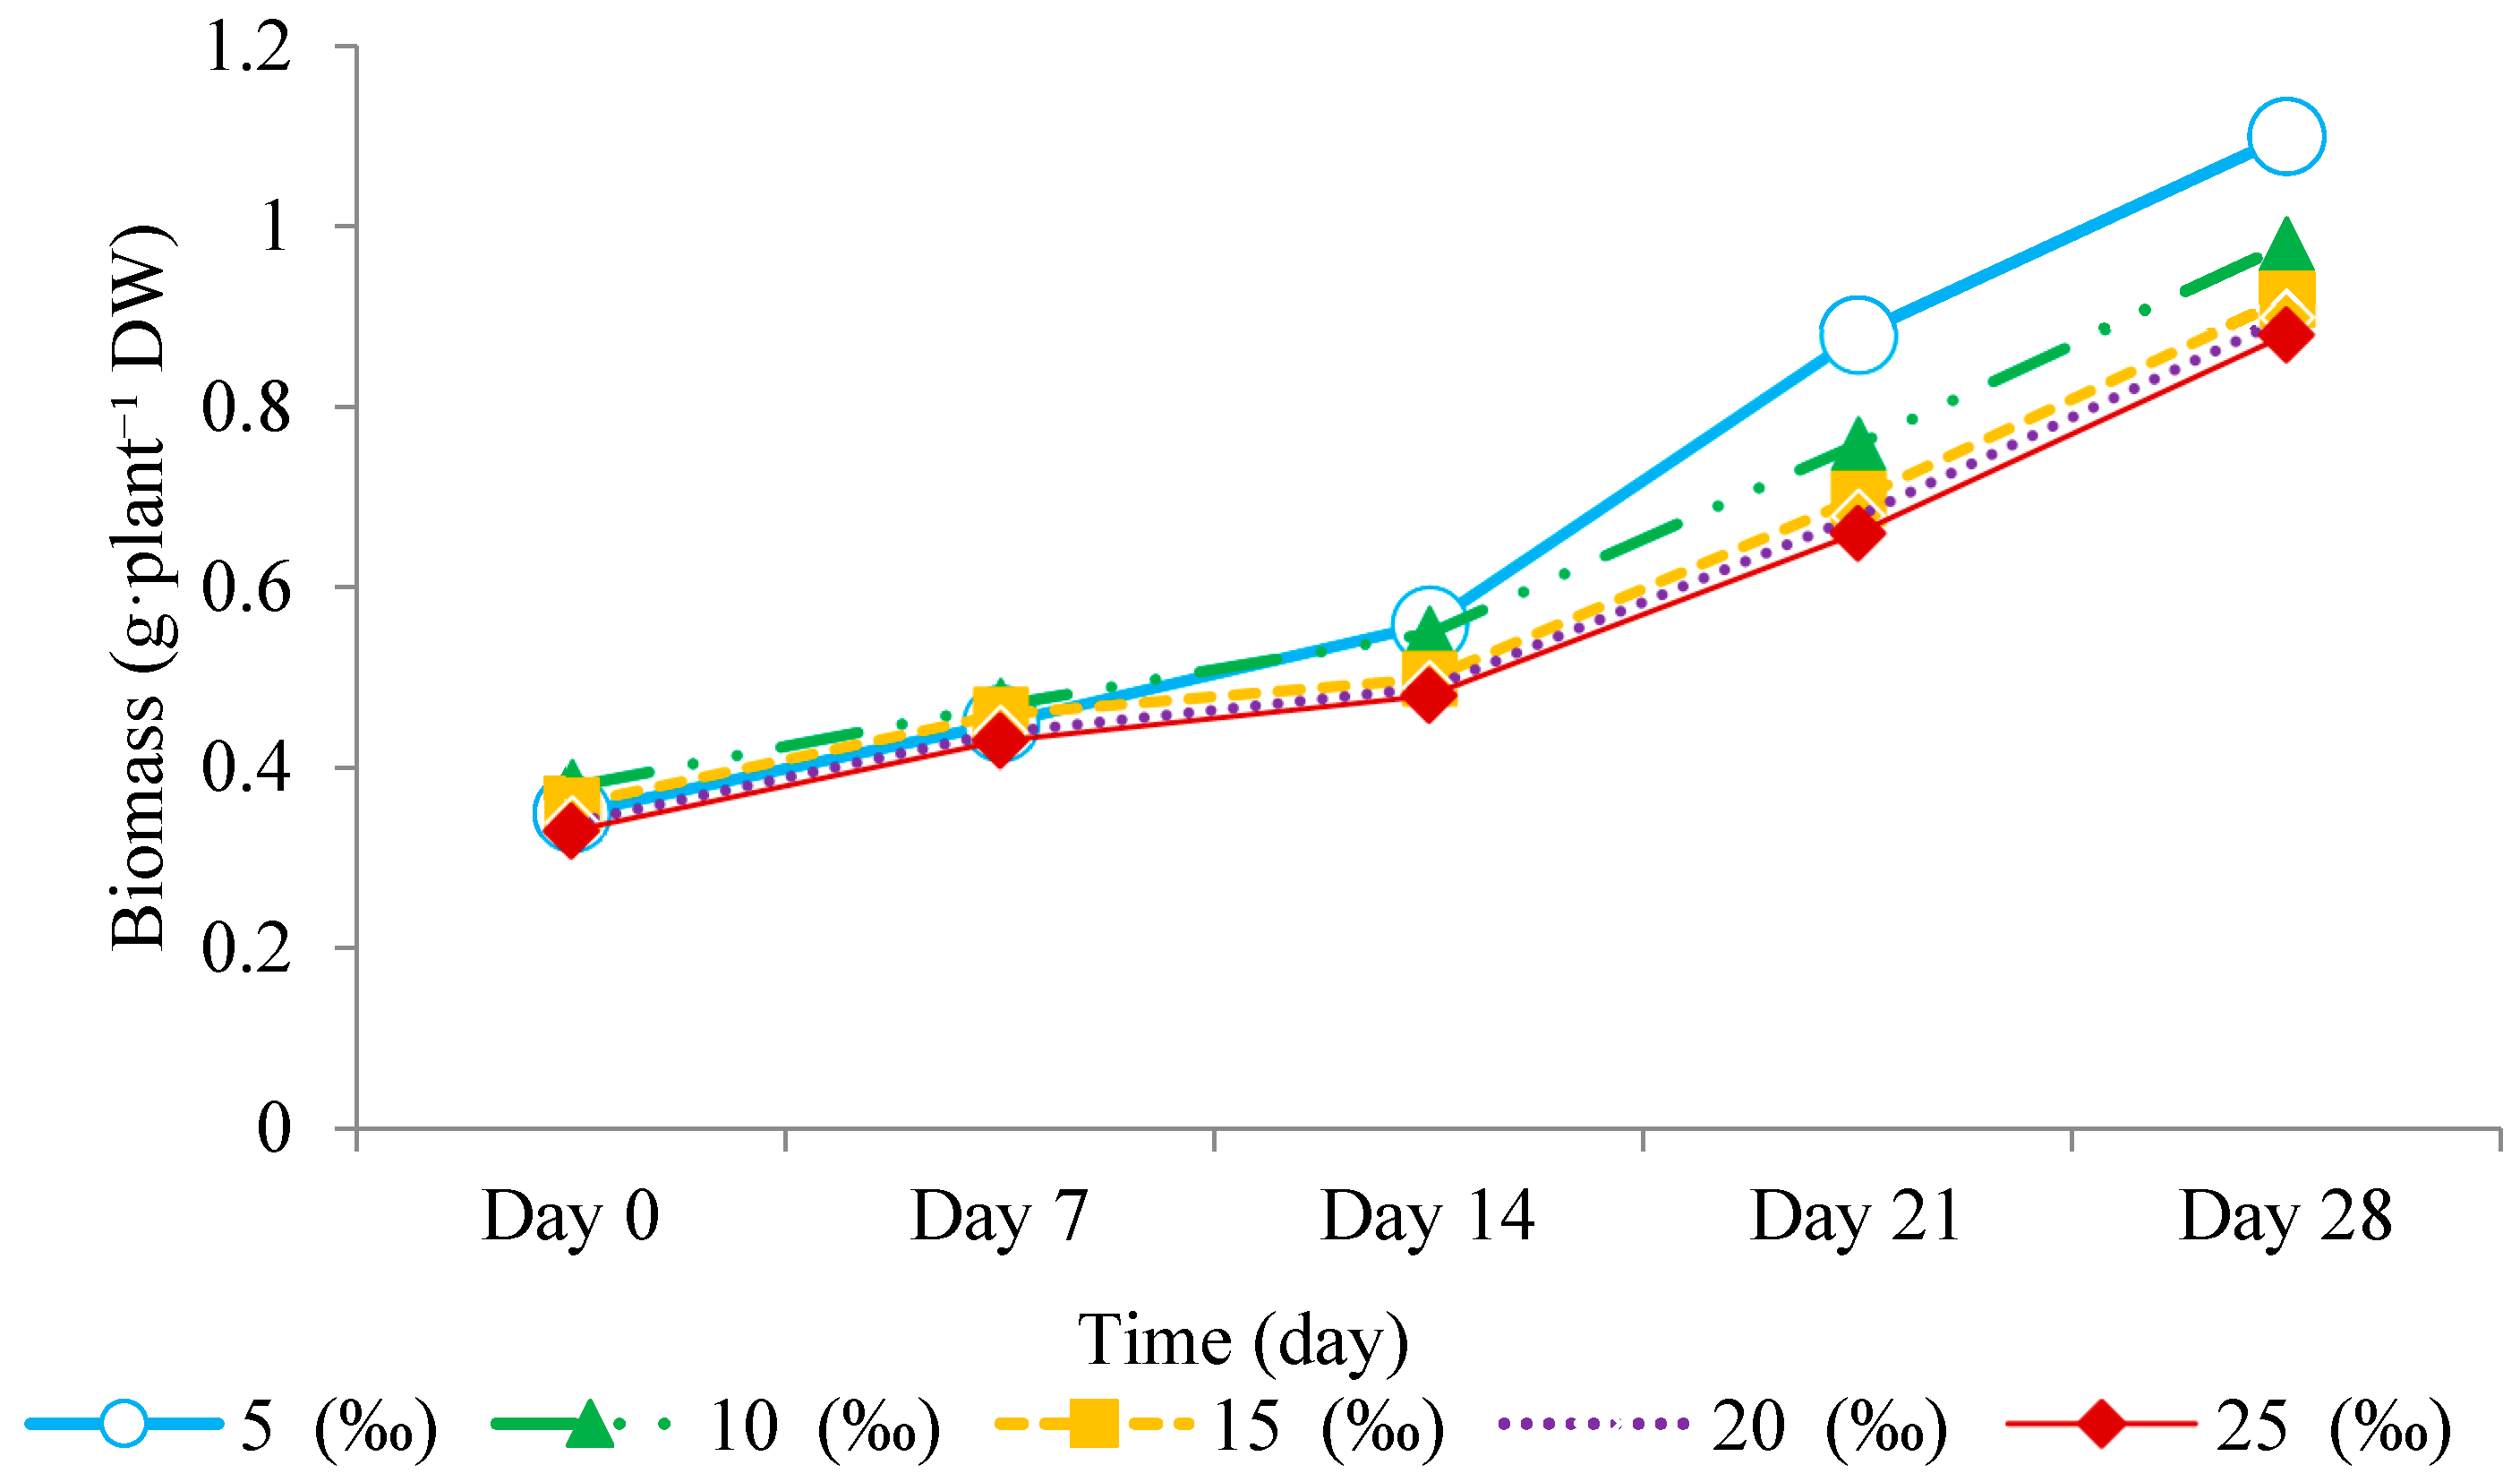
As shown in
Figure 4, the growth response of
S. portulacastrum varied across salinity treatments. After 28 days, mean dry biomass increased in all groups, rising from 0.33–0.47 g to 0.88–1.10 g per plant, which is a 2.0–3.3-fold increase. The highest biomass gain was at 5‰ (233%), followed by 10‰ (170%), while at 25‰ the increase was 96%. This indicates a reduction in growth rate as salinity increased. The relative growth rate (RGR) values for 5, 10, 15, 20, and 25‰ were 0.0416, 0.0327, 0.0283, 0.0304, and 0.0252 g g
−1 day
−1, respectively. These data show that low-to-moderate salinity (5–10‰) was optimal for plant growth, while higher salinity (>20‰) induced osmotic stress, reducing dry matter accumulation. Possible physiological explanations for growth at 5–10‰ include stable intracellular Na
+/K
+ ratios, enzyme activity, and photosynthetic performance [
25]. The development of thicker roots with fine root hairs under low salinity improved nutrient uptake efficiency, especially for nitrogen [
26,
27]. Additionally, the high fresh-to-dry leaf mass ratio observed shows an increased leaf area index (LAI) and photosynthetic capacity, which is consistent with previous studies [
28]. At higher salinities (20–25‰), biomass accumulation slowed due to reduced total protein synthesis and suppressed Rubisco activity, leading to decreased carbon assimilation [
29].
S. portulacastrum maintained positive biomass gains, which confirms its salt tolerance and adaptive mechanisms as a halophyte species [
30].
One-way ANOVA showed significant differences among salinity treatments (p < 0.05). Growth was higher at 5–10‰ than at 20–25‰, with the highest response observed at 10‰.
The RGR values ranged from 0.03 to 0.04 g g−1 day−1. These results provide initial growth data for S. portulacastrum under brackish wastewater conditions in this study.
The reduction in dry biomass at higher salinities (>20‰) aligns with the growth-survival trade-off hypothesis in halophyte physiology. Although
S. portulacastrum survives in high-salt environments, biomass accumulation increases at low-to-moderate salinities (5–10‰) rather than in fresh water or hypersaline conditions. This growth response is consistent with previous findings [
10,
11,
12,
13,
14,
15,
16,
17,
18,
19,
20,
21,
22,
23,
24,
25,
26,
27,
28,
29,
30,
31], where optimal halophytic growth occurs at salinities where the metabolic cost of osmoregulation is balanced by ion availability for turgor maintenance.
Specifically, the suppression of dry mass at 25‰ is due to the diversion of photosynthetic energy toward defense mechanisms. At high salinity, plants allocate carbon resources to synthesize compatible solutes, such as proline and glycine betaine, and maintain ion homeostasis through Na
+ exclusion. This limits the synthesis of structural cell wall components like cellulose and lignin, reducing dry matter yield [
32,
33]. The decline in RGR indicates that osmotic stress induced partial stomatal closure, which restricted CO
2 uptake and limited carboxylation efficiency by Rubisco. This trend occurs in
Sesuvium species under ionic stress [
30]. Conversely, the growth at 5–10‰ indicates that moderate Na
+ levels act as a nutrient that stimulates cell expansion and facilitates nitrate uptake. This matches the high nitrogen removal efficiency observed in this study. The development of root systems with fine hairs at these levels supports this, as efficient nutrient acquisition increases shoot biomass. The RGR values in this study (0.03–0.04 g g
−1 day
−1) are comparable to growth rates reported for other brackish-water halophytes [
34].
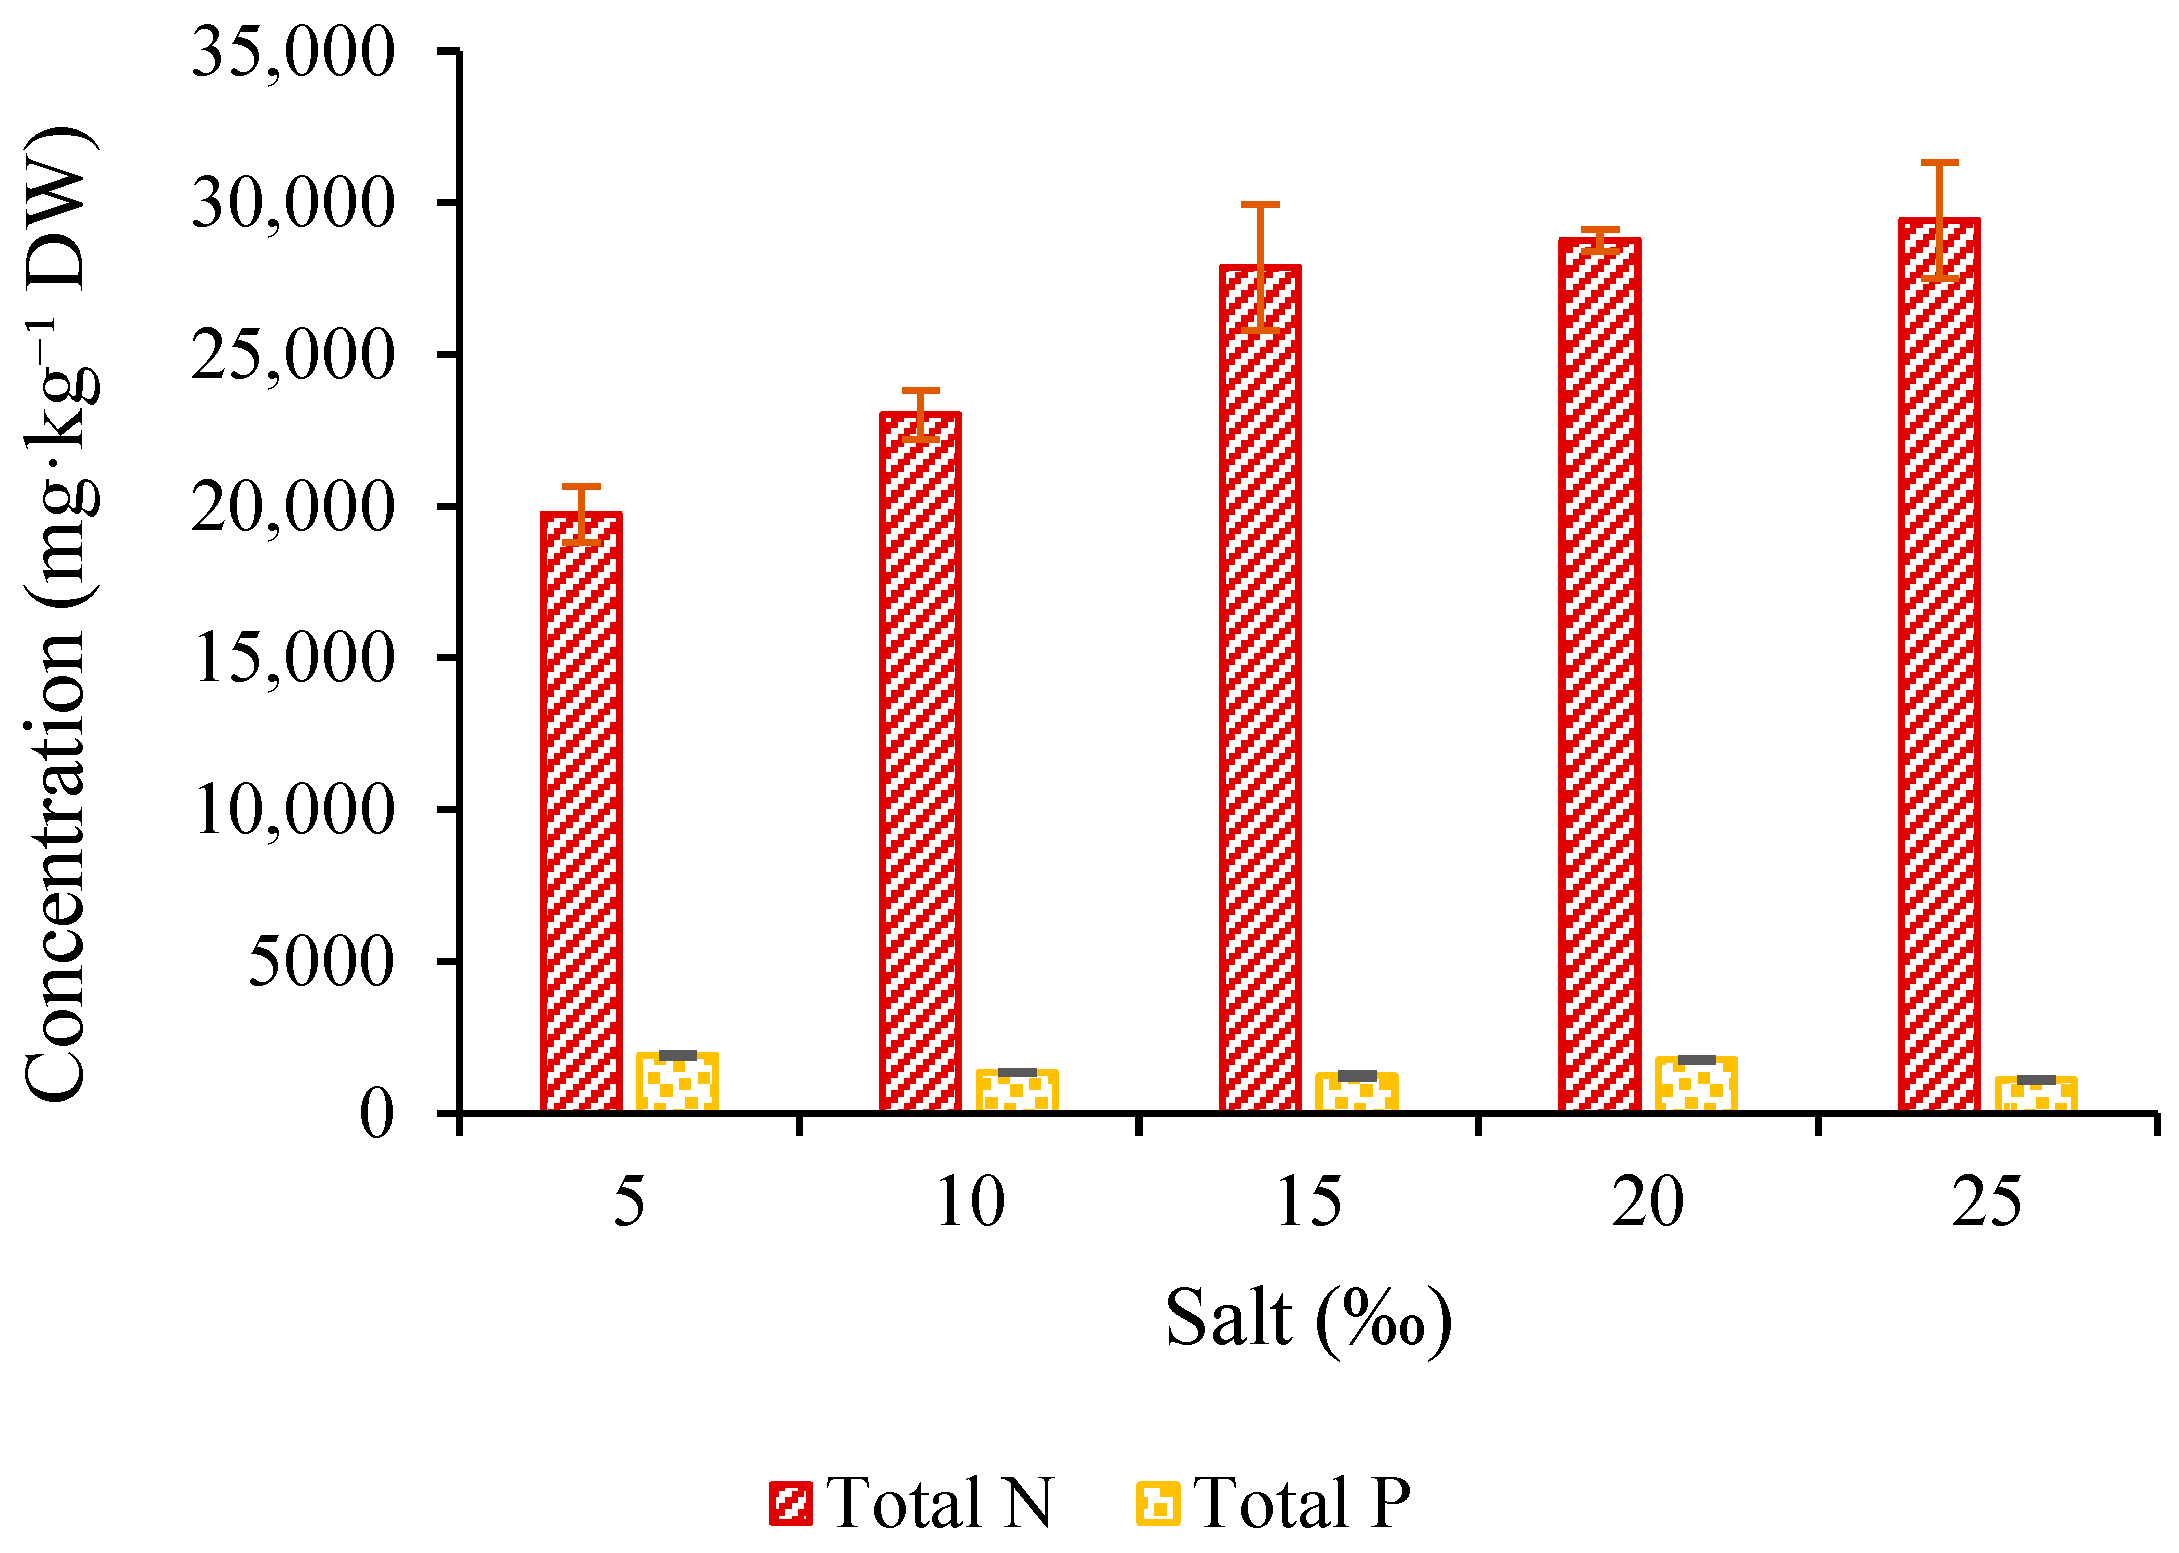
As shown in
Figure 5, the total nitrogen (N) content in dried tissues ranged from 19,735 to 29,433 mg kg
−1, increasing from 5 to 25‰ salinity. This trend suggests the capacity of the species to maintain nitrogen accumulation under higher salinity. The higher N concentrations at high salinities (20–25‰) may be related to the accumulation of nitrogenous compatible solutes, such as proline and amino acids, for osmotic adjustment [
11,
35]. In contrast, total phosphorus (P) content ranged between 1099 and 1912 mg kg
−1, decreasing as salinity increased. A local increase in P content occurred at 20‰ before declining at 25‰. This variation may indicate an interaction between salinity and ionic transport, possibly involving salinity effects on phosphate uptake or triggering internal redistribution [
11].
The N:P ratio ranged from 10.3 to 26.8 among treatments, indicating changes in the relative accumulation of nitrogen and phosphorus under different salinities. The physiological basis of this variation was not directly examined in this study.
3.5. Growth Performance of Litopenaeus vannamei
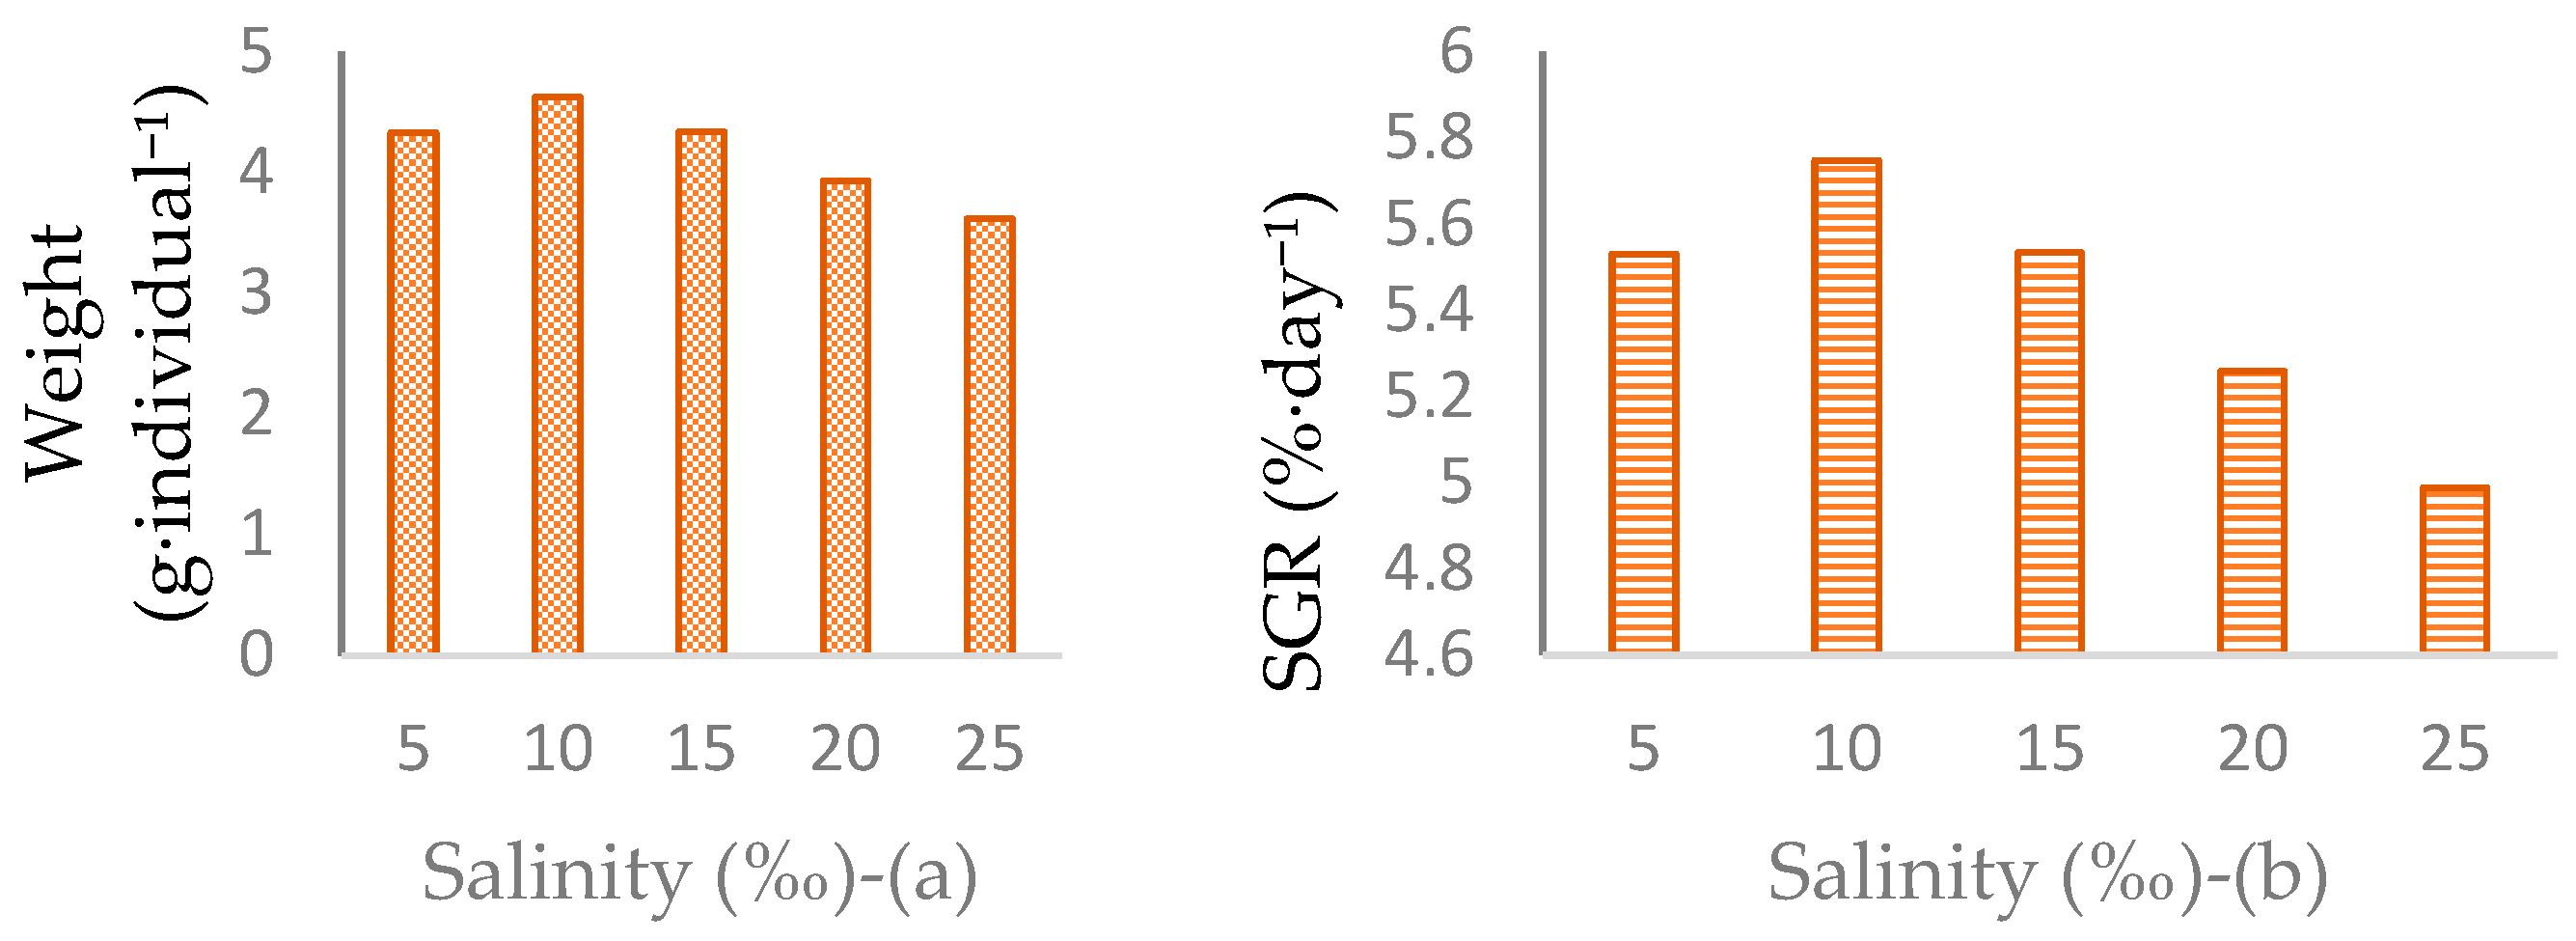
As shown in
Figure 6, after 28 days of culture, the mean body weight (MBW) of shrimp ranged from 3.61 to 4.62 g per individual, with growth decreasing as salinity increased. The highest MBW was at 10‰ (4.62 g/shrimp), which is 28% higher than the 25‰ group (3.61 g/shrimp). Total biomass followed the same pattern, reaching 434.47 g per tank at 10‰ and decreasing to 320.37 g at 25‰. This shows a negative relationship between salinity and shrimp growth. Shrimp survival remained high across the salinity treatments. Survival rates at 5, 10, 15, 20, and 25‰ were 93.0 ± 1.0%, 94.0 ± 1.0%, 95.0 ± 1.0%, 91.3 ± 0.6%, and 87.3 ± 3.8%, respectively. Final shrimp biomass was highest at 10‰, indicating that this salinity supported both shrimp survival and biomass production under the present experimental conditions.
The final mean body weight varied among treatments (F = 43.89, p < 0.001). Tukey’s post hoc test showed that the 10‰ group was higher than all other treatments, while the 5–15‰ groups were higher than those at ≥20‰. These results show that moderate salinity (~10‰) provides optimal conditions for L. vannamei growth due to reduced osmotic stress and lower energetic costs for ionic regulation. At higher salinities, the metabolic demand for maintaining ionic homeostasis diverts energy away from growth processes, reducing biomass accumulation.
Shrimp growth performance varied among salinity treatments. In the present study, SGR was highest at 10–15‰ and decreased at salinities ≥ 20‰, while final body weight was highest at 10‰. Because shrimp growth is influenced by multiple environmental and physiological factors, including salinity, water quality, feeding conditions, and stress responses, this result should be interpreted as a treatment-specific pattern rather than as the effect of salinity alone. These findings match previous reports identifying the 10–15‰ salinity range as optimal for
Litopenaeus vannamei culture [
36]. These results also align with studies on integrated multi-trophic aquaculture, where halophyte integration improves system performance across salinities of 10–20‰ [
36,
37]. The compatibility of
S. portulacastrum within this salinity range confirms the potential of this integrated system for shrimp production and wastewater treatment.
3.6. Nitrogen and Phosphorus Removal Efficiency of the Integrated System
3.6.1. Phosphorus Mass-Balance Partitioning
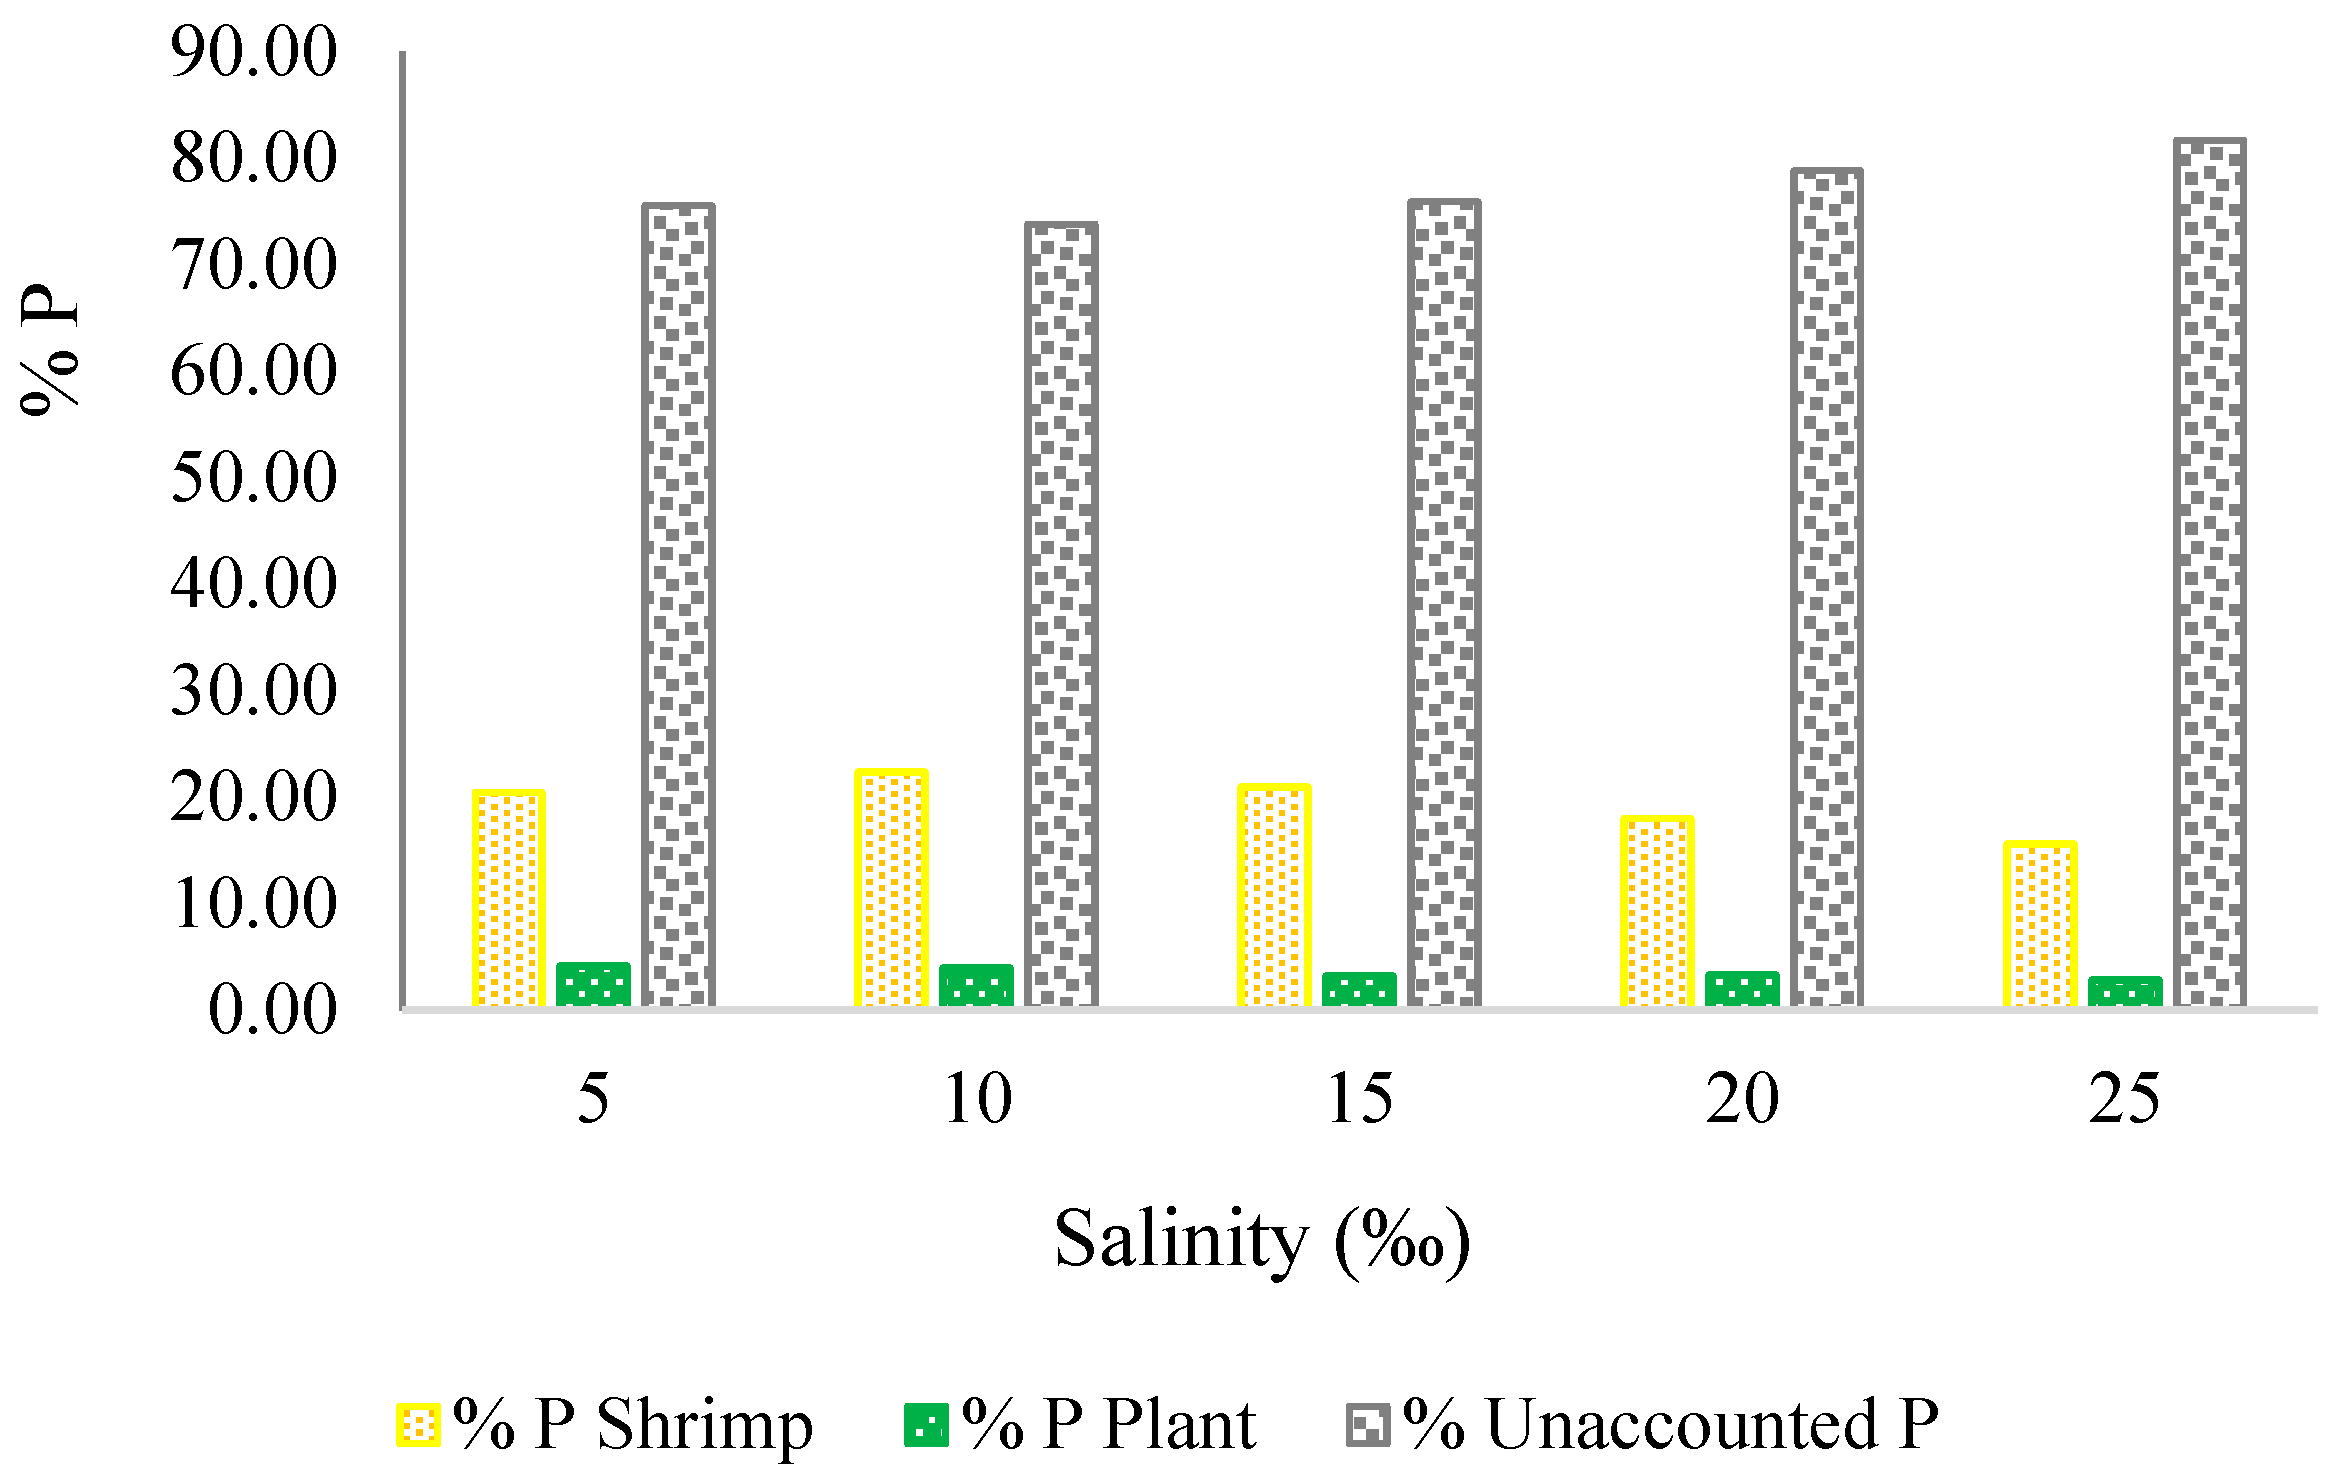
As shown in
Figure 7, phosphorus in the integrated shrimp–plant system was partitioned into three components: uptake by shrimp, uptake by
S. portulacastrum, and the unaccounted residual fraction. Across all salinity levels, shrimp accounted for 15–22% of phosphorus assimilation, while the halophyte assimilated 3–5%.
The largest proportion of phosphorus, ranging from 72% to 80%, was the residual fraction, which may be attributed to mineral precipitation and sedimentation under saline conditions. This pattern across salinities shows that abiotic pathways are the primary driver of phosphorus removal in the system, while biological uptake plays a minor role.
These results show that shrimp performance contributes to phosphorus retention, whereas S. portulacastrum provides a smaller uptake pathway. The high residual fraction shows the influence of physicochemical mechanisms on phosphorus dynamics in brackish aquaculture environments.
3.6.2. Nitrogen Mass-Balance Partitioning
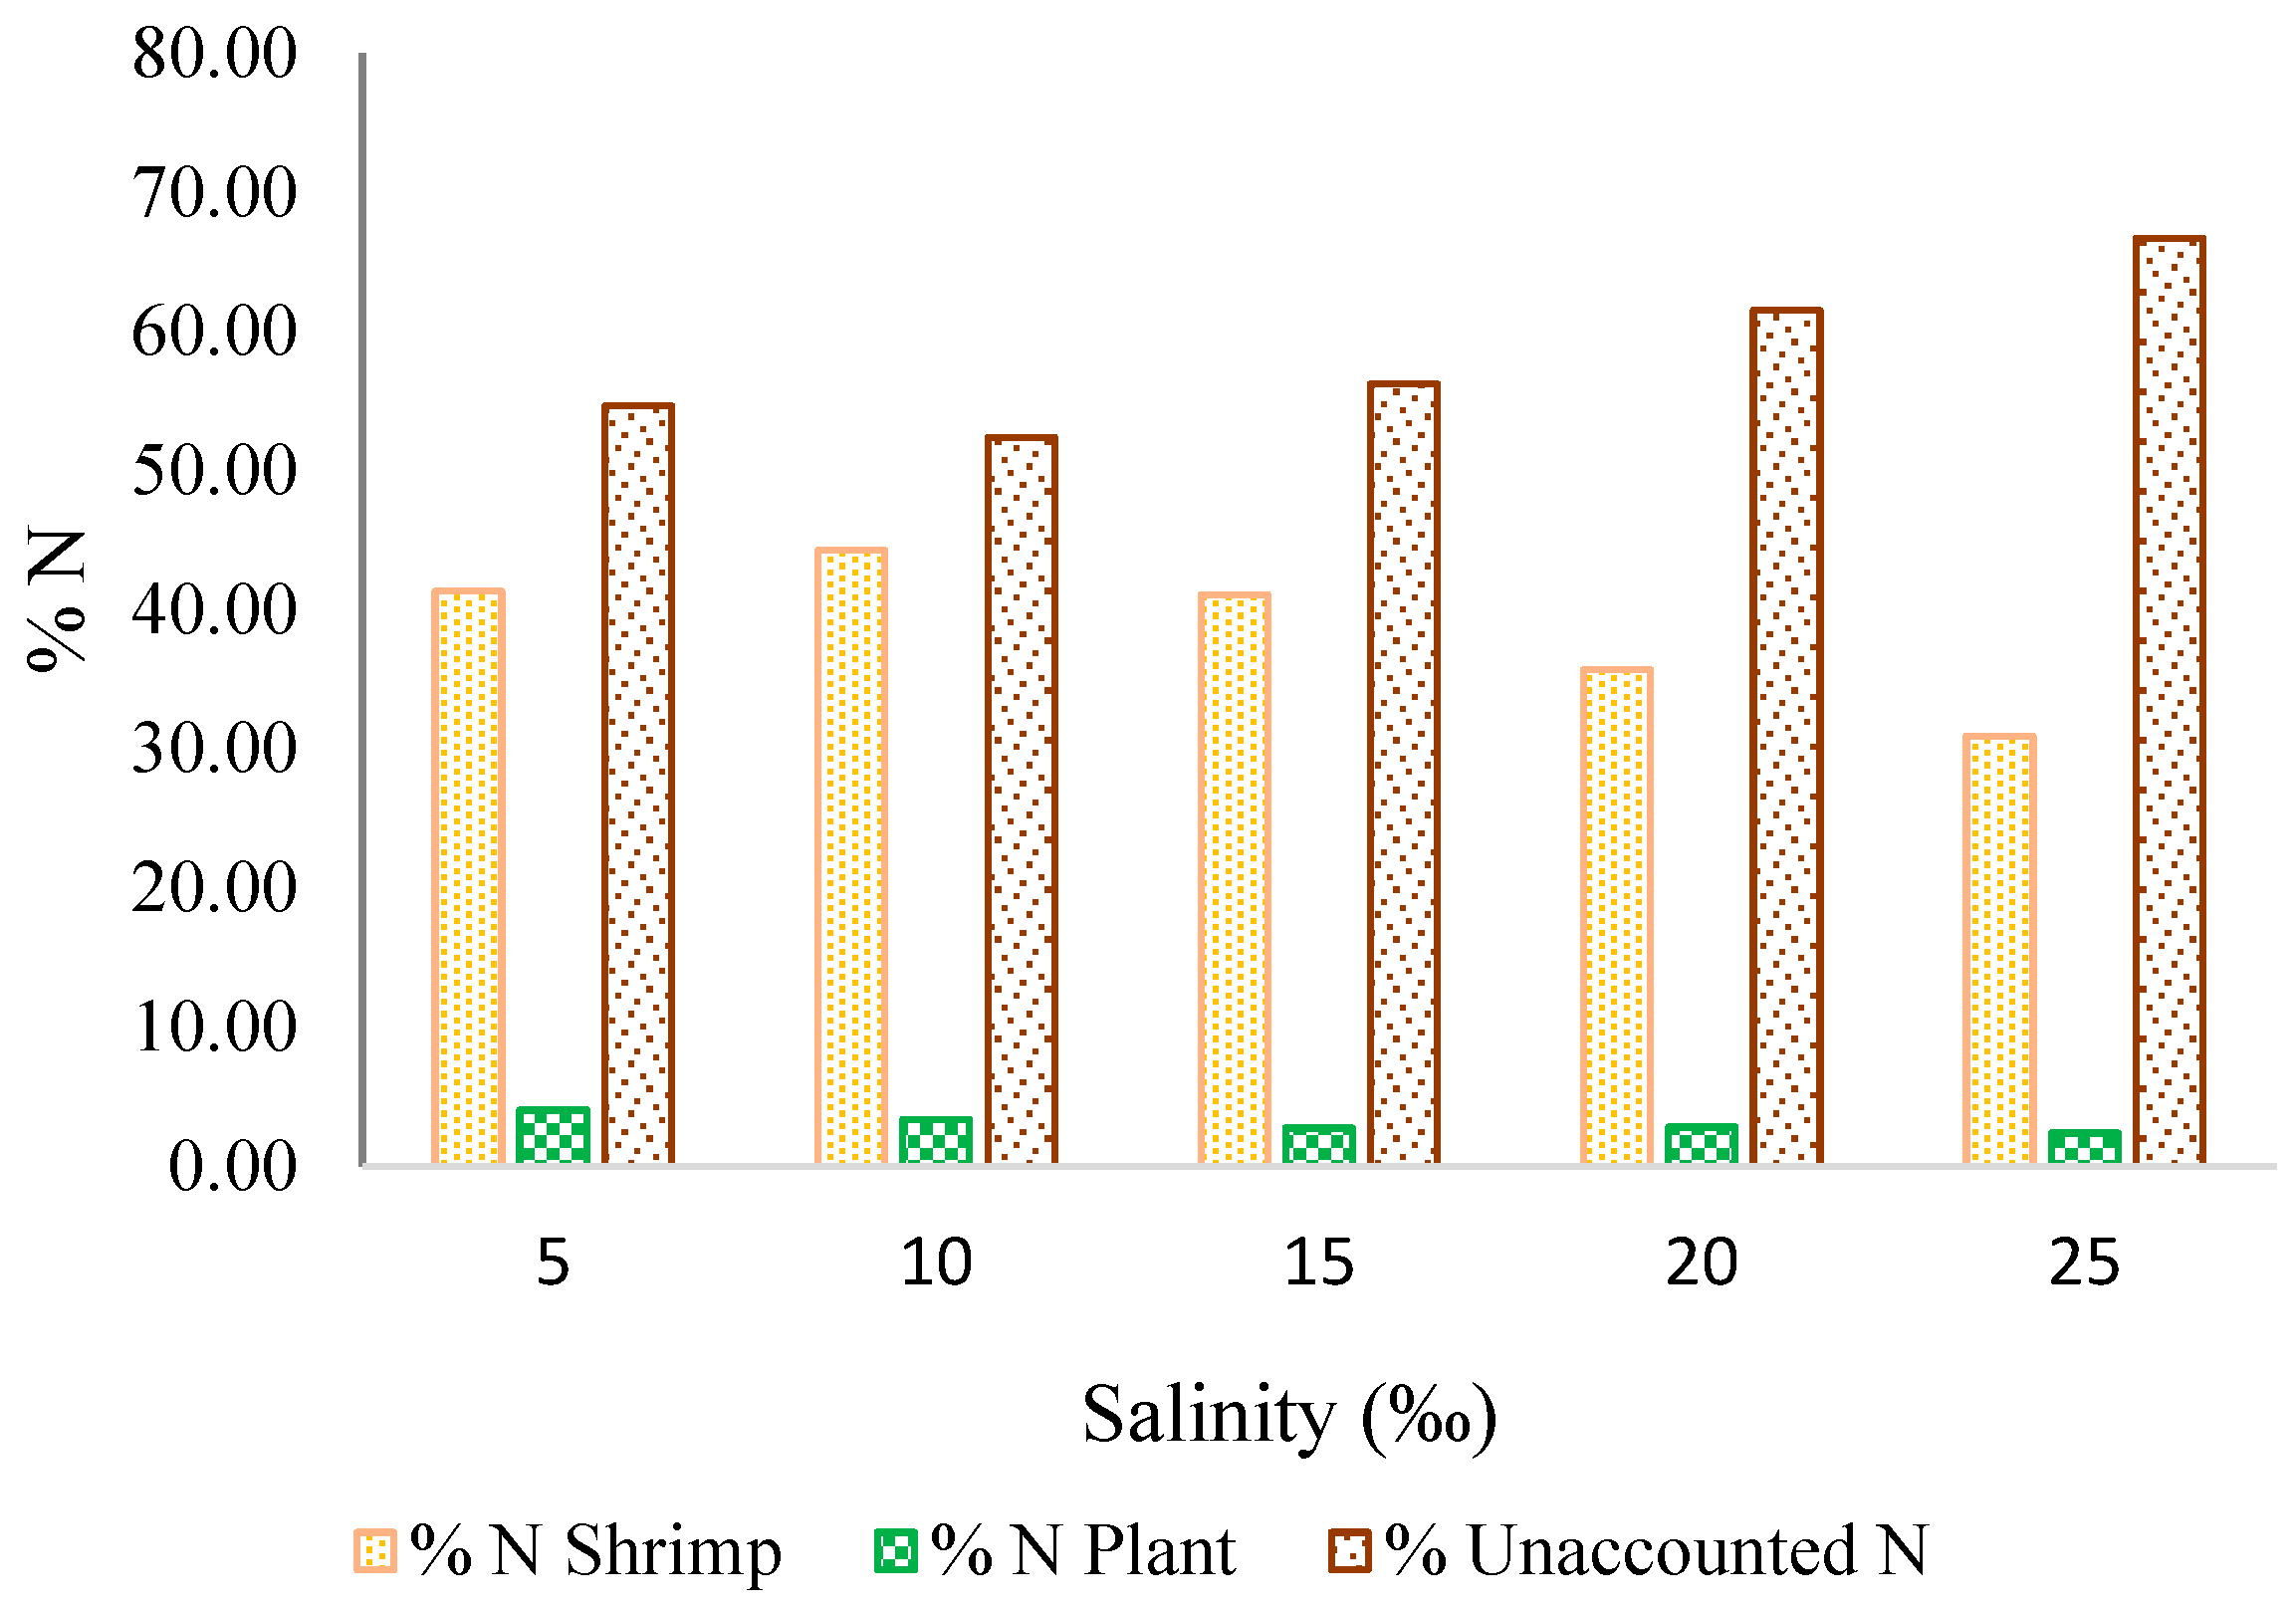
Figure 8 shows the proportions of N retained in shrimp biomass, recovered in harvested
S. portulacastrum biomass, and classified as N unaccounted based on the mass-balance calculation. Shrimp acted as the main nitrogen sink, accounting for 30.84–43.61% of total nitrogen output across salinity levels.
S. portulacastrum assimilated 2.40–4.04% of the total nitrogen, acting as a complementary sink for dissolved inorganic nitrogen in the water column. The unaccounted residual nitrogen fraction ranged from 52.35% to 65.12%, increasing with salinity and peaking at 25‰. This trend relates to microbial denitrification, volatilization, or sediment accumulation under salinity stress.
The system achieved its highest removal efficiency at 10‰ (46.98%), which decreased to 33.24% at 25‰. This indicates that moderate salinity facilitates biological assimilation and microbial transformation. The areal nitrogen removal rate for
S. portulacastrum in this study was 383 mg N m
−2 day
−1, which is higher than values reported for conventional wetland species (20–50 mg N m
−2 day
−1) [
12]. This variation relates to the different experimental conditions between studies.
3.6.3. Total Nitrogen (TN) and Phosphorus (TP) Removal Performance
Actual nutrient recovery was defined as the amount of N and P contained in harvested S. portulacastrum biomass. This value represents the controlled nutrient export from the system through plant harvesting.
In this study, harvested S. portulacastrum biomass contained 19,735–29,433 mg N kg−1 DW and 1099–1912 mg P kg−1 DW. Based on the mass-balance calculation, shrimp biomass was the main N sink, accounting for 30.84–43.61% of total N input. Harvested S. portulacastrum biomass accounted for 2.40–4.04% of total N input. The remaining N was classified as N unaccounted based on the mass-balance calculation and was not assigned to a specific pathway.
The integrated system showed apparent removal/recovery efficiencies of 45.6% for TN and 38.2% for TP. The areal N recovery rate of S. portulacastrum reached 383 mg N m−2 day−1, equivalent to approximately 1398 kg N ha−1 yr−1. These results indicate that floating-raft S. portulacastrum can support nutrient recovery through harvestable biomass in saline shrimp-culture systems.
3.7. Practical Feasibility, Limitations, and Future Research
From a preliminary economic perspective, floating-raft S. portulacastrum can be integrated directly into shrimp ponds. The plants are grown on floating foam rafts placed on part of the pond surface, while shrimp are cultured in the water column below.
In Vietnam, a foam raft of 49 × 28 cm costs about USD 1. This is equivalent to about USD 5–7.3 m−2, depending on raft layout, surface coverage, and purchase scale. With an assumed service life of 5 years, raft depreciation is about USD 0.08–0.12 m−2 per 28-day cycle. In this experiment, harvested S. portulacastrum biomass reached about 370–461 g DW m−2 after 28 days. Based on the observed dry matter content of about 9–10%, this is equal to about 3.7–5.1 kg fresh biomass m−2 per cycle.
Manual harvesting can be done about once per month. If one worker harvests about 200 m2 day−1 and local labor cost is USD 15–20 day−1, harvesting labor is about USD 0.075–0.10 m−2 per cycle. Under favorable market conditions, with a fresh biomass price of USD 2 kg−1, the gross biomass value is about USD 7.4–10.2 m−2 per cycle. After subtracting raft depreciation and harvesting labor, the preliminary best-case gross margin is about USD 7.2–10.0 m−2 per cycle.
This is only a preliminary estimate. It does not include transportation, washing, sorting, quality control, market-related losses, or biosafety assessment. This study also has several technical limitations. The experiment lasted only 28 days and did not evaluate the long-term performance of the pond system. Therefore, the results should be interpreted as experimental evidence of the growth capacity of S. portulacastrum, its nutrient uptake potential, and the response of the integrated shrimp–plant system under different salinity levels, rather than as direct confirmation of commercial-scale shrimp production performance.
Nutrient uptake kinetics were not determined because repeated sampling of water and plant tissues was not conducted. In addition, the microbial communities in the culture tanks were not analyzed. This limits the ability to explain the nutrient transformation mechanisms resulting from the direct interactions among shrimp, plants, and the pond water environment.