Article

Industrial Food Waste Screening in Emilia-Romagna and the Conceptual Design of a Novel Process for Biomethane Production

1
Dipartimento di Energia, Politecnico di Milano, Via Lambruschini 4, 20156 Milano, Italy
2
LEAP s.c.a r.l., Laboratorio Energia e Ambiente Piacenza, Via Nino Bixio 27/C, 29121 Piacenza, Italy
*
Author to whom correspondence should be addressed.
Waste 2025, 3(4), 33; https://doi.org/10.3390/waste3040033
Submission received: 16 June 2025 / Revised: 22 September 2025 / Accepted: 24 September 2025 / Published: 30 September 2025
(This article belongs to the Special Issue New Trends in Liquid and Solid Effluent Treatment)

Abstract

The REPowerEU plan is aimed at a target of 35 bcm of biomethane annually by 2030, up from 4 bcm in 2023, requiring about EUR 37 billion in investment. Food waste is identified as a key feedstock, characterized by discrete homogeneity, although its availability may vary seasonally. In Italy, the Emilia-Romagna region generates approximately 450 kt/y of industrial waste from the food and beverage sector, primarily originating from meat processing (NACE 10.1), fruit and vegetable processing (NACE 10.3), and the manufacture of vegetable and animal oils and fats (NACE 10.4). Of this amount, food and beverage processing waste (EWC 02) accounts for about 302 kt from NACE 10 (food, year 2019) and 14 kt from NACE 11 (beverage, year 2019). This study provides a comprehensive screening of waste streams generated by the local food and beverage industry in Emilia-Romagna, evaluating the number of enterprises, their value added, and recorded waste production. The screening led to the identification of suitable streams for further valorization strategies: a total of ~93 kt/y was selected for the preliminary conceptual design of an integrated process combining anaerobic digestion with hydrothermal treatment, aimed at supporting national biomethane production targets while maximizing material recovery through hydrochar production. Preliminary estimations indicate that the proposed process may achieve a biochemical methane potential of approximately 0.23 Nm3/kgVS, along with a hydrochar yield of about 130 kg/twaste.

1. Introduction

According to the United Nations Food and Agriculture Organization (FAO), approximately one-third of all food produced is lost during harvesting and throughout the supply chain, resulting in an estimated annual loss of USD 1 trillion [1,2]. Beyond its economic consequences, food waste is a significant source of greenhouse gas emissions, water loss, air and water pollution, biodiversity decline, soil degradation, and climate change [1].
In Europe, about 30 Mt of inedible food waste is produced at the food manufacturing stage, showing the potential to be further employed for waste-to-value processes given their high level of homogeneity [3]. This characteristic is fostering the use of food waste generated by the food processing industry as a feedstock in biorefineries, seeking to enable zero-waste production and promote a circular economy approach by transforming residues into valuable raw materials upon the reliable and continuous availability of the selected biomass [3,4]. These advancements play a pivotal role in supporting the implementation of key EU policy frameworks, including the Bioeconomy Strategy [5] and the Circular Economy Action Plan [6].
Among the strategies to substitute fossil fuel accelerating Europe’s clean energy transition, the Repower EU plan aims at scaling up sustainable biomethane yearly production from roughly 4 bcm in 2023 to 35 bcm by 2030 [7], reducing EU gas dependence with an estimated EUR 37 billion investment [8]. The Biomethane Action Plan drafted by the EU Commission outlines the necessity to overcome production barriers hindering sustainable paths for biomethane production based on waste generated by different economic sectors such as agricultural and agro-industry waste and residues, forest industry waste and residues, food industry waste, energy and chemical industry biogenic CO2 effluents and waste, industrial wastewater, and domestic organic waste [8,9,10].
Strategies for food waste valorization play a significant role in the Emilia-Romagna region located in northern Italy. This area is distinguished by a highly developed food and beverage industry, generating over EUR 4.1 billion in value added [11]. A variety of food waste streams can be detected, whose current fate mainly consists of energy recovery or other disposal operations (D2 to D14 as from 2008/98/EC Annex 1 [12]). The present paper aims at providing a screening of the industrial food waste streams in Emilia-Romagna (Section 3), identifying suitable feedstocks for biomethane production through anaerobic digestion (Section 4.1). Moreover, a preliminary conceptual design of a novel process combining anaerobic digestion with hydrothermal treatment is proposed (Section 4.2) and delivered for future sizing and performance estimation works.

2. Approach and Methodology

2.1. Screening of Food Waste Production in Emilia-Romagna Region

The analysis of waste streams generated in Emilia-Romagna is based on publicly available data from authoritative sources and relies on three key indicators: the number of enterprises, waste production, and value added.
Data on the number of enterprises operating in the Emilia-Romagna food and beverage industry were retrieved from ISTAT (Istituto Nazionale di Statistica) with reference to Archivio Statistico delle Imprese Attive (ASIA). The companies were classified based on the Statistical Classification of Economic Activities in the European Community (NACE) [13] and grouped by provinces. As reported in Table 1, the analysis considered divisions 10 and 11 from NACE section C (Manufacturing) in order to limit the screening to the food and beverage industry.
Waste production from the food and beverage industry at the national level was tracked based on the 2019 database from the Istituto Superiore per la Protezione e la Ricerca Ambientale (ISPRA) [14]; meanwhile, the analysis at the regional level relied on data from Agenzia Regionale per la Prevenzione, l’Ambiente e l’Energia Emilia-Romagna (ARPAE) with reference to the special waste dataset [15] and the selected NACE codes. Moreover, waste classification is based on the European Waste Catalogue (EWC) [16], which is divided into 20 chapters (from 01 to 20). The chapter of interest for the present study is 02, i.e., waste from agriculture, horticulture, aquaculture, forestry, hunting and fishing, food preparation, and processing.
The data cleaning process used to identify the waste amount in Emilia-Romagna, its characterization, and regional distribution required a dual search filter, initially based on the waste’s origin and then on its nature. In the first step, only streams that originated from the food and beverage industry were selected with reference to the NACE codes as selection criteria (refer to Table 1). Following this step, the EWC code was employed to ensure that only organic waste is considered, eliminating plastics, metals, and other waste flows in the initial screening, as they were not relevant to the current study.
Data concerning food and beverage waste streams are referred to the year 2019 and were retrieved and analyzed in terms of evaluating the contribution of the selected waste production at the regional (i.e., Emilia-Romagna) and national levels.
The third indicator considered for screening is the value added, representing the growth of the economic system in terms of new goods and services made available to the community for final use. According to ISTAT, the value added is calculated as the difference between the value of goods and services produced by individual production sectors and the value of intermediate goods and services they consume (such as raw materials, auxiliary inputs, and services from other units) [17]. The selection of suitable waste streams to be further investigated in terms of composition and potential for advanced valorization processes was carried out based on both the amount of waste produced per NACE group and its relative impact with respect to the value added of the producers.
A summary of the aforementioned adopted methodology is graphically represented in Figure 1.

2.2. Conceptual Design of Alternative Waste-to-Value Process

The waste streams of interest selected from the regional waste produced from the industrial food and beverage industry were divided into solids and sludges. Their characterization was carried out in terms of solid fraction, volatile solids, ashes, and moisture, as well as carbohydrates, proteins, and lipids, based on literature data.
Considering the organic content of the selected waste and taking into account the final goal to contribute to biomethane production, a conceptual design of an integrated process based on anaerobic digestion and hydrothermal treatment was provided. In particular, solid streams are directed to an anaerobic digestor, whereas sludge streams are treated with the solid digestate fraction in a hydrothermal carbonization (HTC) reactor, increasing the material recovery of the entire process by producing hydrochar. It is worth mentioning that the sludge streams are not directed with solid streams to the digestor because they could have already been processed in an anaerobic digestion system potentially located within the perimeter of the manufacturer (i.e., food and beverage industrial producer); therefore it was assumed that these waste streams could not provide a significant beneficial effect to the final biomethane production process. Hence, HTC was considered to provide an adequate valorization treatment to these high-moisture sludge streams [18]. In addition, the integration of the two processes through the recirculation of the outlet HTC process water to the digestor was proposed, reaching an adequate inlet moisture content of the anaerobic digestion inlet flow rate higher than 87%w [19].
A preliminary assessment of the proposed waste-to-value process is presented in Section 4.2. This evaluation is based on assumptions from Table 2 and on additional assumptions for the HTC unit following the approach from Bataglia and coworkers [9]. As the anaerobic digestion (AD) unit envisages a recirculation to guarantee the correct moisture fraction within the reactor, the stream in the AD inlet is considered to be roughly 1.6 times greater with respect to the solid stream sent to digestion. Further analysis and a more detailed estimation of process performance are still required and will be addressed by the authors in future studies.
Based on the aforementioned assumptions, mass and energy balance were closed in order to represent specific figures of merit such as (i) BMP—biomethane potential in Nm3/kg of volatile solid (kgVS); (ii) Yhydrochar—net hydrochar yield calculated as the mass flow rate of hydrochar sent to storage per tonne of total inlet waste fed to the process; (iii) Wel—specific electric consumption of the plant calculated in terms of kWhel/t of total inlet waste.

3. Food Waste Screening: The Emilia-Romagna Region Case Study

3.1. Food and Beverage Industry: Number of Enterprises Operating in Emilia-Romagna

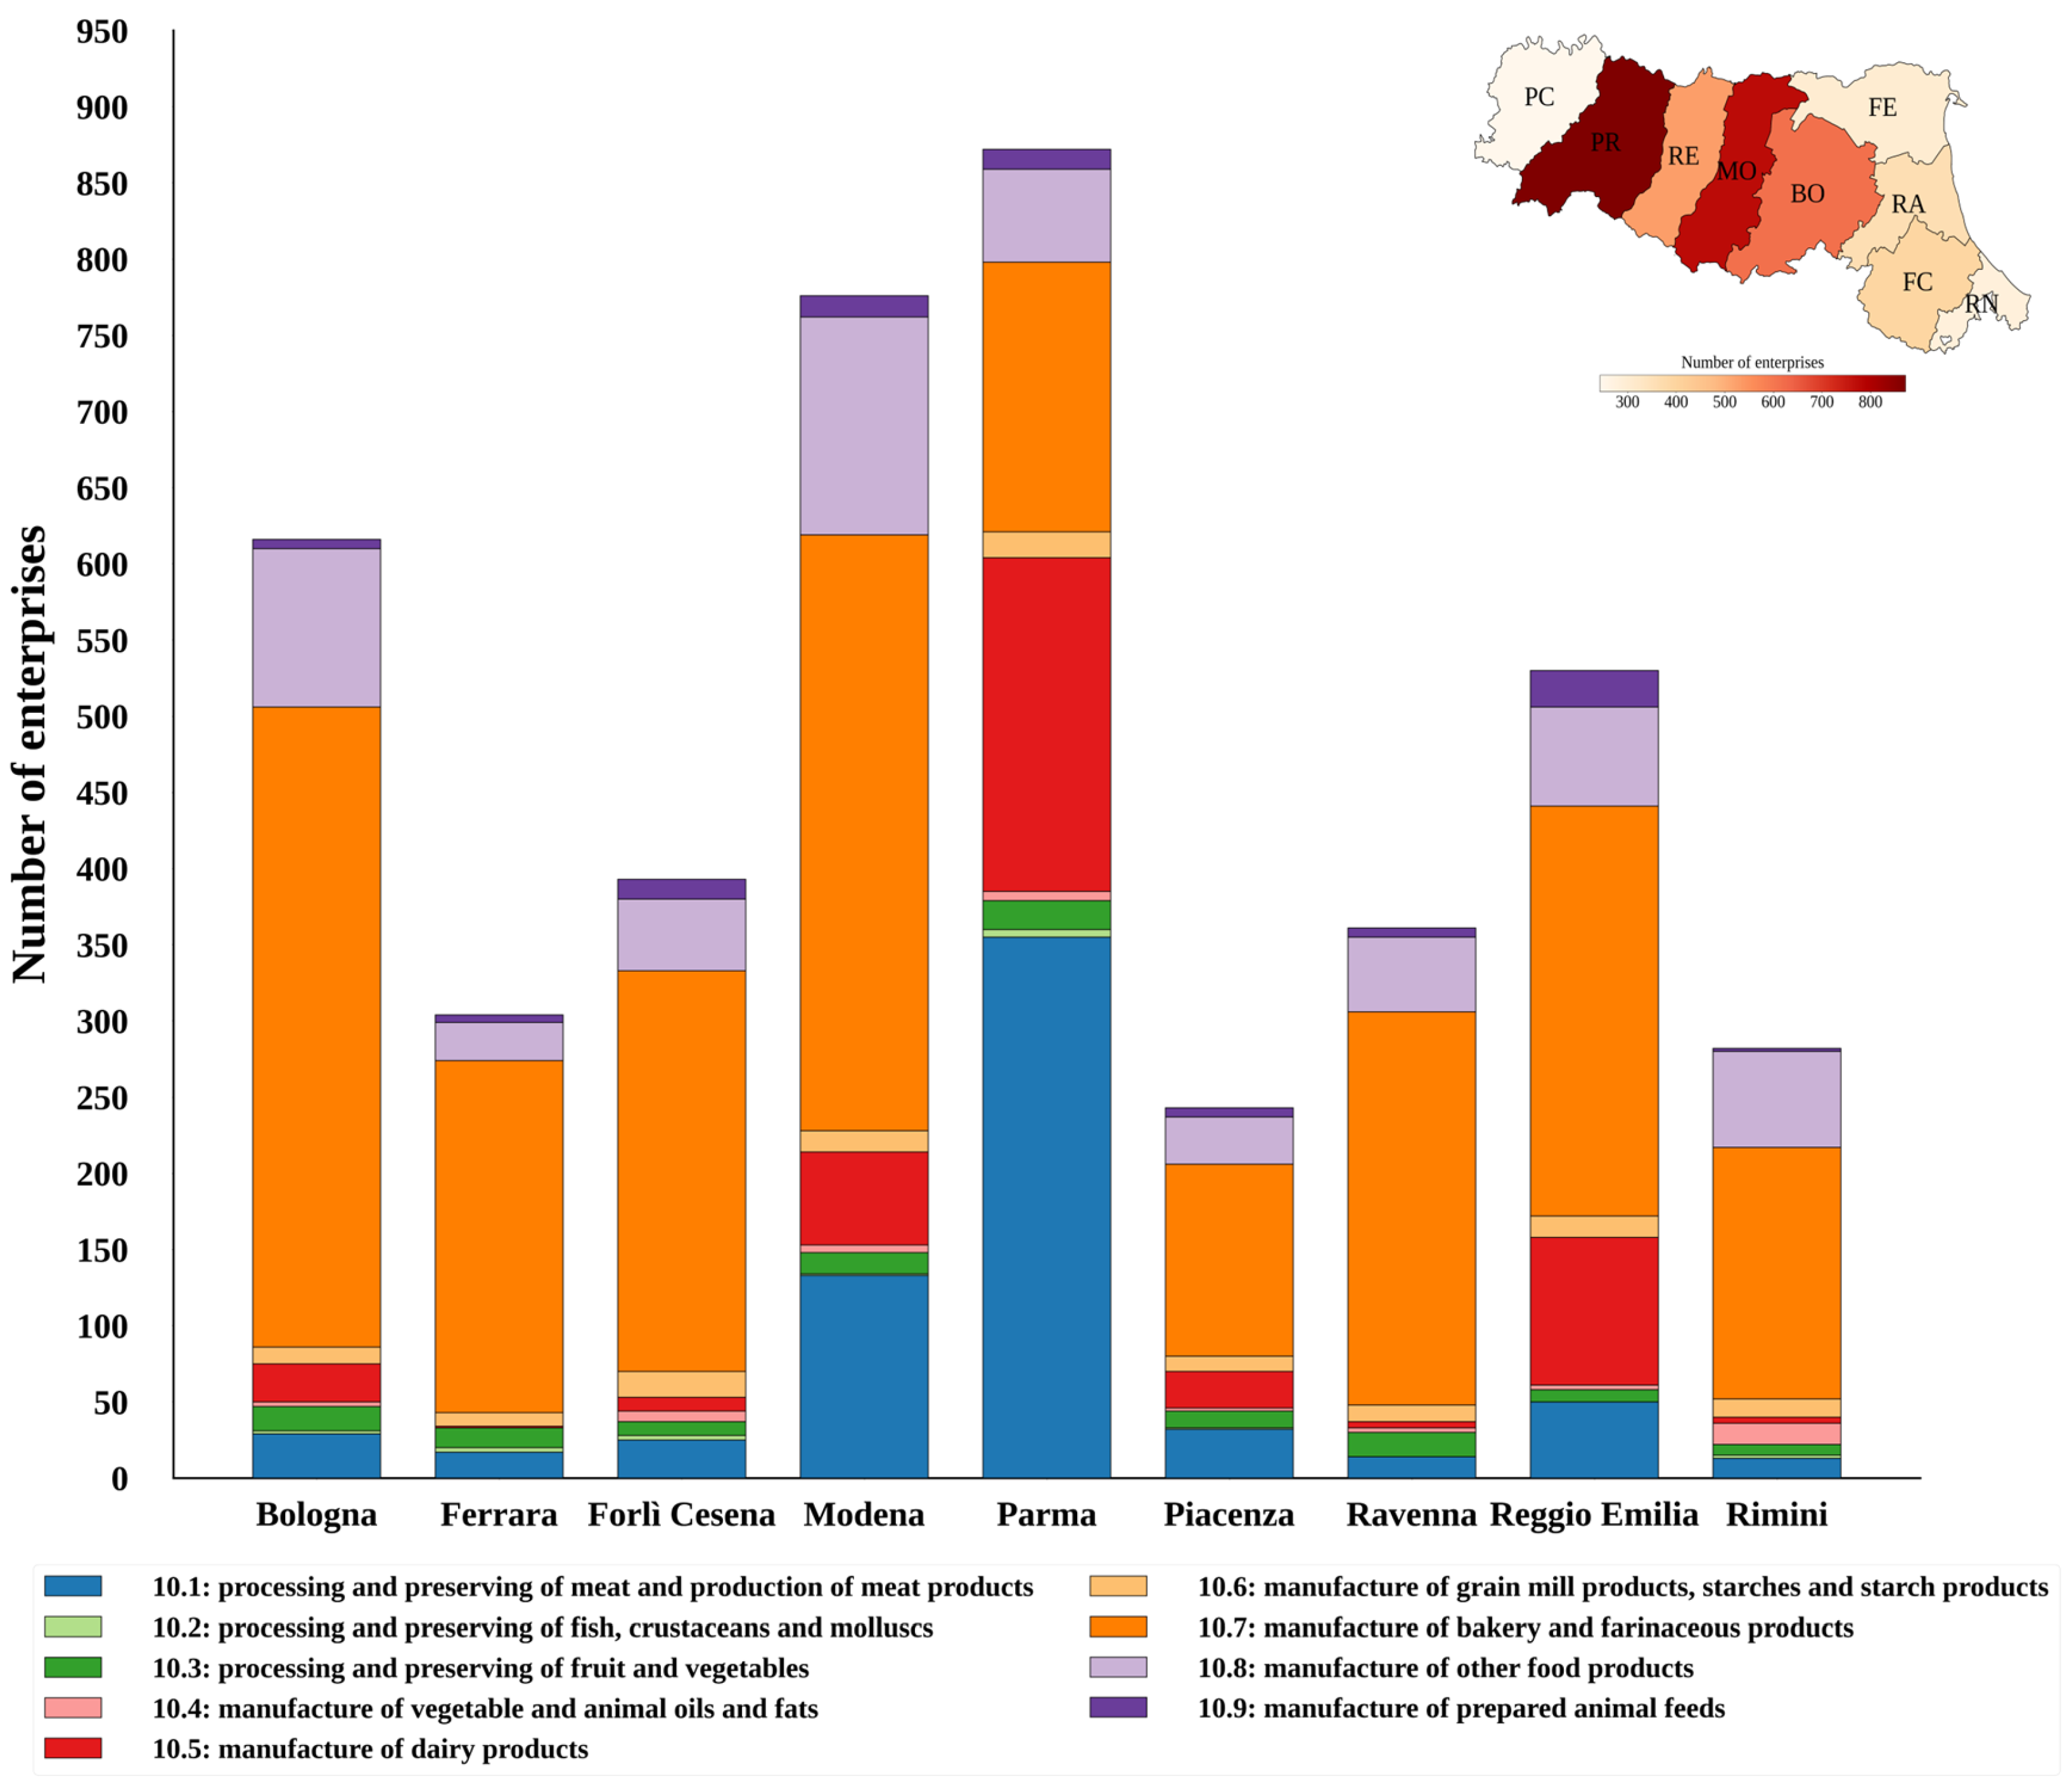
Figure 2 and the related breakdown in Table A1 in Appendix A report the number of enterprises per province operating under NACE 10 taken from ISTAT, with Parma ranking the highest, followed by Modena, Bologna, and Reggio Emilia. NACE 10.7, dedicated to the manufacture of bakery and farinaceous products, shows the highest number of enterprises, followed by category 10.1 which includes companies involved in the processing and preserving of meat and production of meat products.
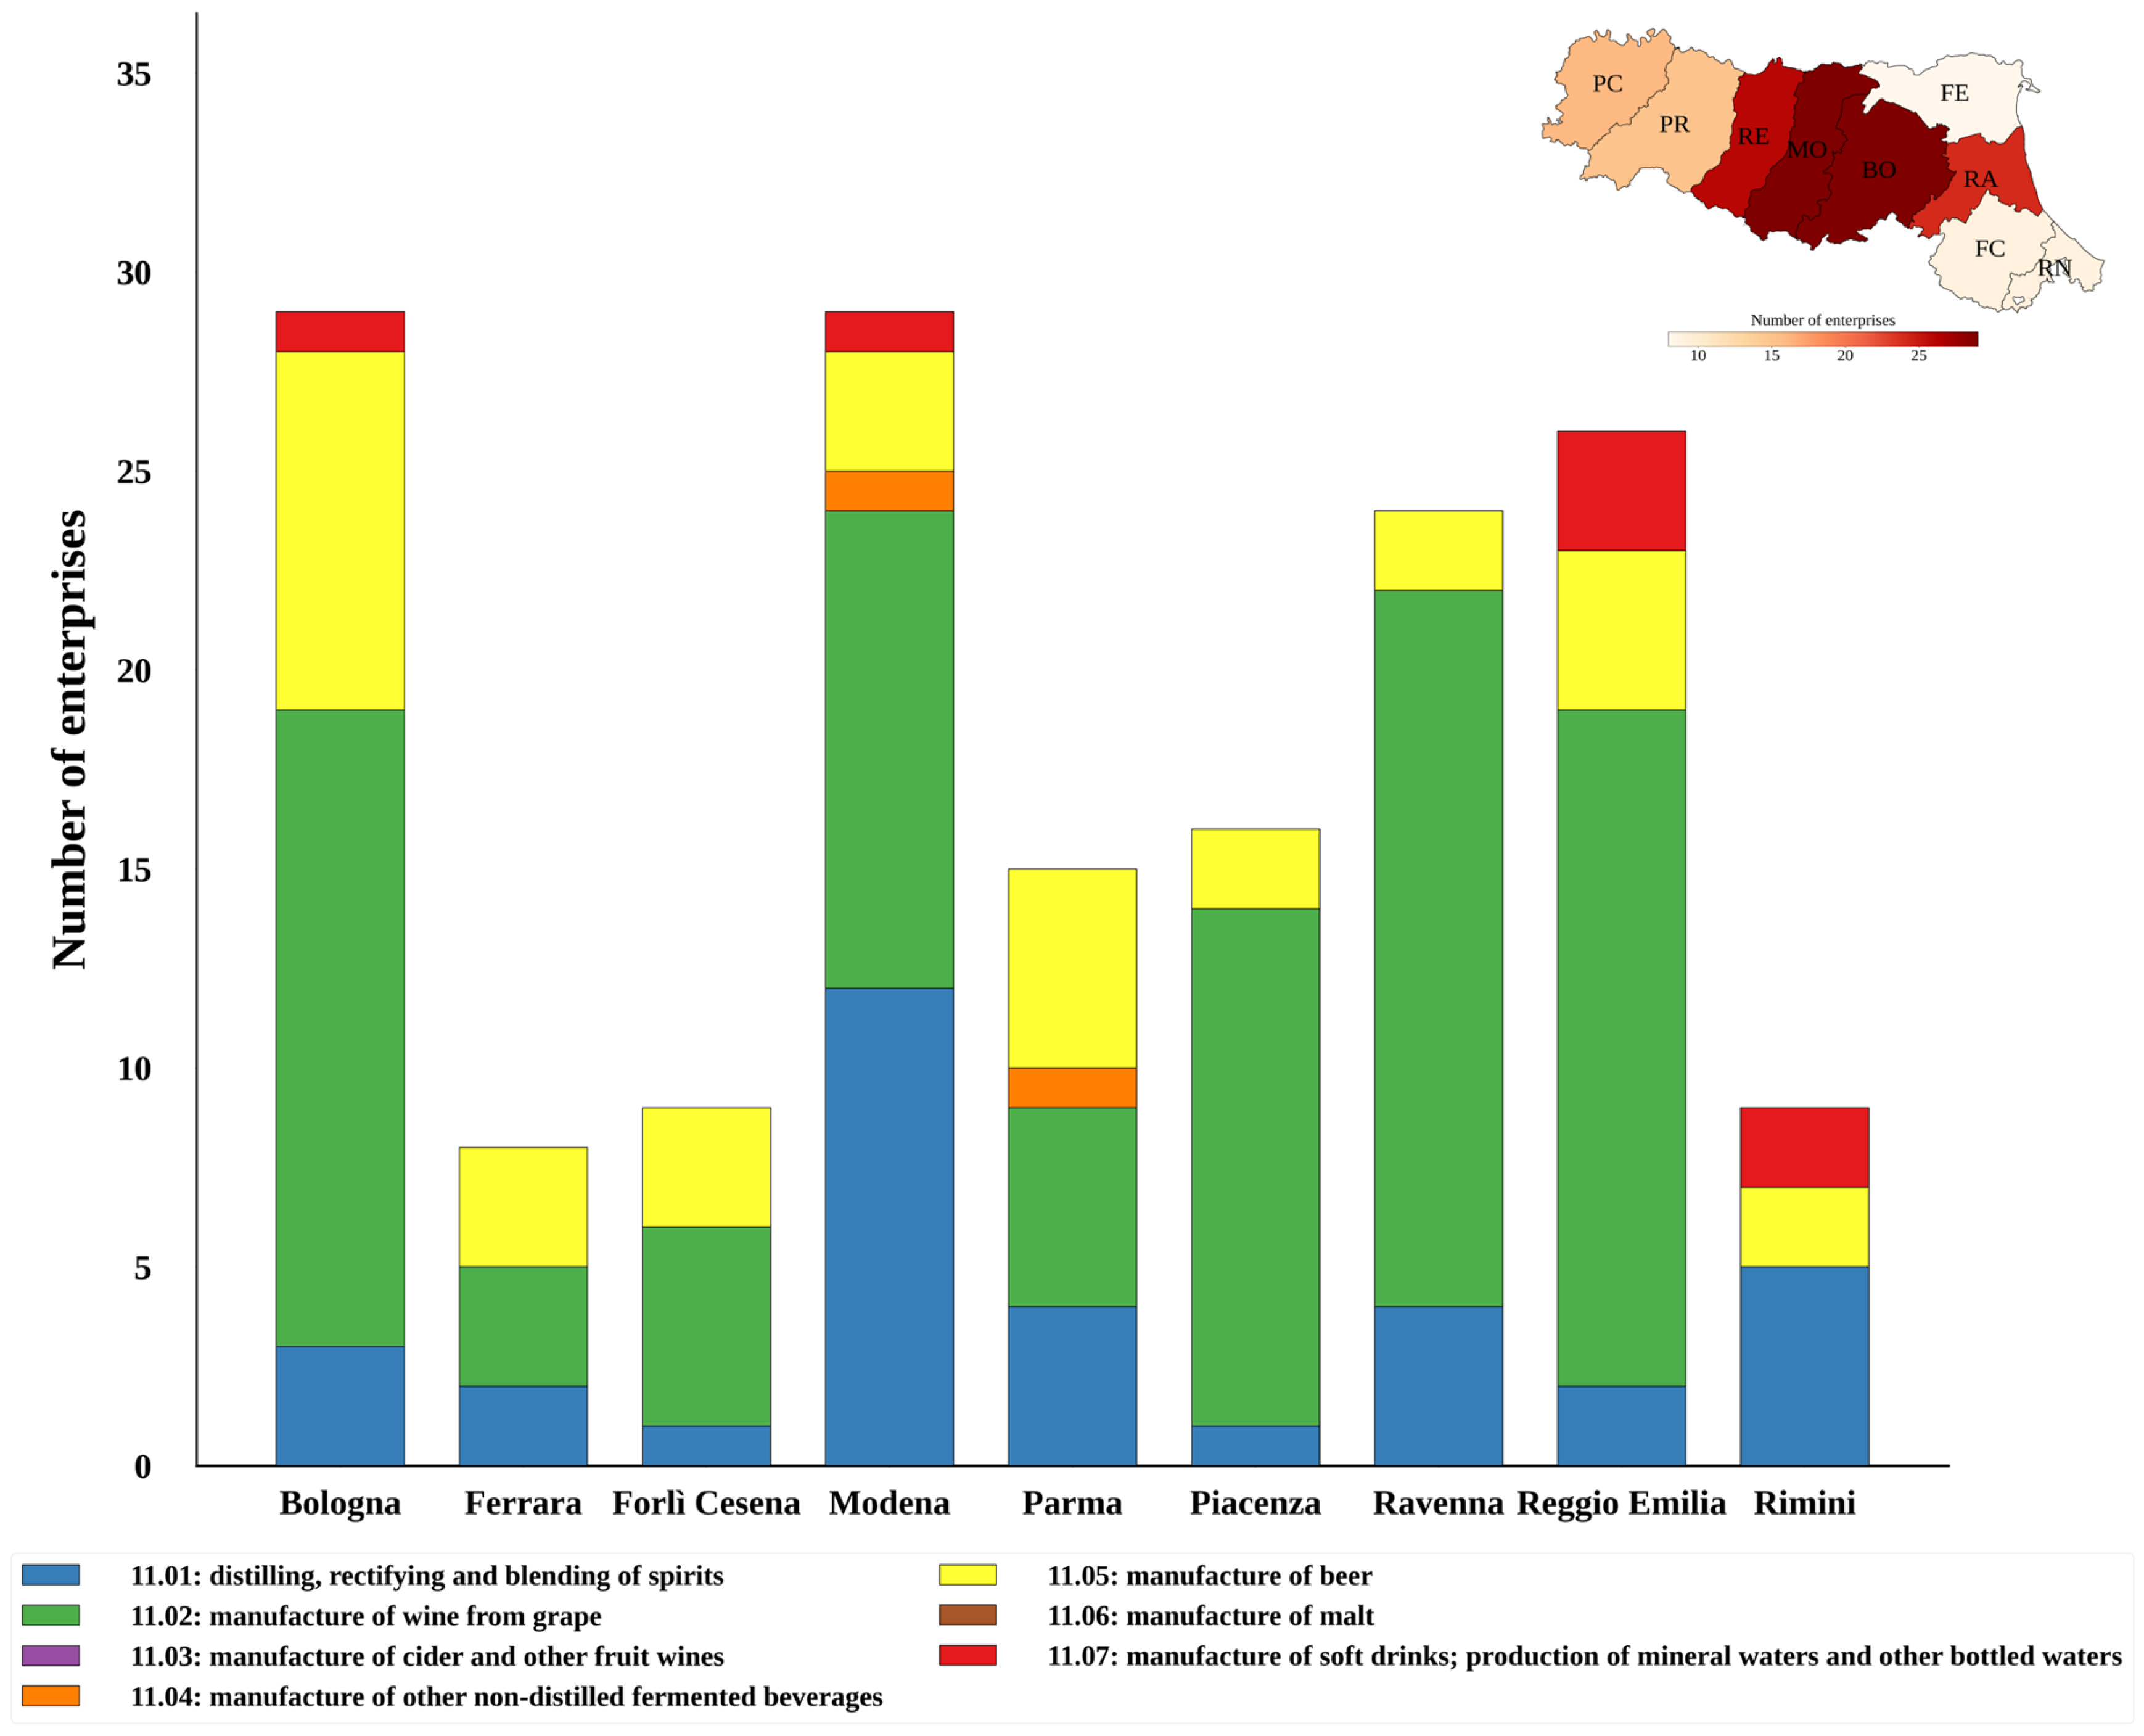
The same analytical approach was used to assess NACE 11: the results reported in Figure 3 based on data from Table A2 in Appendix A show the highest number of enterprises located in the provinces of Modena, Reggio Emilia, and Bologna. The production of liqueurs and distilled spirits, wine production, and beer production (respectively, NACE 11.01, 11.02, and 11.05) constitute the sectors with the highest number of companies.

3.2. Food and Beverage Waste Production in Emilia-Romagna

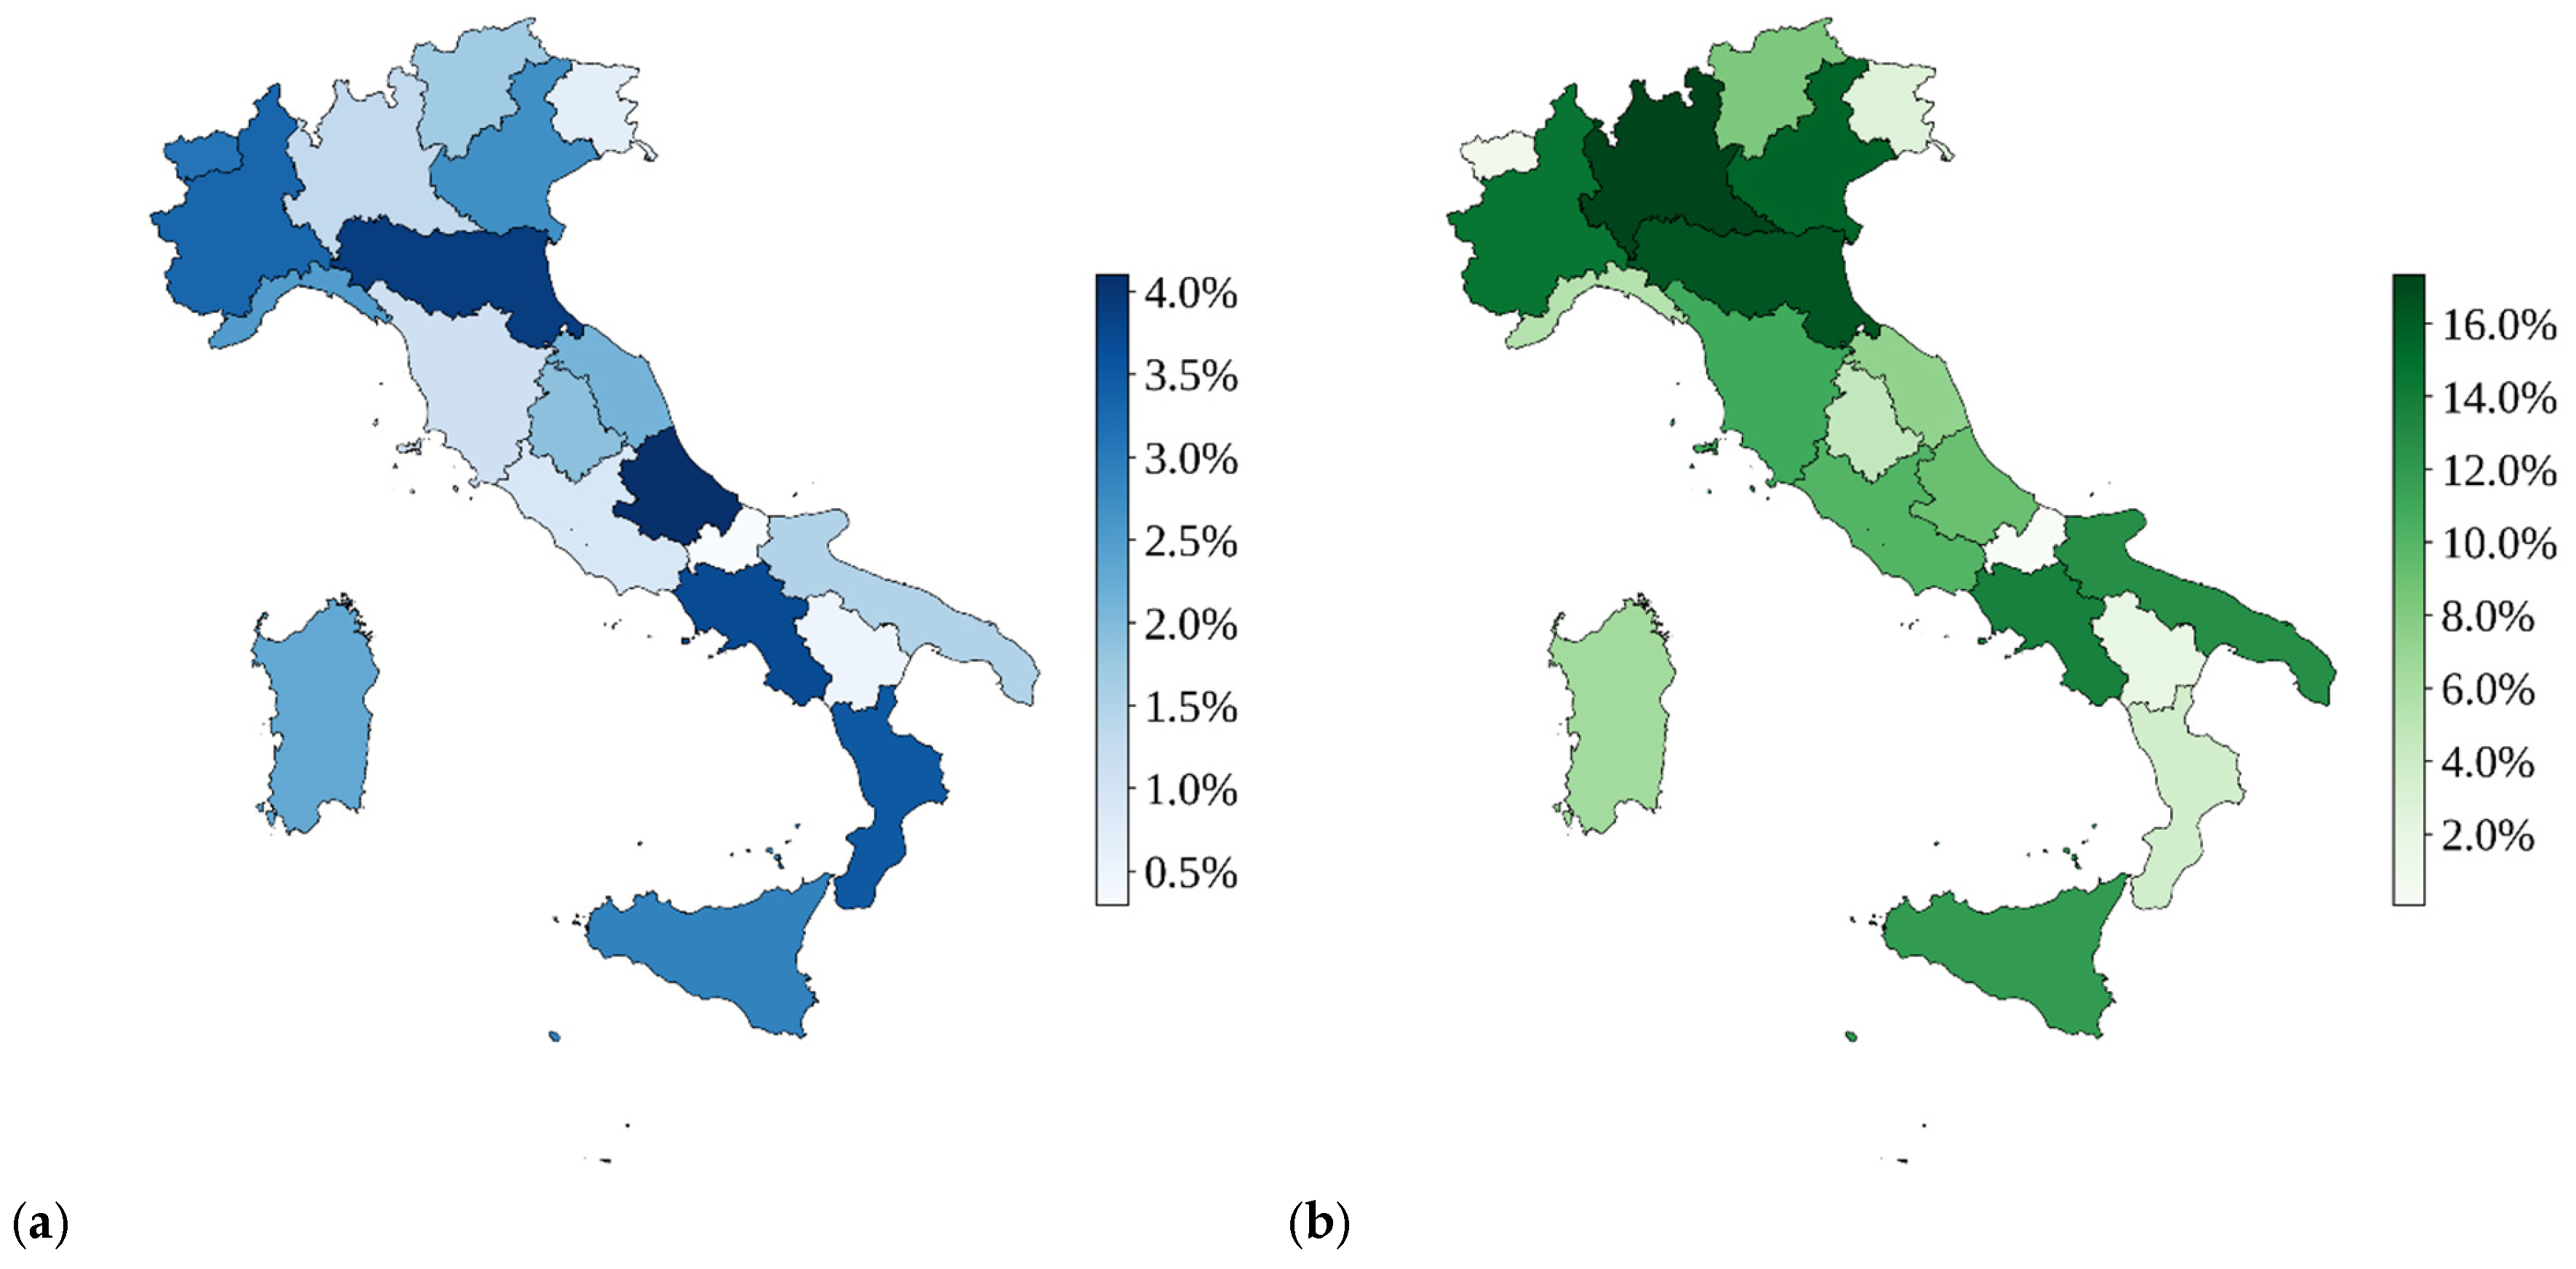
Data from ISPRA [14] were analyzed and are reported in Table 3, showing a comparative analysis of waste production from the food and beverage industry against the total industrial waste production at the national level. This analysis underscores the impact of the food and beverage sector on overall industrial waste production, emphasizing the significant role of the Emilia-Romagna region, which accounts for 3.26% of the total industrial waste production (with Abruzzo ranking first at 4.10%) and 13.39% of the total national food and beverage waste, second only to Lombardy, contributing a share of 17.33%. A graphical representation of these results is shown in Figure 4.
Figure 5 shows the weight of industrial food and beverage waste production at the regional over national level versus the fraction of the same waste over the total industrial waste per region. Based on the plot, the positioning of Emilia-Romagna which is characterized by the relevant weight of the industrial food and beverage waste with respect to the total regional industrial waste, as well as the significant impact of the sector with respect to the total food and beverage waste production. Standing out is the significant amount of food and beverage waste generated in Emilia-Romagna, both regionally and nationally, with reference to NACE sectors 10 and 11.
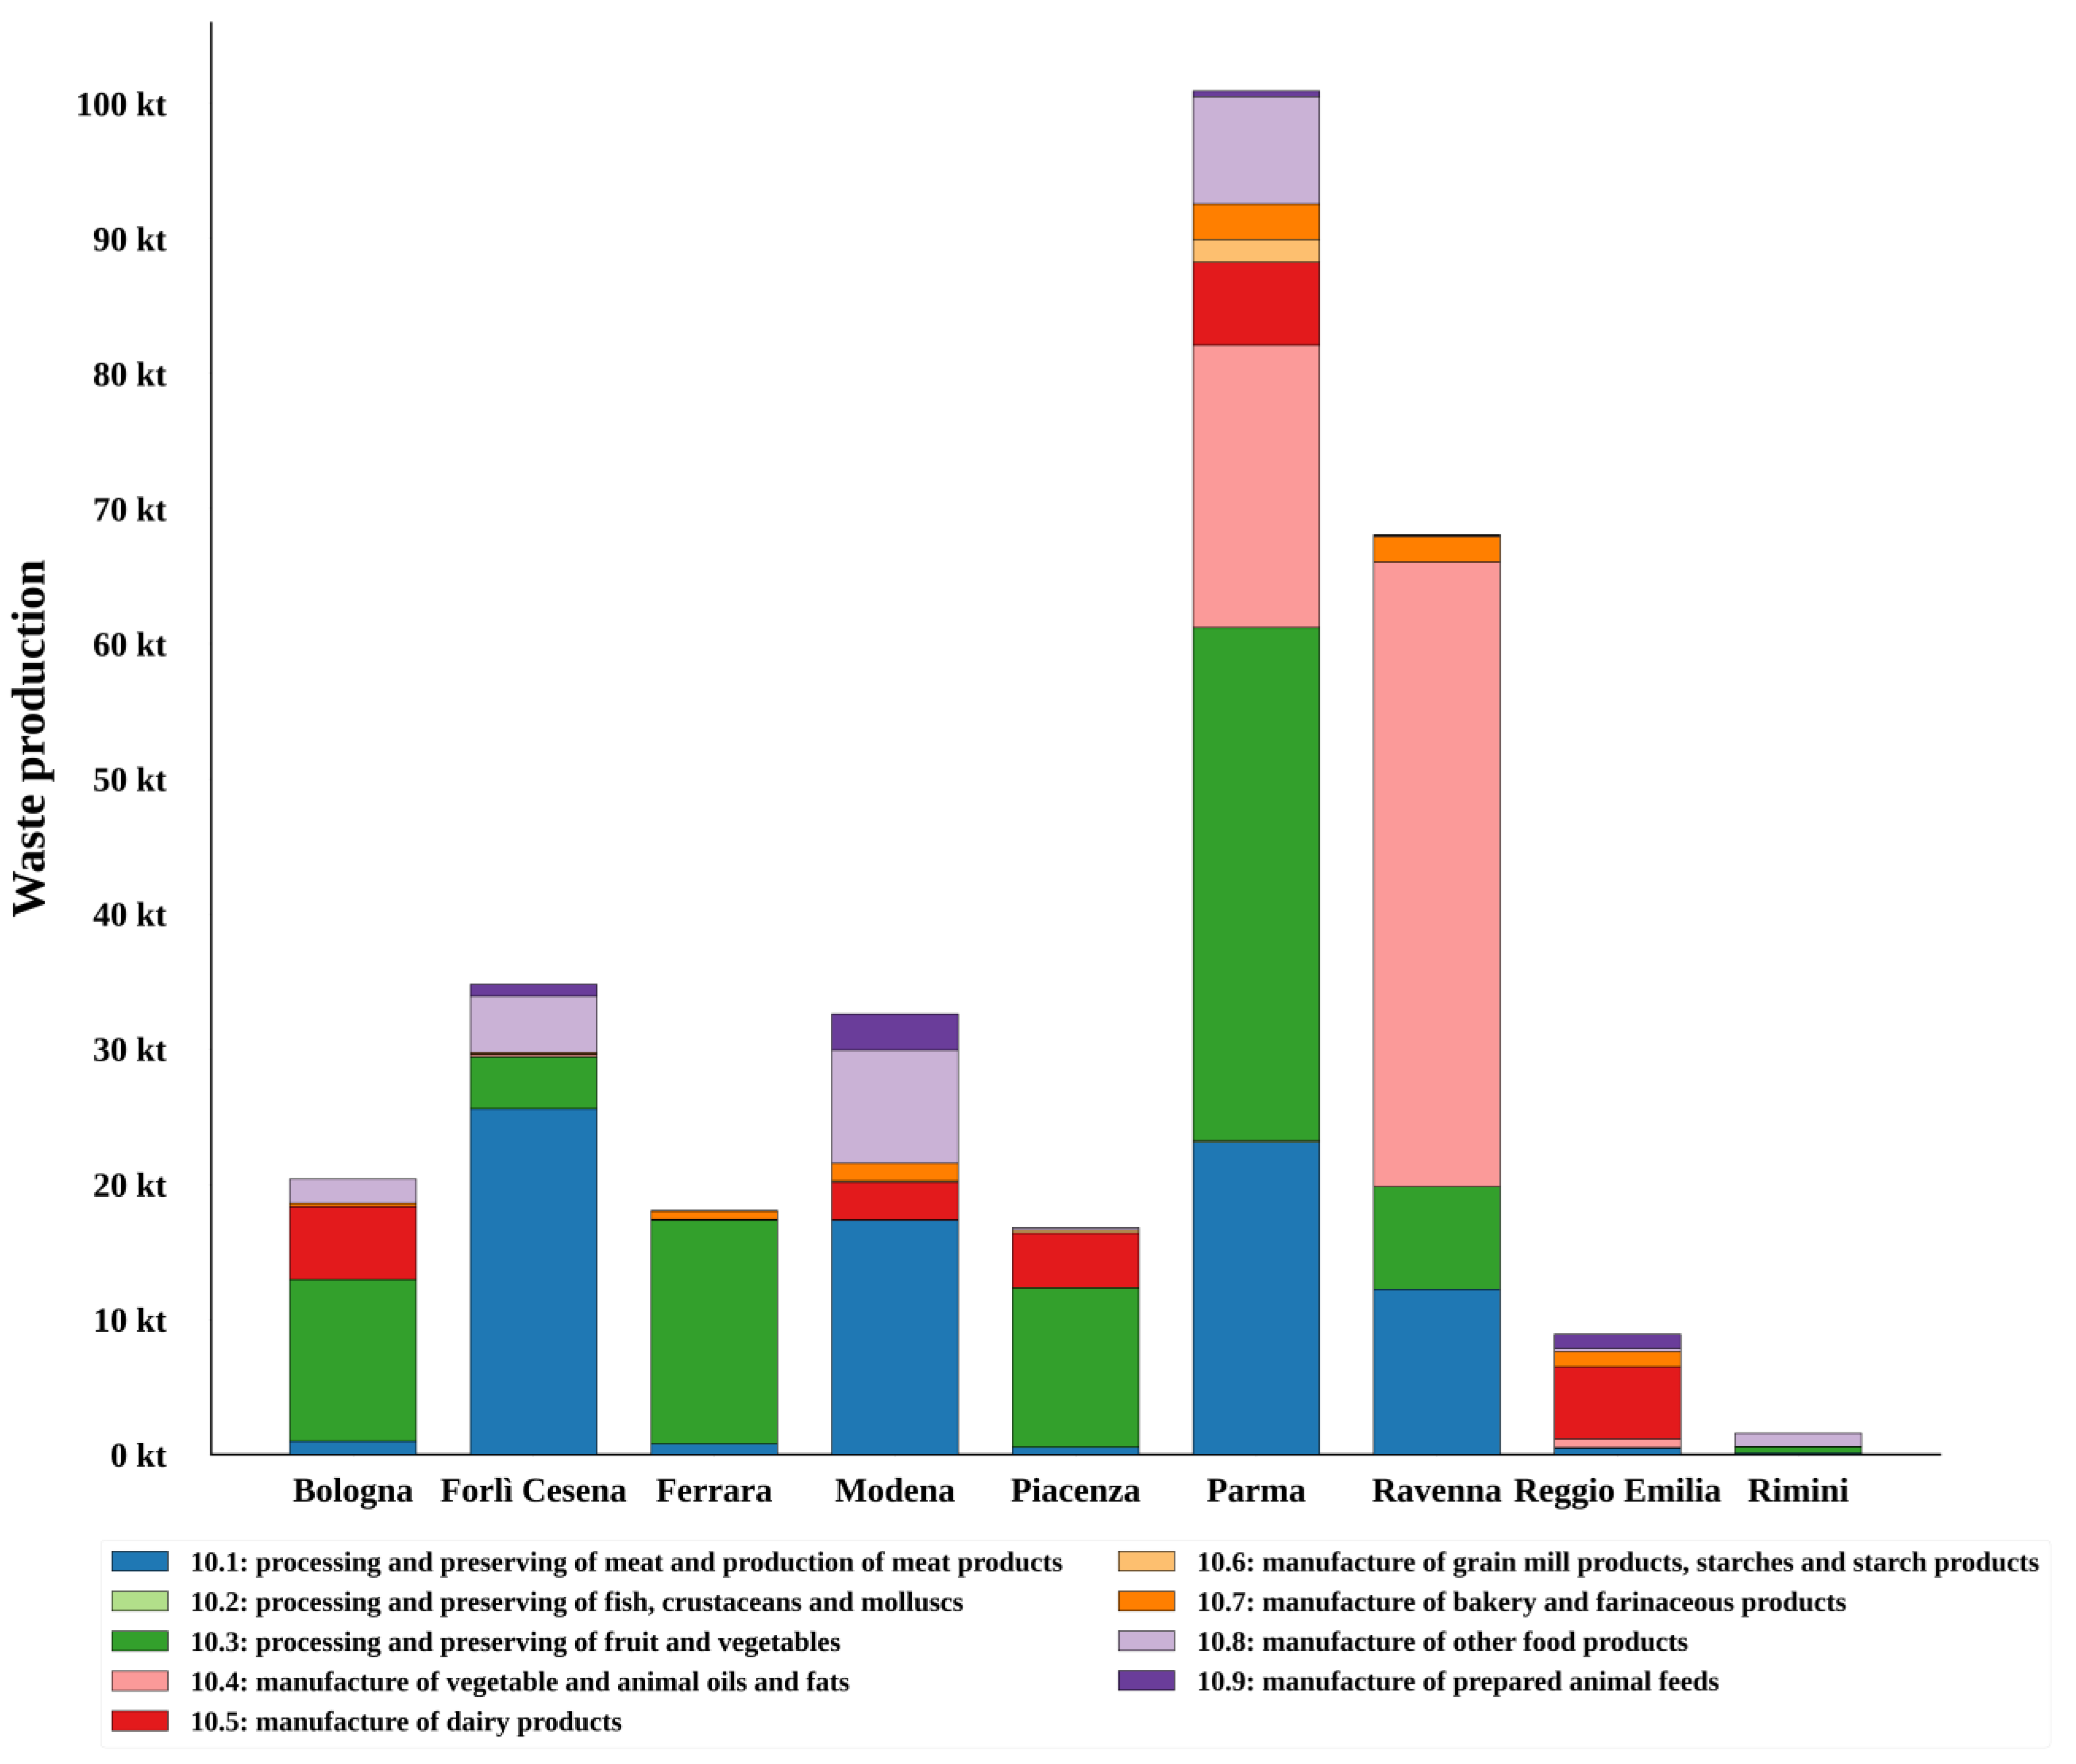
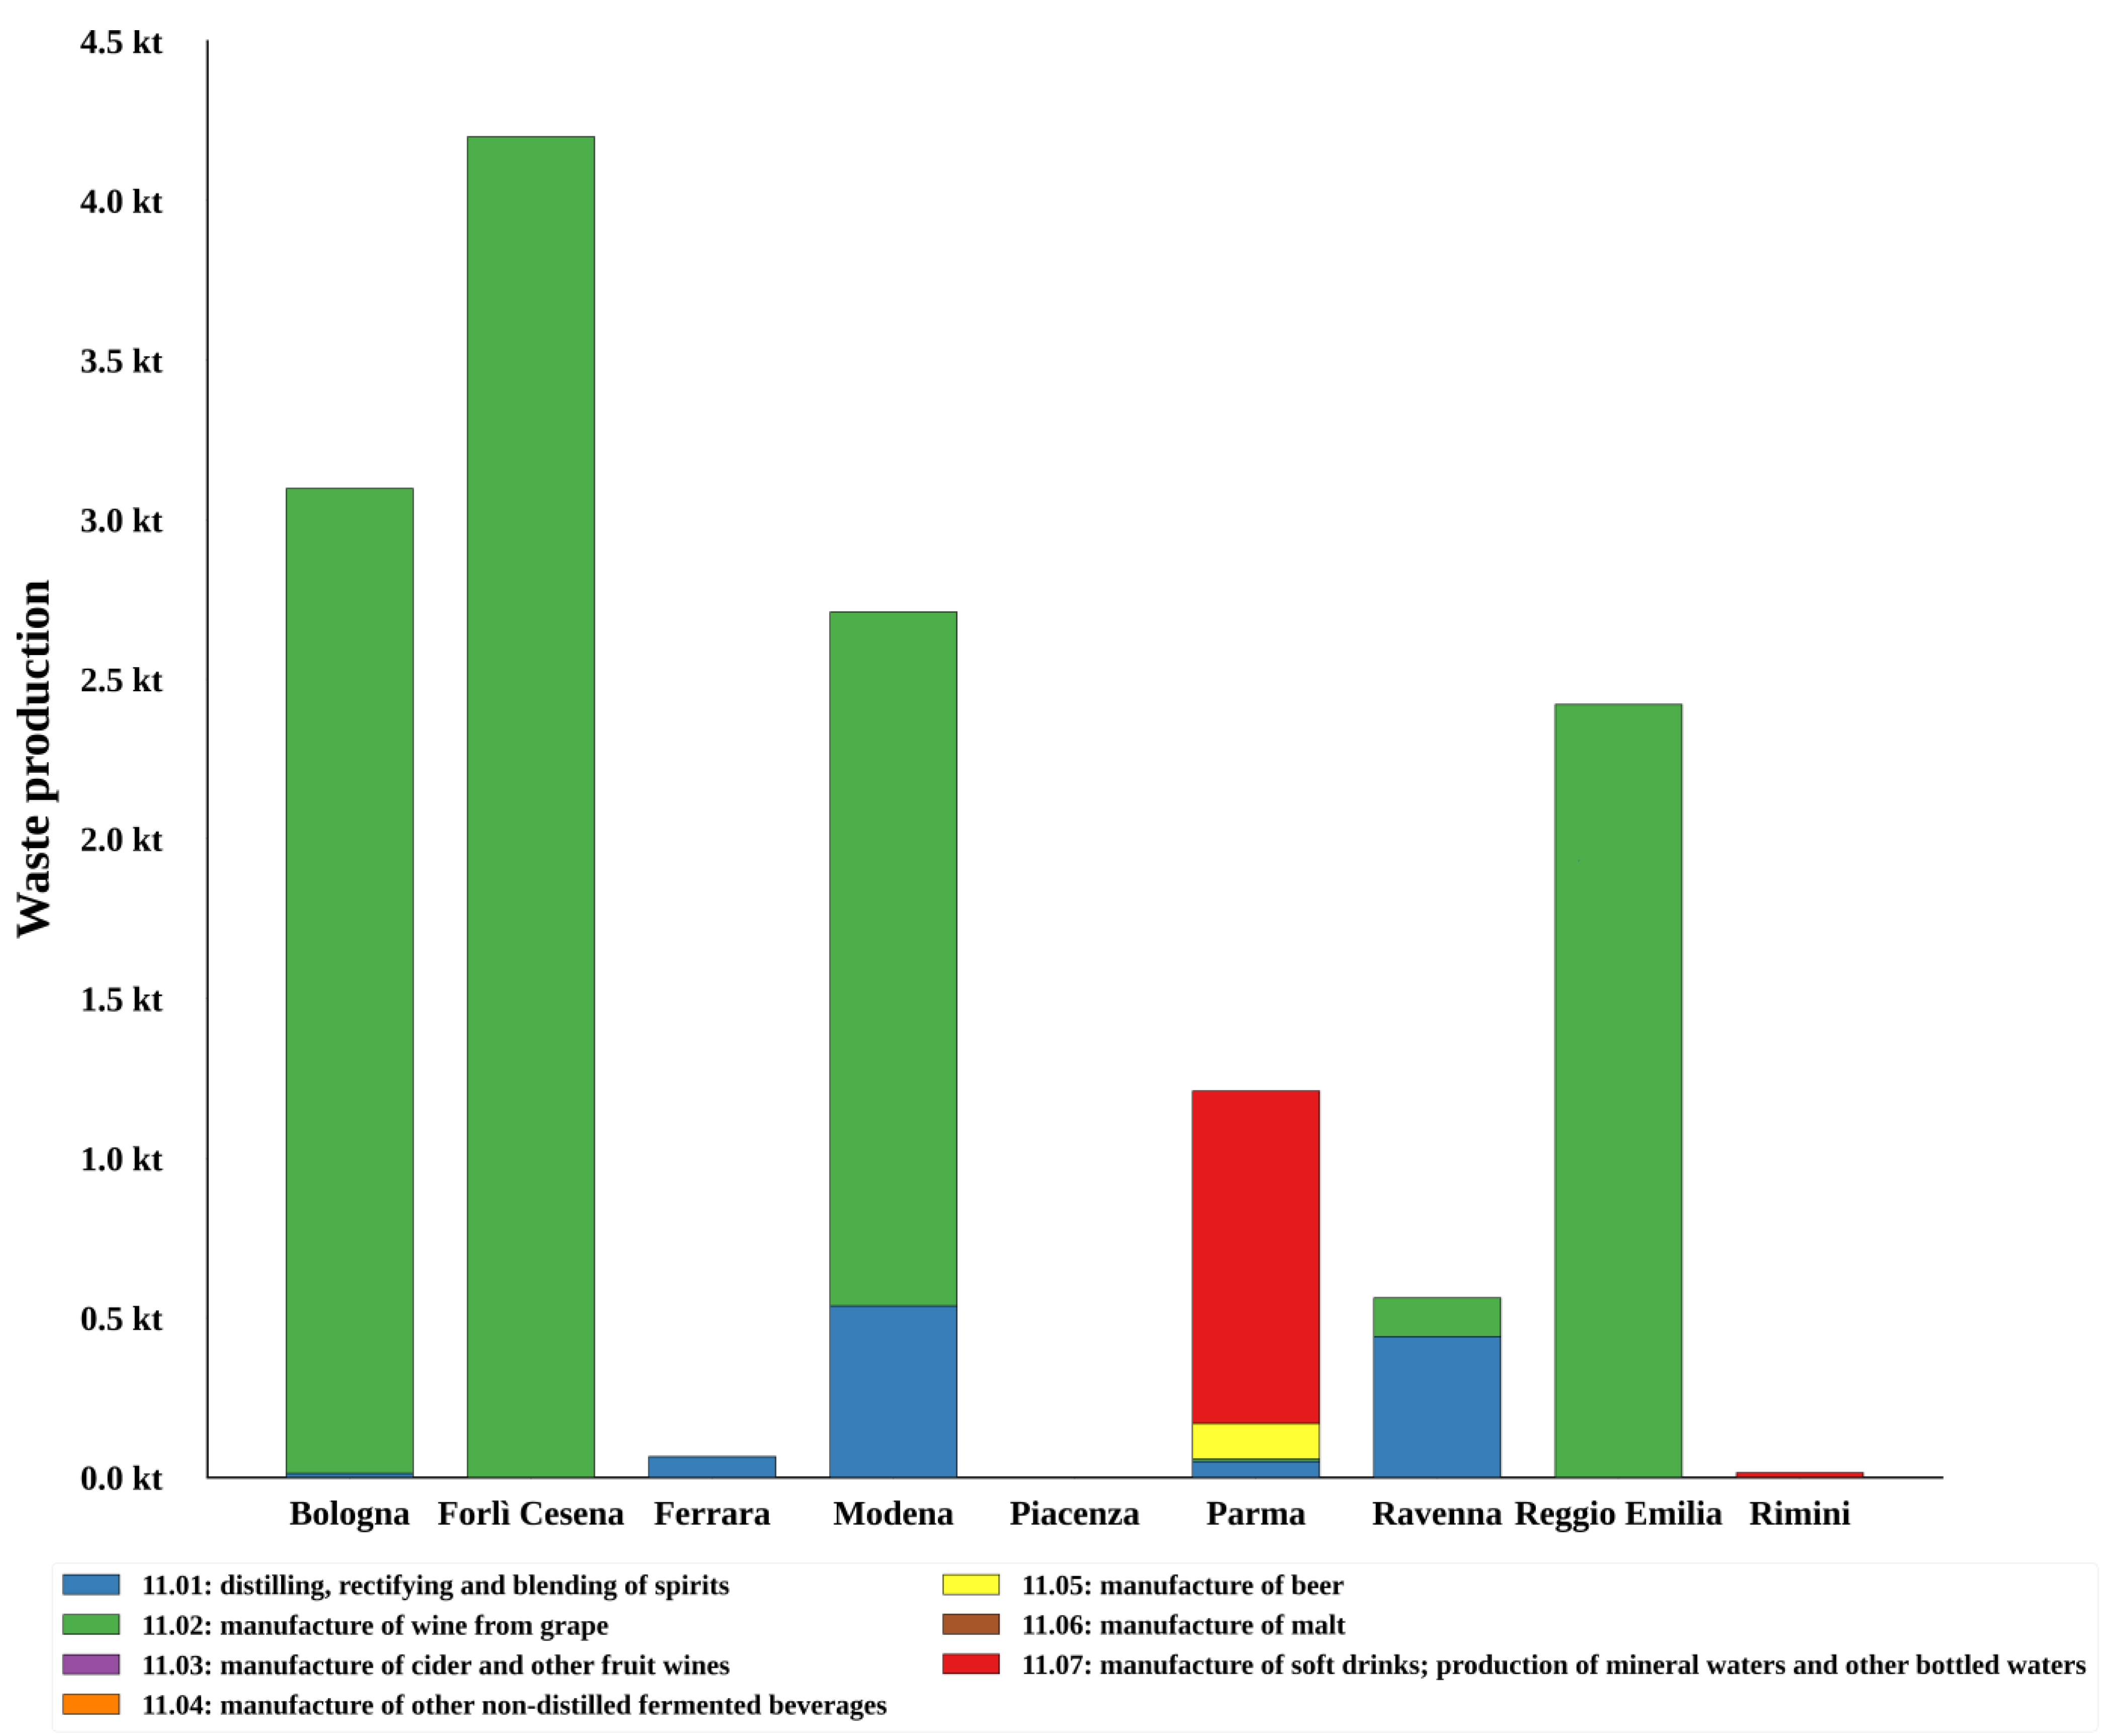
Table A3 in Appendix A, together with Figure 6 and Table A4 in Appendix A with Figure 7, respectively, report a breakdown of the NACE 10 and NACE 11 waste production broken down by subcategories. With respect to NACE 10, the meat processing industry (10.1), fruit and vegetable processing (10.3), and the manufacture of vegetable and animal oils and fats (10.4) stand out as the main sub-sectors with peaks of waste production from the provinces of Parma and Ravenna.
With respect to the food industry accounting for more than 300 kt of waste per year for NACE 10 (reference to 2019), the waste production from the beverage industry reported by NACE 11 is significantly lower (~14 kt/y2019). Moreover, in the Forlì-Cesena province, more than 4 kt of beverage waste is recorded, making it the leading province in the region.
With reference to the roughly 450 kt/y of food and beverage industrial waste produced in the Emilia-Romagna region (see Table 3, reference year 2019), the amount reported in Figure 6 and Figure 7 accounts for a total of ~316 kt/y (NACE 10 and 11); as explained in Section 2.1, this value results from the selection of streams labeled within EWC chapter 02, strictly referring to waste from food and beverage processing (i.e., waste from agriculture, horticulture, aquaculture, forestry, hunting and fishing, food preparation, and processing).

3.3. Food and Beverage Industry Characterization by Value Added

A summary of the value added for NACE 10 and 11 is represented in Figure 8 (related data reported in Table A5 in Appendix A). This figure highlights the significant contribution of NACE 10.1—the processing and preserving of meat, accounting for over EUR 1 billion in 2017. The manufacture of bakery and other food products, including sugar, cocoa, spices, and more, closely follows, with a value added approaching EUR 700 million. Dairy products and fruit and vegetable manufacturing also contribute significantly, with a value added of around EUR 500 million. In comparison, other sectors show notably lower value added.

3.4. Regional Scenario Based on Selected Figures

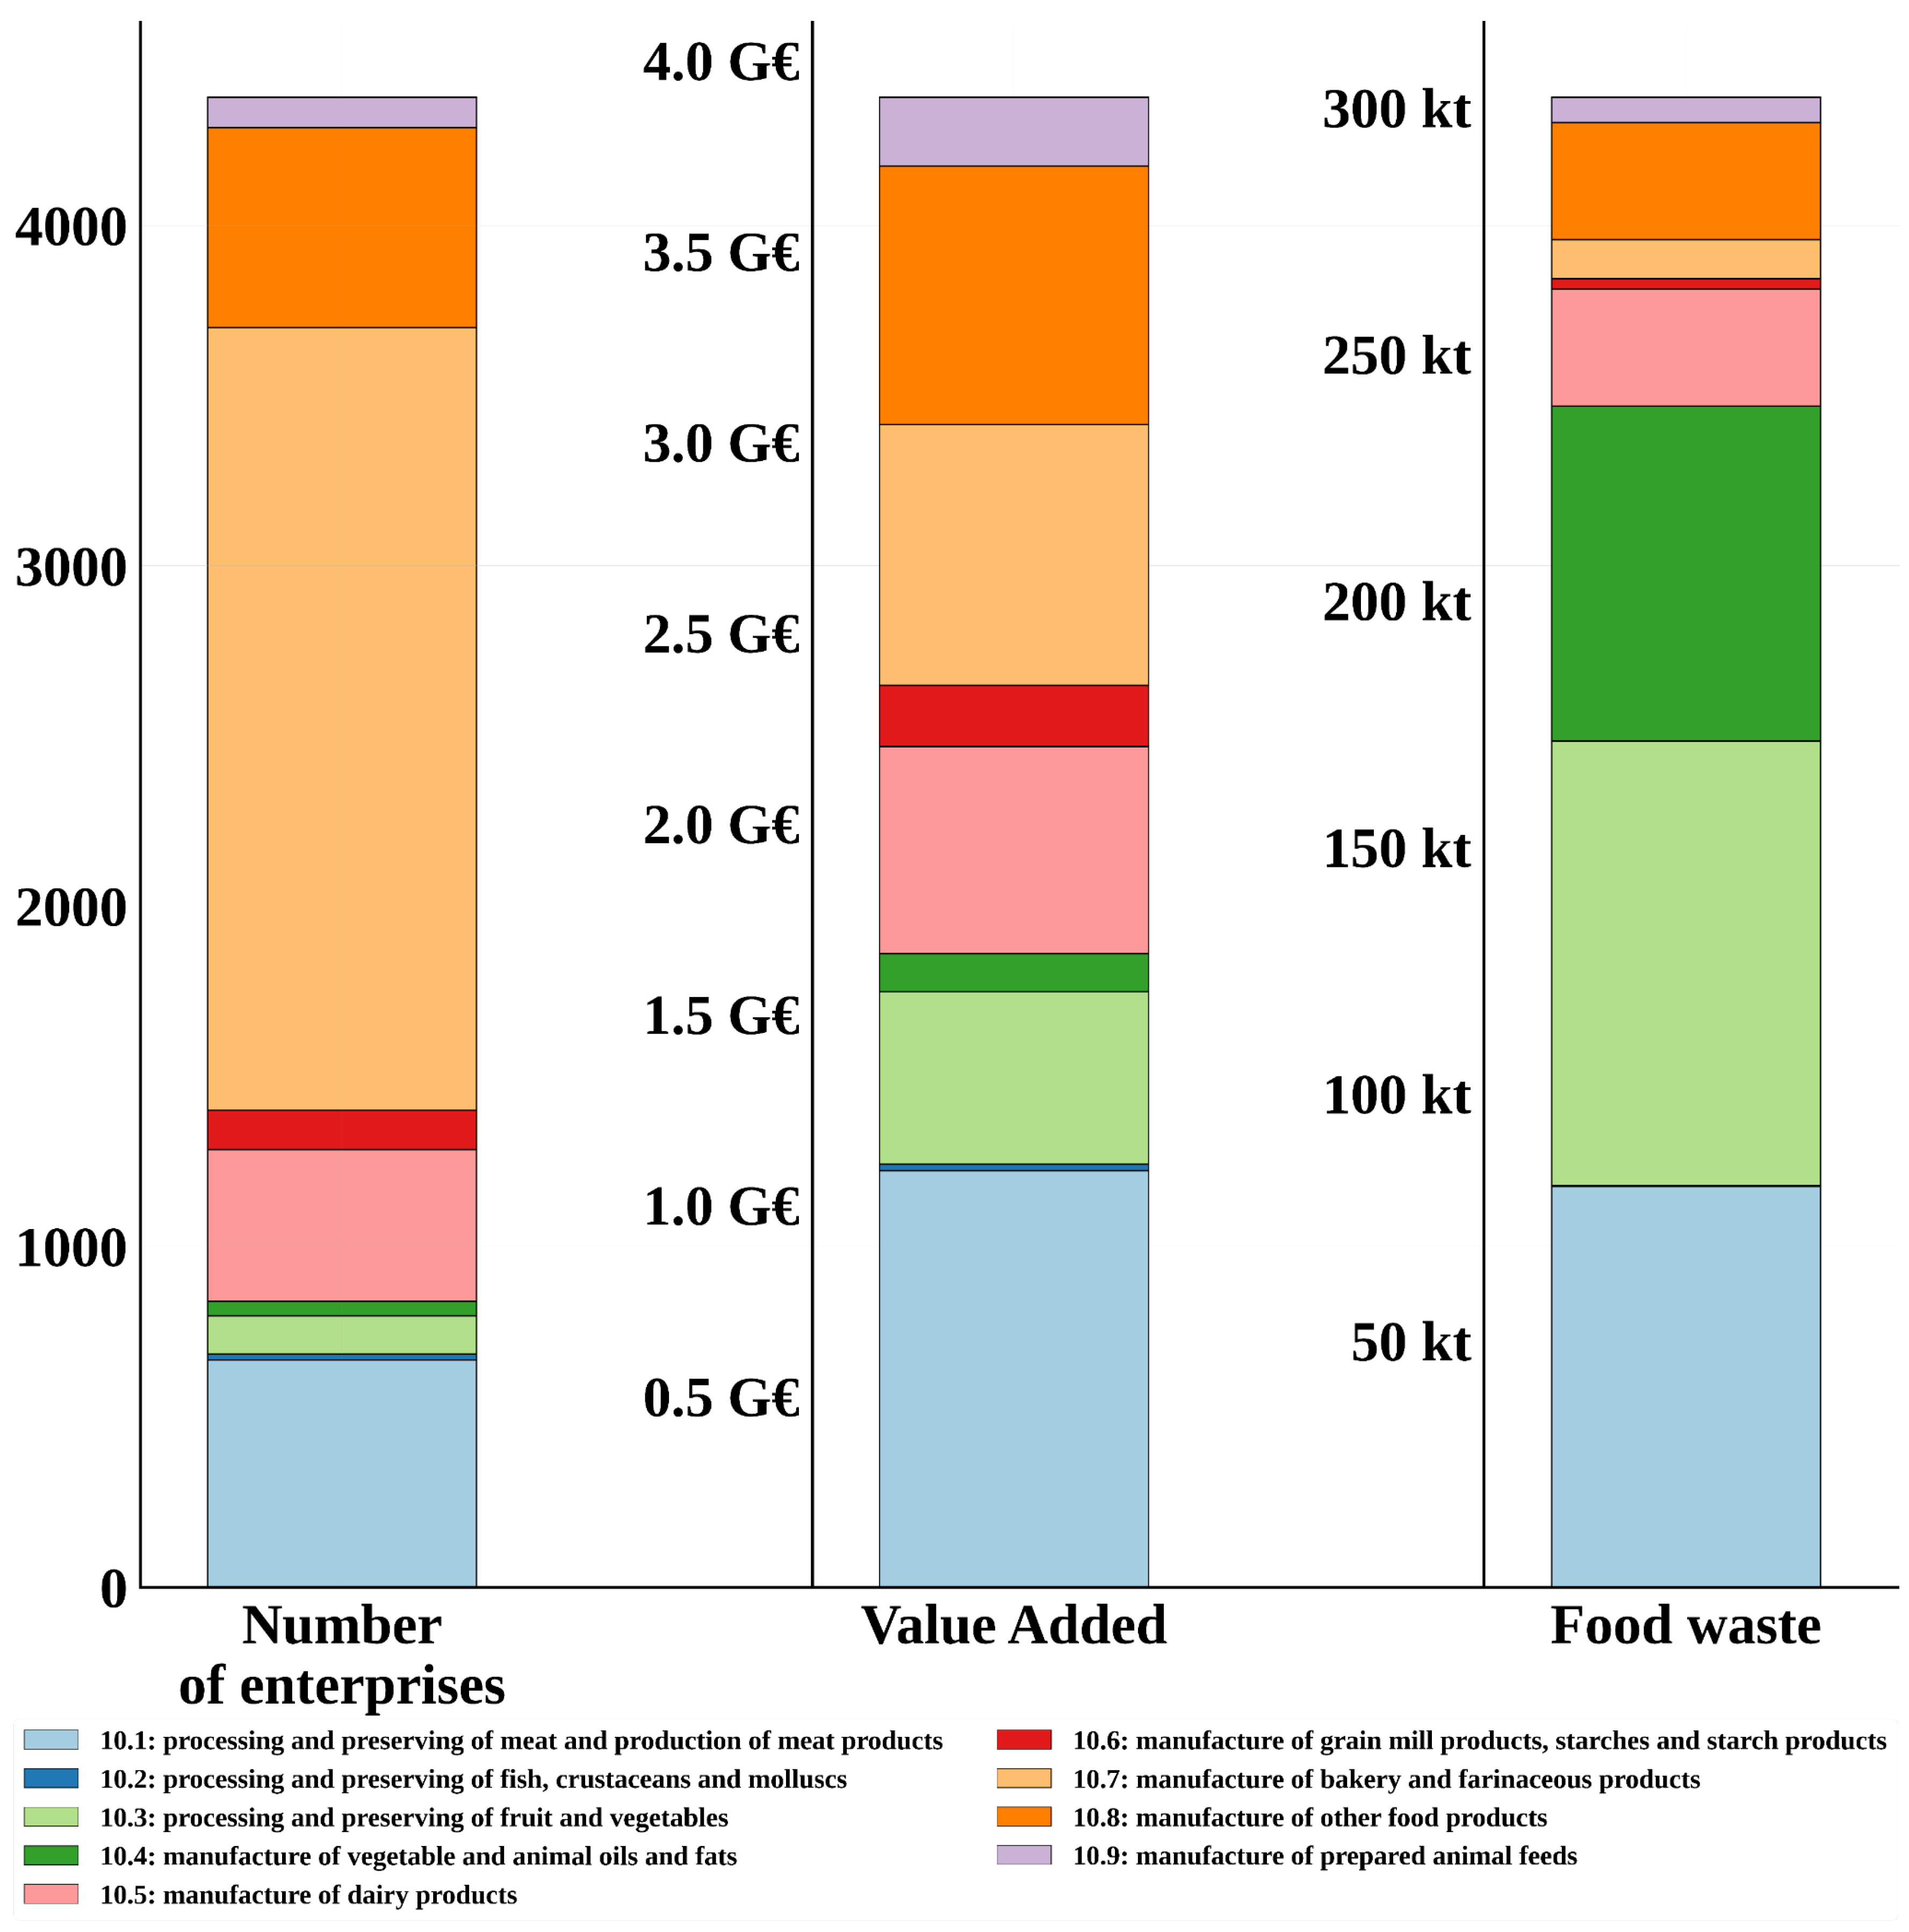
A comparative analysis of the selected indicators is reported in Figure 8: despite accounting for a limited number of companies, the value added of NACE group 10.1 is in the order of 1 G€ in 2017, ranking as the highest in Emilia-Romagna. NACE groups 10.3 and 10.4 are characterized by a low number of enterprises and value added around 0.55 G€; however their cumulative contribution is in the order of 50% of the total waste production within the food industry.
Although the meat industry (10.1) demonstrates a relatively higher value added compared to the fruit and vegetable (10.3) and oil and fat (10.4) industries, its waste production needs attention in order to properly manage significant waste streams.
NACE group 10.7 stands out for having the highest number of enterprises among all groups; however, its contribution to food waste production is less than 3% in the region.
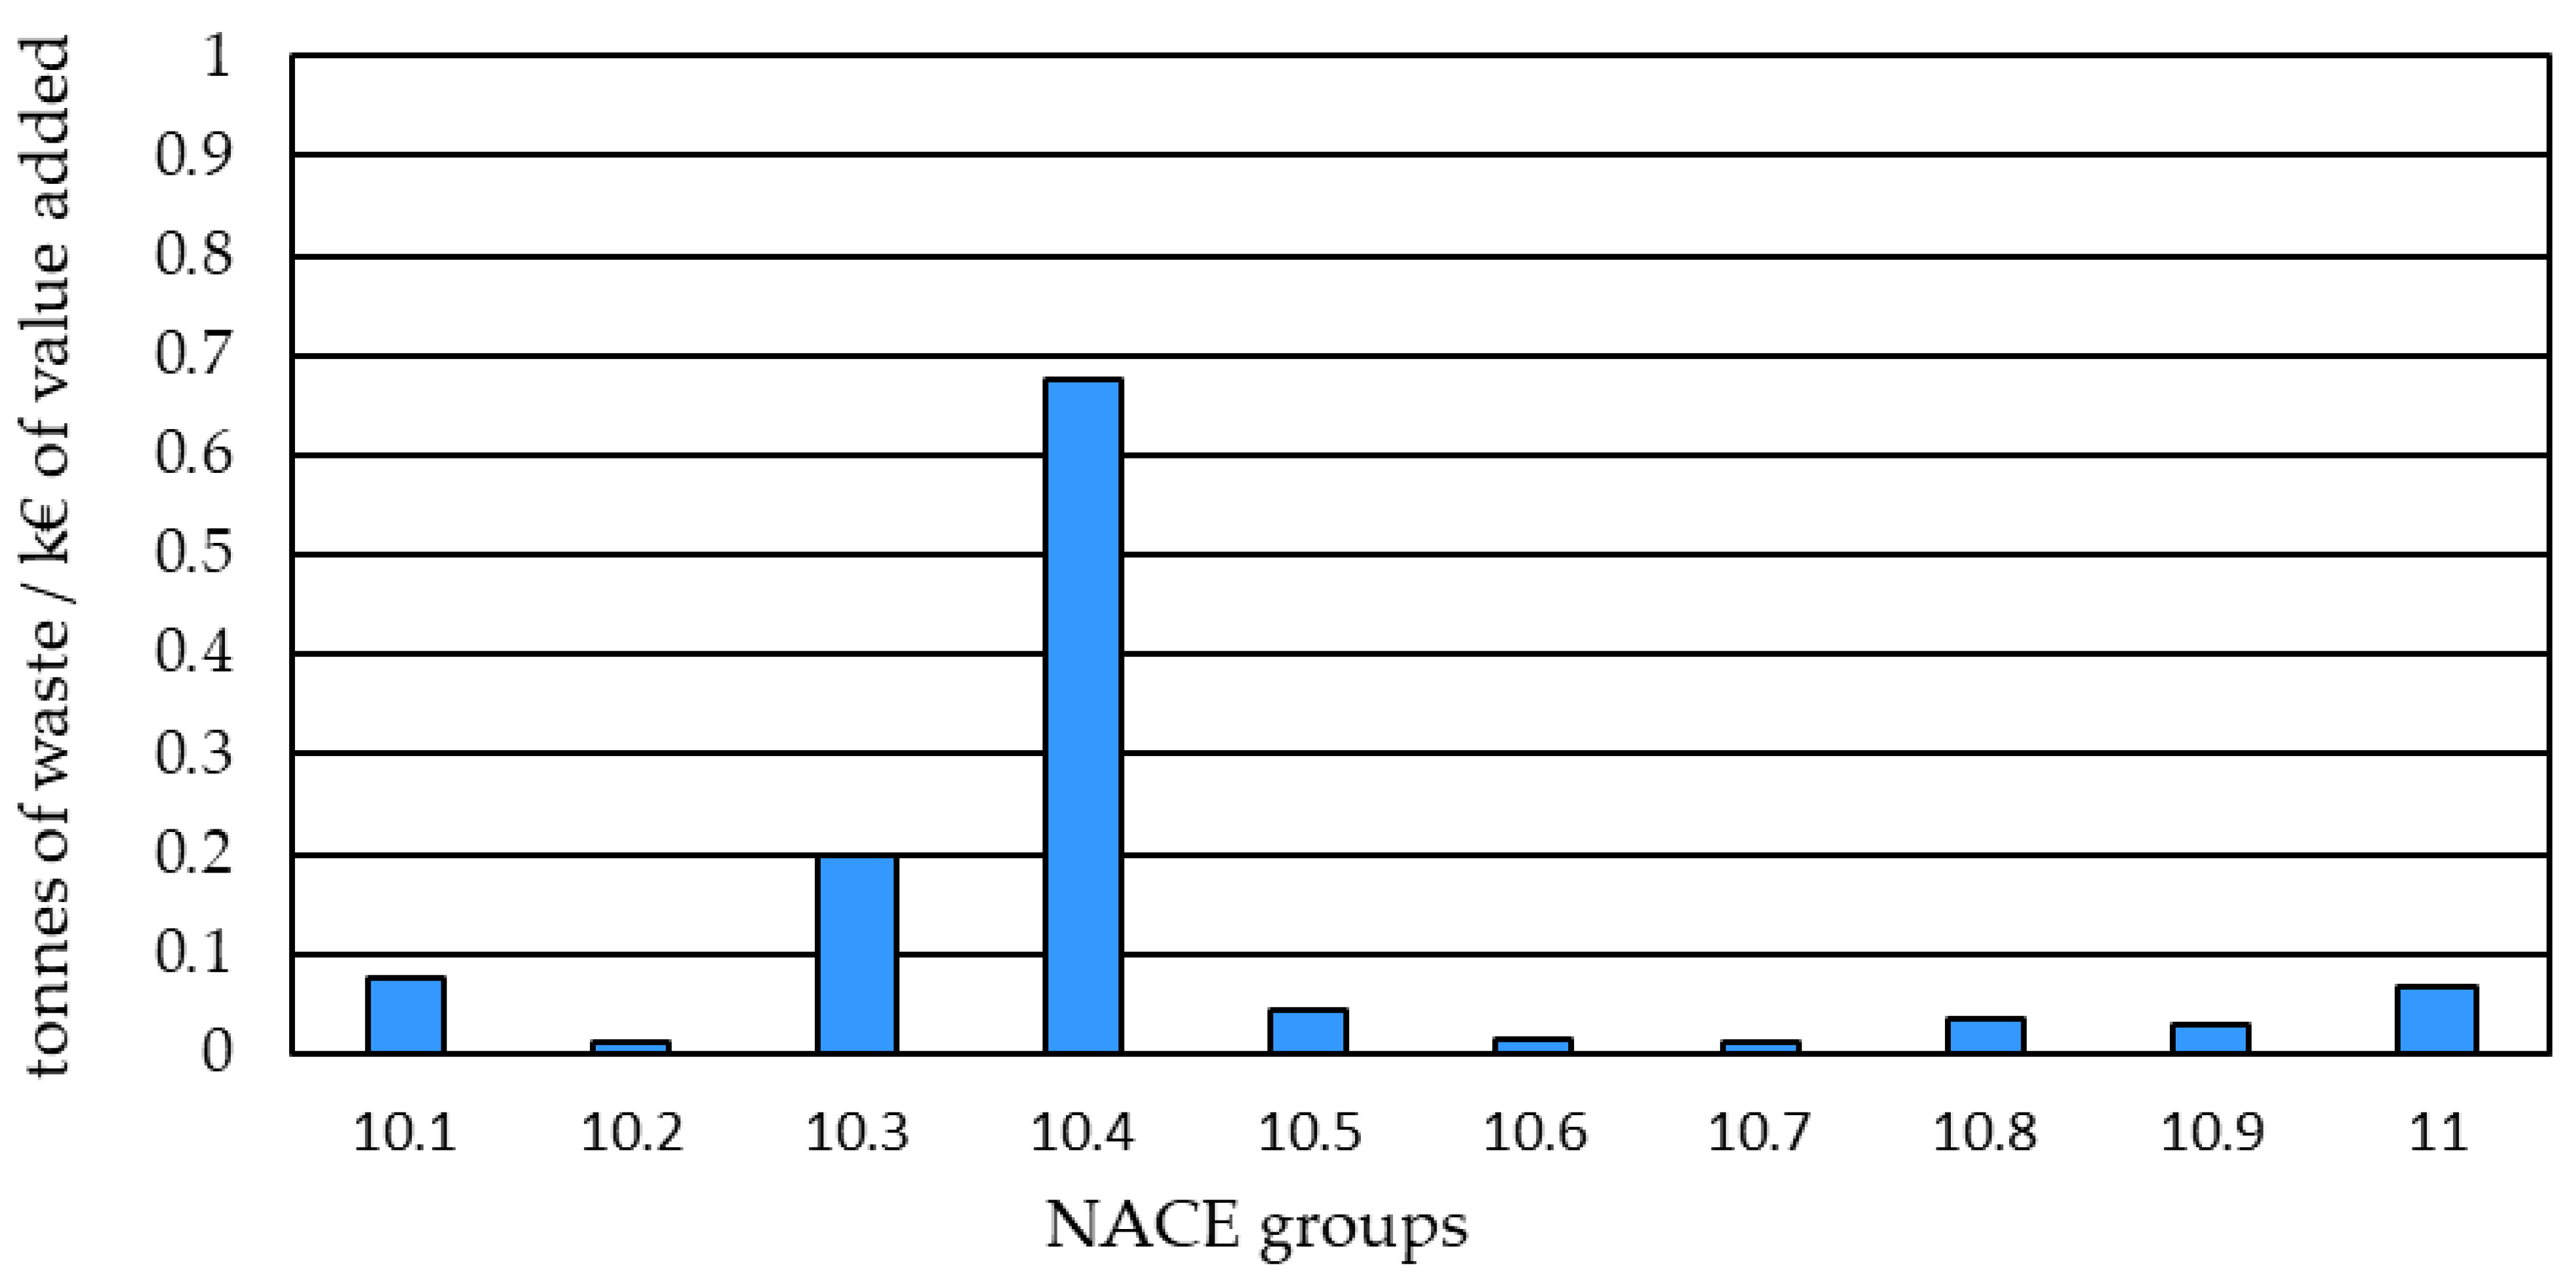
Considering their value added, NACE groups 10.3 and 10.4 are among the lowest in the ranking, highlighting the importance of improving waste management in these sectors.
Figure 9 reports the specific waste production per unit of value added. The data shows relevant values of this indicator for NACE groups 10.3 and 10.4, which are therefore characterized by a significant specific production of organic waste affecting the value chain.

4. Results and Discussion

4.1. Selection of Industrial Food Waste Streams of Interest

Based on the considerations from Section 3.4, a more detailed analysis of NACE 10.1, 10.3, and 10.4 was carried out and is reported in Appendix A (see Table A6) with a perspective on the geographical food waste distribution in the region.
A summary of relevant streams based on the selected EWC is reported in Table 4: food waste streams were grouped into two main categories, solid waste and sludges, with a total amount per year equal to more than 93 kt. The annual flow rate can be assumed for the design of suitable valorization pathways (see Section 4.2).
A literature review was conducted on food waste streams to identify a range of compositions expressed in terms of solid fraction (broken down into ashes, lipids, proteins, and carbohydrates) and moisture. The results reported in Table 5 show the high moisture content for all the selected streams; meanwhile, lipids and proteins attain significant fractions in SHSW.
For slaughterhouse waste, the composition from Hejnfelt et al. [25] refers to data concerning untreated mixed pork waste from the European area. Regarding SHSW streams, data from Palatsi et al. [27] are quite different when compared to the other sources, while Miramontes-Martínez et al. [22] and Handous et al. [26] refer to waste streams coming, respectively, from New Mexico and Tunisia. Data from Hejnfelt et al. [25] and Cuetos et al. [28] refer to studies performed in Denmark and Spain.
For the SHS stream, ref. [26] refers to non-European areas. The remaining two sources refer to studies on streams coming, respectively, from Spain [27] and Finland [29].
For fruit and vegetable waste streams, no literature sources referring to the European zone have been found. For FVS, only one source was identified [24]. The analysis of FVSW reports on the work from Zhao et al. [23] with a composition quite different from the one recorded in Edwiges et al. [21] and Miramontes-Martínez et al. [22].
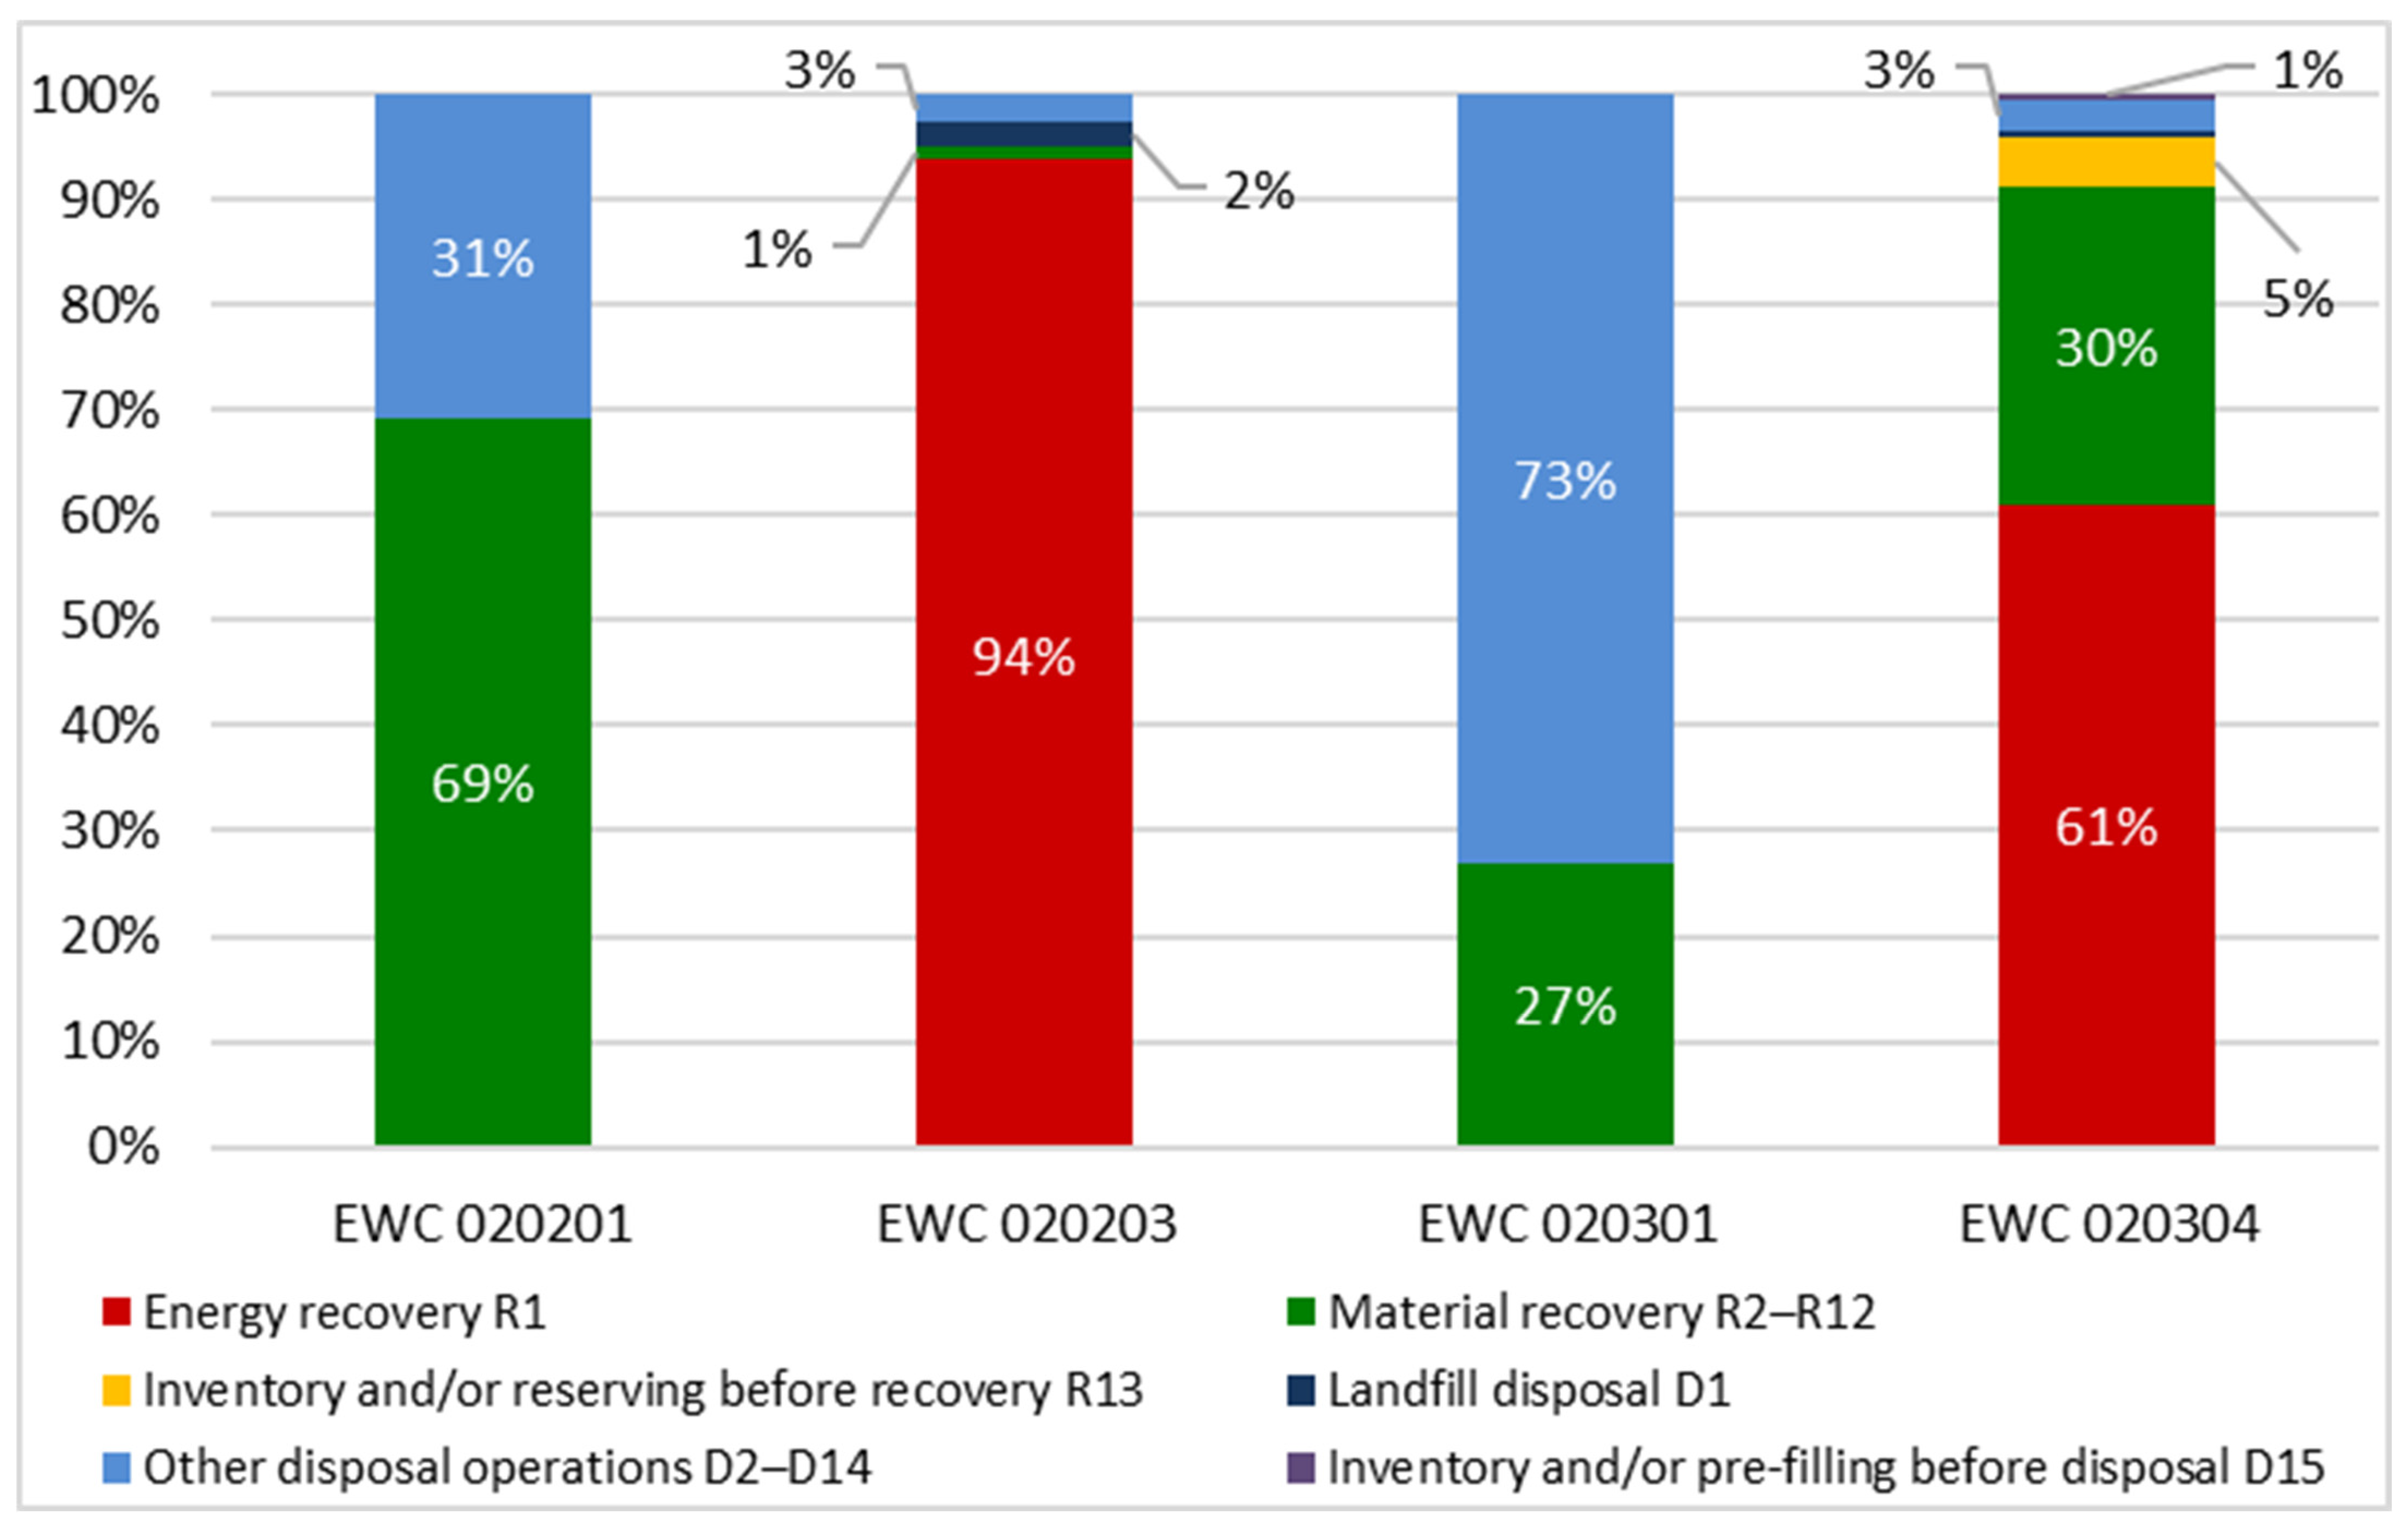
Paving the way for the design of alternative valorization strategies for the selected streams, an analysis of current waste management pathways is reported in Figure 10, showing how the different wastes, classified by the respective EWC code, were processed in 2019. The distribution of waste management options shown in Figure 10 was derived from official data provided by ARPAE [15].
For each selected EWC code (020201, 020203, 020301, 020304), ARPAE reports the amounts annually directed to the different management operations (R1, R2–R12, R13, D1, D2–D14, D15) according to Directive 2008/98/EC. The percentages shown in the figure correspond to the share of each operation with respect to the total amount of waste recorded under that EWC code in Emilia-Romagna in 2019. For example, the 69% of EWC 020201 (slaughterhouse sludges) reported as material recovery (R2-R12) corresponds to the fraction officially recorded by ARPAE as sent to composting or anaerobic digestion.
As highlighted in Figure 10, sludge streams (EWC 020201 included in SHS and EWC 020301 from FVS) are sent to disposal operations or to material recovery processes, among which composting and anaerobic digestion are included.
Solid waste from slaughterhouses (EWC 020203—SHSW) are mainly directed to energy recovery processes and solid waste from food and vegetable processing (EWC 020304—FVSW) to energy and material recovery processes. It is worth noting that currently, direct disposal (D1) is almost a negligible option for all these waste streams.
Within this perspective, the alternative food waste process described in Section 4.2 results in the production of biomethane and hydrochar; therefore, it may be considered a high-value-recovery operation with reference to the waste hierarchy (Directive 2008/98/EC); thus, it may be considered a proper alternative to disposal operations but also to energy recovery operations, due to the high waste moisture content. Indeed, this novel process can offer an interesting option for the conventional AD process thanks to the possible beneficial effects from the integration with HTC and a higher-level recovery solution compared to composting thanks to the generation of biomethane and hydrochar.

4.2. Conceptual Design of Integrated Waste-to-Value Process

The proposed process combines anaerobic digestion (AD) and hydrothermal carbonization to enhance biogas production. The produced hydrochar is partially burnt to satisfy the HTC thermal demand. The wet AD process features solid food waste and water recycled from HTC, with a total solid content of about 12% and an AD temperature of 55 °C. After filtration to control water content, the solid-rich stream is mixed with food industry sludges and pressurized up to roughly 35 bar before entering the HTC unit. Food sludges are assumed to be treated into previous digestion units at source; therefore secondary treatment is only performed in HTC.
In HTC, pre-heating at 150 °C is carried out with circulating water; the mixture is then heated up to 210 °C with diathermic oil from a furnace fed with hydrochar from the HTC process. The cooling section of the HTC unit is operated with water with pressurized water (25 bar) used for the aforementioned pre-heating stage. The mixture is finally cooled with cooling water down to 35 °C. After separation and filtration by means of a filter press, a liquid fraction and the solid hydrochar are recovered. The liquid is returned to the digester, while part of the hydrochar is used in the furnace to support HTC energy demand. The gaseous output from HTC has to be processed through adequate treatment strategies which may involve acid/alkaline baths or adsorption, depending on the stream composition.
The process requires a biogas upgrading unit, where biogas from the digester is directed by a fan. Biogas is cooled to 25 °C to remove water, while an activated carbon bed removes H2S. The gas stream mainly composed of biomethane and CO2 is compressed to 15 bar and purified to over 98% CH4 through membrane separation. The resulting biomethane is then pressurized, achieving 70 bar to meet national gas grid standards.
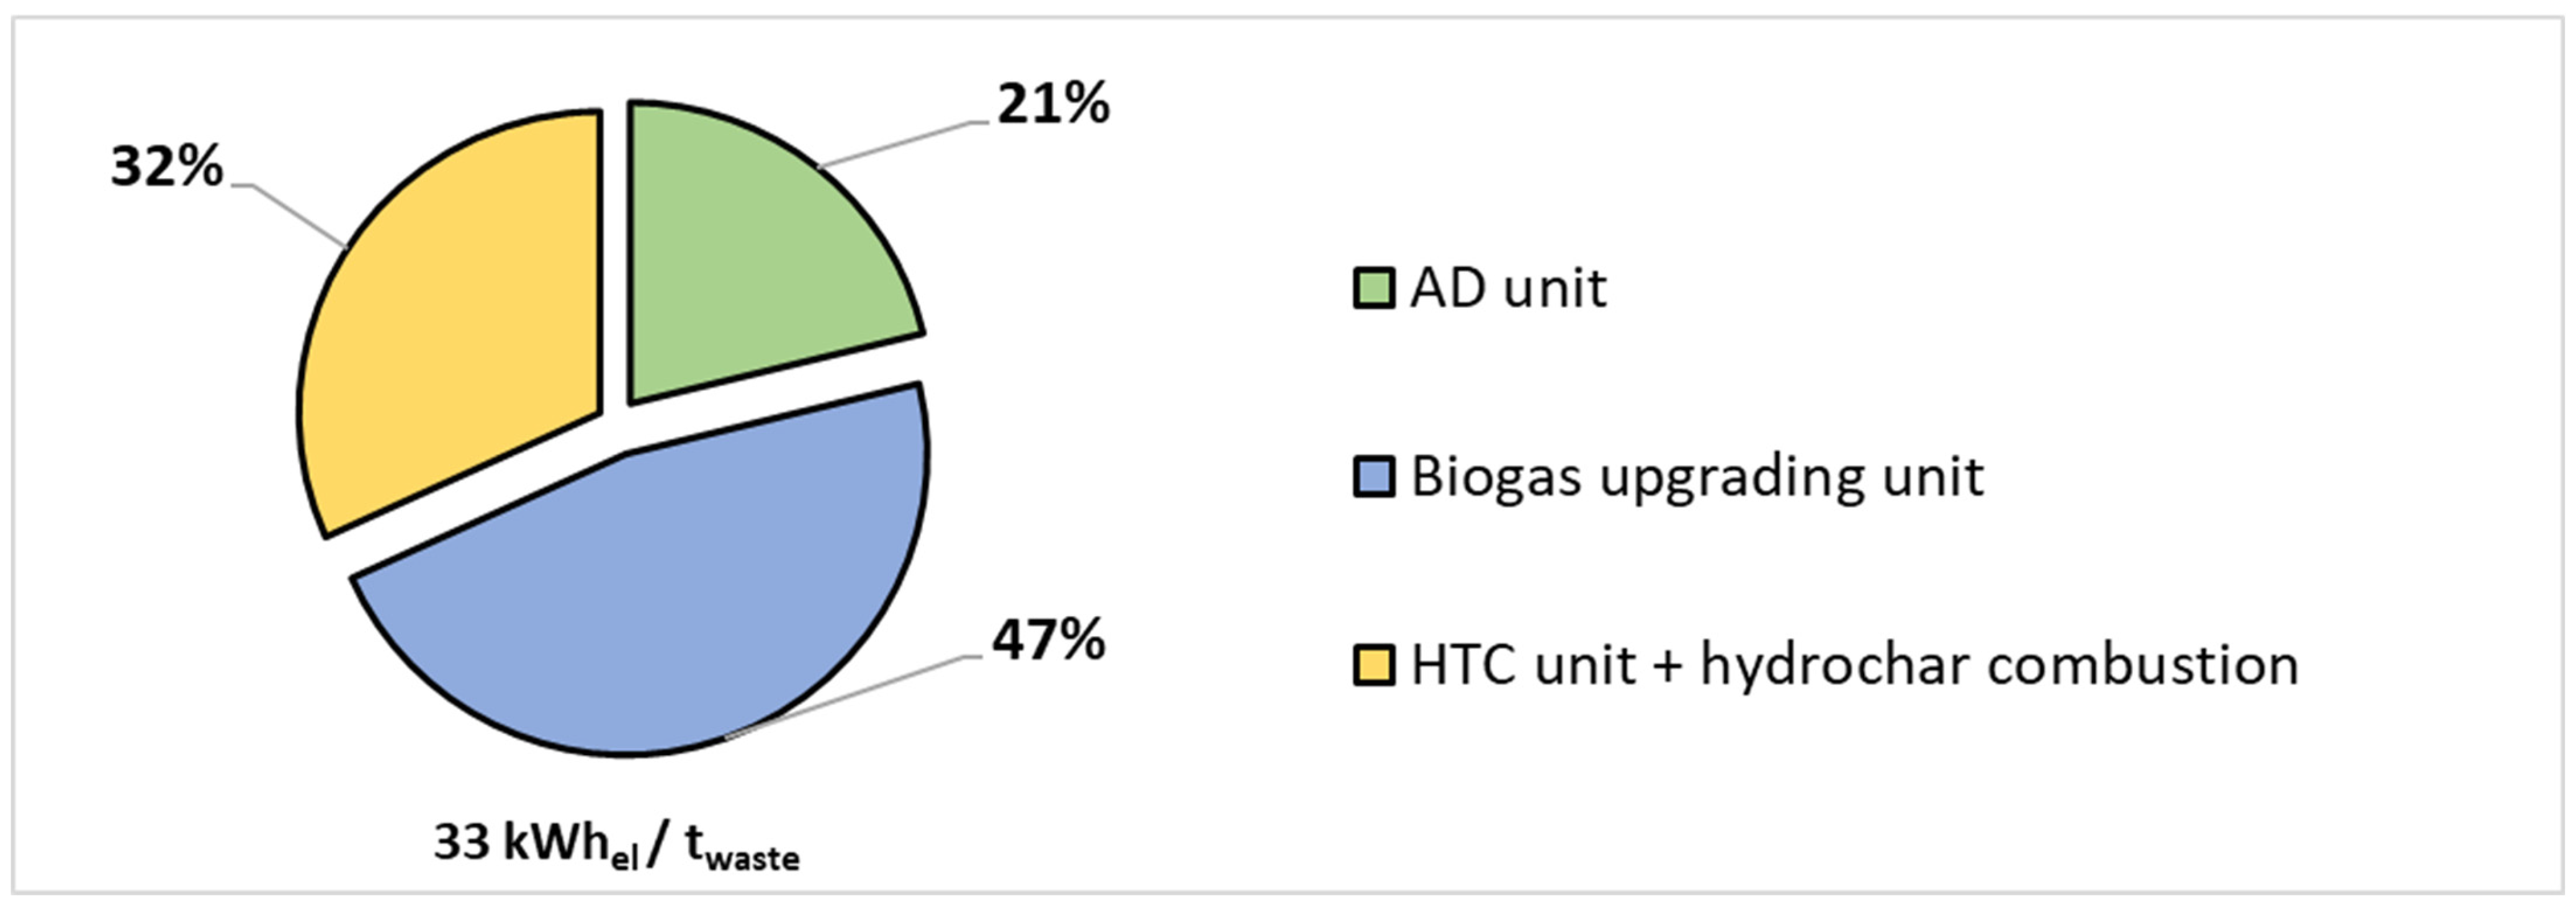
A preliminary evaluation of the process performance is reported in Table 6 where indicators of mass and energy balance are included. The evaluation provides the first quantitative estimation of the material recovery and electric specific energy consumption of the process, based on the assumptions reported in Section 2.2. The analysis shows a biomethane potential in the order of 0.2 Nm3/kgVS (volatile solid—VS), with an overall electric consumption of 33 kWhel/t of input waste broken down as from Figure 11. The electric demand is mainly due to the upgrading unit needed to separate biomethane for network injection (pressure in the order of 70 bar).
A dedicated process flow diagram is shown in Figure 12, highlighting the main process sections, material recirculation, and energy integration strategies. Future work will be based on process simulation activities and the definition of a techno-economic assessment [30,31] for a more accurate evaluation of the process performance, comparing the alternative approach to benchmark technologies such as conventional energy recovery from waste.

5. Conclusions

Emilia-Romagna accounts for 13.39% of Italy’s total food and beverage industrial waste, second only to Lombardy, and contributes 3.26% to the total industrial waste production at the national level.
This study provides a perspective on Emilia-Romagna’s food and beverage waste production focusing on selected streams with residual organic content (plastic streams or metal fractions, hazardous waste, or waste from chemical treatments and other streams are not included in the analysis), which may be suitable for novel valorization routes. The screening is based on selected indicators such as the number of companies, their value added, and the recorded waste production from NACE 10 and 11.
Detailed sectoral analysis reveals that the meat processing industry (NACE 10.1) is the largest contributor in terms of economic value, with over EUR 1 billion in value added recorded in 2017. Other relevant contributors include fruit and vegetable processing (NACE 10.3) and the manufacture of vegetable and animal oils and fats (NACE 10.4), which collectively cover almost 50% of the region’s selected industrial food and beverage waste streams. NACE 10.1, 10.3, and 10.4 account for more than 75% of the regional industrial food and beverage waste produced with respect to the reference year 2019. Moreover, the analysis of the specific waste generation per unit of value added underscores the interest in sectors 10.3 and 10.4, which may benefit advanced waste management strategies.
Therefore, the industrial food waste produced by the identified sectors (i.e., NACE 10.1, 10.3, and 10.4) was further characterized based on its EWC and sorted into two main groups—solid waste and sludges—amounting to over 93 kt per year, suitable for further recovery processes. Assuming a constant availability of the selected fluxes on annual basis, this provides the first specification for the design of a novel valorization pathway aiming at supporting biomethane production in Italy. Hence, a conceptual integrated waste-to-value process combining anaerobic digestion and hydrothermal carbonization is proposed to optimize biogas production while maximizing carbon recovery through hydrochar production. This approach offers a new option for the identified waste streams within a circular economy perspective.
Further investigation is necessary, focusing on process simulation and the definition of a techno-economic assessment in order to properly characterize the here-defined alternative valorization process, estimating yields and energy performance.

Author Contributions

Conceptualization, A.C., S.A., D.S. and D.D.B.; methodology, A.C. and D.D.B.; software, S.A.; validation, A.C., D.S. and D.D.B.; formal analysis, S.A.; investigation, A.C., S.A., D.S. and D.D.B.; resources, D.D.B.; data curation, S.A. and D.S.; writing—original draft preparation, A.C. and D.S.; writing—review and editing, A.C., D.S. and D.D.B.; visualization, S.A.; supervision, A.C., D.S. and D.D.B.; project administration, D.D.B.; funding acquisition, D.D.B. All authors have read and agreed to the published version of the manuscript.

Funding

This research was funded under the National Recovery and Resilience Plan (NRRP), Mission 4 Component 2 Investment 1.5—Call for tender No. 3277 of 30/12/2021 of Italian Ministry of University and Research funded by the European Union—NextGenerationEU. Award Number: Project code ECS00000033, Concession Decree No. 1052 of 23/06/2022 adopted by the Italian Ministry of University and Research—Ecosystem for Sustainable Transition in Emilia-Romagna‖ (Ecosister).

Data Availability Statement

Data are contained within the article.

Acknowledgments

During the preparation of this manuscript, AI was used for the review of the English language with reference to selected sentences under the supervision of the authors. No new content was generated by AI. The authors have reviewed and edited the output and take full responsibility for the content of this publication.

Conflicts of Interest

The authors declare no conflicts of interest.

Abbreviations

The following abbreviations are used in this manuscript:
ADAnaerobic digestion
ARPAEAgenzia regionale per la prevenzione, l’ambiente e l’energia Emilia-Romagna
ASIAArchivio statistico delle imprese attive
BOBologna
EWCEuropean Waste Catalogue
FAOFood and Agricultural Organization
FCForlì-Cesena
FEFerrara
FVSFruit and vegetable sludges
FVSWFruit and vegetable solid waste
HTCHydrothermal carbonization
ISPRAIstituto superiore per la protezione e la ricerca ambientale
ISTATIstituto nazionale di statistica
MOModena
NACEStatistical classification of economic activities in the European Community
PCPiacenza
PRParma
RARavenna
REReggio Emilia
RNRimini
SHSSlaughterhouse sludges
SHSWSlaughterhouse solid waste
TSTotal solid
VSVolatile solid

Appendix A

Table A1. Food industry enterprise distribution among all provinces in Emilia-Romagna region divided based on NACE 10 groups. Data from ISTAT [20] (Dataset size: 4377 elements). The highest value for each group has been highlighted in bold.
ProvinceNACE 10NACE 10 Groups
10.110.210.310.410.510.610.710.810.9
Bologna61629216325114201046
Ferrara30417313019231255
Forlì Cesena393253979172634713
Modena7761331145611439114314
Parma8723555196219171776113
Piacenza2433211122410126316
Ravenna361140163411258496
Reggio Emilia5305008397142696524
Rimini282132714412165632
Total43776681711343444115230058889
Table A2. Beverage industry enterprise distribution among all provinces in Emilia-Romagna divided based on NACE 11 groups. Data from ISTAT [20] (Dataset size: 165 elements). The highest value for each group has been highlighted in bold.
ProvinceNACE 11NACE 11 Groups
11.0111.0211.0311.0411.0511.0611.07
Bologna2931600901
Ferrara82300300
Forlì Cesena91500300
Modena29121201301
Parma154501500
Piacenza1611300200
Ravenna2441800200
Reggio Emilia2621700403
Rimini95000202
Total1653489023307
Table A3. Food industry waste production in 2019 for each of the Emilia-Romagna provinces divided based on NACE 10 groups. Data from ARPAE [15] (Dataset size: 152 elements). The highest value for each group has been highlighted in bold.
ProvinceWaste Production NACE 10 [t/y]NACE 10 Groups [t/y]
10.110.210.310.410.510.610.710.810.9
Bologna20,402984-11,981-539612431798-
Forlì Cesena34,79325,561-383915433251104183880
Ferrara18,067797-16,556--69600-45
Modena32,59017,347--35277399131983312686
Piacenza16,800548-11,796-4046227-1776
Parma100,92623,13410937,94620,9106141169426227955414
Ravenna68,07612,237-759846,213-818738365
Reggio Emilia890345068-6395334811262331045
Rimini15781045455---32982-
Total302,12881,16218290,17267,95223,7232130792523,7425141
Table A4. Beverage industry enterprise waste production in 2019 for each of the Emilia-Romagna provinces divided based on NACE 11 groups. Data from ARPAE [15] (Dataset size: 33 elements). The highest value for each group has been highlighted in bold.
ProvinceWaste Production NACE 11 [t/y]NACE 11 Groups [t/y]
11.0111.0211.0311.0411.0511.0611.07
Bologna309813308500000
Forlì Cesena42000420000000
Ferrara6565000000
Modena2711537217300000
Piacenza00000000
Parma12115080011101042
Ravenna56344112200000
Reggio Emilia24210242100000
Rimini1500000015
Total14,284110712,0090011101057
Table A5. Value added of food and beverage industry sectors for year 2017 in Emilia-Romagna [11].
NACE CodeValue Added [k€]
10.manufacture of food products. 3,903,329
10.1.processing and preserving of meat and production of meat products.1,089,942
10.2.processing and preserving of fish, crustaceans, and mollusks. 16,945
10.3.processing and preserving of fruit and vegetables. 452,546
10.4.manufacture of vegetable and animal oils and fats. 100,393
10.5.manufacture of dairy products.541,288
10.6.manufacture of grain mill products, starches, and starch products.161,263
10.7.manufacture of bakery and farinaceous products.683,122
10.8.manufacture of other food products.676,857
10.9.manufacture of prepared animal feeds.180,972
11.manufacture of beverages. 209,551
Table A6. NACE codes and classes, EWC, and waste streams per province. Breakdown sections for each group have been highlighted in bold. Source [15].
NACE Code and Relative Classes
10.1—Processing and preserving of meat and production of meat products
      10.11.00. Processing and preserving of meat (excluding poultry meat);
      10.12.00. Processing and preserving of poultry meat;
      10.13.00. Production of meat and poultry meat products.
10.3—Processing and preserving of fruit and vegetables
      10.31.00. Processing and preserving of potatoes;
      10.32.00. Manufacture of fruit and vegetable juice;
      10.39.00. Other processing and preserving of fruit and vegetables.
10.4—Manufacture of vegetable and animal oils and fats
      10.41.00. Production of oils and fats;
      10.41.10. Production of olive oil from predominantly non-self-produced olives;
      10.41.20. Production of refined or crude oil from oilseeds or oil fruits, primarily not self-produced;
      10.41.30. Production of crude or refined animal oils and fats;
      10.42.00. Manufacture of margarine and similar edible fats.
NACE CodeEWC—DescriptionTotal
(t/y)
Provinces
BOFCMOPCPRRARERNFE
10.11.00020201—sludges from washing and cleaning 885310584331300170631040
020203—materials unsuitable for consumption or processing41200004110000
Total for 10.11.009265105843313004280631040
10.13.00020201—sludges from washing and cleaning281214501468451095283100
020202—animal-tissue waste10700001070000
020203—materials unsuitable for consumption or processing994003309600000
Total for 10.13.00391314501501452163283100
10.3X.00020304—materials unsuitable for consumption or processing1721000611506800497
10.31.00020304—materials unsuitable for consumption or processing4286428600000000
10.32.00020301—sludges from washing, cleaning, peeling, centrifuging and separation490000049000
020304—materials unsuitable for consumption or processing3741230004573261000
Total for 10.32.003790230004573310000
10.39.00020301—sludges from washing, cleaning, peeling, centrifuging and separation10189462600450000
020304—materials unsuitable for consumption or processing12,231624159054510,184189045576
Total for 10.39.0013,2491570185054510,229189045576
10.41.10020301—sludges from washing, cleaning, peeling, centrifuging and separation485043004410000
020304—materials unsuitable for consumption or processing4000040000
Total for 10.41.10489043004460000
10.41.20020304—materials unsuitable for consumption or processing36,1320000036,132000
10.41.30020201—sludges from washing and cleaning 967700009502017500
020203—materials unsuitable for consumption or processing10,747000010,7470000
Total for 10.41.3020,424 20,249 175
10.42.00020304—materials unsuitable for consumption or processing21500002150000

References

  1. Tsegaye, B.; Jaiswal, S.; Jaiswal, A.K. Food Waste Biorefinery: Pathway towards Circular Bioeconomy. Foods 2021, 10, 1174. [Google Scholar] [CrossRef] [PubMed]
  2. Food and Agriculture Organization of the United Nations (FAO). Global Food Losses and Food Waste—Extent, Causes and Prevention; Food and Agriculture Organization of the United Nations (FAO): Rome, Italy, 2011. [Google Scholar]
  3. Caldeira, C.; Vlysidis, A.; Fiore, G.; De Laurentiis, V.; Vignali, G.; Sala, S. Sustainability of food waste biorefinery: A review on valorisation pathways, techno-economic constraints, and environmental assessment. Bioresour. Technol. 2020, 312, 123575. [Google Scholar] [CrossRef] [PubMed]
  4. Bastidas-Oyanedel, J.-R.; Schmidt, J.E. (Eds.) Biorefinery; Springer International Publishing: Cham, Switzerland, 2019. [Google Scholar] [CrossRef]
  5. European Commission. Communication from the Commission to the European Parliament, the Council, the European Economic and Social Committee and the Committee of the Regions: A Sustainable Bioeconomy for Europe: Strengthening the Connection Between Economy, Society and the Environment; European Commission: Brussels, Belgium, 2018. [Google Scholar]
  6. European Commission. Communication from the Commission to the European Parliament, the Council, the European Economic and Social Committee and the Committee of the Regions: A New Circular Economy Action Plan For a Cleaner and More Competitive Europe; European Commission: Brussels, Belgium, 2020. [Google Scholar]
  7. Guidehouse and European Biogas Association (EBA). Biogases Towards 2040 and Beyond—A Realistic and Resilient Path to Climate Neutrality; Guidehouse and European Biogas Association (EBA): Brussels, Belgium, 2024. [Google Scholar]
  8. European Commission. Commission Staff Working Document—Implementing the REPowerEU Action Plan: Investment Needs, Hydrogen Accelerator and Achieving the Bio-Methane Targets; European Commission: Brussels, Belgium, 2022. [Google Scholar]
  9. Bataglia, L.; Conversano, A.; Di Bona, D.; Sogni, D.; Voccia, D.; Mazzoni, E.; Lamastra, L. Recent Developments, Challenges, and Environmental Benefits of Using Hermetia illucens for Bioenergy Production Within a Circular Economy Approach. Energies 2025, 18, 2826. [Google Scholar] [CrossRef]
  10. Conversano, A.; Zatti, M.; Sogni, D.; Consonni, S. Energy storage scenarios and design of a new Italian innovation infrastructure for energy transition. J. Phys. Conf. Ser. 2024, 2893, 012005. [Google Scholar] [CrossRef]
  11. Regione Emilia-Romagna e ART-ER—Attrattività Ricerca Territorio Emilia Romagna. Analisi del Sistema Agricolo, Agroindustriale e del Territorio Rurale dell’Emilia-Romagna; Regione Emilia-Romagna: Bologna, Italy, 2021; Available online: https://agricoltura.regione.emilia-romagna.it/pac-2023-2027/documenti/analisi-del-sistema/analisi-contesto.pdf (accessed on 23 September 2025).
  12. European Union. The European Parliament and the Council Directive 2008/98/EC of the European Parliament and of the Council on Waste and Repealing Certain Directives; European Union: Brussels, Belgium, 2008. [Google Scholar]
  13. Eurostat—European Commission. NACE Rev. 2—Statistical Classification of Economic Activities in the European Community; Eurostat—European Commission: Luxembourg, 2008; ISBN 978-92-79-04741-1. [Google Scholar]
  14. ISPRA—Istituto Superiore per la Protezione e la Ricerca Ambientale. Catasto Rifiuti—Sezione Nazionale. 2024. Available online: https://www.catasto-rifiuti.isprambiente.it (accessed on 11 December 2024).
  15. ARPAE—Agenzia Regionale per la Protezione Ambientale dell’Emilia Romagna. Rifiuti Speciali—Dataset. 2024. Available online: https://dati.arpae.it/dataset/rifiuti-speciali-per-comune (accessed on 11 December 2024).
  16. Official Journal of the European Communities. Commission Decision of 3 May 2000; European Union: Brussels, Belgium, 2008. [Google Scholar]
  17. ISTAT—Istituto Nazionale di Statistica. Glossario Statistico. Available online: https://www.istat.it/classificazioni-e-strumenti/glossario/ (accessed on 5 June 2025).
  18. Ischia, G.; Fiori, L. Hydrothermal Carbonization of Organic Waste and Biomass: A Review on Process, Reactor, and Plant Modeling. Waste Biomass Valorization 2021, 12, 2797–2824. [Google Scholar] [CrossRef]
  19. Wang, W.; Lee, D.-J. Valorization of anaerobic digestion digestate: A prospect review. Bioresour. Technol. 2021, 323, 124626. [Google Scholar] [CrossRef] [PubMed]
  20. ISTAT—Istituto Nazionale di Statistica Enterprises and Persons Employed. 2024. Available online: http://dati.istat.it/Index.aspx?QueryId=20771# (accessed on 11 December 2024).
  21. Edwiges, T.; Frare, L.; Mayer, B.; Lins, L.; Mi Triolo, J.; Flotats, X.; de Mendonça Costa, M.S.S. Influence of chemical composition on biochemical methane potential of fruit and vegetable waste. Waste Manag. 2018, 71, 618–625. [Google Scholar] [CrossRef] [PubMed]
  22. Miramontes-Martínez, L.R.; Rivas-García, P.; Albalate-Ramírez, A.; Botello-Álvarez, J.E.; Escamilla-Alvarado, C.; Gomez-Gonzalez, R.; Alcalá-Rodríguez, M.M.; Valencia-Vázquez, R.; Santos-López, I.A. Anaerobic co-digestion of fruit and vegetable waste: Synergy and process stability analysis. J. Air Waste Manag. Assoc. 2021, 71, 620–632. [Google Scholar] [CrossRef] [PubMed]
  23. Zhao, C.; Mu, H.; Zhao, Y.; Wang, L.; Zuo, B. Microbial characteristics analysis and kinetic studies on substrate composition to methane after microbial and nutritional regulation of fruit and vegetable wastes anaerobic digestion. Bioresour. Technol. 2018, 249, 315–321. [Google Scholar] [CrossRef] [PubMed]
  24. Nielfa, A.; Cano, R.; Pérez, A.; Fdez-Polanco, M. Co-digestion of municipal sewage sludge and solid waste: Modelling of carbohydrate, lipid and protein content influence. Waste Manag. Res. J. Sustain. Circ. Econ. 2015, 33, 241–249. [Google Scholar] [CrossRef] [PubMed]
  25. Hejnfelt, A.; Angelidaki, I. Anaerobic digestion of slaughterhouse by-products. Biomass Bioenergy 2009, 33, 1046–1054. [Google Scholar] [CrossRef]
  26. Handous, N.; Gannoun, H.; Hamdi, M.; Bouallagui, H. Two-Stage Anaerobic Digestion of Meat Processing Solid Wastes: Methane Potential Improvement with Wastewater Addition and Solid Substrate Fermentation. Waste Biomass Valorization 2019, 10, 131–142. [Google Scholar] [CrossRef]
  27. Palatsi, J.; Viñas, M.; Guivernau, M.; Fernandez, B.; Flotats, X. Anaerobic digestion of slaughterhouse waste: Main process limitations and microbial community interactions. Bioresour. Technol. 2011, 102, 2219–2227. [Google Scholar] [CrossRef] [PubMed]
  28. Cuetos, M.J.; Gómez, X.; Otero, M.; Morán, A. Anaerobic digestion of solid slaughterhouse waste (SHW) at laboratory scale: Influence of co-digestion with the organic fraction of municipal solid waste (OFMSW). Biochem. Eng. J. 2008, 40, 99–106. [Google Scholar] [CrossRef]
  29. Bayr, S. Biogas Production from Meat and Pulp and Paper Industry By-Products; University of Jyväskylä: Jyväskylä, Finland, 2014; Available online: https://jyx.jyu.fi/dspace/bitstream/handle/123456789/43316/978-951-39-5680-6_vaitos23052014.pdf?sequence=1 (accessed on 23 September 2025).
  30. Lombardelli, G.; Scaccabarozzi, R.; Conversano, A.; Gatti, M. Bio-methanol with negative CO2 emissions from residual forestry biomass gasification: Modelling and techno-economic assessment of different process configurations. Biomass Bioenergy 2024, 188, 107315. [Google Scholar] [CrossRef]
  31. Lombardelli, G.; Consonni, S.; Conversano, A.; Mureddu, M.; Pettinau, A.; Gatti, M. Process Design and Techno-Economic Assessment of biogenic CO 2 Hydrogenation-to-Methanol with innovative catalyst. J. Phys. Conf. Ser. 2022, 2385, 012038. [Google Scholar] [CrossRef]
Figure 1. A summary of the adopted screening methodology leading to the selection of relevant waste streams in Emilia-Romagna and the conceptual design of the integrated process.
Waste 03 00033 g001
Figure 2. Distribution of number of enterprises in food industry per province in Emilia-Romagna. Data from ISTAT [20].
Waste 03 00033 g002
Figure 3. Beverage industry groups, number of enterprises per province. Data from ISTAT [20].
Waste 03 00033 g003
Figure 4. (a) The food and beverage industry’s waste production contribution in terms of the total industrial waste production per region. (b) The food and beverage industry’s regional waste production over the total Italian food and beverage industry’s waste for each region.
Waste 03 00033 g004
Figure 5. A plot representative of the weight of industrial food and beverage waste production at the regional over national level vs. the fraction of the same waste over total industrial waste per region.
Waste 03 00033 g005
Figure 6. Food industry groups from NACE 10. Waste production per province [15].
Waste 03 00033 g006
Figure 7. Beverage industry groups from NACE 11. Waste production per province in Emilia-Romagna [15].
Waste 03 00033 g007
Figure 8. Food industry group comparison based on three different key indicators: number of companies, value added, and food waste in reference year.
Waste 03 00033 g008
Figure 9. Specific waste production per unit of value added.
Waste 03 00033 g009
Figure 10. Waste management for waste typologies EWC 020201, 020203, 020301, and 020304 in Emilia-Romagna in 2019 [15].
Waste 03 00033 g010
Figure 11. A preliminary breakdown of the specific electric consumption for the three process units (i.e., anaerobic digestion, biogas upgrading, and HTC).
Waste 03 00033 g011
Figure 12. Process flow diagram of proposed waste-to-value process.
Waste 03 00033 g012
Table 1. Divisions 10 and 11 from NACE section C (Manufacturing) considered within the present study to collect data from the food and beverage industry [13].
Section C—Manufacturing
Division 10—Manufacture of Food Products
GroupClassTitle
10.1Processing and preserving of meat and production of meat products
10.11Processing and preserving of meat
10.12Processing and preserving of poultry meat
10.13Production of meat and poultry meat products
10.2Processing and preserving of fish, crustaceans and mollusks
10.20Processing and preserving of fish, crustaceans and mollusks
10.3Processing and preserving of fruit and vegetables
10.31Processing and preserving of potatoes
10.32Manufacture of fruit and vegetable juice
10.39Other processing and preserving of fruit and vegetables
10.4Manufacture of vegetable and animal oils and fats
10.41Manufacture of oils and fats
10.42Manufacture of margarine and similar edible fats
10.5Manufacture of dairy products
10.51Operation of dairies and cheese making
10.52Manufacture of ice cream
10.6Manufacture of grain mill products, starches and starch products
10.61Manufacture of grain mill products
10.62Manufacture of starches and starch products
10.7Manufacture of bakery and farinaceous products
10.71Manufacture of bread; manufacture of fresh pastry goods and cakes
10.72Manufacture of rusks and biscuits; manufacture of preserved pastry goods and cakes
10.73Manufacture of macaroni, noodles, couscous and similar farinaceous products
10.8Manufacture of other food products
10.81Manufacture of sugar
10.82Manufacture of cocoa, chocolate and sugar confectionery
10.83Processing of tea and coffee
10.84Manufacture of condiments and seasonings
10.85Manufacture of prepared meals and dishes
10.86Manufacture of homogenized food preparations and dietetic food
10.89Manufacture of other food products not elsewhere classified
10.9Manufacture of prepared animal feeds
10.91Manufacture of prepared feeds for farm animals
10.92Manufacture of prepared pet foods
Division 11—Manufacture of beverages
GroupClassTitle
11.0Manufacture of beverages
11.01Distilling, rectifying and blending of spirits
11.02Manufacture of wine from grape
11.03Manufacture of cider and other fruit wines
11.04Manufacture of other non-distilled fermented beverages
11.05Manufacture of beer
11.06Manufacture of malt
11.07Manufacture of soft drinks; production of mineral waters and other bottled waters
Table 2. The assumptions adopted for the preliminary design of the integrated process for biomethane and hydrochar production, broken down for the three main sections (i.e., AD, upgrading, HTC).
Anaerobic Digestion (AD) Unit
%VS—Volatile solid mass percentage11%w
Specific biogas production from AD (i.e., kg of biogas per kg of AD inlet)0.043 kg/kg
Inlet AD moisture>87%w
Overall pump efficiency73%
Biogas upgrading unit
Specific electric consumption with reference to biogas production0.3 kWh/Nm3
HTC unit and hydrochar combustion unit
Specific electric consumption with reference to total inlet waste in the process11 kWhel/twaste
Table 3. National food and beverage and total industrial waste production per Italian region in 2019. Data from ISPRA [14].
RegionWaste Production in Food and Beverage Industries (t/y)Total Industrial Waste Production (t/y)Regional % of Food and Beverage Industrial Waste in Terms of Total Regional Industrial WasteRegional % of Industrial Waste Production for Food and Beverage Industry over National Industrial Food and Beverage Waste
Abruzzo120,2902,934,2864.10%3.57%
Basilicata31,5232,314,0391.36%0.94%
Calabria58,6502,212,0842.65%1.74%
Campania268,3708,436,7523.18%7.98%
Emilia-Romagna450,73913,832,6693.26%13.39%
Friuli Venezia Giulia58,3724,218,7351.38%1.73%
Lazio150,10610,164,4521.48%4.46%
Liguria65,3612,834,4082.31%1.94%
Lombardia583,02833,540,1681.74%17.33%
Marche82,2233,743,6962.20%2.44%
Molise1783601,7190.30%0.05%
Piemonte303,31311,896,8722.55%9.01%
Puglia204,12211,388,1621.79%6.07%
Sardegna68,7073,070,9482.24%2.04%
Sicilia182,2817,373,3072.47%5.42%
Toscana169,66110,086,8231.68%5.04%
Trentino Alto Adige89,3314,686,2831.91%2.65%
Umbria61,5533,001,2672.05%1.83%
Valle d’Aosta7444292,6392.54%0.22%
Veneto408,27717,345,0152.35%12.13%
Total3,365,134153,974,3242.19%100.00%
Table 4. Annual food waste production for NACE 10.1, 10.3, and 10.4 for four streams FVSW, FVS, SHSW, and SHS. ARPAE [15]. In bold, the total amount of waste selected for the study in t/y2019.
Stream IDEWC Code and DescriptionNACE CodeAmount
[t]
Total Amount
[t]
FVSW
Fruit and Vegetable Solid Waste
020304—materials unsuitable for consumption or processing10.3X.00172158,332
10.31.004286
10.32.003741
10.39.0012,231
10.41.104
10.41.2036,132
10.42.00215
FVS
Fruit and Vegetable Sludges
020301—sludges from washing, cleaning, peeling, centrifuging and separation10.32.00491552
10.39.001018
10.41.10485
SHSW
Slaughterhouse Solid Waste
020202—animal tissue
020203—materials unsuitable for consumption or processing
10.11.0041212,260
10.13.001101
10.41.3010,747
SHS
Slaughterhouse Sludges
020201—sludges from washing and cleaning10.11.00885321,342
10.13.002812
10.41.309677
Total (sludges + solid waste)93,486
Table 5. Literature analysis on waste composition (weight base) for the four selected streams in bold.
FVSW CompositionMoistureAshesLipidsProteinsCarbohydrates
Edwiges et al. [21]90.5%0.8%0.4%1.4%7.0%
Miramontes-Martínez et al. [22]89.1%0.8%0.6%0.7%8.8%
Zhao et al. [23]52.2%0.2%0.9%7.7%39.1%
FVS compositionMoistureAshesLipidsProteinsCarbohydrates
Nielfa et al. [24]92.8%1.5%0.2%3.3%2.2%
SHSW compositionMoistureAshesLipidsProteinsCarbohydrates
Miramontes-Martínez et al. [22]88.2%0.6%4.6%5.5%1.1%
Hejnfelt et al. [25] 73.1%3.7%5.5%17.2%0.6%
Handous et al. [26]74.5%5.0%5.6%14.5%0.4%
Palatsi et al. [27]47.3%0.6%43.2%6.5%2.4%
Palatsi et al. [27]62.5%0.8%24.9%7.0%4.8%
Cuetos et al. [28]71.7%2.3%10.5%10.1%5.4%
SHS compositionMoistureAshesLipidsProteinsCarbohydrates
Handous et al. [26]91.9%1.1%0.0%6.9%0.1%
Palatsi et al. [27]75.8%0.9%10.7%6.8%5.8%
Palatsi et al. [27]90.4%1.3%5.0%3.1%0.1%
Bayr [29]97.8%0.2%1.6%0.2%0.2%
Bayr [29]99.0%0.1%0.1%0.8%0.0%
Table 6. Preliminary mass and energy balance of integrated process for biomethane and hydrochar production from selected food waste streams. The main streams and indicators are reported in the two sections bold highlighted in bold.
StreamDescriptionValueUnit
1FVSW58,332t/y
2SHSW12,260t/y
5FVS1552t/y
6SHS21,342t/y
wasteTotal inlet waste (stream n.1 + 2 + 5 + 6)93,486t/y
IndicatorDescriptionValueUnit
BMPBiomethane potential0.233Nm3/kgVS(ADin)
YhydrocharNet hydrochar yield (i.e., hydrochar to storage)130kghydrochar/twaste
WelSpecific electric consumption33kWhel/twaste
Disclaimer/Publisher’s Note: The statements, opinions and data contained in all publications are solely those of the individual author(s) and contributor(s) and not of MDPI and/or the editor(s). MDPI and/or the editor(s) disclaim responsibility for any injury to people or property resulting from any ideas, methods, instructions or products referred to in the content.