Article

Influences of Management Practices and Methodological Choices on Life Cycle Assessment Results of Composting Mixtures of Biowaste and Green Cuts

Thünen-Institute of Agricultural Technology, Bundesallee 47, 38116 Brunswick, Germany
*
Author to whom correspondence should be addressed.
Waste 2023, 1(4), 919-934; https://doi.org/10.3390/waste1040053
Submission received: 9 October 2023 / Revised: 31 October 2023 / Accepted: 10 November 2023 / Published: 12 November 2023

Abstract

:
This paper presents an analysis that aimed to quantify the consequences of modelling choices in the life cycle assessment of composting by investigating the influence of composting management practices and the influence of the selected marginal product for substitution. In order to investigate the different influencing factors, a set of 11 scenarios were defined. The scenario results revealed that increasing the turning frequency of the input material leads to a Global warming potential (GWP) reduction of approx. 50%. However, there is a trade-off between GWP reduction and increases in other environmental impacts, including acidification potential (AP), ozone formation potential (OFP), and stratospheric ozone depletion potential (ODP). GWP and AP can also be reduced by optimal exhaust gas filter maintenance, although this causes OFP and ODP to increase. The most relevant factor for GWP is the choice of substituted products. When peat for horticulture can be replaced, GWP can be substantially lowered while hardly affecting other environmental impacts.

1. Introduction

Composting is a commonly used option to handle household biowaste (BW) and municipal green cut waste (GW). Generally, in the case of waste management systems, especially for biowastes, accurate measurements of mass flows and emissions during waste handling are hardly available [1]. The availability of emission data from commercial-scale composting plants under varying process conditions is limited because effective measurements require advanced instrumentation systems [2]. Therefore, LCA practitioners use estimations and assumptions for modelling such systems.
The chemical composition of input waste material, composting technology, and operating conditions are some of the highly influential parameters that affect the environmental outcomes of the composting process [3,4]. The chemical composition of the input material, in terms of C and N concentration, and moisture content influences the composting process. To some extent, those can be controlled by optimally mixing wet nitrogen-rich materials with coarse, dry bulking agents that provide an extra carbon source. BW typically has a lower C/N ratio of almost 20:1 than GW, which has a ratio of almost 40:1 [5]. However, the inherent physical and chemical composition of BW and GW varies according to spatial and temporal parameters. Due to this variation, achieving a mixture with an optimal C/N ratio and moisture content is challenging.
Operating conditions can be controlled to a certain extent using optimal management practices and taking mitigatory steps to limit the emissions. CH4, N2O, NH3, and non-methane volatile organic compounds (NMVOCs) are the main emissions that occur at various stages of composting. Ideal aeration can be achieved using forced aeration or mechanically turning the compost pile in optimal time intervals. Aeration also affects the performance of the process, affecting the rate of biodegradation, process time, and loss of nutrients [6].
Biofilters are used in enclosed composting systems in order to reduce NH3, NMVOCs, and, to a certain extent, CH4 emissions. Maintaining optimal operating conditions and replacing the biofilter material can reduce malodourous emissions. The removal efficiency of biofilters can significantly vary with moisture control and the assessment of pressure drops. Through replacing the biofilter material, an improvement in the removal efficiencies of NMVOC and NH3 was achieved and reported by Colón et al. [7].
LCA can quantitatively assess environmental impacts sensitive to management practices that influence the emissions and mass flow of the composting process. Only a limited number of LCA studies have analysed scenarios involving composting process parameters; however, these studies have mostly focussed on fuel use during collection and distribution [8].
Certain aspects of the LCA methodology require practitioners to choose between options to model and carry out the analysis. Systems can be assessed using LCA from multiple perspectives, including a process perspective where the system is input-oriented and a product perspective where the system is output-oriented [9]. Two fundamental approaches exist to handle multi-functionality, namely attributive and consequential LCA (CLCA). From a strategic policy perspective, CLCA may be the most appropriate framework to evaluate waste management systems that involve multiple product outputs and multiple system substitutions with indirect market effects [10].
It has been demonstrated that substitution is often the most influential factor in determining the overall environmental performance of a waste management system [11]. Heijungs and Guinée (2007) argue that the crediting of systems (and therefore the required decision of which a process will be assumed to be avoided) is one of the main reasons for strongly varying or even contradictory results when evaluating waste management systems. In the CLCA modelling framework, the marginal product in the market is used to substitute the respective product. Furthermore, the consideration of market volume trends also plays a role in determining whether the least or most competitive product is affected [12,13]. The methodological aspects of CLCA in selecting an appropriate marginal product may affect the result of the LCA study.
The aims of this study were as follows:
  • To investigate the influence of the biowaste and the green cut waste composition;
  • To assess the influence of management practices;
  • To estimate the environmental impacts of using alternative substituted products.

2. Materials and Methods

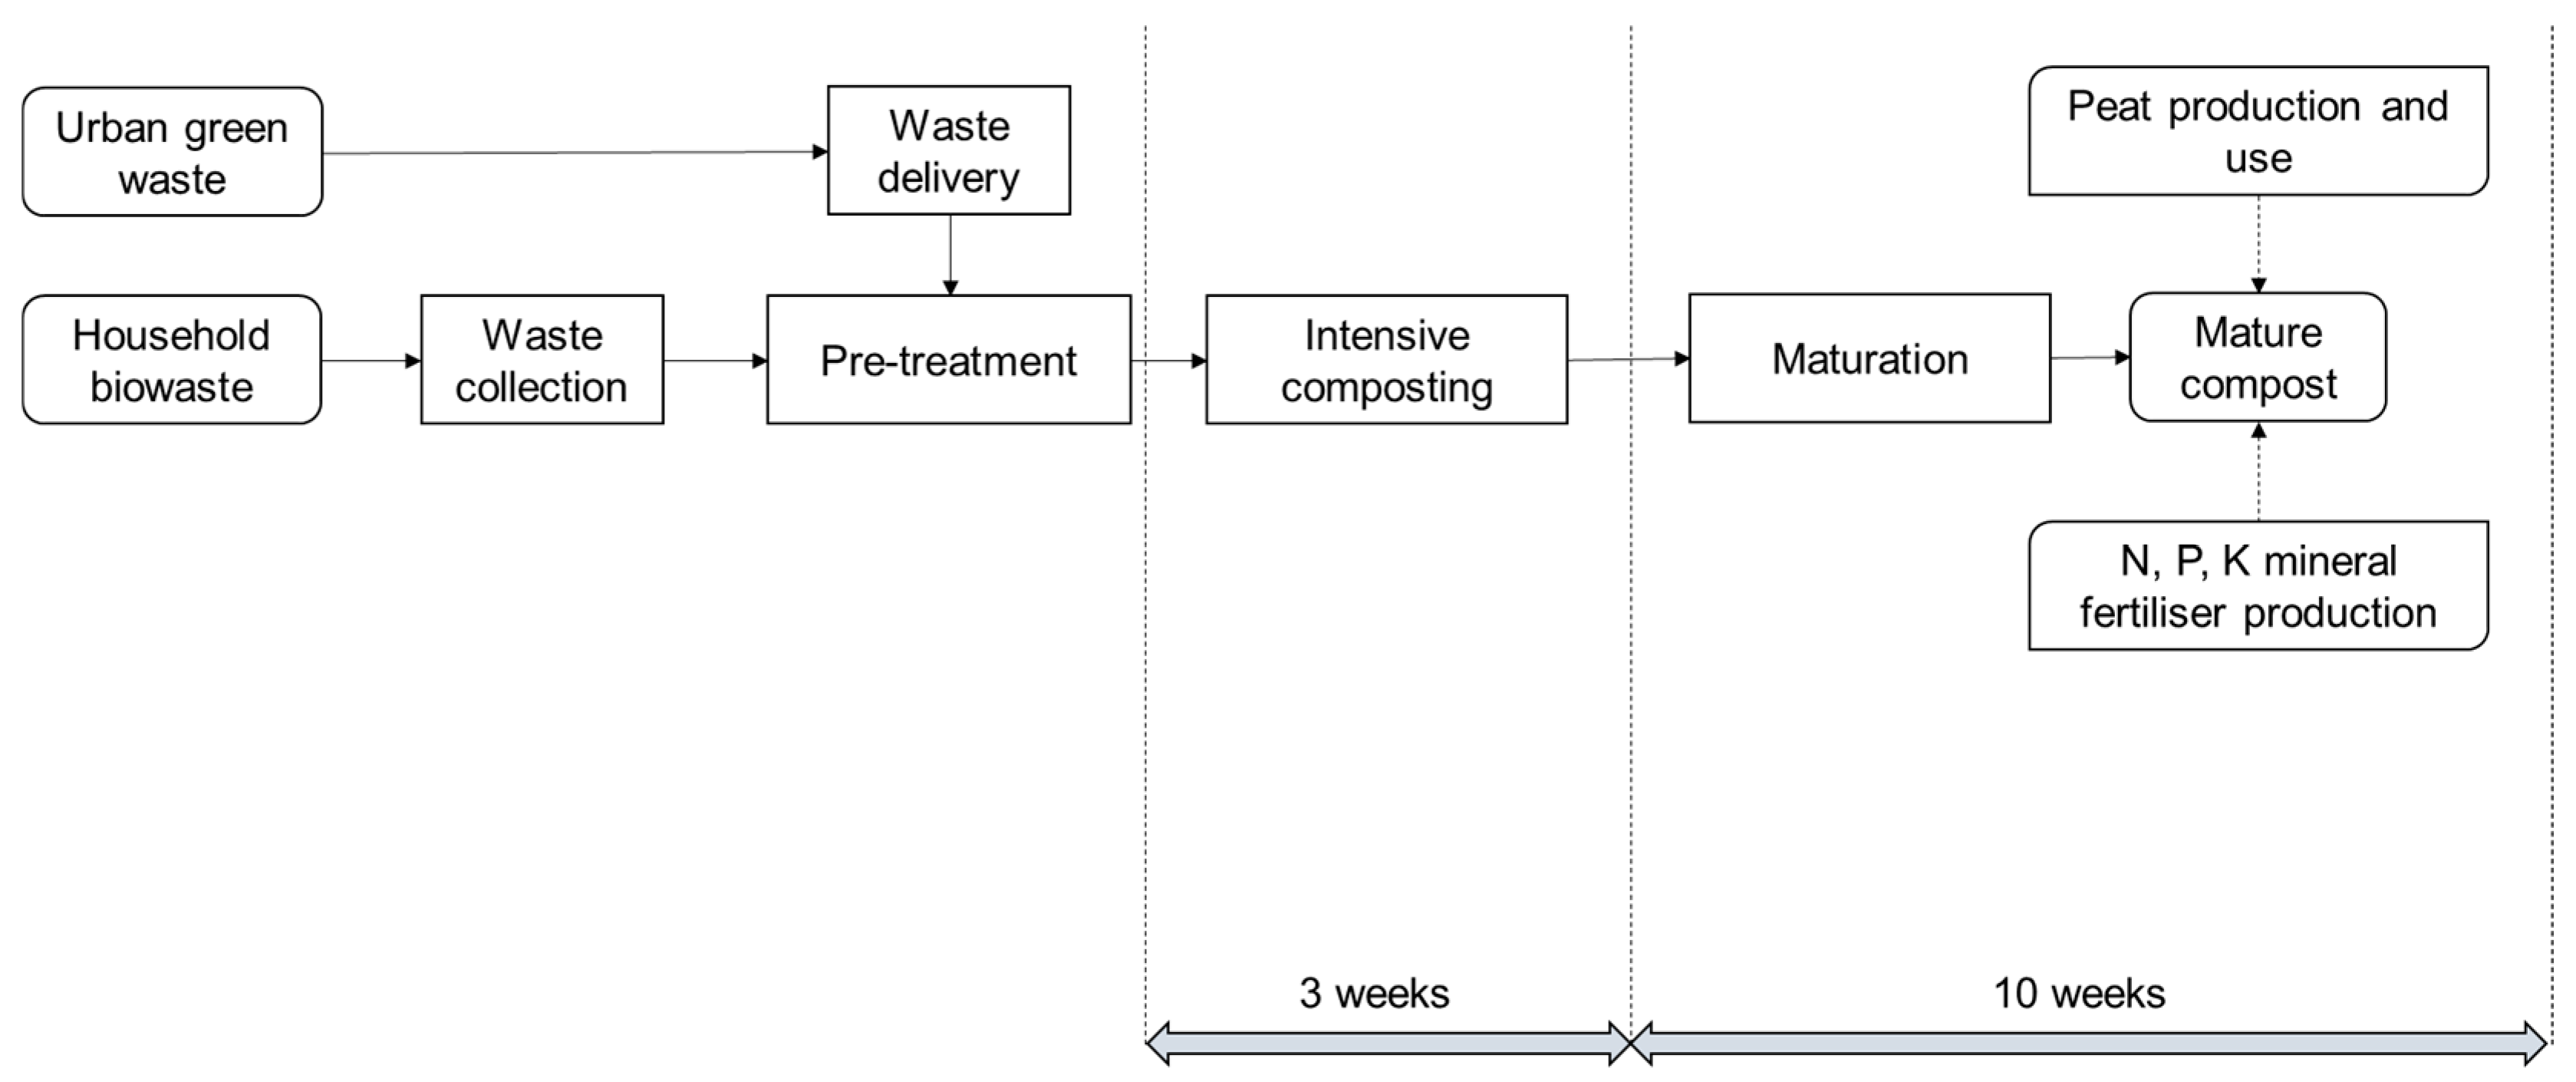
2.1. Investigated Composting Systems

In Germany, kitchen and garden waste is usually disposed of in the same organic bins and collected weekly by municipal refuse vehicles in urban areas. The containers are emptied weekly in densely populated areas and at bi-weekly intervals in less populated areas [14]. Conversely, public green cut waste from parks and roadsides and larger amounts of private garden waste are delivered separately to the composting facility. An average transport distance of 21.9 km was assumed for the transportation of wastes during the collection and subsequent delivery of waste to the composting facility [15]. Upon arrival at the plant, the input material goes through the pre-processing steps of magnetic separation, screening, and crushing. The pre-treated waste is mixed together to achieve a textural consistency for an ideal composting process, which requires a moisture content in the 45–65% range [16]. A default mixing ratio of 70% of biowaste and 30% of green cut by weight was assumed in the modelled system. In order to investigate the influence of the input material composition, the ratio of biowaste and green cut waste was varied.
The technology used for the composting process affects the emissions during decomposition and the final compost products [17]. Enclosed composting (EC), partially enclosed composting (PEC), and open composting (OC) are the commonly used industrial composting technologies [18]. PEC is analysed in this study considering the data availability with regard to emission factors [19]. PEC uses intensive decomposition, which is assumed to take place in an enclosed environment, with exhaust gases being treated using a biofilter. The input material is laid in windrows. For intensive composting, the material is turned weekly, with an average composting time of three weeks [19]. After the intensive composting stage, the product is referred to as fresh compost and still contains degradable organic matter, and it can be further matured. The maturation stage takes place in an open environment over a period of 10 weeks. The turning frequency is every two weeks and is carried out with diesel-powered turning vehicles. The product obtained is classified as mature compost (MSC) with a decomposition degree of 4 or 5 (according to the German compost classification scheme [20]). MSC can be used as a growing media compound, replacing peat and fertiliser. The substitution of conventional synthetic fertilisers and peat is carried out using Mineral fertiliser equivalent (MFE) and peat substitution factor, respectively.

2.2. Life Cycle Assessment (LCA)

The system was modelled using OpenLCA v.2, and its embedded features were used to conduct the analysis. Datasets for the background processes were taken from Ecoinvent 3.9 [21].

2.2.1. Goal Definition

The goal of the life cycle assessment was to estimate the consequences of modelling choices. This study involved investigating the influence of composting management practices and the influence of the selected marginal product for substitution on the overall environmental impact of the composting system.

2.2.2. Scope Definition

Since a process-oriented LCA was carried out, waste treatment was considered the system’s primary function. Hence, the environmental impacts of the composting process were based on a functional unit to handle the input waste material, which is common in waste management LCAs [22,23,24]. “Treating 1 tonne mix of biowaste and green cut waste originating in Germany” was used as a functional unit.
Kitchen and garden waste originating from households and green cut waste were the two input materials used for this study. The system starts with the transport of biowaste from households and green waste collected in compost bins, which are delivered to composting plants. Emissions from the transport of waste were included, but other emissions (e.g., from storage prior to transport) were excluded. The modelled system is shown in Figure 1.

2.2.3. Life Cycle Inventory Modelling and Data Collection

The life cycle inventory consists of a compilation of data to quantify emissions and the use of resources. The emissions are modelled for each process, as described below. The model is based on literature data on the input properties of the waste material, decomposition, and associated emissions during composting. The data collected consist of values for the respective parameters and their minimum and maximum ranges.
Emissions occur at different stages of the composting process; however, the intensity of these emissions varies depending on the composition of the input material and the process parameters at each stage. In this study CH4, N2O, and NH3 emissions were quantified for the composting stages, while emissions of NMVOCs were quantified only for the overall composting process due to limited data availability [19]. The emission factors included in our analysis were taken from UBA [19]. With the exception of NOx, all emissions occur directly from the composting process. NOx and N2Oemissions occur in the biofilter during the breakdown of NH3 [25]. In addition, there are emissions from the operational activities during the composting process, which are mainly caused by emissions from energy generation and use.
MFE for N in the compost typically varies between 0.2 and 0.4 depending on plant availability [26]. The MFE for P and K is almost 1; this means that both compost and mineral fertiliser released the same amount of plant-available P and K over the same period [27,28]. For peat substitution, the bulk density of compost and peat was used to estimate the mass of material needed to fill a specific volume. The densities of peat vary sharply according to the type of peat selected: white peat and black peat are 100 kg/m3 and 165 kg/m3, respectively [29], whereas unspecified peat has a density of 200 kg/m3 [28]. Likewise, the bulk density is in the range of 600 kg/m3 for substrate compost based on kitchen waste and 550 kg/m3 for compost based on garden waste [30].

2.2.4. Impact Assessment

In this analysis, ReCiPe2016 midpoint (H) categories were used [31]. ReCiPe2016 is one of the newest LCIA methods that allows for mid-point evaluation. Global warming potential (GWP), acidification potential (AP), stratospheric ozone depletion potential (ODP), and ozone formation potential (OFP) were selected as relevant impact categories for the composting system described in this study. These impact categories were directly affected by the emissions of CH4, N2O, NH3, NOx, and NMVOC from foreground processes during the composting process.

2.3. Multi-Functionality and Scenario Definition

2.3.1. Multi-Functional Processes and Defining Marginal Products

Since the main function of the system was to handle waste, the compost produced was handled using a multi-functional approach. The produced compost was treated as a multi-functional product, and system expansion was used to assign credits.
The products identified for substitution were mineral fertilisers and peat. Mineral fertilisers in Germany that would be replaced in the market were identified using the marginal product principle. Though multiple studies have identified marginal N, P, and K fertilisers for the respective geographical scopes, their identification procedures have not been clearly stated [32,33,34]. Calcium ammonium nitrate (CAN) and ammonium nitrate were identified as marginal N fertilisers for Denmark by Tonini et al. [32] and Petersen [35], respectively. Ammonium nitrate was also identified as a marginal N fertiliser for The Netherlands and Sweden [33,34]. Similarly, ammonium phosphate and triple superphosphate were identified as marginal P fertilisers for Denmark, the latter was identified as a marginal product for The Netherlands.
The approach defined by Petersen [35] to identify marginal products begins with the identification of a market trend, which implies that a change in demand must be identified. The technology with the lowest long-term production cost can be considered marginal, according to Weidema [36]. Looking at the market trends in Germany for mineral fertilisers, a decreasing demand over the past decade was observed, and the same is forecasted for the forthcoming decade. Hence, the least competitive mineral fertiliser for the respective nutrients will be the marginal product. The fertiliser data available in the Ecoinvent database were considered for the marginal fertilisers [37] (Table 1).
Using the aforementioned criteria, urea ammonium nitrate (UAN) with an N content of 32% was identified as the marginal N fertiliser in Germany. Similarly, triple superphosphate (TSP) and Potassium Chloride were identified as the marginal P and K fertilisers. However, the pricing of mineral fertilisers is influenced by dynamic market factors, and the selected marginal mineral fertiliser may vary. Therefore, alternative potential marginal mineral fertilisers were also investigated. In addition to the identified marginal N fertiliser, calcium ammonium nitrate and, as a marginal P fertiliser alternative, single superphosphate was used. Bulk density is a decisive factor for substituting compost with peat; therefore, peat with varying bulk density was used in the scenario analysis.

2.3.2. Scenario Definition

The management practices during the composting process can influence emissions and the quality of compost. Hence, it is of interest to investigate the environmental impacts with respect to varying management practices. Moreover, substitution is often the most influential factor in determining the overall environmental performance of a waste management system. Both aspects were investigated by means of a scenario analysis. The scenario analysis consisted of 11 scenarios, including the default scenario. The scenarios were divided into 5 scenario groups (SGs), as shown in Table 2. Details for each SG are provided below in Table 3.
SGs 1 to 3 pertain to the role of partially controllable process parameters on the overall life cycle of the composting system. Each group pertains to relevant process parameters with defined variability, indicated as “a”, “b”, and “c”, where “a” is the default parameter setting used in all scenario groups. The parameter setting of the default scenario is further specified in Table 3, together with the emission factors and material composition used in SGs 1 to 3.
Selecting an appropriate marginal product may affect the result of the LCA study. In this analysis, the marginal fertilisers described in Section 2.3.1 were used in scenario groups 1 to 3, while alternative substituted products were used in SG4 and SG5, as indicated in Table 2.
SG 1 pertains to the influence of biowaste composition by using three different mixing ratios for biowaste and green cut waste. The scenarios with varying shares of biowaste and green cut waste were used to understand the consequences of C, N, and the moisture content of the input mixture on the environmental aspects of the composting process. However, by adjusting the mixing ratio of biowaste and green cut waste, the composition of C, N, and moisture in the waste mixture can be partly controlled. The optimisation of the initial composting mixtures is also a key factor in the conservation of nitrogen in compost [38]. An optimal C/N ratio between 25 and 35 plays a crucial role in the ideal operation of the composting system. A high C/N ratio limits microorganism activity, whereas a low C/N ratio leads to greater NH3 emissions [38]. The default scenario 1a had a composition of 70:30 for biowaste and green cut waste, respectively; in this scenario, the C/N ratio was 29, and the moisture content was 61%. Two additional scenarios—1b and 1c—were defined by varying the ratio of the biowaste and green cut waste to 60:40, resulting in a higher C/N and lower moisture of 32 and 59%, respectively. Similarly, a low C/N ratio of 25 and high moisture of 64 was achieved by using a mixing ratio of 90:10.
SG 2 also consists of three scenarios: 2a, 2b, and 2c. This scenario pertains to operating conditions, i.e., turning frequency. The turning frequency of the default scenario 2a was defined at 7 days [19]. The selection of scenarios was carried out at different emission factors for the respective turning frequencies. Scenarios 2b and 2c have a turning frequency of 3 days and 1 day, respectively. The emissions of NH3, N2O, and CH4 resulting from the varied turning frequencies for the intensive composting stage were estimated according to data from the literature [39].
In SG 3, biofilter maintenance is a broad term used to denote the change in biofilter material, maintaining appropriate fan speed, moisture, and temperature control. A biofilter with an upstream gas scrubber is assumed to be used for this study. Improved biofilter maintenance resulted in lower NH3, CH4, and NMVOC emissions, whereas the emissions of N2O and NOx increased. For the default setting, 3a, the biofilter efficiency values for the removal of NH3, NMVOC, and CH4 were assumed to be 74%, 90%, and 16%, respectively [40,41]. For the best-case scenario, 3b, a removal efficiency of 92% for NH3, 95% for NMVOC, and 22% for CH4 could be achieved by optimally controlling the conditions inside the biofilter. For the poor maintenance scenario, 3c, a removal efficiency of 60% for NH3, 80% for NMVOC, and 10% for CH4 was assumed [7,42].
SGs 4 and 5 investigate the influence of using the alternative substituted products that were described in Section 2.3. The scenarios for alternative marginal N and P fertilisers were defined using urea ammonium nitrate in scenario 4b and single superphosphate in scenario 4c, respectively. Similarly, scenarios defined to investigate the role of peat used for substitution included low-density peat (with 180 kg/m3 in scenario 5b) and high-density peat (with 215 kg/m3 in scenario 5c).

3. Results

The results from the LCA can be broadly divided into two sections: The first section consists of emissions associated with the composting processes (intensive composting and maturation) and the collection of biowaste (Figure 2). The second section consists of credits received for compost by substituting mineral fertiliser and peat. The environmental impacts of composting 1 t biowaste are shown in Table 4. The results of the life cycle assessment revealed that three sources accounted for the majority of GWP in composting systems. The composting process was the main source of GHGs, accounting for almost 60%. Looking more closely at the two composting stages, intensive composting accounts for nearly two thirds of the emissions from the composting process. The collection and distribution of biowaste and green cut waste is the second largest source of emissions, accounting for almost 25% of all GHG emissions. Electricity for pre-treatment and intensive composting accounted for almost 10% of all emissions, making them the least significant of the three.
Peat substitution had the highest GHG emission offset, accounting for about 90% of the offset emissions. The replacement of nutrients in the compost with mineral fertilisers was responsible for the remaining credits. For AP, transportation-related emissions from the waste collection had the highest emission share at almost 36%; intensive composting and maturation stages contributed almost 27 and 18%, respectively. Similarly, for the OFP impact category, emissions from collection and transport accounted for more than 50% of all emissions expressed as NOx eq. In comparison, emissions from the composting process came second at almost 35%. When the composting process was examined closely, the intensive composting stage exhibited higher emissions than the maturation stage for all impact categories except ODP. Regarding ODP, it was found that maturation stage was the highest contributor, with around 57% of the total impact.

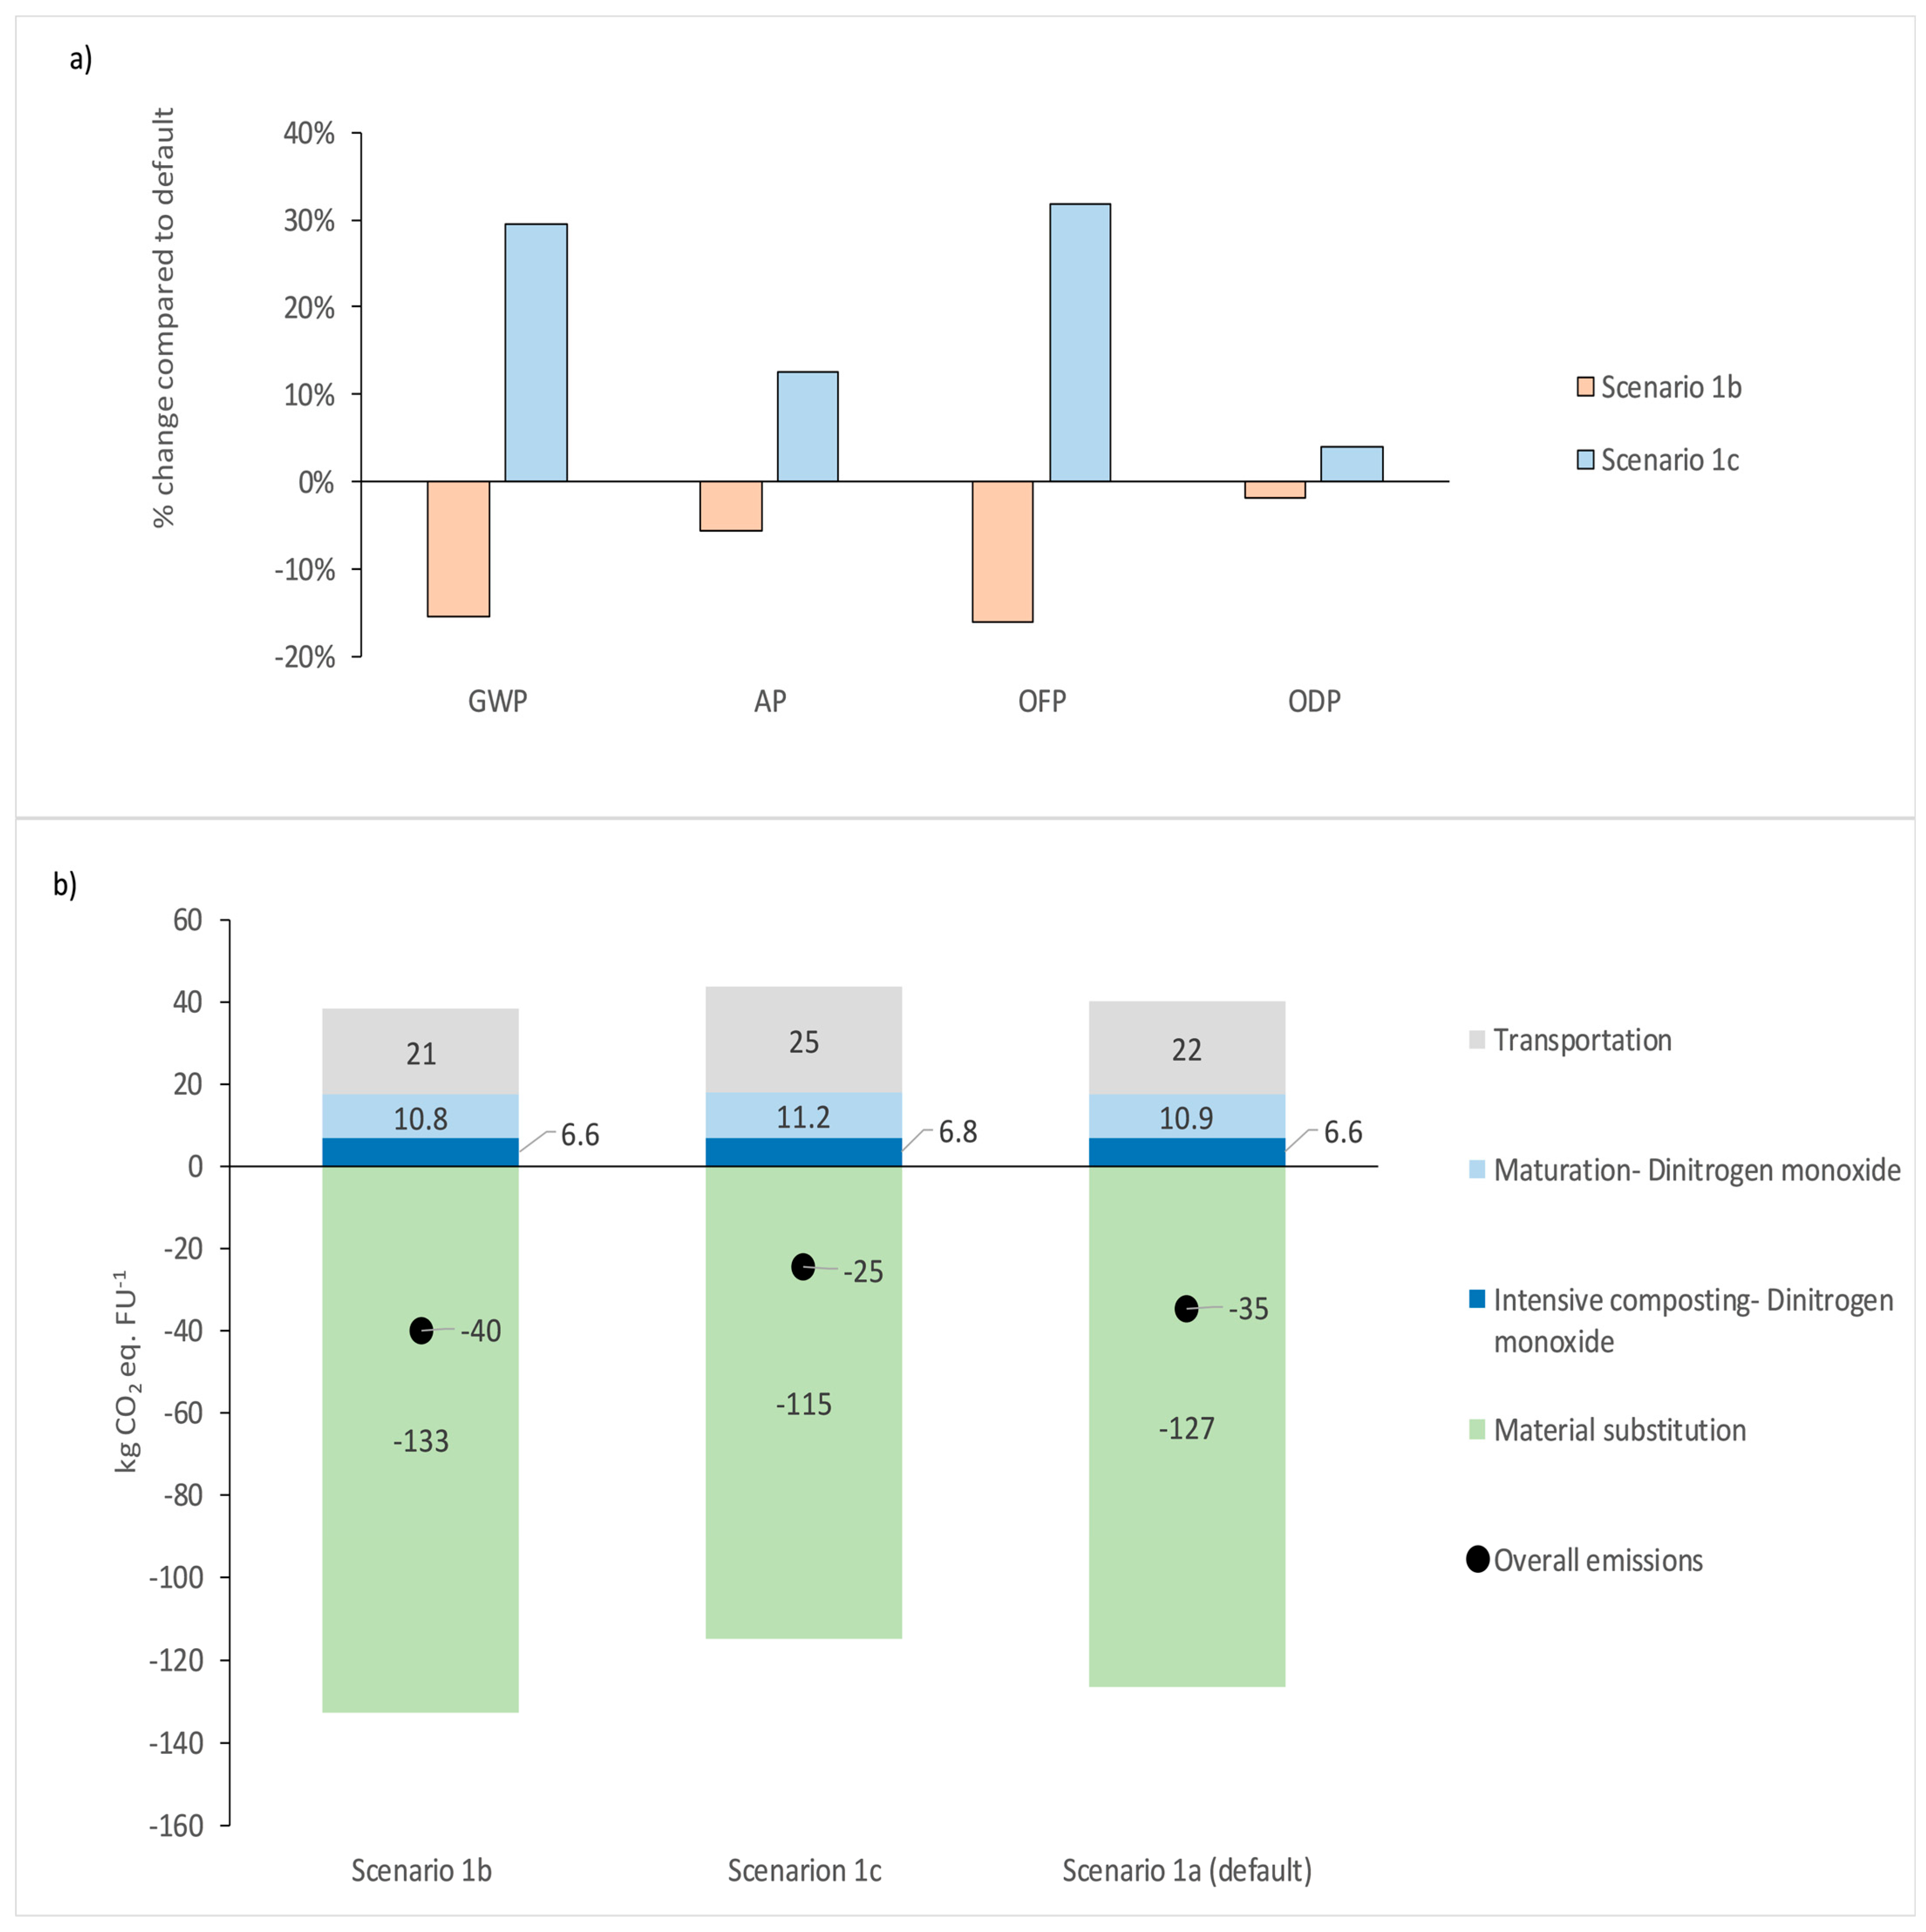
3.1. Influence of Biowaste Composition Simulated by Using Different Mixing Ratios

The net change in impacts of using the alternative scenario was compared to the default scenario in each group for the respective impact categories. In the modelled composting system, a variation in the mixing ratio of BW and GW affected the overall GWP, mainly through the influence on credits for materials substituted and fossil CO2 emissions related to waste collection (Figure 3b). Mixing biowaste and green cut waste in a 60:40 scenario resulted in a 22% lower GWP, and using a composting mixture with a higher share of BW (90:10) resulted in 29% higher GWP compared to the default (Figure 3a). Similarly, for AP, NOx emissions from waste collection had the strongest influence from variation in the mixing ratio, followed by emissions from intensive composting. A 6% lower AP was found for the 60:40 scenario compared to the default, whereas for the 90:10 scenario, there was a 13% increase. Waste collection-based emissions and material substitution had the highest variation for OFP as well; almost 32% higher emissions for 90:10 and 16% lower emissions for 60:40 were observed compared to the default setting. Compared to the other impact categories, only a smaller change of less than 4% was observed for ODP for both the 60:40 and 90:10 scenarios.

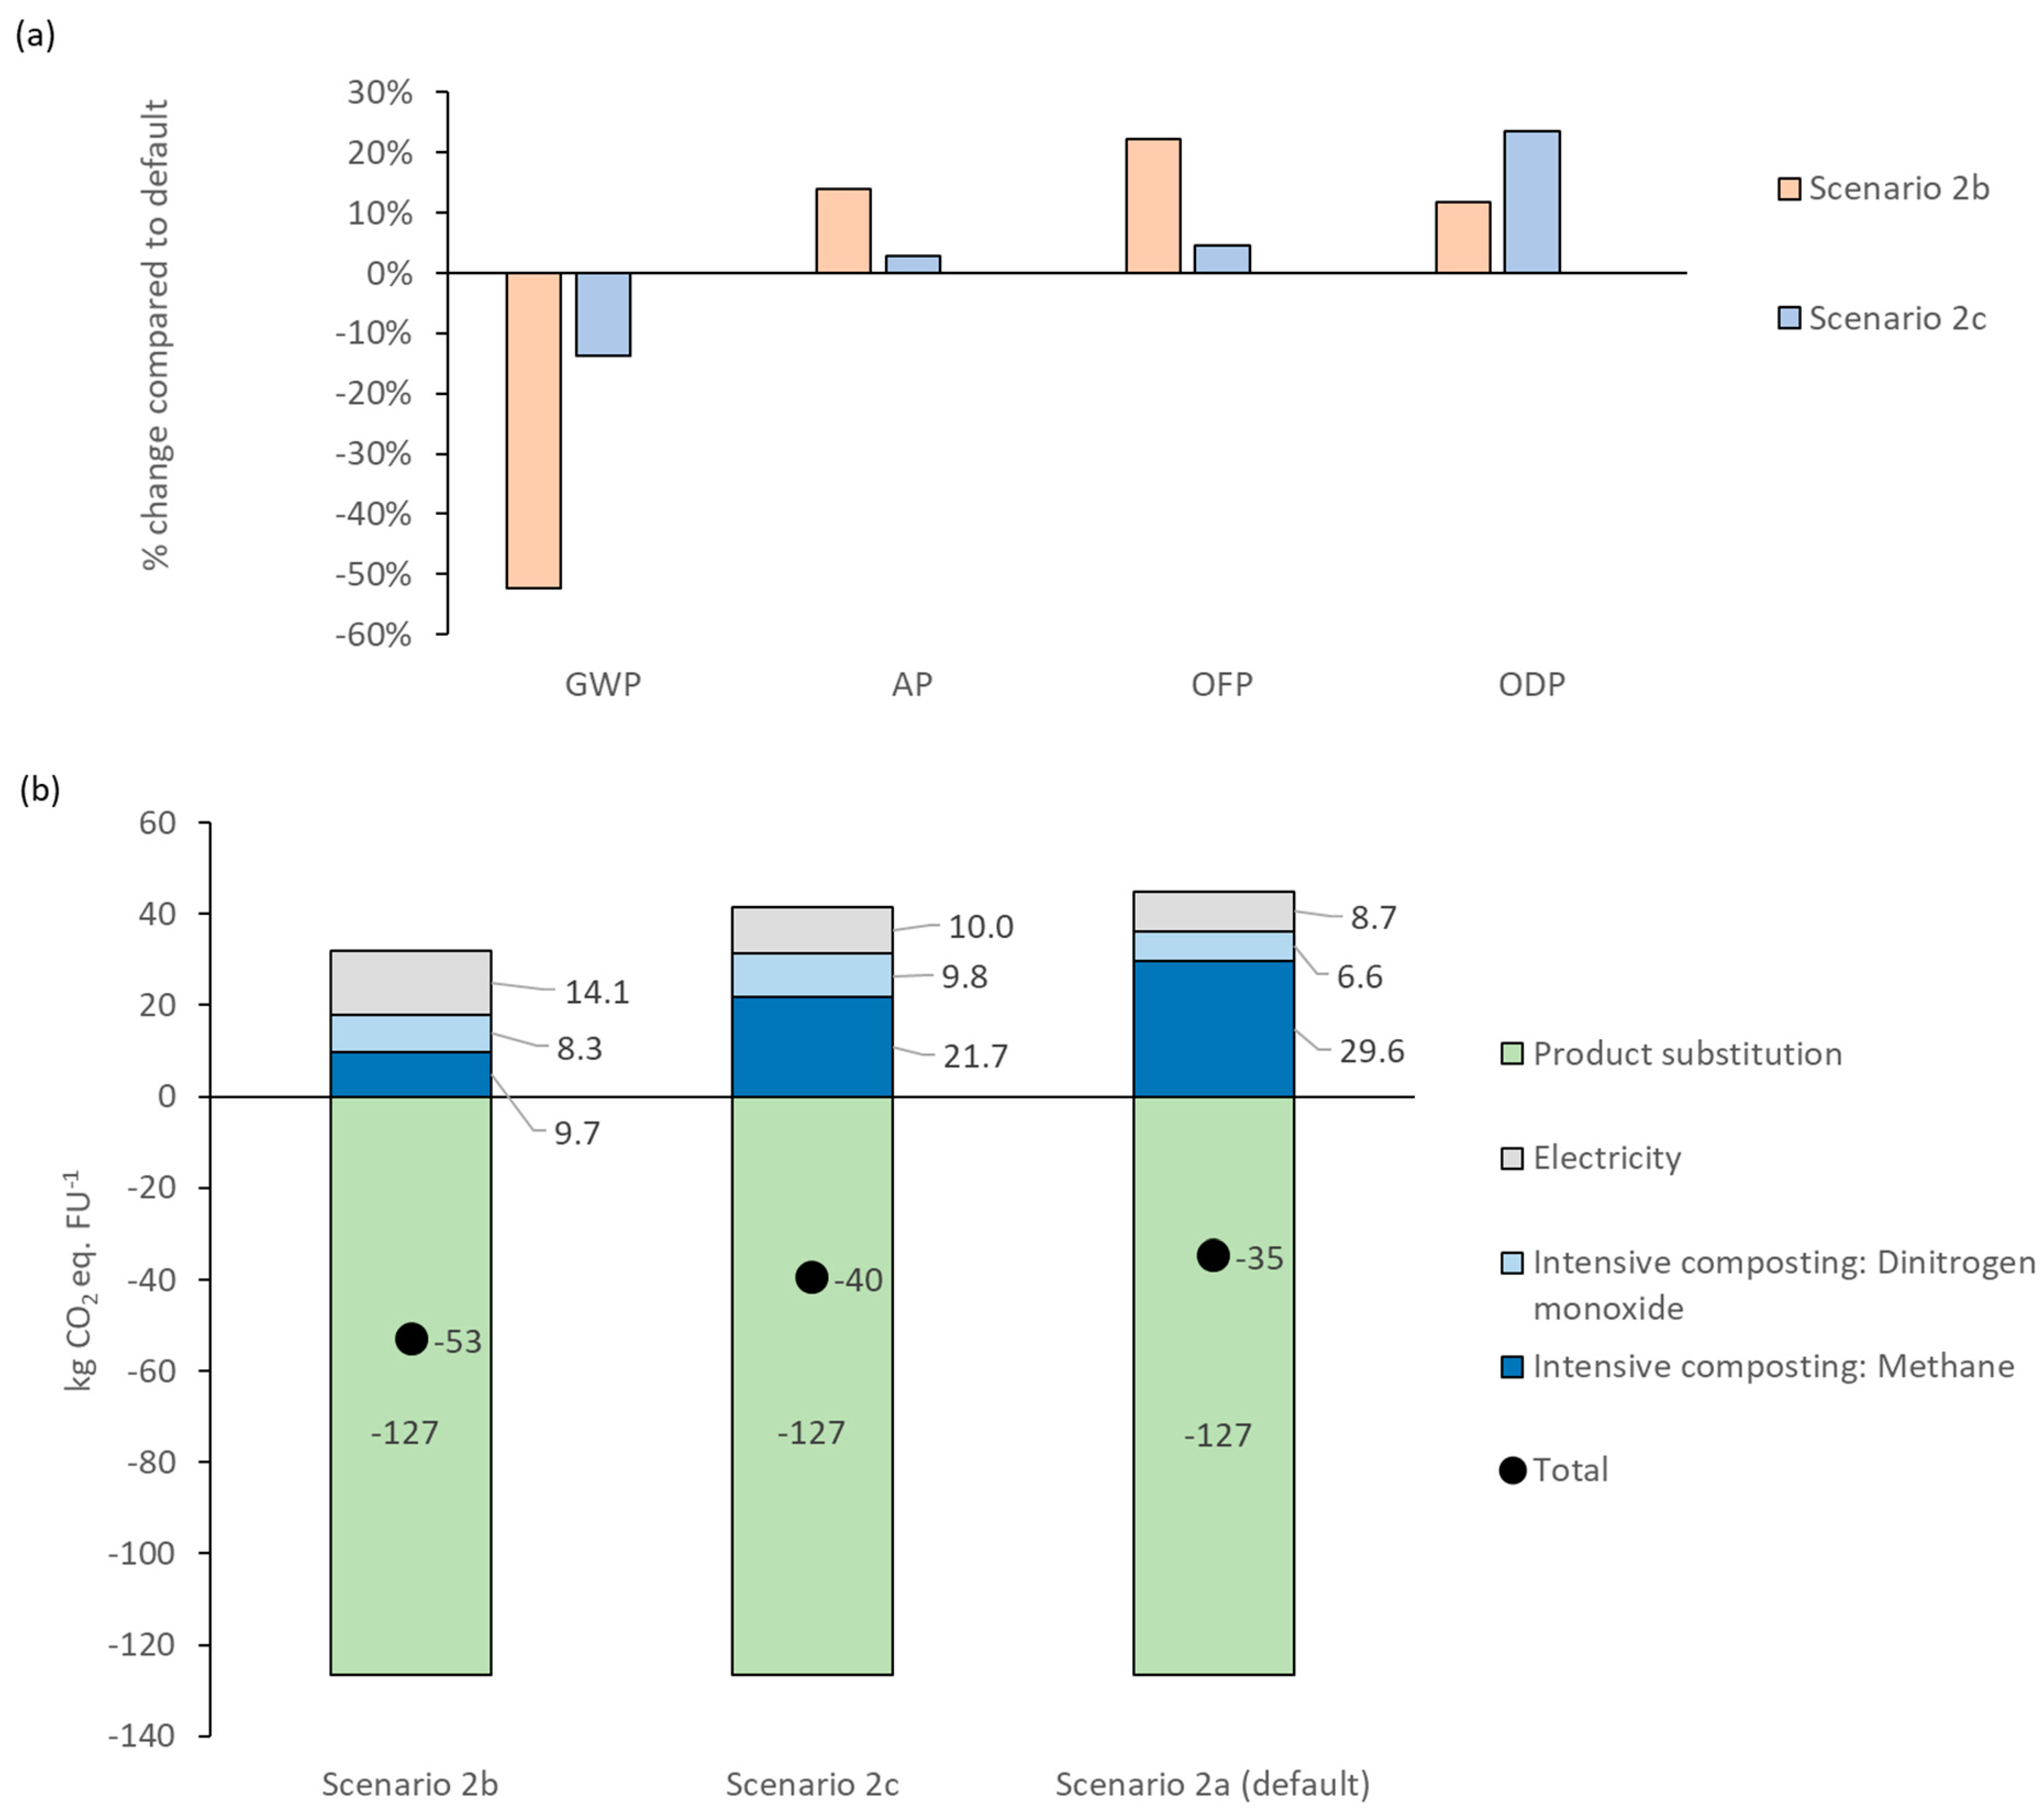
3.2. Influence of Turning Frequency

The variation in turning frequency influences the emissions of CH4, N2O, and NH3 from composting as well as the nutrient composition of the compost, and this is reflected in the results of the respective impact categories (Figure 4a,b). A decrease in GWP by 52% and 14%, respectively, for both a 1-day and 3-day turning frequency was observed. However, for AP, OFP, and ODP, the 1-day interval increased the emissions by 14%, 22%, and 12%, respectively, compared to the default 7-day interval. Similarly, the 3-day turning frequency also resulted in a higher emission than the default for AP, OFP, and ODP. However, for ODP, the magnitude of variation was higher for the 3-day scenario compared to the 1-day scenario.

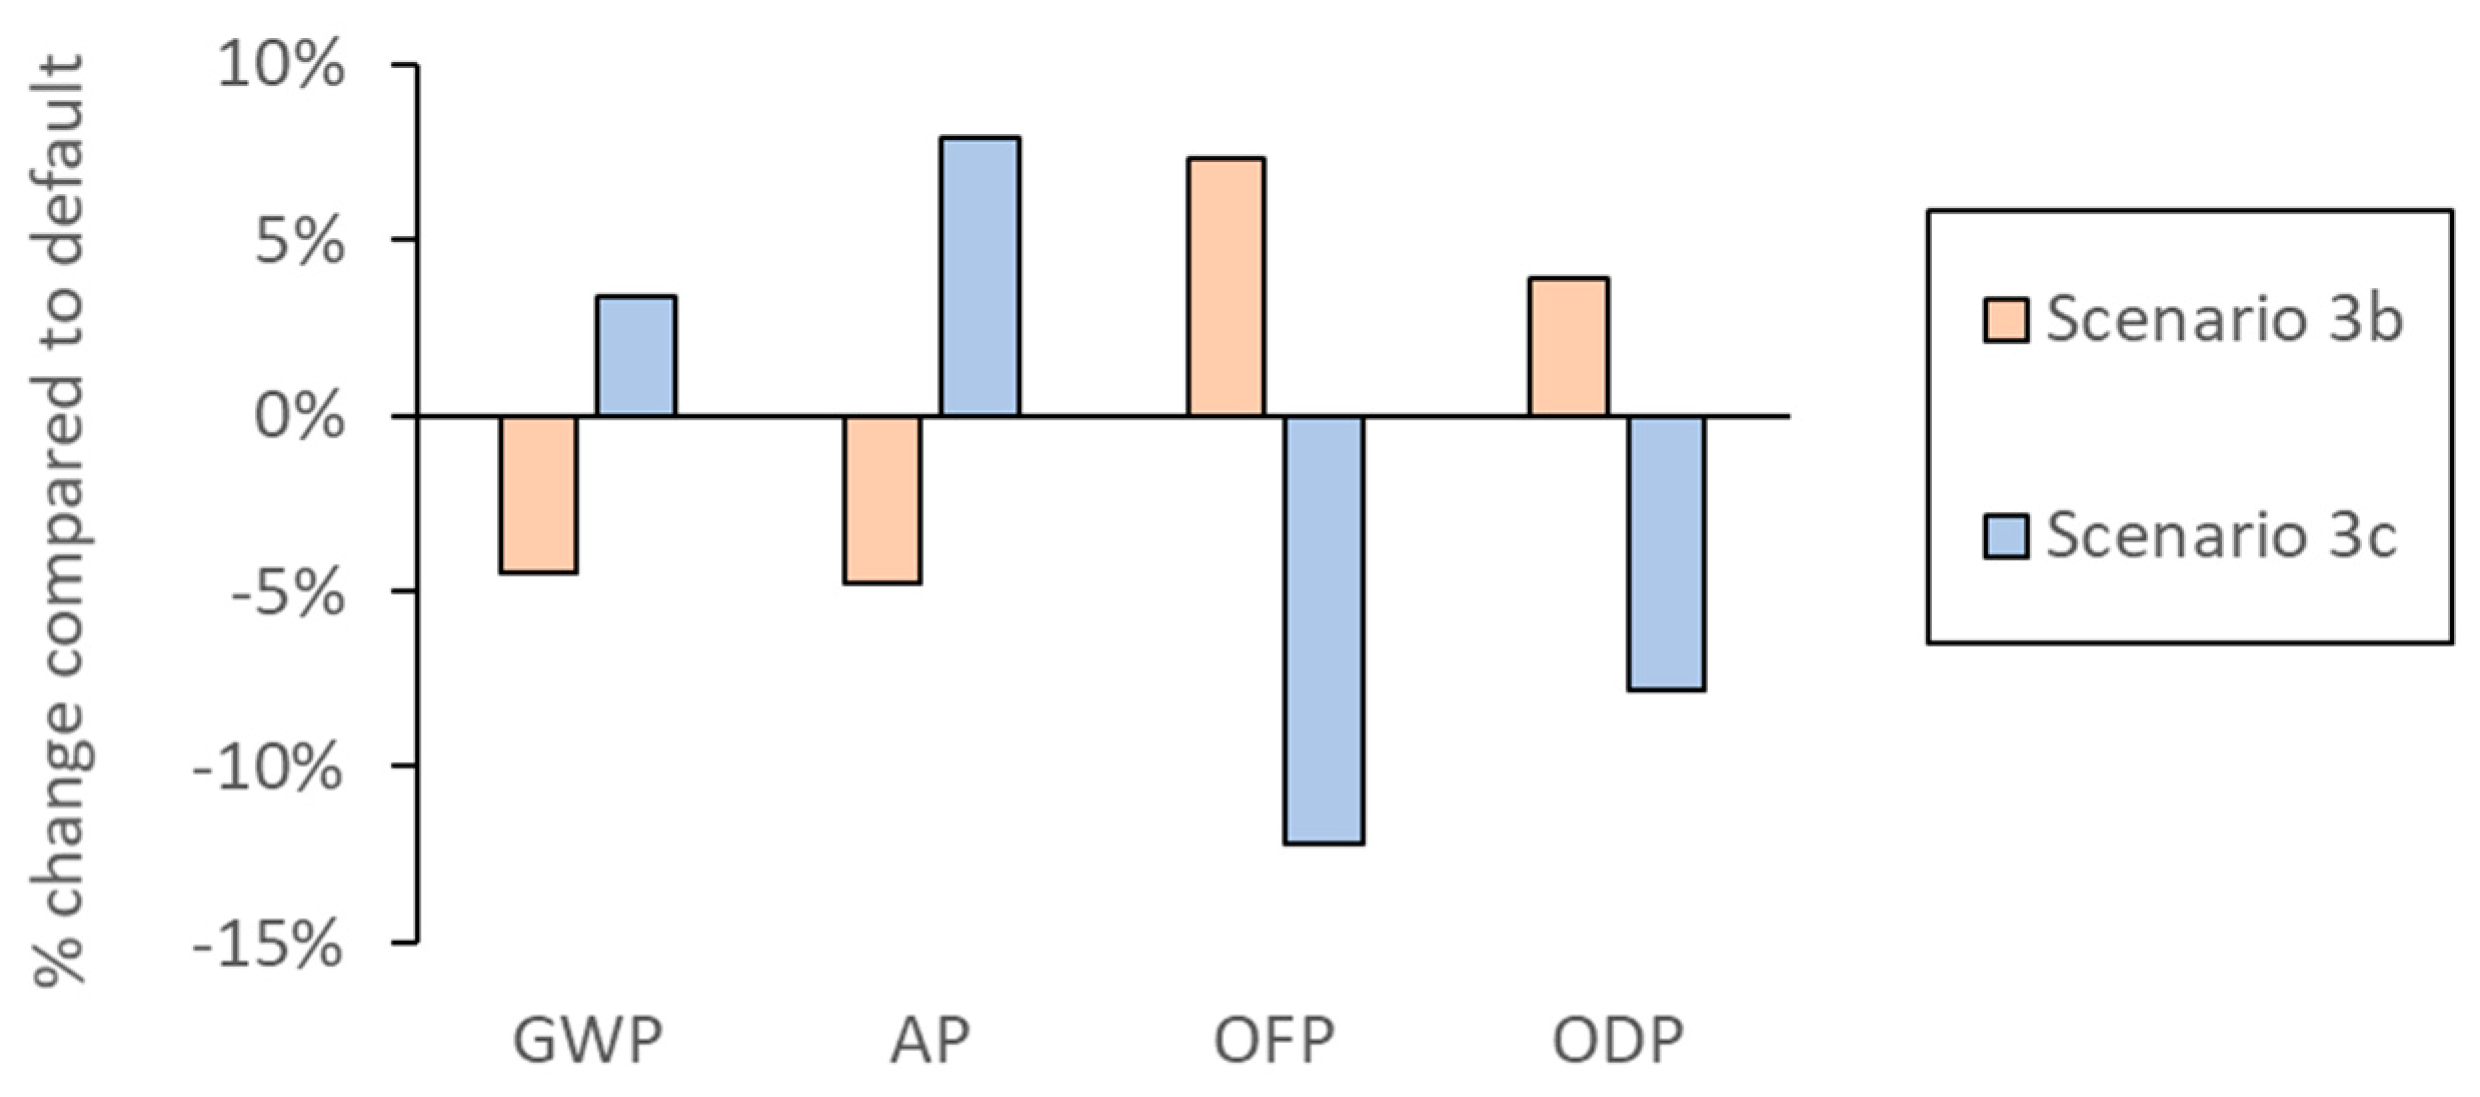
3.3. Influence of Biofilter Maintenance

Improved biofilter maintenance resulted in lower NH3, CH4, and NMVOC emissions, whereas the emissions of N2O and NOx increased. OFP and ODP increase with improved biofilter maintenance; AP is 5% lower than in scenario 3a (Figure 5). OFP had the highest increase in the impact at 7%, followed by ODP with a 4% increase. The opposite was observed for the impact categories as a result of poor maintenance. There was an 8% increase in AP and 3% increase in GWP. However, the ODP and OFP decreased by 12% and 8%, respectively.

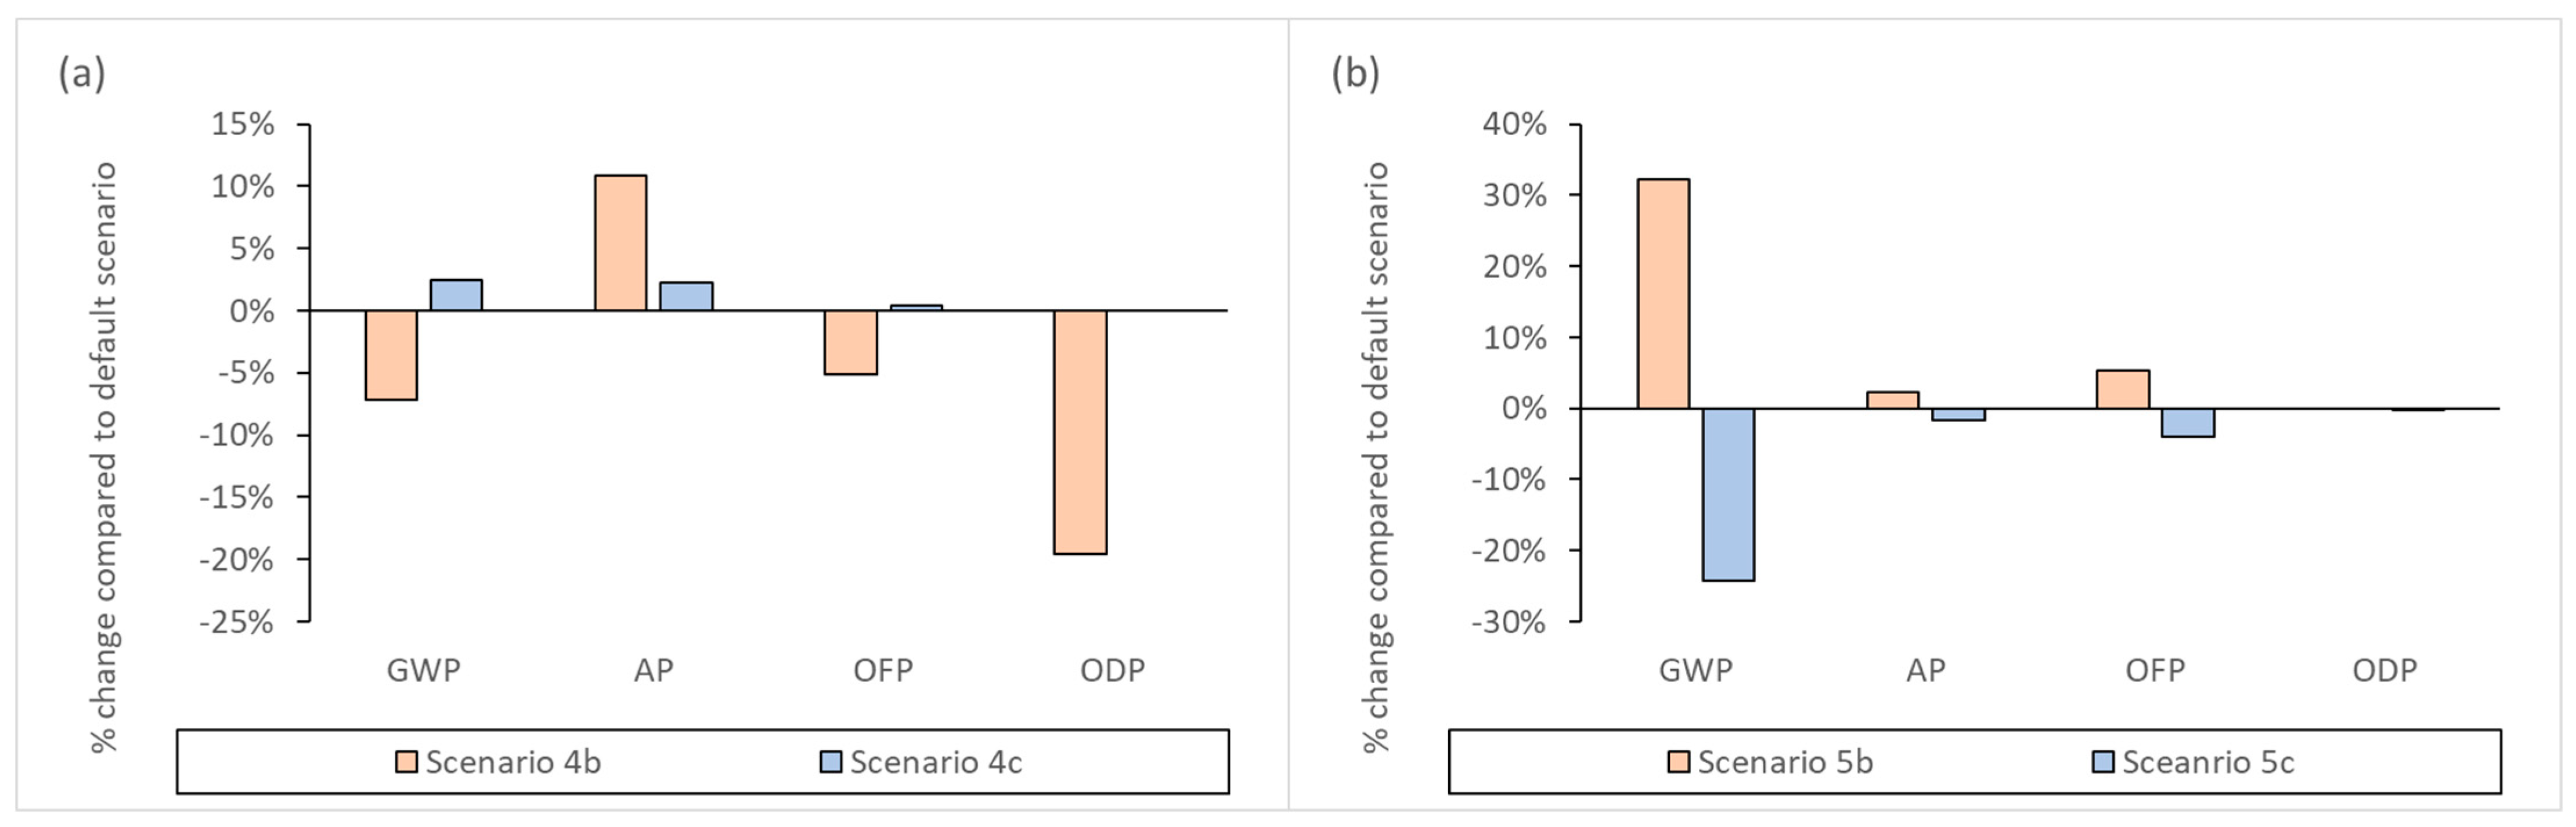
3.4. Influence of Alternative Products for Substitution

For GWP, there was a decrease of almost 7% when using CAN for substitution instead of UAN. However, using single superphosphate instead of triple superphosphate resulted in a 3% increase (Figure 6a). For AP, there was an increase of almost 11% when substituting CAN instead of UAN, and an increase of 2% was observed for SSP compared to TSP. Regarding OFP and ODP, there was a decrease of 5% and 20%, respectively, for CAN, whereas there was only a negligible change for SSP.
The density of peat influences the quantity of the peat substitute. When using a lower density peat for substitution, the GWP for the overall system was 30% higher compared to using default-density compost. Using a higher density compost led to a decrease in GWP of almost 23% (Figure 6b). The trend was the same across AP, OFP, and ODP, with lower density peat providing higher credits compared to default density.

4. Discussion

4.1. Waste Composition

The influence of biowaste composition on the composting system was investigated by varying the mixing ratio of BW and GW. The influence of C/N ratio and moisture content on the direct emission of CH4 and N2O is ambiguous because emissions are driven by both waste composition and management practices. However, the composting process is the main contributor to all considered impact categories, apart from OFP, as shown in Table 4.
Transport is the main driver for OFP. Transportation-related emissions were modelled assuming an average transport distance of 21.9 km for biowaste [15], and in the default scenario, transport causes 56% of the OF. Since the transportation of GW is assumed to be burden-free, only emissions associated with BW vary with mixing ratios [28]. The GWP for BW is mainly due to the stop-and-go waste collection method assumed to be used for BW collection. The stop-and-go collection system accounts for almost 1.2 kg CO2 per tonne and kilometre the waste is transported, which is almost three times the emissions compared to other means of material transport [43]. Hence, the 90:10 scenario with a higher share of BW has higher level of GWP associated with transportation compared to the default and 60:40 scenarios.
Focussing on the GWP, a difference of almost −14% (5.3 kg CO2 eq.) and +27% (10.1 kg CO2 eq.) from the default scenario was observed for the 60:40 and 90:10 mixtures, respectively. The overall GWP was lower for the 60:40 mixture and higher for the 90:10 mixture because of lower N2O emissions and less emissive waste collection for the former and vice versa for the latter. In the composting process, N2O emissions are considered to be positively correlated with moisture content, mainly due to the lack of O2 availability. Increasing the share of green cut waste results in a lower bulk density of the input material, leading to higher aeration and therefore decreased N2O formation through reduced denitrification [44]. Composting materials with high C/N ratios were likely to reduce N2O emissions through the high immobilisation of N by microorganisms. N2O emissions occur mainly in the maturation stage [45].
The NOx emissions from BW transportation were, besides the composting process, the main cause for AP, with approx. 35% in the default scenario. Hence, the 90:10 mixture with the higher share of BW and N content, respectively, results in almost 19% higher AP compared to the default 1a scenario. The N content of the waste directly influences NH3 emissions and indirectly influences NO emissions. Many studies have noted the negative correlation between C/N and NH3 emissions [46]. Hence, the overall lower AP for the 60:40 mixture can be attributed to the lower transportation emissions and the lower NH3 emissions from the composting process.
Overall, through altering the mixing ratios of BW and GW in the modelled composting system, a fluctuation was observed in the selected impact categories due to variation in the N2O and NO emissions from intensive composting, maturation, and storage. Furthermore, transportation emissions related to waste collection were also impacted indirectly. Although biowaste composition is a crucial factor with respect to emissions, the management practices used are of equal importance.

4.2. Management Practices

The influence of management practices on environmental performance was investigated by varying turning frequency and biofilter maintenance as described in Section 4. Increasing the turning frequency results in a higher quantity of available O2 for biowaste decomposition but increases the energy demand, and the opposite occurs when the turning frequency is decreased. Turning the waste daily in scenario 2b, particularly at the beginning of the composting process, can bisect the GWP by up to 18 kg CO2 eq. compared to scenario 2a, whereas only a slight reduction in GWP of almost 5 kg CO2 eq. was observed for scenario 2c compared to scenario 2a. Although there was an increase of 5 and 1 kg CO2eq from the higher electricity usage for the frequent turning scenarios 2b and 2c, respectively, the GWP from CH4 emissions were reduced by 20 and 8 kg CO2 for scenarios 2b and 2c, respectively. CH4 release is inversely influenced by the amount of O2 available in the compost pile; however, higher turning frequencies have been found to increase NH3 and N2O emissions [41] due to enhanced microbial decomposition and ammonification [47]. A strong positive linear correlation between NH3 emissions and turning frequency was identified by Phong [48]. The scenario with the highest turning frequency (i.e., daily) had the lowest overall GWP. This was due to the lower methane emissions estimated using the methane emission factor, which was almost 68% lower compared to the weekly turning scenario. However, for the daily turning scenario, the N2O emissions were almost 27% higher compared to the 7-day scenario. As a result of the higher turning frequency, a higher supply of O2 may support N2O formation as an intermediate product of nitrification and denitrification [41].
There was almost a 46% and 9% increase in the direct emissions of NH3 for scenarios 2c and 2b, respectively, compared to 2a, resulting in a higher AP for the frequently turned scenarios. Furthermore, the breakdown of NH3 also resulted in a proportional increase in NOx emission, which, along with the higher NH3, resulted in a 22% and 5% increase in OFP. Similarly, the 25% and 47% higher N2O emissions for scenario 2c and 2b resulted in an increase in ODP.
The main aim of the biofilter is to reduce odorous emissions. Exhaust gases from intensive composting and storage are treated using the biofilter; hence, NH3 and NMVOC emissions are effectively eliminated. Improved biofilter maintenance resulted in almost 60% lower NH3 emissions for scenario 3b and almost 100% higher emissions for scenario 3c in comparison to scenario 3a. Similarly, there was a 7% CH4 reduction for scenario 3b and 7% increase in 3c compared to 3a. However, due to the improved maintenance, an 8% increase in N2O was observed for scenario 3b compared to 3a, and for scenario 3c, there a 14% decrease in N2O was found due to a decrease in the breakdown of NH3. Similarly, due to the decreased NH3 breakdown, there was also a 14% increase and 24% reduction for scenarios 3b and 3c, respectively. NH3 and NO are the main foreground emissions from composting that contribute towards the impact category AP. For AP, the emission factor for NH3 is almost 3.5 times higher compared to the NO; hence, the reduction in NH3 has a higher impact towards the overall AP. Hence, scenario 3b with the lower NH3 emissions resulted in lower overall AP despite the higher NO.

4.3. Choice of Substitution Product

The overall GWP from N fertiliser production has been shown to vary according to the type of fertiliser [49,50]. The choice of marginal N fertiliser influences the overall GWP. SO2 and NOx from N fertiliser production contribute to AP. If CAN is replaced, there is a GWP reduction of 7.9 kg CO2 eq., and when UAN is replaced, there is a 5.5 kg CO2 eq. reduction. The use of SSP instead of TSP resulted in less evident differences across all impact categories. The main source of GWP for TSP is the production of phosphoric acid. The production of SSP had almost 11% higher GWP compared to TSP; hence, choosing SSP as the marginal fertiliser would result in almost 1 kg CO2 eq. higher GWP per functional unit. Similarly, AP from the production of SSP was almost 28% higher compared to TSP; hence, choosing SSP as a marginal product is beneficial. The production of phosphoric and sulphuric acids for TSP and SSP, respectively, were the main sources for emissions contributing to AP. The choice of marginal N fertiliser had a higher variation compared to that of P fertiliser for all impact categories. The lowest level of variation was observed for OFP, similar to the findings of Petersen [35].
When compost can replace peat, it leads to a substantially lower GWP of the produced compost. CO2 emissions from peat are considered to be derived from fossil CO2 because carbon accumulation occurs over a long period of time [28]. AP, OFP, and ODP are only slightly affected by peat.
A higher GWP saving of almost 8 kg CO2 eq. was observed for scenario 3c compared to scenario 3a. The higher GWP savings can be attributed to the lower compost bulk density of almost 5 kg/m3 as a result of increasing the share of voluminous green cut waste with a higher C/N ratio.

5. Conclusions

For this study, scenarios were used to investigate the influence of management practices and modelling choices on the CLCA results of a composting system. The scenarios investigating the influence of biowaste composition (i.e., various ratios of biowaste and green cut waste) revealed that a 28% increase in the share of green cut waste had reduced the environmental impacts by 15% for GWP, 6% for AP, 16% for OFP, and 2% for ODP compared to the default scenario. Looking at the role of turning frequency, it was observed that the frequent turning resulted in almost 14% lower GWP for a 3-day turning frequency and a 52% lower GWP for daily turning frequency, whereas for AP, there was an increase of 14% for daily turning and 3% for 3 day turning. Similarly, for OFP, there was an increase of 22% and 5% for 1 day and 3 day, respectively. The optimal and inadequate maintenance scenarios revealed that the former results in a 4% lower GWP and 5% lower AP, whereas ODP and OFP were 7 and 4% higher compared to the default scenario.
The scenarios used to assess the influence of selecting alternative marginal products revealed that variation from the default scenario was higher across all investigated impact categories for the N fertilisers compared to the P fertilisers. From the two scenarios used to assess the influence of the bulk density of peat, it was observed that selecting the peat with the higher density strongly influenced the overall GWP of the composting system.
One of the main limitations of the present study was the availability of data for the emissions occurring during composting for the scenarios. The use of emission factors was not always plausible, as the process parameters in the respective scenarios may vary, which leads to an unknown level of uncertainty.

Author Contributions

Conceptualisation, B.J. and H.S.; methodology, H.S.; software, B.J.; investigation, B.J.; writing—original draft preparation, B.J. and H.S.; writing—review and editing, H.S.; visualisation, B.J. All authors have read and agreed to the published version of the manuscript.

Funding

This research received no external funding.

Institutional Review Board Statement

Not applicable.

Informed Consent Statement

Not applicable.

Data Availability Statement

The authors confirm that the data supporting the findings of this study are available within the article. The raw data of this study is available from the corresponding author upon reasonable request.

Acknowledgments

We would like to thank the two anonymous reviewers for their comments, which helped to improve the manuscript. The authors acknowledge the financial support they received from the Federal Ministry of Education and Research of Germany (BMBF) in the framework of the project RUN–“Rural Urban Nutrient Partnership”.

Conflicts of Interest

The authors declare no conflict of interest.

References

  1. Allesch, A.; Brunner, P.H. Assessment methods for solid waste management: A literature review. Waste Manag. Res. 2014, 32, 461–473. [Google Scholar] [CrossRef] [PubMed]
  2. Vergara, S.E.; Silver, W.L. Greenhouse gas emissions from windrow composting of organic wastes: Patterns and emissions factors. Environ. Res. Lett. 2019, 14, 124027. [Google Scholar] [CrossRef]
  3. Dhamodharan, K.; Varma, V.S.; Veluchamy, C.; Pugazhendhi, A.; Rajendran, K. Emission of volatile organic compounds from composting: A review on assessment, treatment and perspectives. Sci. Total Environ. 2019, 695, 133725. [Google Scholar] [CrossRef] [PubMed]
  4. Sayara, T.; Sánchez, A. Gaseous Emissions from the Composting Process: Controlling Parameters and Strategies of Mitigation. Processes 2021, 9, 1844. [Google Scholar] [CrossRef]
  5. UBA. Aufwand und Nutzen Einer Optimierten Bioabfallverwertung Hinsichtlich Energieeffizienz, Klima- und Ressourcenschutz, Dessau-Roßlau, 2010. Available online: https://www.umweltbundesamt.de/sites/default/files/medien/461/publikationen/4010_0.pdf (accessed on 15 October 2023).
  6. Waqas, M.; Nizami, A.S.; Aburiazaiza, A.S.; Barakat, M.A.; Rashid, M.I.; Ismail, I. Optimizing the process of food waste compost and valorizing its applications: A case study of Saudi Arabia. J. Clean. Prod. 2018, 176, 426–438. [Google Scholar] [CrossRef]
  7. Colón, J.; Martínez-Blanco, J.; Gabarrell, X.; Rieradevall, J.; Font, X.; Artola, A.; Sánchez, A. Performance of an industrial biofilter from a composting plant in the removal of ammonia and VOCs after material replacement. J. Chem. Technol. Biotechnol. 2009, 84, 1111–1117. [Google Scholar] [CrossRef]
  8. Aziz, R.; Chevakidagarn, P.; Danteravanich, S. Composting system improvement by life cycle assessment approach on community composting of agricultural and agro industrial wastes. Indones. J. Environ. Manag. Sustain. 2018, 3, 69–75. [Google Scholar] [CrossRef]
  9. Lam, K.L.; Solon, K.; Jia, M.; Volcke, E.I.P.; van der Hoek, J.P. Life Cycle Environmental Impacts of Wastewater-Derived Phosphorus Products: An Agricultural End-User Perspective. Environ. Sci. Technol. 2022, 56, 10289–10298. [Google Scholar] [CrossRef]
  10. Ekvall, T.; Weidema, B.P. System boundaries and input data in consequential life cycle inventory analysis. Int. J. Life Cycle Assess. 2004, 9, 161–171. [Google Scholar] [CrossRef]
  11. Andreasi Bassi, S.; Christensen, T.H.; Damgaard, A. Environmental performance of household waste management in Europe—An example of 7 countries. Waste Manag. 2017, 69, 545–557. [Google Scholar] [CrossRef]
  12. Hansen, R.N.; Rasmussen, F.N.; Ryberg, M.; Birgisdottir, H. Wood as a carbon mitigating building material: A review of consequential LCA and biogenic carbon characteristics. IOP Conf. Ser. Earth Environ. Sci. 2022, 1078, 12066. [Google Scholar] [CrossRef]
  13. Weidema, B.P.; Ekvall, T.; Heijungs, R. Guidelines for application of deepened and broadened LCA. Deliv. D18 Work. Package 2009, 5, 17. [Google Scholar]
  14. Kranert, M.; Cord-Landwehr, K. Sammlung und Transport. In Einführung in Die Abfallwirtschaft; Kranert, M., Cord-Landwehr, K., Eds.; Vieweg+Teubner: Wiesbaden, Germany, 2010; pp. 91–133. ISBN 978-3-8351-0060-2. [Google Scholar]
  15. Friedrich, J. Nachhaltigkeitsbewertung von Systemalternativen zur Transformation des Wasser-Energie-Nexus im Städtischen Gebäudebestand; Karlsruhe Institute of Technology: Karlsruhe, Germany, 2020. [Google Scholar]
  16. Kranert, M.; Cord-Landwehr, K. Biologische Verfahren. In Einführung in Die Abfallwirtschaft; Kranert, M., Cord-Landwehr, K., Eds.; Vieweg+Teubner: Wiesbaden, Germany, 2010; pp. 185–291. ISBN 978-3-8351-0060-2. [Google Scholar]
  17. Sánchez, A.; Artola, A.; Font, X.; Gea, T.; Barrena, R.; Gabriel, D.; Sánchez-Monedero, M.Á.; Roig, A.; Cayuela, M.L.; Mondini, C. Greenhouse gas emissions from organic waste composting. Environ. Chem. Lett. 2015, 13, 223–238. [Google Scholar] [CrossRef]
  18. Epstein, E. Industrial Composting: Environmental Engineering and Facilities Management; CRC Press: Boca Raton, FL, USA, 2011; ISBN 9781439845318. [Google Scholar]
  19. UBA. Ermittlung der Emissionssituation Bei der Verwertung Von Bioabfällen. Available online: https://www.umweltbundesamt.de/sites/default/files/medien/378/publikationen/texte_39_2015_ermittlung_der_emissionssituation_bei_der_verwertung_von_bioabfaellen.pdf (accessed on 10 September 2021).
  20. RAL. RAL-GZ 251, Güte-und Prüfbestimmungen für Kompost; Deutsches Institut für Gütesicherungund Kennzeichnung e.V: Berlin, Germany, 2007. [Google Scholar]
  21. Wernet, G.; Bauer, C.; Steubing, B.; Reinhard, J.; Moreno-Ruiz, E.; Weidema, B. The ecoinvent database version 3 (part I): Overview and methodology. Int. J. Life Cycle Assess. 2016, 21, 1218–1230. [Google Scholar] [CrossRef]
  22. Laurent, A.; Clavreul, J.; Bernstad, A.; Bakas, I.; Niero, M.; Gentil, E.; Christensen, T.H.; Hauschild, M.Z. Review of LCA studies of solid waste management systems–part II: Methodological guidance for a better practice. Waste Manag. 2014, 34, 589–606. [Google Scholar] [CrossRef] [PubMed]
  23. Stichnothe, H.; Schuchardt, F. Comparison of different treatment options for palm oil production waste on a life cycle basis. Int. J. Life Cycle Assess. 2010, 15, 907–915. [Google Scholar] [CrossRef]
  24. Luo, Y.; Stichnothe, H.; Schuchardt, F.; Li, G.; Huaitalla, R.M.; Xu, W. Life cycle assessment of manure management and nutrient recycling from a Chinese pig farm. Waste Manag. Res. 2014, 32, 4–12. [Google Scholar] [CrossRef]
  25. Clemens, J.; Cuhls, C. Greenhouse gas emissions from mechanical and biological waste treatment of municipal waste. Environ. Technol. 2003, 24, 745–754. [Google Scholar] [CrossRef]
  26. Hansen, T.L.; Bhander, G.S.; Christensen, T.H.; Bruun, S.; Jensen, L.S. Life cycle modelling of environmental impacts of application of processed organic municipal solid waste on agricultural land (EASEWASTE). Waste Manag. Res. 2006, 24, 153–166. [Google Scholar] [CrossRef]
  27. Sardarmehni, M.; Levis, J.W.; Barlaz, M.A. What Is the Best End Use for Compost Derived from the Organic Fraction of Municipal Solid Waste? Environ. Sci. Technol. 2021, 55, 73–81. [Google Scholar] [CrossRef]
  28. Boldrin, A.; Hartling, K.R.; Laugen, M.; Christensen, T.H. Environmental inventory modelling of the use of compost and peat in growth media preparation. Resour. Conserv. Recycl. 2010, 54, 1250–1260. [Google Scholar] [CrossRef]
  29. Stichnothe, H. Life cycle assessment of peat for growing media and evaluation of the suitability of using the Product Environmental Footprint methodology for peat. Int. J. Life Cycle Assess. 2022, 27, 1270–1282. [Google Scholar] [CrossRef]
  30. Kokkora, M.I. Biowaste and Vegetable Waste Compost Application to Agriculture; Cranfield University: Cranfield, UK, 2008. [Google Scholar]
  31. Huijbregts, M.A.J.; Steinmann, Z.J.N.; Elshout, P.M.F.; Stam, G.; Verones, F.; Vieira, M.; Zijp, M.; Hollander, A.; van Zelm, R. ReCiPe2016: A harmonised life cycle impact assessment method at midpoint and endpoint level. Int. J. Life Cycle Assess. 2017, 22, 138–147. [Google Scholar] [CrossRef]
  32. Tonini, D.; Hamelin, L.; Wenzel, H.; Astrup, T. Bioenergy production from perennial energy crops: A consequential LCA of 12 bioenergy scenarios including land use changes. Environ. Sci. Technol. 2012, 46, 13521–13530. [Google Scholar] [CrossRef] [PubMed]
  33. de Vries, J.W.; Groenestein, C.M.; de Boer, I.J.M. Environmental consequences of processing manure to produce mineral fertilizer and bio-energy. J. Environ. Manage. 2012, 102, 173–183. [Google Scholar] [CrossRef]
  34. Ahlgren, S.; Baky, A.; Bernesson, S.; rdberg, Å.; Norén, O.; Hansson, P.-A. Green Nitrogen-Possibilities for Production of Mineral Nitrogen Fertilisers Based on Renewable Resources in Sweden, 2011. Available online: https://pub.epsilon.slu.se/13703/11/ahlgren_s_et_al_161230.pdf (accessed on 11 November 2023).
  35. Petersen, B.M. Life Cycle Assessment of Slurry Management Technologies, 2009. Available online: https://www2.mst.dk/udgiv/publications/2009/978-87-92548-20-7/pdf/978-87-92548-21-4.pdf (accessed on 11 November 2023).
  36. Weidema, B.P. Market Information in LCA, Environmental Project no. 863. Dan. Environ. Prot. Agency Cph. Den. 2003. Available online: https://www2.mst.dk/Udgiv/publications/2003/87-7972-991-6/pdf/87-7972-992-4.pdf (accessed on 11 November 2023).
  37. Nemecek, T.; Kägi, T.; Blaser, S. Life cycle inventories of agricultural production systems. Final Rep. Ecoinvent 2007, 15, 1–360. [Google Scholar]
  38. Pagans, E.; Font, X.; Sánchez, A. Biofiltration for ammonia removal from composting exhaust gases. Chem. Eng. J. 2005, 113, 105–110. [Google Scholar] [CrossRef]
  39. Helm, M. Prozeßführung Bei der Kompostierung von Organischen Reststoffen Aus Haushalten; Technische Universität München: München, Germany, 1995. [Google Scholar]
  40. Cuhls, C. Schadstoffbilanzierung und Emissionsminderung Bei der Mechanisch-Biologischen Abfallbehandlung; ISAH: Hannover, Germany, 2001; ISBN 3921421438. [Google Scholar]
  41. Amlinger, F.; Peyr, S.; Cuhls, C. Green house gas emissions from composting and mechanical biological treatment. Waste Manag. Res. 2008, 26, 47–60. [Google Scholar] [CrossRef]
  42. Nguyen, T.P.; Cuhls, C. Methane removal using materials from biofilters at composting plants. J. Vietnam. Environ. 2018, 10, 22–26. [Google Scholar] [CrossRef]
  43. Konstantzos, G.E.; Malamis, D.; Sotiropoulos, A.; Loizidou, M. Environmental profile of an innovative household biowaste dryer system based on Life Cycle Assessment. Waste Manag. Res. 2019, 37, 48–58. [Google Scholar] [CrossRef] [PubMed]
  44. Sommer, S.G.; Moller, H.B. Emission of greenhouse gases during composting of deep litter from pig production–effect of straw content. J. Agric. Sci. 2000, 134, 327–335. [Google Scholar] [CrossRef]
  45. He, Y.; Inamori, Y.; Mizuochi, M.; Kong, H.; Iwami, N.; Sun, T. Nitrous oxide emissions from aerated composting of organic waste. Environ. Sci. Technol. 2001, 35, 2347–2351. [Google Scholar] [CrossRef] [PubMed]
  46. Czekała, W.; Janczak, D.; Pochwatka, P.; Nowak, M.; Dach, J. Gases Emissions during Composting Process of Agri-Food Industry Waste. Appl. Sci. 2022, 12, 9245. [Google Scholar] [CrossRef]
  47. Chadwick, D. Emissions of ammonia, nitrous oxide and methane from cattle manure heaps: Effect of compaction and covering. Atmos. Environ. 2005, 39, 787–799. [Google Scholar] [CrossRef]
  48. Phong, N.T. Greenhouse Gas Emissions from Composting and Anaerobic Digestion Plants. Ph.D. Thesis, Rheinischen Friedrich-Wilhelms University of Bonn, Bonn, Germany, 2012. Available online: https://bonndoc.ulb.uni-bonn.de/xmlui/bitstream/handle/20.500.11811/5130/3002.pdf (accessed on 11 November 2023).
  49. Althaus, H.-J.; Chudacoff, M.; Hischier, R.; Jungbluth, N.; Osses, M.; Primas, A. Life Cycle Inventories of Chemicals: Ecoinvent Report No. 8, v2.0., 2007. Available online: https://db.ecoinvent.org/reports/08_Chemicals.pdf (accessed on 11 November 2023).
  50. Liu, X.; Elgowainy, A.; Wang, M. Life cycle energy use and greenhouse gas emissions of ammonia production from renewable resources and industrial by-products. Green Chem. 2020, 22, 5751–5761. [Google Scholar] [CrossRef]
Figure 1. Schematic representation of the assessed system. The dotted lines denote the connection with the materials that are substituted and sources for environmental credits.
Waste 01 00053 g001
Figure 2. Share of each composting process towards the total emissions for the impact categories GWP, AP, OFP, and ODP.
Waste 01 00053 g002
Figure 3. (a) Percentage change in respective emissions compared to the default scenario 1a for the midpoint impact categories GWP, AP, OFP, and ODP; (b) detailed overview of processes that show variation in each scenario for GWP.
Waste 01 00053 g003
Figure 4. (a) Percentage change in respective emissions compared to the default scenario 2a for the midpoint impact categories GWP, AP, OFP, and ODP; (b) detailed overview of processes that show variation in each scenario for GWP.
Waste 01 00053 g004
Figure 5. Percentage change in respective emissions compared to the default scenario 3a for the midpoint impact categories GWP, AP, OFP, and ODP for the biofilter maintenance scenario.
Waste 01 00053 g005
Figure 6. Comparison between the default scenarios and (a) alternative fertiliser options and (b) alternative peat density options for the midpoint impact categories GWP, AP, OFP, and ODP.
Waste 01 00053 g006
Table 1. List of single-nutrient fertiliser datasets available in the Ecoinvent database. The respective nutrient contents are given in brackets (adapted from Petersen [35]).
N FertiliserP FertiliserK Fertiliser
Ammonium Nitrate (35% N)Single Superphosphate (21% P2O5)Potassium Chloride (60% K2O)
Ammonium Sulphate (21% N)Triple Superphosphate (48% P2O5)Potassium Sulphate (50% K2O)
Calcium Ammonium Nitrate (26.5% N)
Calcium Nitrate (11.86% N)
Urea Ammonium Nitrate (32% N)
Urea (46% N)
Table 2. Description of scenario groups 1 to 5. UAN: Urea Ammonium Nitrate, CAN: Calcium Ammonium Nitrate, TSP: Triple SuperPhosphate, SSP: Single SuperPhosphate.
DefaultAlternate ScenarioAlternate Scenario
SG1: Mixing ratio (BW:GW)1a: 70:301b: 60:401c: 90:10
SG2: Turning frequency2a: 7-day interval2b: 3-day interval2c: 1-day interval
SG3: Biofilter maintenance3a: Default maintenance3b: Optimal maintenance3c: Inadequate maintenance
SG4: Fertiliser substitution4a: UAN/ TSP4b: CAN/ TSP4c: UAN/ SSP
SG5: Peat substitution5a: Unspecified peat5b: White peat5c: Black peat
Table 3. Material properties and emission factors (EF) scenario groups 1 to 3.
Mixing Ratio (BW:GW)C/N RatioMoisture ContentEF_CH4 EF_N2OEF_NH3
Unit %g/t FM g/t FM g/t FM
SG1: Composition
1a. 70:30 scenario70:302961.3120062.022.9
1b. 60:40 scenario60:403160.0120061.322.6
1c. 90:10 scenario90:102464.0120063.423.4
SG2: Turning frequency
2a. 7-day interval70:302961.3120062.022.9
2b. 1-day interval70:302961.339368.033.0
2c. 3-day interval70:302961.3879110.025.0
SG3: Biofilter maintenance
3a. default maintenance70:302961.3120062.022.9
3b. Optimal maintenance70:302961.3113564.017.0
3c. Inadequate maintenance70:302961.3126759.033.0
Table 4. LCA results for the impact categories GWP, AP, OFP, and ODP for the default composting system investigated. All values for environmental impacts are per functional unit.
GWP (kg CO2 eq.)AP (kg SO2 eq.)OFP (kg NOx eq.)ODP (kg CFC11 eq.)
Emissions
Collection22.40.060.152 × 10−5
Pre-treatment2.70.010.002 × 10−6
Composting
Intensive composting43.00.060.093 × 10−4
Maturation20.90.040.024 × 10−4
Storage2.80.000.013 × 10−5
Credits
N fertiliser replacement−5.40.01−0.01−9 × 10⁻⁵
P fertiliser replacement−3.1−0.03−0.01−1 × 10⁻⁶
K fertiliser replacement−5.60.02−0.01−8 × 10⁻⁵
Peat replacement−112.5−0.03−0.08−2 × 10⁻⁵
Net impact−34.80.140.155 × 10−4
Disclaimer/Publisher’s Note: The statements, opinions and data contained in all publications are solely those of the individual author(s) and contributor(s) and not of MDPI and/or the editor(s). MDPI and/or the editor(s) disclaim responsibility for any injury to people or property resulting from any ideas, methods, instructions or products referred to in the content.

