Analytical Evaluation of Performance of Cricket Squad by ANP-DEA †
Abstract
:1. Introduction
2. Methodology
- The weights of the criteria are determined without considering the interdependency between them, and the weight of the criterion matrix is represented by J1.
- The weights of the sub-criteria are determined without considering the interdependency between them, and the weight of the sub-criterion matrix is represented by J2.
- Now, interdependency among criteria is introduced. The weight of the criteria relative to each criterion is represented by J3, and the final priority of the criteria is given by J5 = J1 * J3.
- Similarly, interdependency among sub-criteria is introduced. The weight of the sub-criteria relative to each sub-criterion is represented by J4, and the final priority of the criteria is given by J6 = J2 * J4.
- The final priorities of the criteria are given by the multiplication of matrix J5 * J6.
- The weights of the alternatives are given by the sum of the final priorities of each alternative that we obtain in Step 6.
3. Conclusions
Author Contributions
Funding
Institutional Review Board Statement
Informed Consent Statement
Data Availability Statement
Acknowledgments
Conflicts of Interest
References
- Bailey, M.J.; Clarke, S.R. Market inefficiencies in player head to head betting on the 2003 cricket world cup. In Economics, Management and Optimization in Sport; Butenko, S., Gil-Lafuente, J., Eds.; Springer: Berlin/Heidelberg, Germany, 2004; pp. 185–202. [Google Scholar]
- Bailey, M.J.; Clarke, S.R. Predicting the match outcome in one day international cricket matches, while the match is in progress. J. Sci. Sport. Med. 2006, 5, 480–487. [Google Scholar]
- Barr, G.D.I.; Kantor, B.S. A criterion for comparing and selecting batsmen in limited overs cricket. J. Oper. Res. Soc. 2004, 55, 1266–1274. [Google Scholar] [CrossRef]
- Hair, J.F.; Black, W.C.; Babin Anderson, R.E.; Tatham, R.L. Multivariate Data Analysis, 6th ed.; Prentice-Hall: Upper Saddle River, NJ, USA, 2007. [Google Scholar]
- Kimber, A.C.; Hansford, A.R. A statistical analysis of batting in cricket. J. R. Stat. Soc. Ser. A 1993, 156, 443–455. [Google Scholar] [CrossRef]
- Lemmer, H.H. Team selection after a short cricket series. Eur. J. Sport Sci. 2013, 13, 200–206. [Google Scholar] [CrossRef]
- Norman, J.M.; Clarke, S.R. Optimal batting orders in cricket. J. Oper. Res. Soc. 2010, 61, 980–986. [Google Scholar] [CrossRef]
- Preston, I.; Thomas, J. Batting strategy in limited overs cricket. Statistician 2000, 49, 95–106. [Google Scholar] [CrossRef]
- Sharma, S.K. A Factor Analysis Approach in Performance Analysis of T-20 Cricket. J. Reliab. Stat. Stud. 2013, 6, 69–76. [Google Scholar]
- Sharp, G.D.; Brettenny, W.J.; Gonsalves, J.W.; Lourens, M.; Stretch, R.A. Integer optimization for the selection of a Twenty20 cricket team. J. Oper. Res. Soc. 2011, 62, 1688–1694. [Google Scholar] [CrossRef]
- Swartz, T.B.; Gill, P.S.; Muthukumarana, S. Modelling and simulation for one-day cricket. Can. J. Stat. 2009, 37, 143–160. [Google Scholar] [CrossRef]
- Amiri, M.P. Project selection for oil-fields development by using the AHP and fuzzy TOPSIS methods. Expert Syst. Appl. 2010, 37, 6218–6224. [Google Scholar] [CrossRef]
- Saaty, T.L. The Analytic Hierarchy Process; McGraw Hill: New York, NY, USA, 1980. [Google Scholar]
- Saaty, T.; Sodenkamp, M. Making decisions in hierarchic and network systems. Int. J. Appl. Decis. Sci. 2008, 1, 24–79. [Google Scholar] [CrossRef]
- Fallahi, H.; Motadel, M. Quality level appraisal of machinery and related spare part’s suppliers in Lavan oil refining company by Analytic Network Process method. In Proceedings of the International Conference on Management, Tehran, Iran, 7–8 August 2014; Available online: https://civilica.com/doc/344239 (accessed on 1 March 2023).
- Quezada, L.; López-Ospina, H.; Palominos, P.; Oddershede, A. Identifying causal relationships in strategy maps using ANP and DEMATEL. Comput. Ind. Eng. 2018, 118, 70–79. [Google Scholar] [CrossRef]
- Allen, R.; Athanassopoulos, A.; Dyson, R.G.; Thanassoulis, E. Weights restrictions and value judgments in DEA: Evolution, development and future directions. Ann. Oper. Res. 1997, 73, 13–34. [Google Scholar] [CrossRef]
- Banker, R.D.; Charnes, A.; Cooper, W.W. Some models for estimating technical and scale efficiencies in data envelopment analysis. Manag. Sci. 1984, 17, 1078–1092. [Google Scholar] [CrossRef]
- Anderson, P.; Petersen, N.C. A procedure for ranking efficient units in data envelopment analysis. Manag. Sci. 1993, 39, 1261–1264. [Google Scholar] [CrossRef]
- Podinovski, V.V. Side effects of absolute weight bounds in DEA models. Eur. J. Oper. Res. 1999, 115, 583–595. [Google Scholar] [CrossRef]
- Charnes, A.; Cooper, W.W.; Rhodes, E. Measuring the efficiency of decision making units. Eur. J. Oper. Res. 1978, 2, 429–444. [Google Scholar] [CrossRef]
- Farrell, M.J. The measurement of productive efficiency. J. R. Stat. Soc. Ser. A (Gen.) 1957, 121, 231–253. [Google Scholar] [CrossRef]
- Cooper, W.W.; Seiford, L.W.; Zhu, J. Handbook on Data Envelopment Analysis. Springer: New York, NY, USA, 2011; pp. 93–126. [Google Scholar]
- Razipour, S.; Hosseinzadeh Lotfi, F.; Jahanshahloo, G.; Rostamy, M.; Sharafi, M. Finding closest target for bank branches in the presence of weight restrictions using data envelopment analysis. Ann. Oper. Res. 2019, 288, 755–787. [Google Scholar] [CrossRef]


| Intensity | Description | Scale Value |
|---|---|---|
| Equal | A is equally important as B. | 1–2 |
| Moderate | A is a little more important than B. | 3–4 |
| Strong | A is more important than B. | 5–6 |
| Very Strong | A is very much more important than B. | 7–8 |
| Extreme | A is extremely important than B. | 9 |
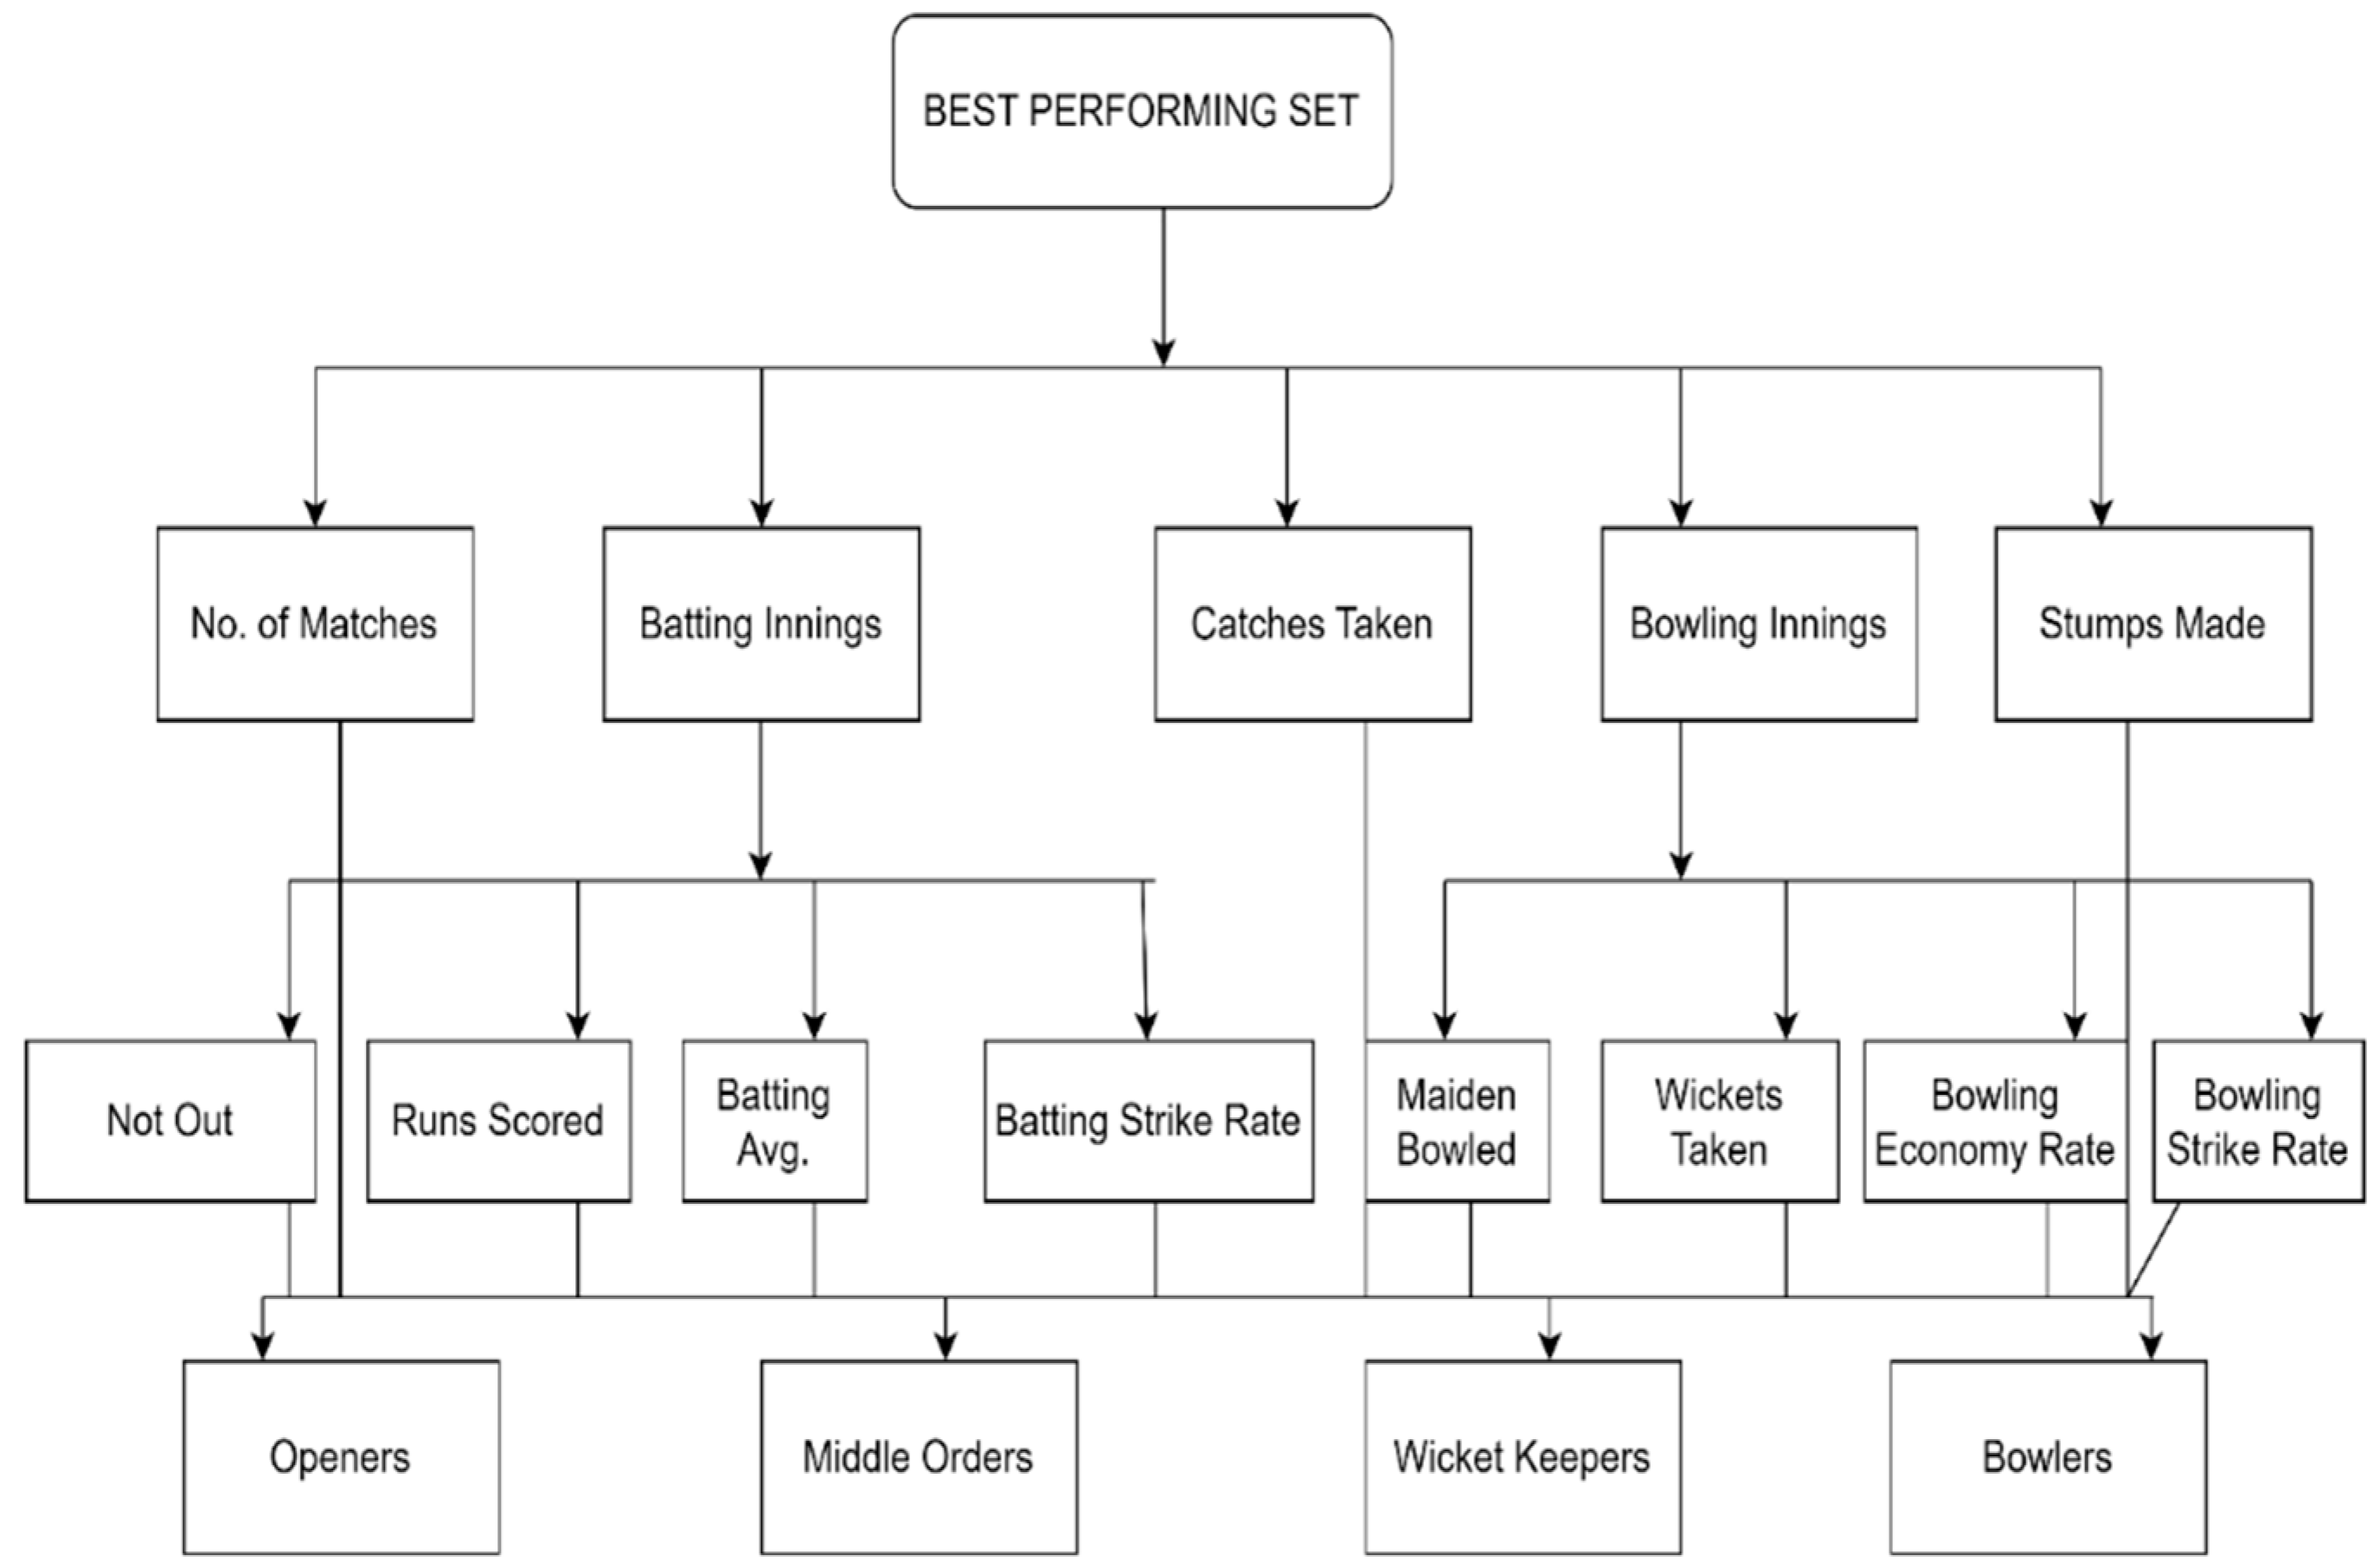
| Criteria | Sub-Criteria | Local Weights | Global Weights |
|---|---|---|---|
| Matches | 0.053 | 0.053 | |
| Batting innings | Not out | 0.06 | 0.01728 |
| Runs scored | 0.146 | 0.042048 | |
| Batting avg. | 0.45 | 0.1296 | |
| Batting strike rate | 0.342 | 0.098496 | |
| Bowling innings | Maiden bowled | 0.056 | 0.006608 |
| Wickets taken | 0.169 | 0.019942 | |
| Bowling economy rate | 0.429 | 0.050622 | |
| Bowling strike rate | 0.344 | 0.040592 | |
| Catches taken | 0.201 | 0.201 | |
| Stumps made | 0.338 | 0.338 |
| Matches | Not out | Runs Scored | Batting Avg. | Batting Strike Rate | Maiden Bowled | Wickets Taken | BCR | BSR | Catches Taken | Stumps Made | |
|---|---|---|---|---|---|---|---|---|---|---|---|
| Middle orders | 0.086 | 0.506 | 0.542 | 0.3 | 0.246 | 0.158 | 0.145 | 0.161 | 0.144 | 0.375 | 0.186 |
| Wicket-keepers | 0.172 | 0.233 | 0.121 | 0.139 | 0.492 | 0.128 | 0.098 | 0.12 | 0.116 | 0.315 | 0.08 |
| Openers | 0.434 | 0.213 | 0.28 | 0.484 | 0.215 | 0.086 | 0.067 | 0.067 | 0.056 | 0.207 | 0.624 |
| Bowlers | 0.307 | 0.046 | 0.055 | 0.075 | 0.046 | 0.626 | 0.688 | 0.65 | 0.682 | 0.1 | 0.107 |
| Matches | Not out | Runs Scored | Batting Avg. | Batting Strike Rate | Maiden Bowled | Wickets Taken | BCR | BSR | Catches Taken | Stumps Made | |
|---|---|---|---|---|---|---|---|---|---|---|---|
| Middle orders | 0.005 | 0.009 | 0.023 | 0.039 | 0.024 | 0.001 | 0.003 | 0.008 | 0.006 | 0.075 | 0.063 |
| Wicket-keepers | 0.009 | 0.004 | 0.005 | 0.018 | 0.048 | 0.001 | 0.002 | 0.006 | 0.005 | 0.063 | 0.027 |
| Openers | 0.023 | 0.004 | 0.012 | 0.063 | 0.021 | 0.001 | 0.001 | 0.003 | 0.002 | 0.042 | 0.211 |
| Bowlers | 0.016 | 0.001 | 0.002 | 0.010 | 0.005 | 0.004 | 0.014 | 0.033 | 0.028 | 0.020 | 0.036 |
| Weights | |
|---|---|
| Middle orders | 0.255376 |
| Wicket-keepers | 0.188643 |
| Openers | 0.382447 |
| Bowlers | 0.16834 |
Disclaimer/Publisher’s Note: The statements, opinions and data contained in all publications are solely those of the individual author(s) and contributor(s) and not of MDPI and/or the editor(s). MDPI and/or the editor(s) disclaim responsibility for any injury to people or property resulting from any ideas, methods, instructions or products referred to in the content. |
© 2023 by the authors. Licensee MDPI, Basel, Switzerland. This article is an open access article distributed under the terms and conditions of the Creative Commons Attribution (CC BY) license (https://creativecommons.org/licenses/by/4.0/).
Share and Cite
Garg, S.; Bhardwaj, R. Analytical Evaluation of Performance of Cricket Squad by ANP-DEA. Comput. Sci. Math. Forum 2023, 7, 19. https://doi.org/10.3390/IOCMA2023-14389
Garg S, Bhardwaj R. Analytical Evaluation of Performance of Cricket Squad by ANP-DEA. Computer Sciences & Mathematics Forum. 2023; 7(1):19. https://doi.org/10.3390/IOCMA2023-14389
Chicago/Turabian StyleGarg, Shanky, and Rashmi Bhardwaj. 2023. "Analytical Evaluation of Performance of Cricket Squad by ANP-DEA" Computer Sciences & Mathematics Forum 7, no. 1: 19. https://doi.org/10.3390/IOCMA2023-14389
APA StyleGarg, S., & Bhardwaj, R. (2023). Analytical Evaluation of Performance of Cricket Squad by ANP-DEA. Computer Sciences & Mathematics Forum, 7(1), 19. https://doi.org/10.3390/IOCMA2023-14389


