
Examination of Cardiac Activity with ECG Monitoring Using Heart Rate Variability Methods


Abstract
1. Introduction
The Purpose of This Article
- The study of the possibility of the quantitative assessment and visual display of cardiovascular activity when applying linear, non-linear, and graphic mathematical methods.
- The evaluation of the effectiveness of the methods was conducted by applying statistical analysis in the study of three different cardiac conditions: healthy, arrhythmia, and syncope.
2. Materials and Methods
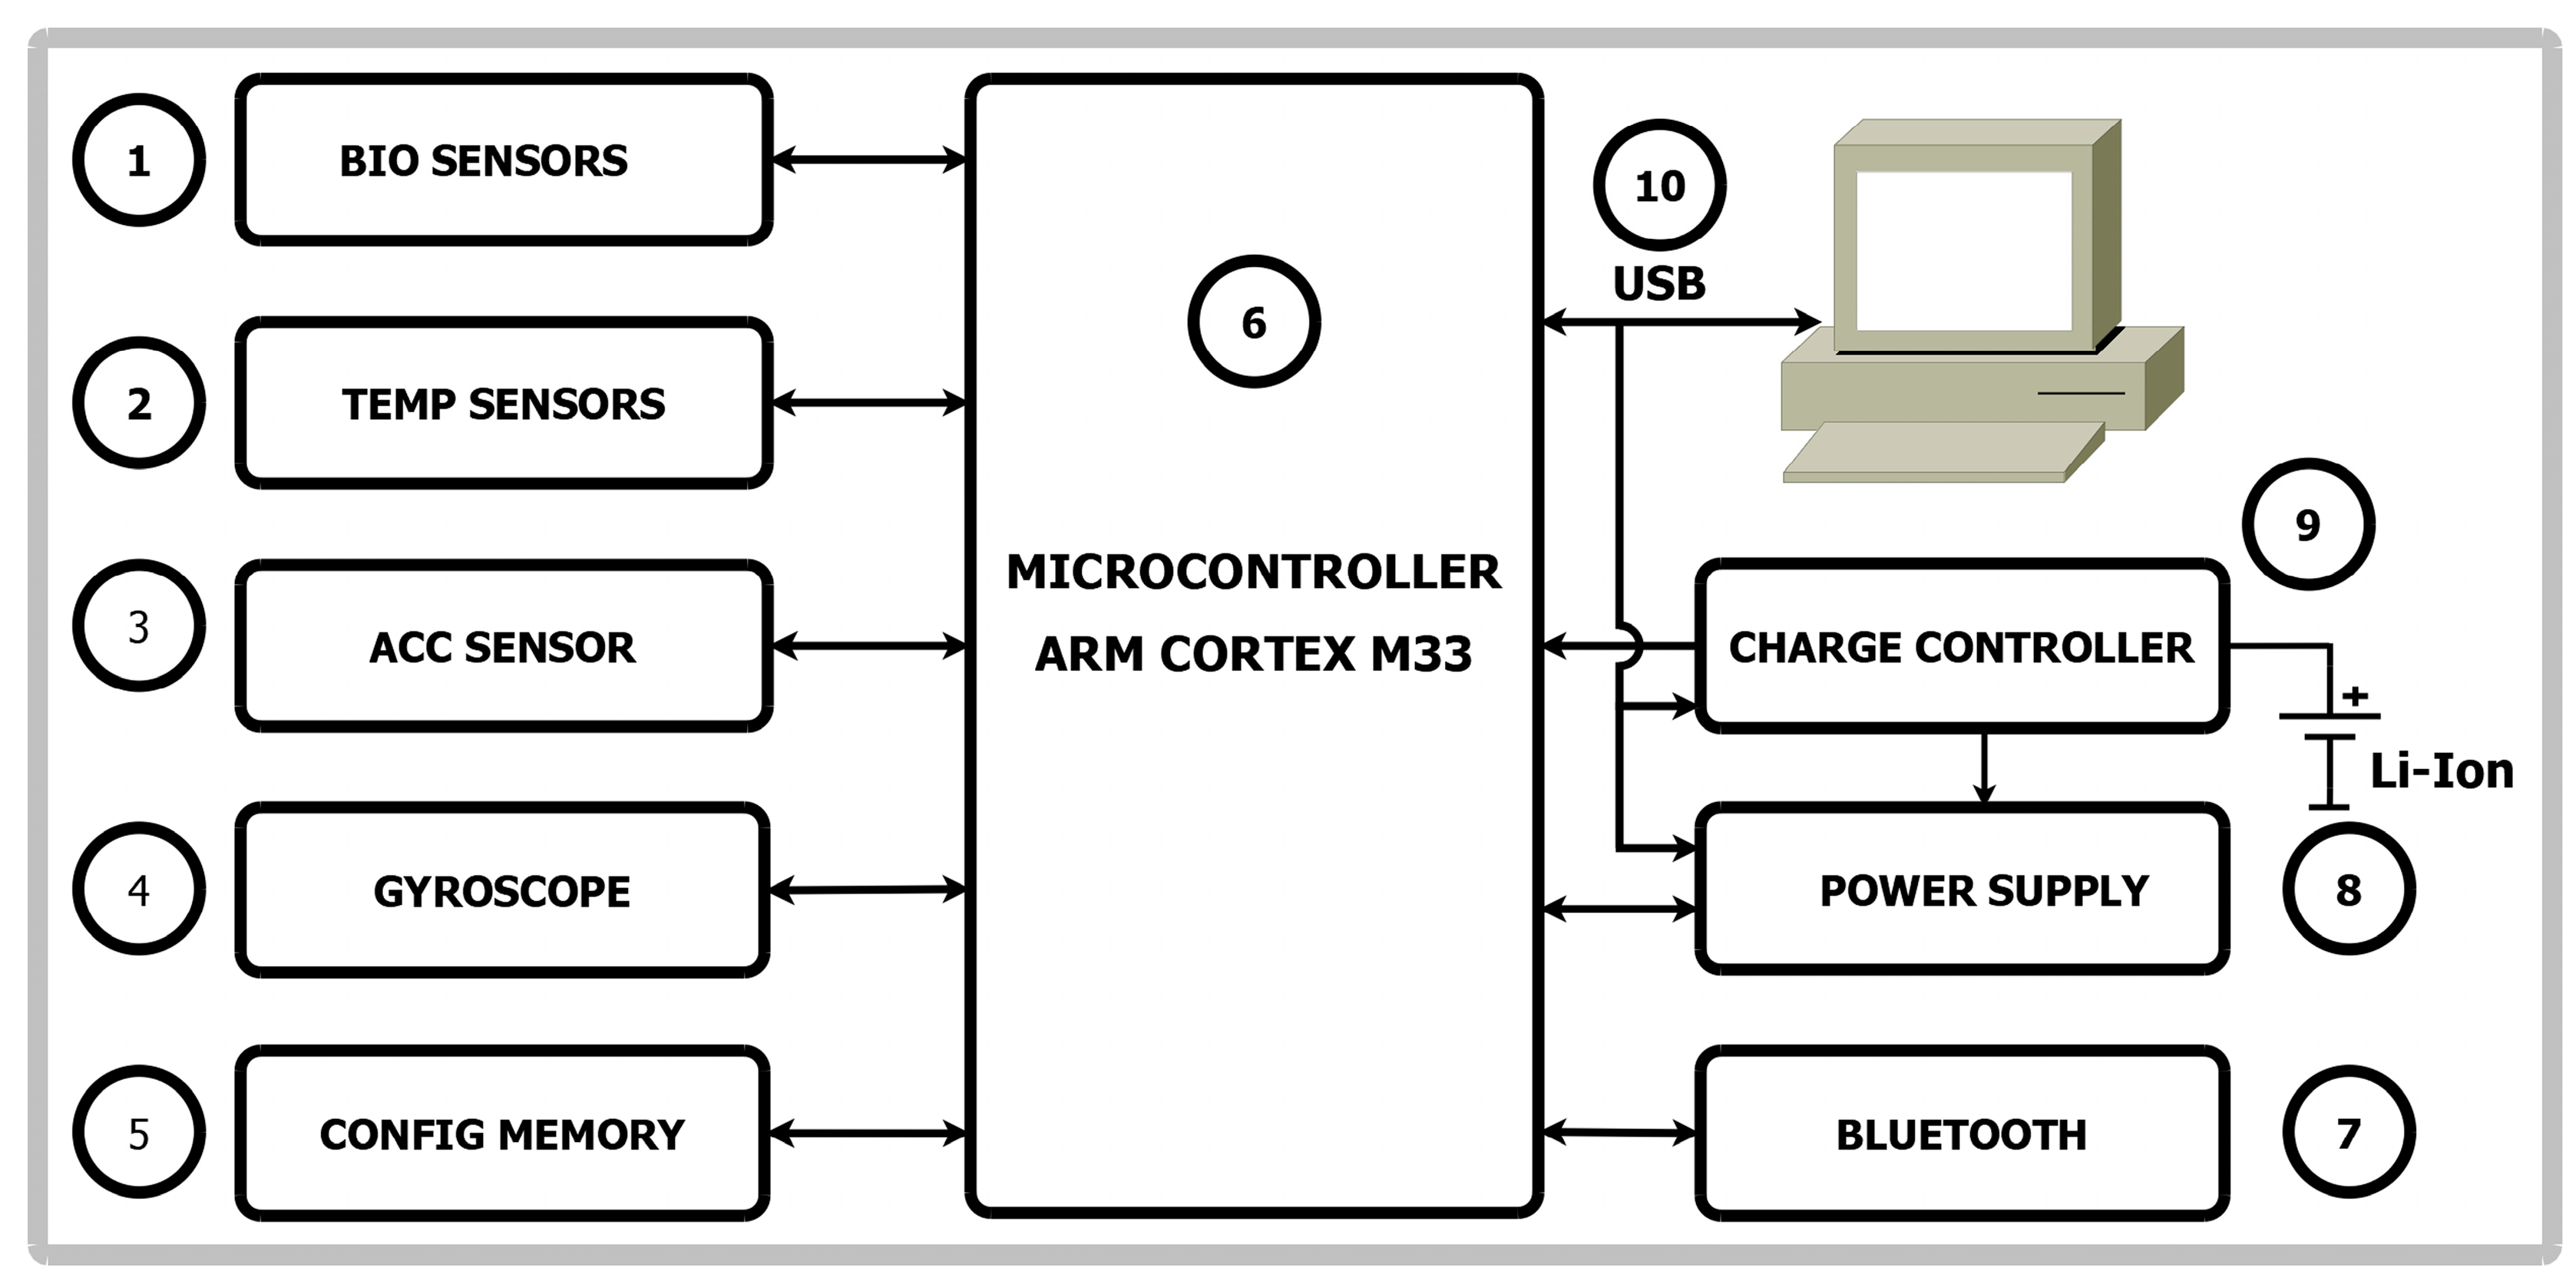
2.1. Device for Cardio Signals
- Biosignal sensors including optical sensors for PPG and SPO2, single-lead ECG sensor.
- Two temperature sensors—one for measuring body temperature and another for measuring ambient temperature.
- Accelerometer—provides data on body movement.
- Gyroscope—a sensor for determining the orientation of the body.
- Configuration memory for settings, calibration constants, device operating modes, etc.
- Microcontroller—a microcontroller with a Cortex M33 core (ST Microelectronics, Plan-les-Ouates, Switzerland) was selected with relatively large RAM (random-access memory)—2.5MiB—and nonvolatile memory (FLASH)—4MiB. This enables system expansion in the future.
- For connection to phones, tablets, personal computers, etc., Bluetooth interface is used.
- The power supply unit provides the necessary voltage and current for the operation of a system.
- Charge controller for the built-in Li-ION/Li-POL battery.
- A USB interface is used to connect to personal computers and charge the battery.
2.2. Analysis Methods Used
- K—number of blocks;
- f—frequency;
- i—index of the current window;
- is a modified periodogram for the i-th window of the time series [19]:
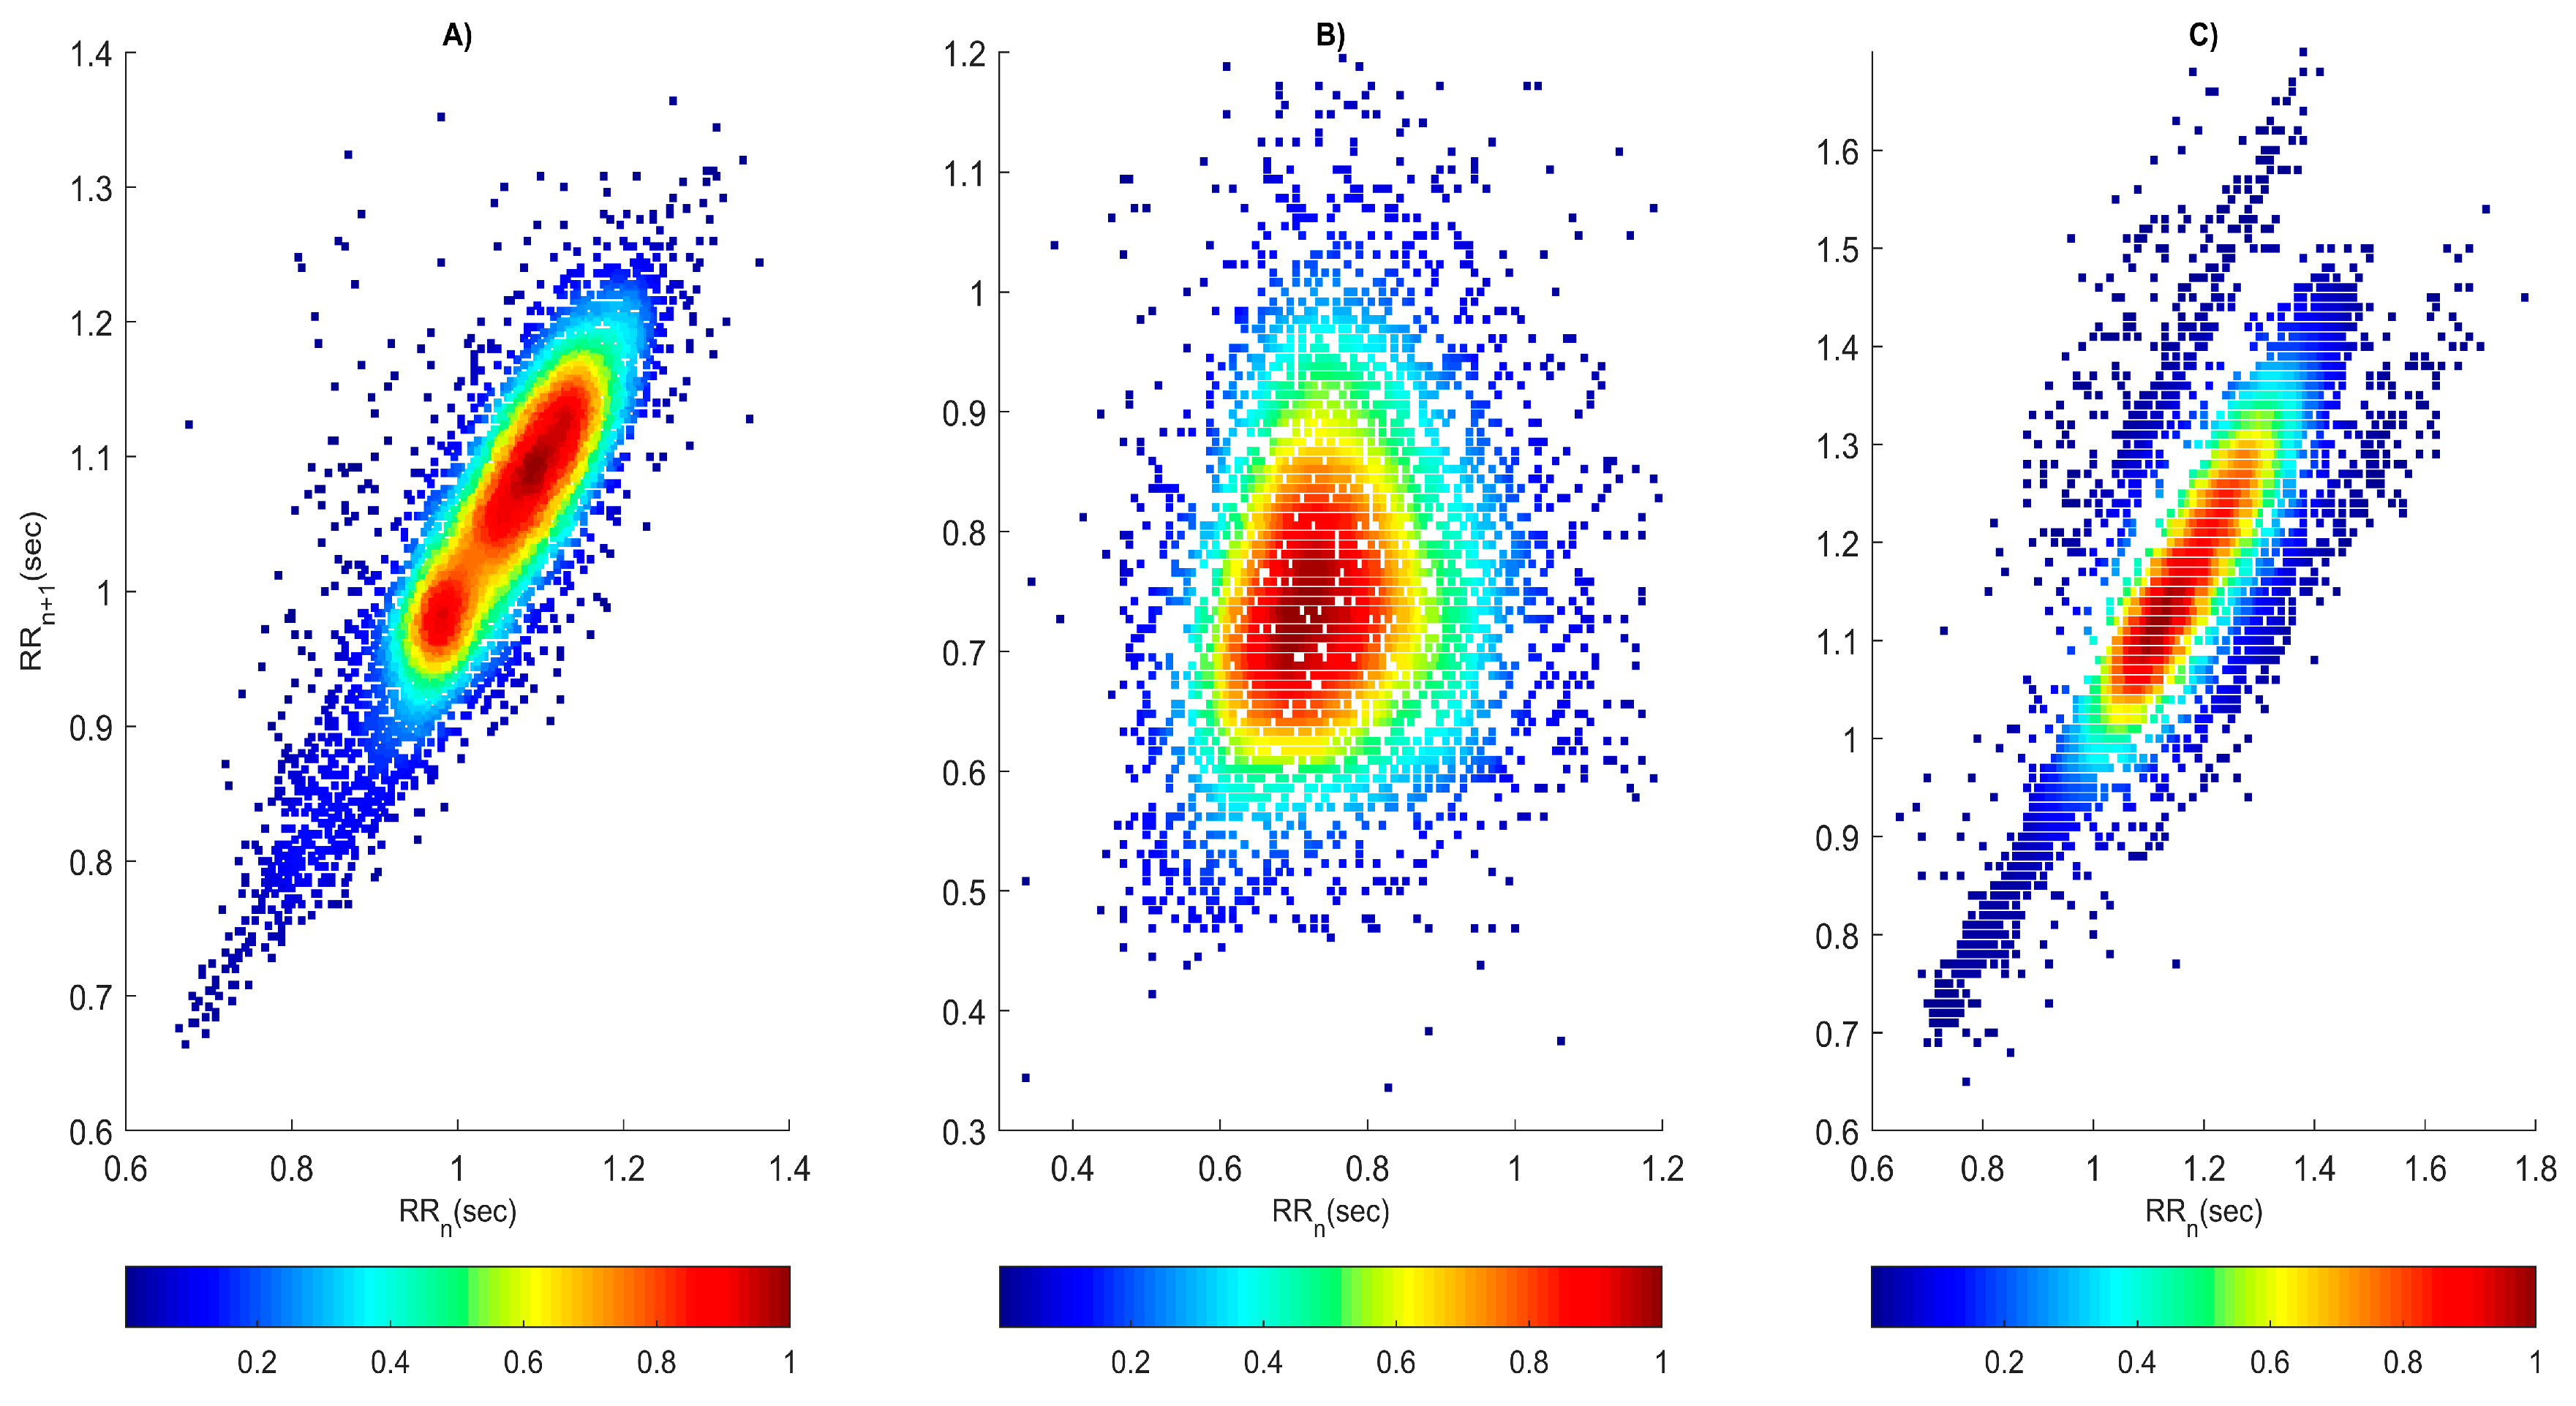
- Heart rate visualization: The method provides a graphical visualization of heart rate variations. Each pair of RR intervals includes the current state RR(n) and the next state RR(n + 1) and is represented by a point in a rectangular coordinate system. Various states of cardiac activity can be identified by the shapes of the obtained graphic images. The chart in a healthy individual has the shape of a comet, while in an arrhythmia it is a fan, and in syncope a torpedo or consisting of several segments. Asymmetry of the image can provide information about non-uniformity in the heart rhythm and possible abnormalities.
- Assessment of the autonomic nervous system: The Poincaré plot can provide information on the balance between the sympathetic and parasympathetic nervous systems. This is important for understanding cardiac regulation and for assessing autonomic nervous system function. During physical exertion, mental stress, and cardiovascular diseases, the activity of the sympathetic nervous system increases, which is expressed by an increase in heart rate and a decrease in HRV.
- Quantitative assessment of heart rate variability [28,29,30]: The method offers quantitative parameters for HRV assessment, such as SD1 (Standard Deviation 1) and SD2 (Standard Deviation 2). These two parameters are a measure of short-term and long-term HRV and can be useful for assessing the risk of various diseases, monitoring the effectiveness of treatment, as well as for the balance between the sympathetic and parasympathetic nervous systems. Higher values of SD1 and SD2 are generally associated with greater cardiac variability and better health, while lower values may be indicative of abnormalities in cardiac or autonomic nervous system function. However, these parameters must be interpreted in the context of the individual patient and their accompanying factors and symptoms.
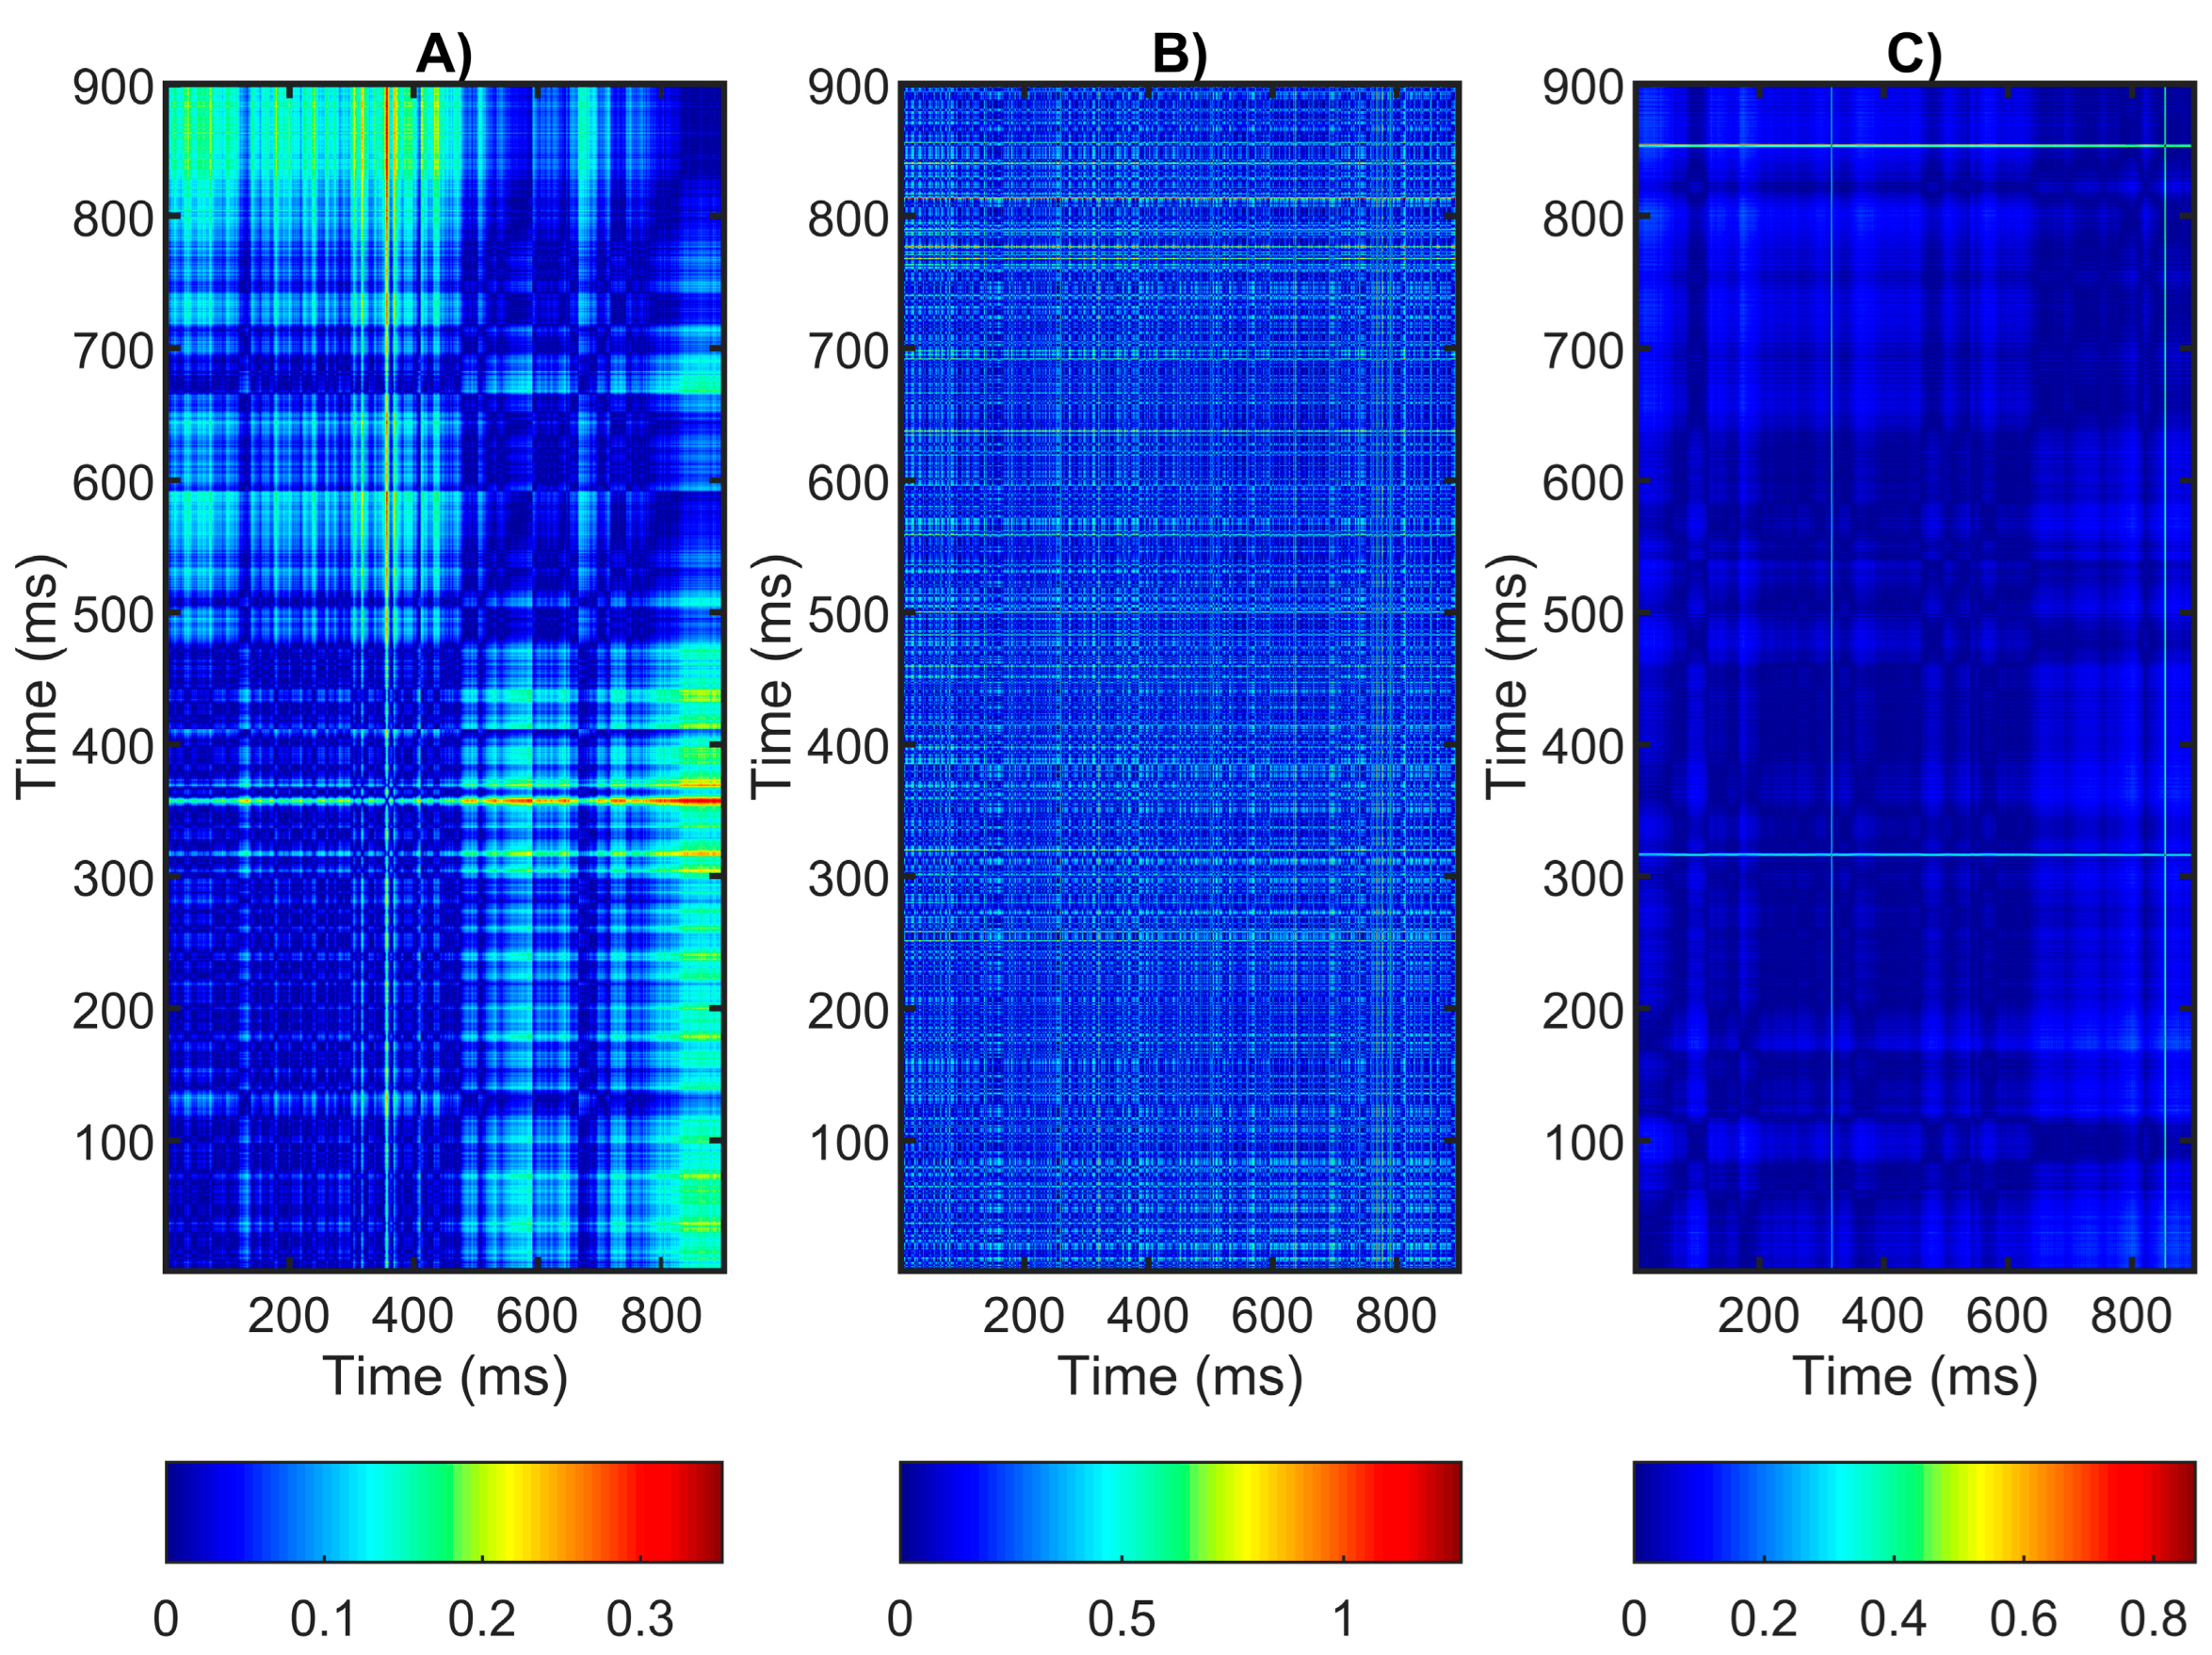
- Diagonal lines: Diagonal lines in the recurrence plot indicate the presence of periodic or repeating structures in the time series of the studied system. Longer diagonal structures indicate that there are more periodic or repeating segments in the system dynamics.
- Vertical and horizontal lines: These lines are indicators of various aspects of cardiac variability and can be useful in assessing heart health and autonomic nervous system function. The vertical lines in the recurrence plot indicate periods of stability in the heart rate. They are formed when the heart rhythm remains stable and is sustained over some time. A high frequency of vertical lines can be an indicator of good heart rate regulation and high heart variability. The horizontal lines in the image reflect the short-term changes in heart rate that can occur due to the presence of external factors such as stress, physical exertion, or emotional factors. These lines indicate that the heart rhythm is changing or adapting to external influences. A greater amount of horizontal lines can be an indicator of a greater sensitivity of the heart to external influences or disturbances in the regulation of the heart rhythm.
- Distribution of points: The distribution of points in a recurrence plot can provide information about the characteristics of the system’s dynamics, including equilibrium, chaos, or periodicity. A high concentration of points around the main diagonal of the RP indicates a repetition of certain events in the time series. This can be an indicator of stability or regularity in the time series. Scattered dots in RP may indicate randomness or chaos in the time series. If the points are evenly distributed throughout the matrix, this may indicate a lack of regularity in the time series. The presence of clusters or areas of a high density of points may indicate the presence of events or periods with similar characteristics or behavior in the time series.
- Shape and size: The shape and size of the recurrence graph can be analyzed to extract characteristics of the system, such as the degree of chaos, the degree of predictability, and others.
- Recurrence rate (REC %)—This parameter provides quantitative information about the level of recurrence in the analyzed time series and can be useful for comparing different time series or for tracking changes in the structure of the time series over time. The parameter indicates the percentage of recurrent points in the chart, which is calculated by dividing the number of recurrent points that are on the main diagonal by the total number of points in the matrix. A higher REC value indicates greater density in the time series, which can be interpreted as a greater degree of structure or repeatability in the system. Conversely, a lower REC value indicates a sparser or more random structure of the time series.
- Determinism (DET %)—This parameter is used to determine the deterministic structures in the time series. It measures the percentage of points that form diagonal lines of length L, where L is the minimum length of diagonals that are considered deterministic. A larger DET value indicates a greater number of deterministic structures or periodic events in the time series, which can be interpreted as a greater degree of predictability or regularity of the system. Conversely, lower DET values indicate fewer deterministic segments and more randomness in the time series.
- Laminarity (LAM %)—This parameter indicates the percentage of points that form horizontal lines of length w, which is the minimum length of laminated segments that are considered significant. A larger value of LAM indicates a larger number of laminated segments in the time series, which can be interpreted as a greater degree of the duration of a given regime or state of the system and reflects the periodic or steady state in the time series. Conversely, a lower LAM value indicates fewer laminated structures and more randomness in the time series.
- Entropy (ENTR)—This parameter reflects the entropy of the points in the recurrent graph. A higher value of ENTR means greater unpredictability in the time series and greater complexity of the system. In the opposite situation, a lower value of ENTR may indicate greater order or predictability in the time series.
3. Results
- —QRS or mean RR intervals (Holter);
- —RR intervals (ECG sensor);
- N—number of intervals.
- Number of QRS complexes (ECG, Holter record);
- The average value of RR intervals [ms];
- The relative errors ECG/Holter;
- The MSE ECG/Holter.
- -
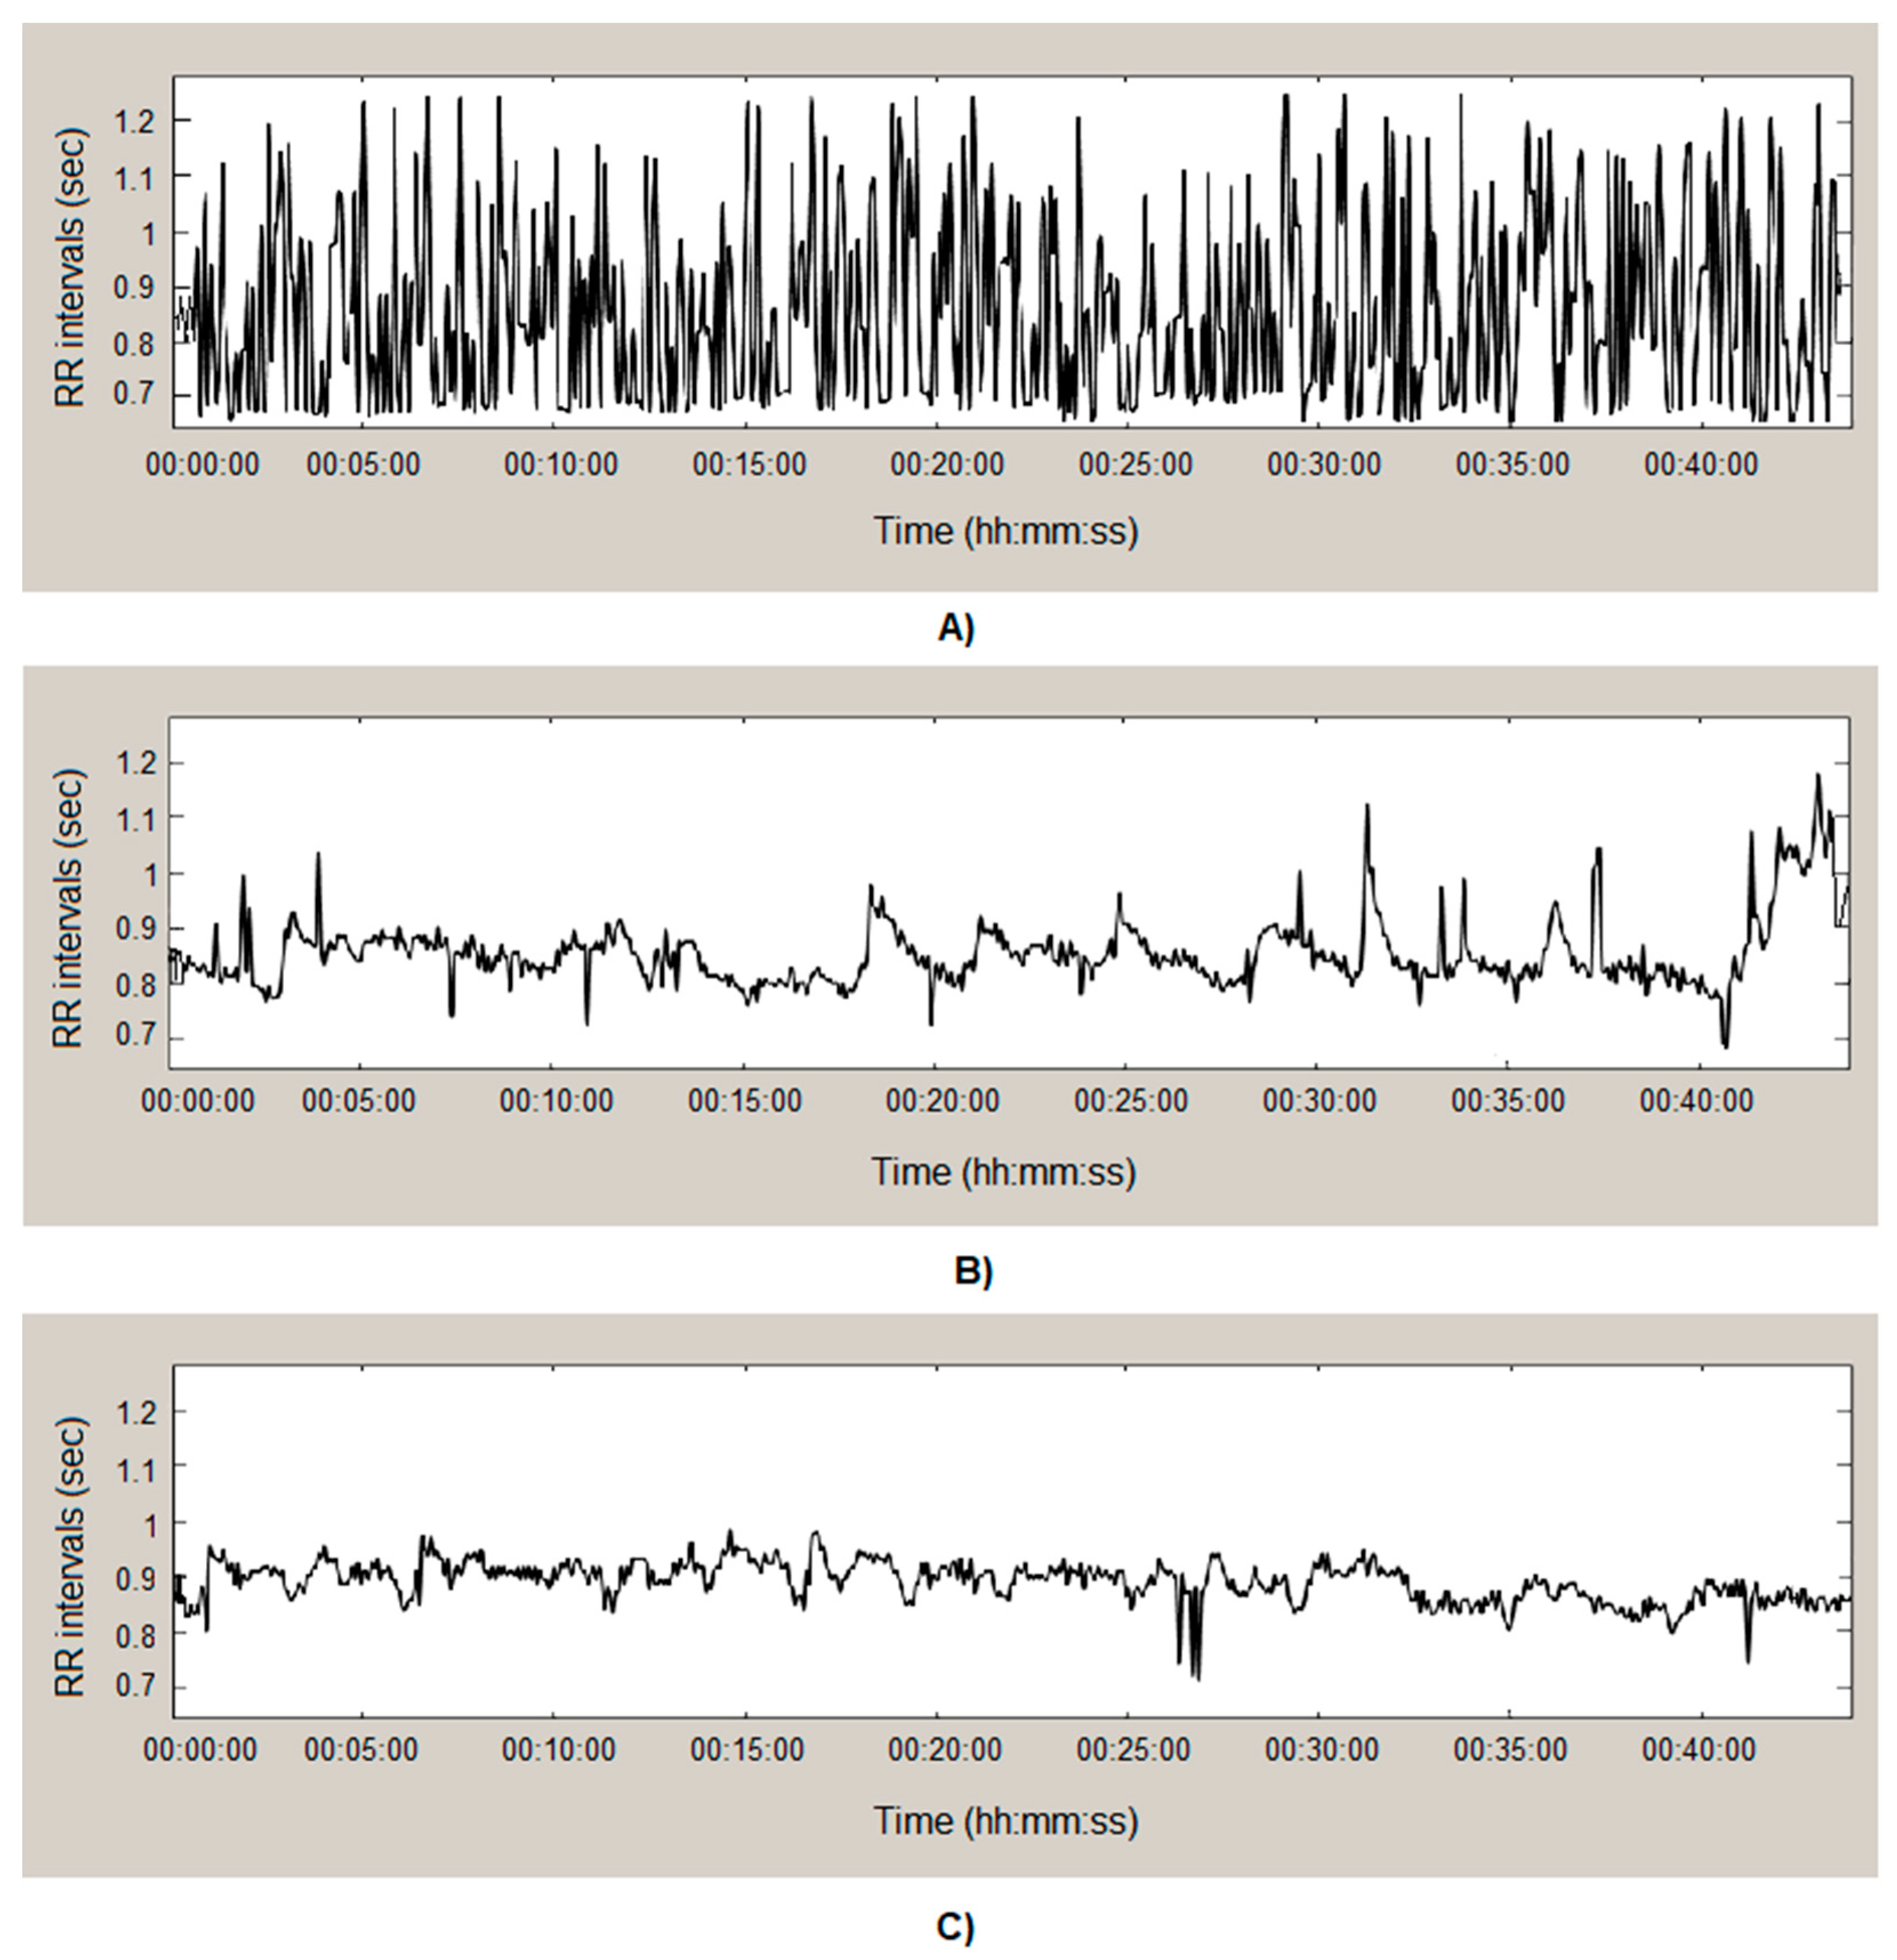
- The shape and distribution of the points in the graph: In healthy individuals, a uniform distribution of the points around the line of identity (the x = y line) is usually observed, which reflects a relatively stable cardiac rhythmicity. In the case of individuals with arrhythmia and syncope, the variations in the points are greater, which may be an indicator of irregularities in the heart rhythm or various problems in the activity of the cardiovascular system. The shapes that the points form in the three types of RR interval series shown in Figure 6 are different. The graph in the healthy individual (Figure 6A) has the shape of a comet, which has a pointed lower part, while, in the patient with arrhythmia, the shape has the appearance of a fan (Figure 6B), and, in the patient with syncope, it has a complex shape consisting of three segments (Figure 6C).
- -
- Asymmetry of points in the plot: From the Poincaré plot, asymmetries in the distribution of points can be observed, which can be an indicator of irregularities in the heart rhythm. There is no asymmetry of points in the observed graphs.
- -
- Scattering of the points on the graph: The scattering of the points can provide information about the degree of heart rate variability. From the graphs shown in Figure 6, the scattering of the points is the smallest in the healthy subject; therefore, the HRV is the largest in him.
- -
- The time series does not exhibit obvious periodicity but has chaotic or random behavior where there are no clear repeatable patterns or structures.
- -
- The dominance of the sympathetic or parasympathetic part of the autonomic nervous system on cardiac function.
- -
- The variation in time between the cardiac cycles is less, as is HRV, and this may be reflected in fewer repeating patterns or cycles in the graph.
- -
- In the healthy individuals, the REC and DET values are higher than in the patients with arrhythmia and syncope, which is usually associated with stable and regulated cardiac cycles.
- -
- The lower values of REC and DET in the patients with arrhythmia and syncope are associated with cardiac disorders that lead to unstable and unpredictable cardiac cycles that form fewer recurrent structures.
- -
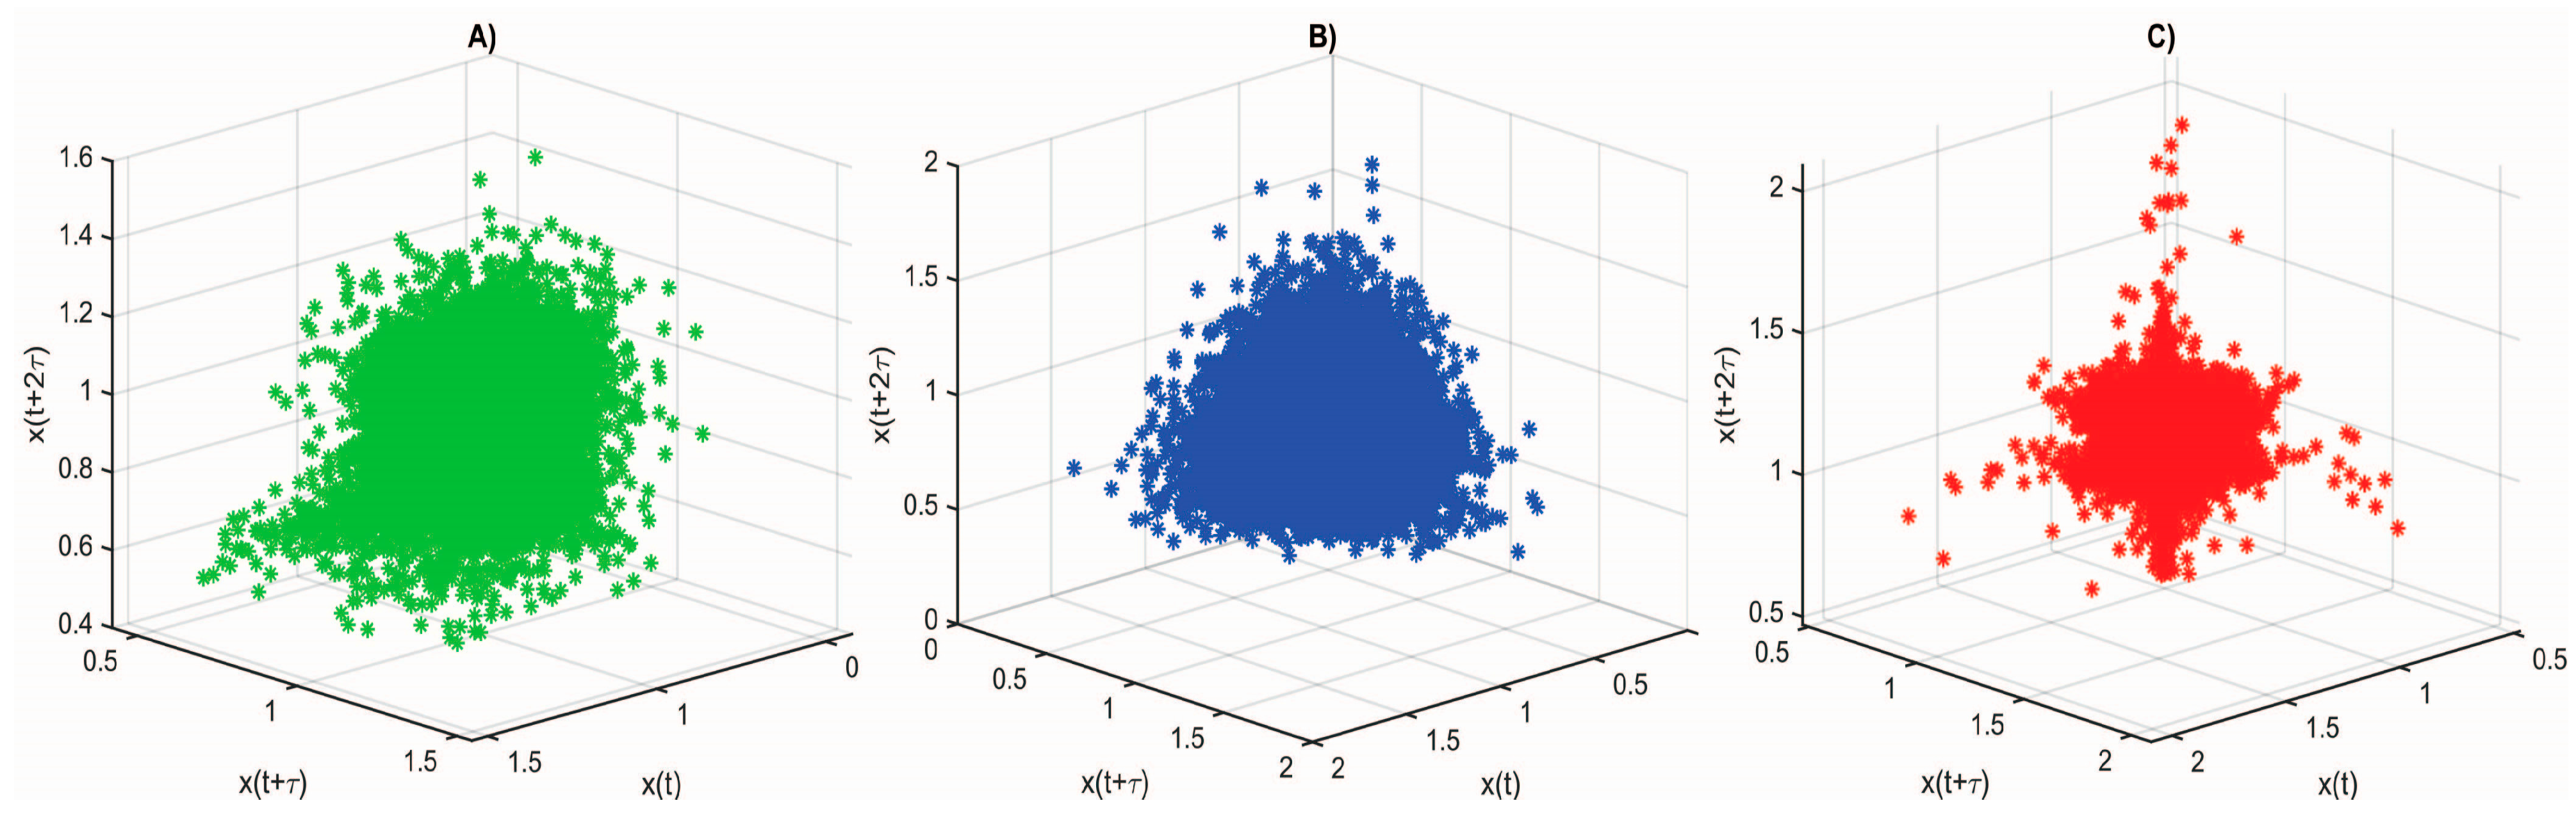
- Attractor shape and structure: Healthy and diseased hearts can have different phase portrait shapes and structures. For example, healthy hearts tend to have more regular and organized attractors, while the attractors of patients with heart disease such as arrhythmia and syncope can be more chaotic and irregular.
- -
- Point distribution: The analysis of the point distribution in the phase portrait can provide information on the characteristics of cardiac dynamics. For example, the density and evenness of the distribution may be different between healthy individuals and diseased patients.
4. Discussion
5. Conclusions
Author Contributions
Funding
Institutional Review Board Statement
Informed Consent Statement
Data Availability Statement
Conflicts of Interest
References
- Xie, Y.; Xu, E.; Bowe, B.; Al-Aly, Z. Long-term cardiovascular outcomes of COVID-19. Nat. Med. 2022, 28, 583–590. [Google Scholar] [CrossRef] [PubMed]
- Vosko, I.; Zirlik, A.; Bugger, H. Impact of COVID-19 on Cardiovascular Disease. Viruses 2023, 15, 508. [Google Scholar] [CrossRef] [PubMed]
- Acharya, U.R.; Ghista, D.; Yi, Z.; Min, L.; Ng, E.; Sree, S.; Faust, O.; Weidong, L.; Alvin, A. Integrated index for cardiac arrhythmias diagnosis using entropies as features of heart rate variability signal. In Proceedings of the 2011 1st Middle East Conference on Biomedical Engineering, Sharjah, UAE, 21–24 February 2011; pp. 371–374. [Google Scholar]
- Jose, S.K.; Wayanad; Shambharkar, C.M.; Chunkath, J. Cardiac arrhythmia detection using ballistocardiogram signal. In Proceedings of the 2015 IEEE International Conference on Signal Processing, Informatics, Communication and Energy Systems (SPICES), Kozhikode, India, 19–21 February 2015; pp. 1–5. [Google Scholar]
- Reed, M.J.; Robertson, C.E.; Addison, P.S. Heart rate variability measurements and the prediction of ventricular arrhythmias. QJM Int. J. Med. 2005, 98, 87–95. [Google Scholar] [CrossRef] [PubMed]
- Inan, O.T.; Giovangrandi, L.; Kovacs, G.T.A. Robust neural-network based classification of premature ventricular contractions using wavelet transform and timing interval features. IEEE Trans. Biomed. Eng. 2006, 53, 2507–2515. [Google Scholar] [CrossRef] [PubMed]
- Ivanova, V.; Boneva, A.; Ivanov, S.; Doshev, Y. An ECG Monitoring Device for a Modular Instrument to Surgical Robots. In Proceedings of the XXXII International Scientific and Technical Conference Automation of Discrete Production Engineering—ADP 2023, Sozopol, Bulgaria, 29 June 2023–2 July 2023; TU Recreation Facilities Sozopol, Automation of discrete production; TU-Sofia Publishing House: Sofia, Bulgaria, 2023; pp. 44–50. Available online: http://ndtlab.tu-sofia.bg/ADP%20Magazine%20site/index.html (accessed on 12 March 2024), ISSN 2682-9584.
- Malik, M. Task Force of the European Society of Cardiology and the North American Society of Pacing and Electrophysiology, Heart rate variability—Standards of measurement, physiological interpretation, and clinical use. Circulation 1996, 93, 1043–1065. [Google Scholar]
- Nayak, S.K.; Pradhan, B.; Mohanty, B.; Sivaraman, J.; Ray, S.S.; Wawrzyniak, J.; Jarzębski, M.; Pal, K. A Review of Methods and Applications for a Heart Rate Variability Analysis. Algorithms 2023, 16, 433. [Google Scholar] [CrossRef]
- Kim, H.G.; Cheon, E.J.; Bai, D.S.; Lee, Y.H.; Koo, B.H. Stress and heart rate variability: A meta-analysis and review of the literature. Psychiatry Investig. 2018, 15, 235. [Google Scholar] [CrossRef] [PubMed]
- Muhajir, D.; Mahananto, F.; Sani, N.A. Stress level measurements using heart rate variability analysis on android based application. Sixth Information Systems International Conference (ISICO 2021). Procedia Comput. Sci. 2022, 197, 189–197. [Google Scholar] [CrossRef]
- Scherer, M.; Martinek, J.; Mayr, W. HRV (Heart Rate Variability) as a non-invasive measurement method for performance diagnostics and training control. Curr. Dir. Biomed. Eng. 2019, 5, 97–100. [Google Scholar] [CrossRef]
- Mosley, E.; Laborde, S. A scoping review of heart rate variability in sport and exercise psychology. Int. Rev. Sport Exerc. Psychol. 2022. [CrossRef]
- Burlacu, A.; Brinza, C.; Brezulianu, A.; Covic, A. Accurate and early detection of sleepiness, fatigue and stress levels in drivers through Heart Rate Variability parameters: A systematic review. Rev. Cardiovasc. Med. 2021, 22, 845–852. [Google Scholar] [CrossRef] [PubMed]
- Ishaque, S.; Khan, N.; Krishnan, S. Trends in heart-rate variability signal analysis. Front. Digit. Health 2021, 3, 639444. [Google Scholar] [CrossRef] [PubMed]
- COVID-19 and the Heart: What Have We Learned?; Harvard Health Publishing: Harvard Medical School, Cambridge, MA, USA. 2021. Available online: https://www.health.harvard.edu/blog/covid-19-and-the-heart-what-have-we-learned-2021010621603 (accessed on 12 March 2024).
- Suh, H.W.; Kwon, C.Y.; Lee, B. Long-Term Impact of COVID-19 on Heart Rate Variability: A Systematic Review of Observational Studies. Healthcare 2023, 11, 1095. [Google Scholar] [CrossRef] [PubMed]
- Akar, S.A.; Kara, S.; Latifoglu, F.; Biggic, V. Spectral analysis of photoplethysmographic signals: The importance of preprocessing. Biomed. Signal Process. Control. 2013, 8, 16–22. [Google Scholar] [CrossRef]
- Paniccia, M.; Paniccia, D.; Thomas, S.; Taha, T.; Reed, N. Clinical and non-clinical depression and anxiety in young people: A scoping review on heart rate variability. Auton Neurosci. 2017, 208, 1–14. [Google Scholar] [CrossRef] [PubMed]
- Pham, T.; Lau, Z.J.; Chen, S.A.; Makowski, D. Heart Rate Variability in Psychology: A Review of HRV Indices and an Analysis Tutorial. Sensors 2021, 21, 3998. [Google Scholar] [CrossRef] [PubMed]
- Laborde, S.; Mosley, E.; Thayer, J.F. Heart rate variability and cardiac vagal tone in psychophysiological research–recommendations for experiment planning, data analysis, and data reporting. Front. Psychol. 2017, 8, 213. [Google Scholar] [CrossRef] [PubMed]
- Ernst, G. Heart Rate Variability; Springer: London, UK, 2014. [Google Scholar]
- Gomes, R.L.; Vanderlei, L.; Garner, D.M.; Santana, M.D.; Abreu, L.C.; Valenti, V.E. Poincaré plot analysis of ultra-short-term heart rate variability during recovery from exercise in physically active men. J. Sports Med. Phys. Fit. 2018, 58, 998–1005. [Google Scholar] [CrossRef] [PubMed]
- Fishman, M.; Jacono, F.J.; Park, S.; Jamasebi, R.; Thungtong, A.; Loparo, K.A.; Dick, T.E. A method for analyzing temporal patterns of variability of a time series from Poincare plots. J. Appl. Physiol. 2012, 113, 297–306. [Google Scholar] [CrossRef] [PubMed]
- Kamen, P.; Krum, H.; Maxwell, A. Poincaré plot of heart rate variability allows quantitative display of parasympathetic nervous activity in humans. Clin. Sci. 1996, 91, 201–208. [Google Scholar] [CrossRef] [PubMed]
- Khandoker, A.H.; Karmakar, C.; Brennan, M.; Palaniswami, M.; Voss, A. Poincaré Plot Methods for Heart Rate Variability Analysis; Springer: New York, NY, USA, 2013. [Google Scholar] [CrossRef]
- Hoffmann, B.; Flatt, A.A.; Silva, L.E.V.; Młyńczak, M.; Baranowski, R.; Dziedzic, E.; Werner, B.; Gąsior, J.S. A Pilot Study of the Reliability and Agreement of Heart Rate, Respiratory Rate and Short-Term Heart Rate Variability in Elite Modern Pentathlon Athletes. Diagnostics 2020, 10, 833. [Google Scholar] [CrossRef] [PubMed]
- Urzeală, C.; Bota, A.; Serbanoiu, S.; Mezei, M.; Dutheil, F.; Courteix, D. 2020. Heart Rate Variability as a Possible Predictor of Sport Performance in Junior Rhythmic Gymnastics. Isokinet. Exerc. Sci. 2020, 28, 171–179. [Google Scholar] [CrossRef]
- Blásquez, J.C.C.; Font, G.R.; Ortís, L.C. 2009. Heart-rate variability and precompetitive anxiety in swimmers. Psicothema 2009, 21, 531–536. [Google Scholar]
- Acharya, U.R.; Suri, J.S.; Spaan, J.A.E.; Krishnan, S.M. Advances in Cardiac Signal Processing; Springer: Berlin/Heidelberg, Germany, 2007. [Google Scholar] [CrossRef]
- Lebamovski, P.D. Impact of Stress on Heart Rate Variability. Proc. CBU Med. Pharm. 2022, 3, 13–18. [Google Scholar] [CrossRef]
- Lebamovski, P.D. The Influence of Virtual Reality on the Autonomic Nervous System; Science Series Innovative STEM Education; Institute of Mathematics and Informatics—Bulgarian Academy of Sciences: Veliko Tarnovo, Bulgaria, 2023; Volume 5, pp. 35–44. ISSN 2683-1333. [Google Scholar] [CrossRef]
- Lebamovski, P.D. Analysis of Methods and Approaches for Evaluation of Heart Rate Variability; Science Series Innovative STEM Education; Institute of Mathematics and Informatics—Bulgarian Academy of Sciences: Veliko Tarnovo, Bulgaria, 2022; Volume 4, pp. 39–47. ISSN 2683-1333. [Google Scholar] [CrossRef]
- Ivan, C.; Arva, M.C. Nonlinear Time Series Analysis in Unstable Periodic Orbits Identification-Control Methods of Nonlinear Systems. Electronics 2022, 11, 947. [Google Scholar] [CrossRef]
- Mathunjwa, B.M.; Lin, Y.-T.; Lin, C.-H.; Abbod, M.F.; Sadrawi, M.; Shieh, J.-S. ECG Recurrence Plot-Based Arrhythmia Classification Using Two-Dimensional Deep Residual CNN Features. Sensors 2022, 22, 1660. [Google Scholar] [CrossRef] [PubMed]
- Zhou, C.; Zhang, W. Recurrence Plot Based Damage Detection Method by Integrating Control Chart. Entropy 2015, 17, 2624–2641. [Google Scholar] [CrossRef]
- Petrauskiene, V.; Pal, M.; Cao, M.; Wang, J.; Ragulskis, M. Color Recurrence Plots for Bearing Fault Diagnosis. Sensors 2022, 22, 8870. [Google Scholar] [CrossRef] [PubMed]
- Hanáková, L.; Průcha, J.; Socha, V.; Štengl, M.; Van den Bergh, S. Effect of High-Induction Magnetic Stimulation on Complex Heart Rate Variability of Sus Scrofa Domesticus under General Anesthesia. Appl. Sci. 2020, 10, 589. [Google Scholar] [CrossRef]
- Zimatore, G.; Gallotta, M.C.; Campanella, M.; Skarzynski, P.H.; Maulucci, G.; Serantoni, C.; De Spirito, M.; Curzi, D.; Guidetti, L.; Baldari, C.; et al. Detecting Metabolic Thresholds from Nonlinear Analysis of Heart Rate Time Series: A Review. Int. J. Environ. Res. Public Health 2022, 19, 12719. [Google Scholar] [CrossRef] [PubMed]
- Calderón-Juárez, M.; González-Gómez, G.H.; Echeverría, J.C.; Pérez-Grovas, H.; Lerma, C. Association between Mean Heart Rate and Recurrence Quantification Analysis of Heart Rate Variability in End-Stage Renal Disease. Entropy 2020, 22, 114. [Google Scholar] [CrossRef] [PubMed]
- Błażkiewicz, M. Evaluation of Geometric Attractor Structure and Recurrence Analysis in Professional Dancers. Entropy 2022, 24, 1310. [Google Scholar] [CrossRef] [PubMed]
- Nayak, S.K.; Bit, A.; Dey, A.; Mohapatra, B.; Pal, K. A Review on the Nonlinear Dynamical System Analysis of Electrocardiogram Signal. J. Healthc. Eng. 2018, 2018, 6920420. [Google Scholar] [CrossRef] [PubMed]
- Krakovská, A.; Mezeiová, K.; Budáčová, H. Use of false nearest neighbors for selecting variables and embedding parameters for state space reconstruction. J. Complex Syst. 2015, 2015, 932750. [Google Scholar] [CrossRef]


| Parameter | Group 1 N = 44 | Group 2 N = 48 | Group 3 N = 42 | p-Value | |
|---|---|---|---|---|---|
| Gr1/Gr2 | Gr1/Gr3 | ||||
| Gender, Men [%] | 47.73 | 48.83 | 47.62 | NS 1 | NS 1 |
| Age ± sd | 45.82 ± 20.14 | 47.98 ± 17.22 | 48.33 ± 18.39 | NS 1 | NS 1 |
| Parameters | ECG N = 44 [Mean ± sd] | Holter [Mean ± sd] | Relative Error [%] ECG/Holter | MSE ECG/Holter |
|---|---|---|---|---|
| Number of QRS complexes per 2 h | 8593.54 ± 322.12 | 8639.09 ± 465.28 | 0.49% | 0.0115 |
| Mean RR intervals [ms] | 839.88 ± 134.52 | 834.54 ± 126.65 | 0.47% | 0.012 |
| Parameters | ECG N = 48 [Mean ± sd] | Holter [Mean ± sd] | Relative Error [%] ECG/Holter | MSE ECG/Holter |
|---|---|---|---|---|
| Number of QRS complexes/pulse waves per 1 h | 9634.58 ± 528.04 | 9707.18 ± 532.63 | 0.75% | 0.019 |
| Mean RR intervals [ms] | 748.29 ± 125.57 | 742.06 ± 137.61 | 0.81% | 0.0185 |
| Parameters | ECG N = 42 [Mean ± sd] | Holter [Mean ± sd] | Relative Error [%] ECG/Holter | MSE ECG/Holter |
|---|---|---|---|---|
| Number of QRS complexes/pulse waves per 1 h | 10,112.58 ± 481.36 | 10,236.37 ± 443.92 | 1.21% | 0.035 |
| Mean RR intervals [ms] | 712.33 ± 114.61 | 703.52 ± 123.82 | 1.28% | 0.041 |
| Parameters | Group 1 N = 44 [Mean ± sd] | Group 2 N = 48 [Mean ± sd] | Group 3 N = 42 [Mean ± sd] | p-Value (t-Test) | p-Value (ANOVA) | |
|---|---|---|---|---|---|---|
| Gr1/Gr2 | Gr1/Gr3 | Gr1/Gr2/Gr3 | ||||
| MeanRR (ms) | 892.41 ± 117.12 | 745.62 ± 131.23 | 654.14 ± 136.09 | <0.0001 | <0.0001 | <0.0001 |
| SDNN (ms) | 151.08 ± 43.72 | 94.81 ± 63.08 | 82.01 ± 92.36 | <0.001 | <0.001 | <0.001 |
| SDANN (ms) | 134.35 ± 82.39 | 82.09 ± 51.06 | 74.11 ± 13.62 | <0.001 | <0.001 | <0.001 |
| RMSSD (ms) | 24.02 ± 11.23 | 6.09 ± 5.86 | 5.21 ± 3.24 | <0.0001 | <0.001 | <0.001 |
| pNN50 | 32.14 ± 18.22 | 44.27 ± 23.67 | 49.54 ± 36.83 | <0.001 | <0.005 | <0.05 |
| SDNN Index (ms) | 81.41 ± 42.05 | 49.32 ± 36.04 | 48.88 ± 34.19 | <0.005 | <0.005 | <0.005 |
| HRVTi | 34.08 ± 22.33 | 21.34 ± 20.53 | 14.42 ± 12.76 | <0.01 | <0.0001 | <0.001 |
| TINN [ms] | 522.35 ± 318.01 | 455.61 ± 203.88 | 309.19 ± 22.94 | NS 1 | <0.001 | NS 1 |
| Parameters | Group 1 n = 44 [Mean ± sd] | Group 2 n = 48 [Mean ± sd] | Group 3 n = 42 [Mean ± sd] | p-Value (t-Test) | p-Value (ANOVA) | |
|---|---|---|---|---|---|---|
| Gr1/Gr2 | Gr1/Gr3 | Gr1/Gr2/Gr3 | ||||
| VLF Power [ms2] | 3431.38 ± 842.86 | 8327.35 ± 948.72 | 2641.06 ± 242.02 | <0.0001 | <0.0001 | <0.0001 |
| LF Power [ms2] | 1432.44 ± 498.03 | 798.36 ± 141.52 | 461.95 ± 112.62 | <0.0001 | <0.0001 | <0.0001 |
| HF Power [ms2] | 849.12 ± 278.02 | 581.18 ± 188.72 | 442.76 ± 268.35 | <0.0001 | <0.0001 | <0.0001 |
| LF Power nu | 0.63 ± 0.11 | 0.58 ± 0.12 | 0.51 ± 0.19 | <0.05 | <0.001 | 0.007 |
| HF Power nu | 0.37 ± 0.09 | 0.42 ± 0.12 | 0.49 ± 0.22 | <0.05 | <0.05 | 0.005 |
| LF/HF | 1.69 ± 0.43 | 1.37 ± 0.46 | 1.04 ± 0.61 | <0.001 | <0.0001 | <0.001 |
| Parameter | Group 1 n = 44 [Mean ± sd] | Group 2 n = 48 [Mean ± sd] | Group 3 n = 42 [Mean ± sd] | p-Value (t-Test) | p-Value (ANOVA) | |
|---|---|---|---|---|---|---|
| Gr1/Gr2 | Gr1/Gr3 | Gr1/Gr2/Gr3 | ||||
| Poincaré plot | ||||||
| SD1 [ms] | 66.12 ± 9.12 | 45.51 ± 10.22 | 41.32 ± 11.67 | 0.0001 | 0.0001 | 0.0001 |
| SD2 [ms] | 232.34 ± 29.23 | 148.12 ± 25.36 | 140.44 ± 21.77 | 0.0001 | 0.0001 | 0.0001 |
| SD1/SD2 [-] | 0.31 ± 0.09 | 0.29 ± 0.15 | 0.27 ± 0.21 | 0.4452 | 0.6012 | 0.67 |
| Recurrence plot | ||||||
| DET [%] | 90.8 ± 5.14 | 97.08 ± 6.13 | 99.34 ± 11.41 | 0.0001 | 0.0001 | 0.0001 |
| REC [%] | 36.43 ± 1.23 | 44.41 ± 1.96 | 47.24 ± 2.11 | 0.0001 | 0.0001 | 0.0001 |
| ENTR [-] | 4.13 ± 0.18 | 3.58 ± 0.41 | 3.21 ± 0.31 | 0.0001 | 0.0001 | 0.0001 |
Disclaimer/Publisher’s Note: The statements, opinions and data contained in all publications are solely those of the individual author(s) and contributor(s) and not of MDPI and/or the editor(s). MDPI and/or the editor(s) disclaim responsibility for any injury to people or property resulting from any ideas, methods, instructions or products referred to in the content. |
© 2024 by the authors. Licensee MDPI, Basel, Switzerland. This article is an open access article distributed under the terms and conditions of the Creative Commons Attribution (CC BY) license (https://creativecommons.org/licenses/by/4.0/).
Share and Cite
Georgieva-Tsaneva, G.; Gospodinova, E.; Cheshmedzhiev, K. Examination of Cardiac Activity with ECG Monitoring Using Heart Rate Variability Methods. Diagnostics 2024, 14, 926. https://doi.org/10.3390/diagnostics14090926
Georgieva-Tsaneva G, Gospodinova E, Cheshmedzhiev K. Examination of Cardiac Activity with ECG Monitoring Using Heart Rate Variability Methods. Diagnostics. 2024; 14(9):926. https://doi.org/10.3390/diagnostics14090926
Chicago/Turabian StyleGeorgieva-Tsaneva, Galya, Evgeniya Gospodinova, and Krasimir Cheshmedzhiev. 2024. "Examination of Cardiac Activity with ECG Monitoring Using Heart Rate Variability Methods" Diagnostics 14, no. 9: 926. https://doi.org/10.3390/diagnostics14090926
APA StyleGeorgieva-Tsaneva, G., Gospodinova, E., & Cheshmedzhiev, K. (2024). Examination of Cardiac Activity with ECG Monitoring Using Heart Rate Variability Methods. Diagnostics, 14(9), 926. https://doi.org/10.3390/diagnostics14090926