
A Heat Loss Sensitivity Index to Inform Housing Retrofit Policy in the UK


Abstract
1. Introduction
2. Materials and Methods
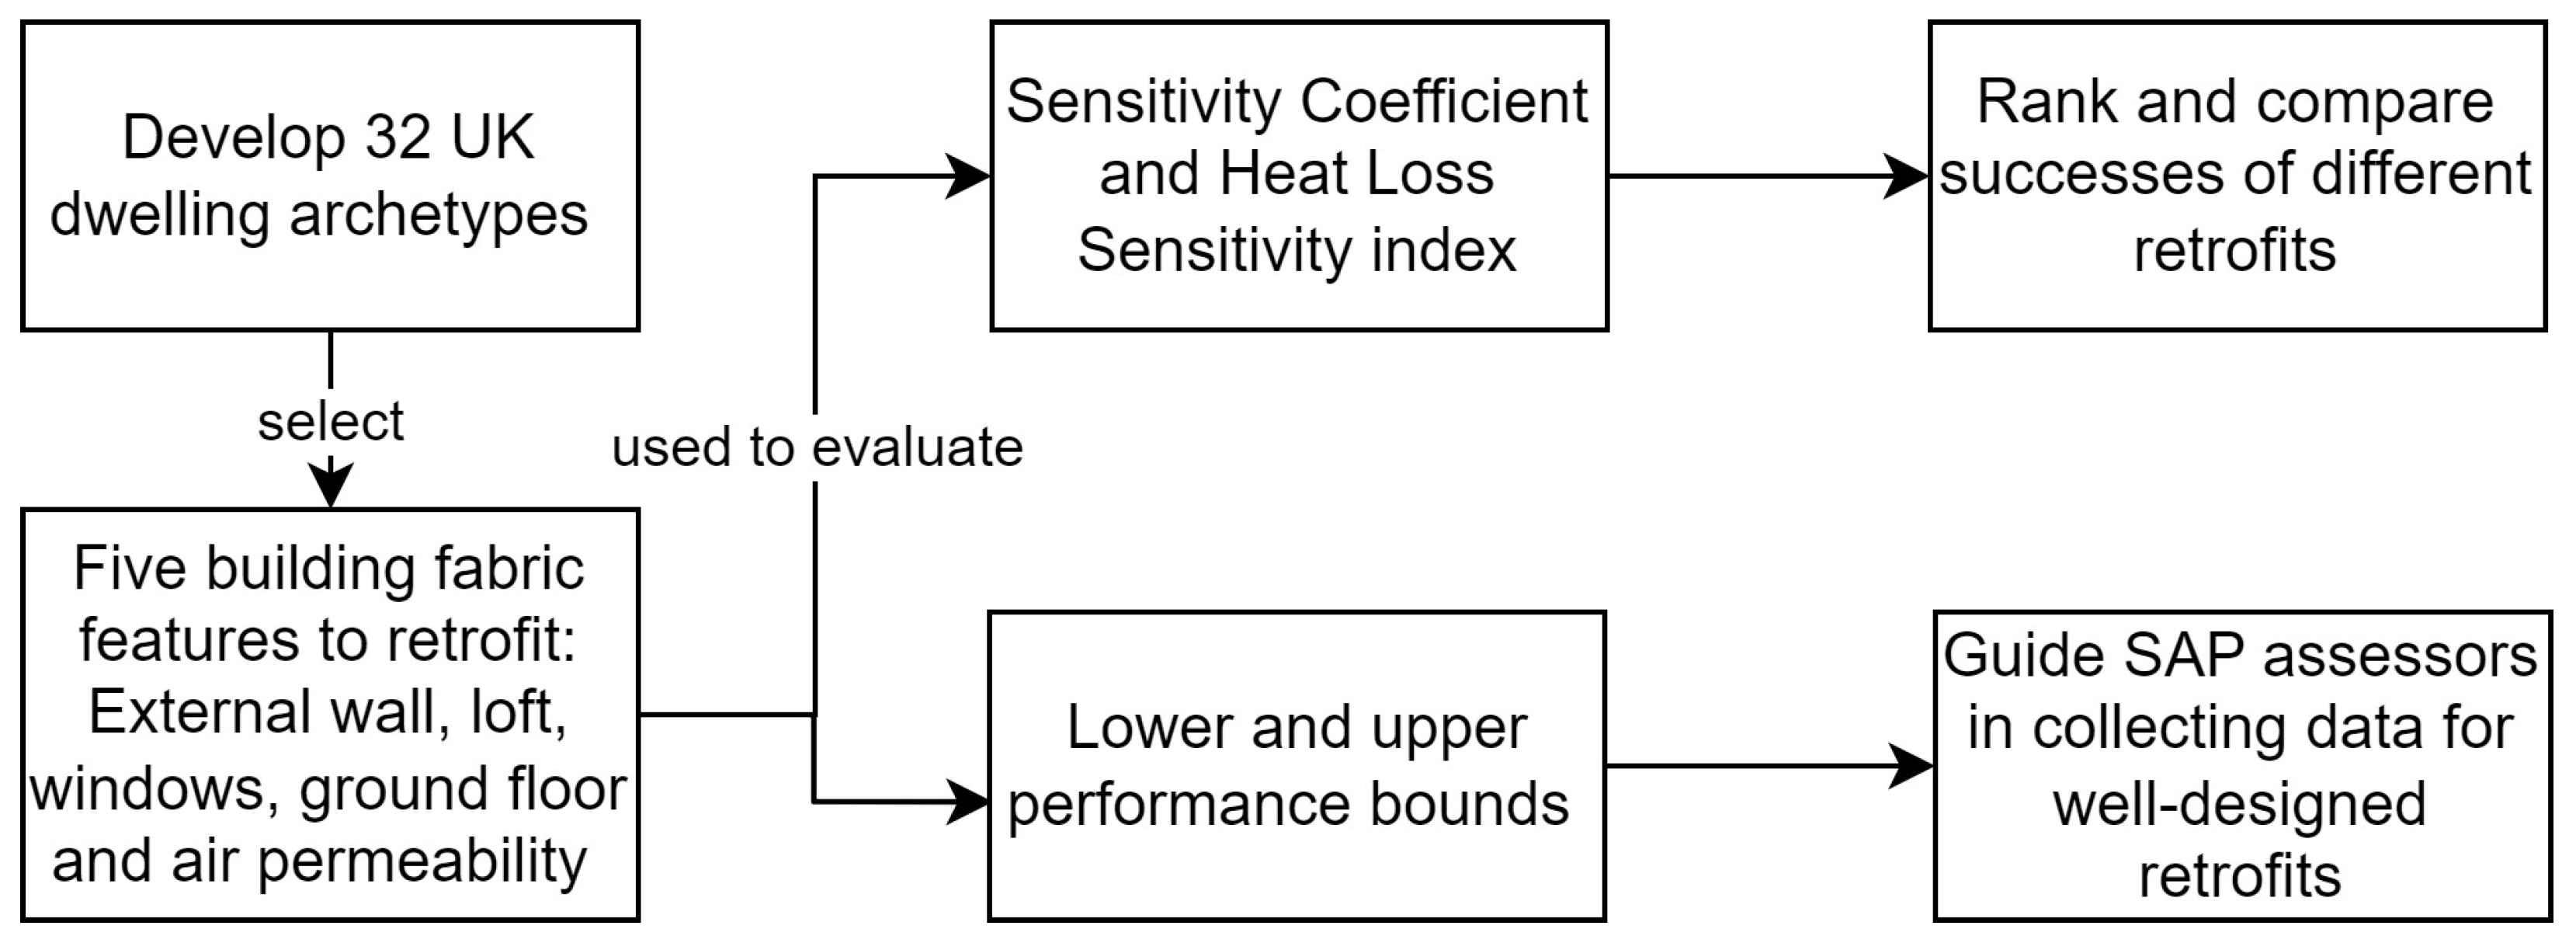
2.1. Overview
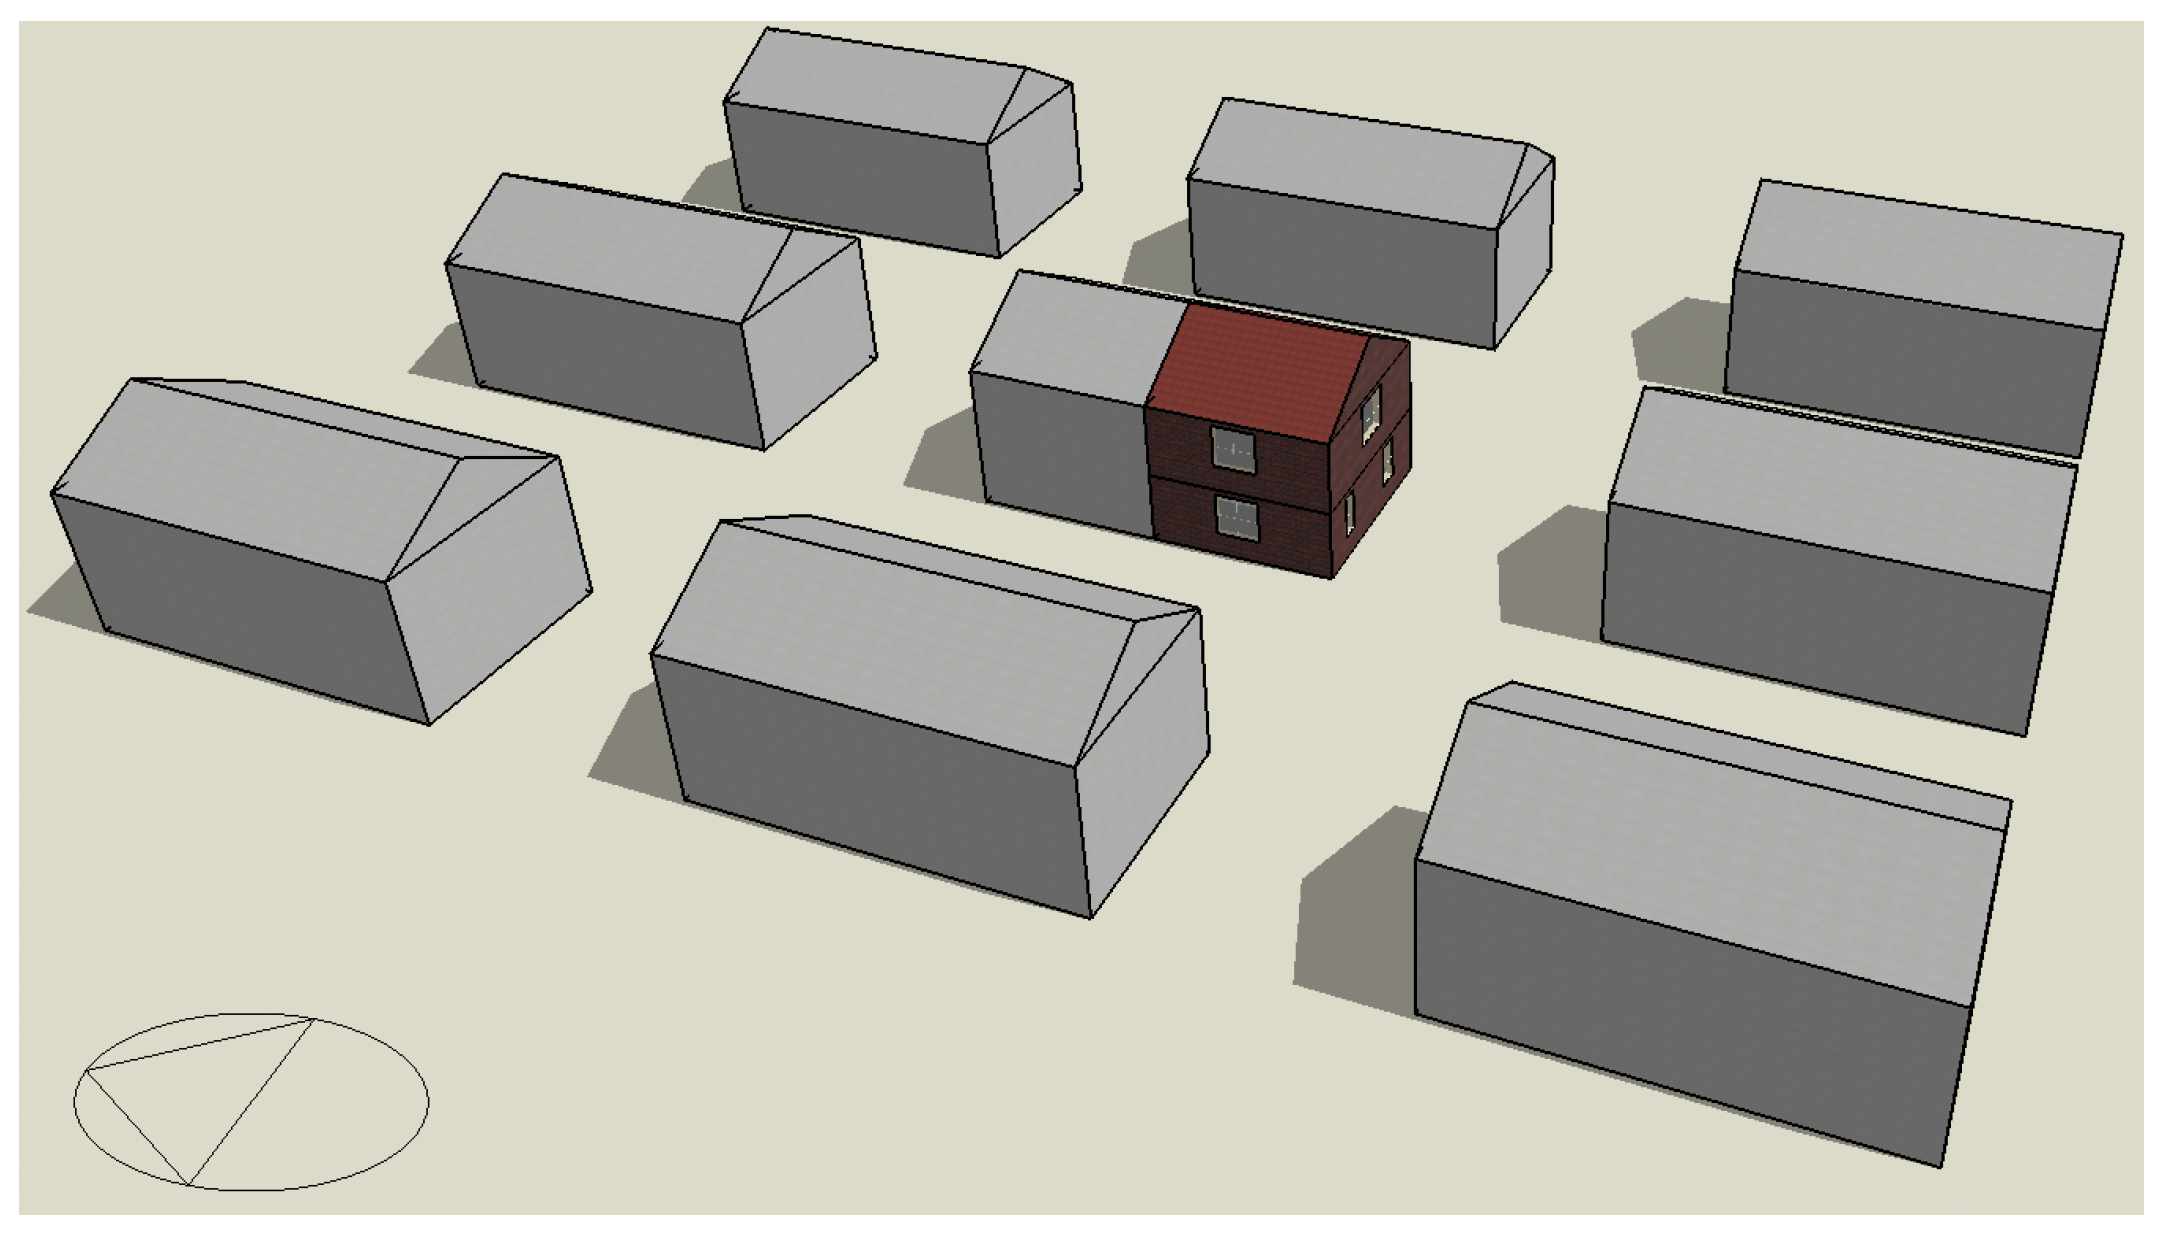
2.2. Development of DTS Archetype Models

| Building Element | Value | Justification |
|---|---|---|
| External wall | U-value = 1.7 W/m2K | Solid brick wall with thickness < 330 mm [40] |
| Roof | U-value = 2.3 W/m2K | Slates or tiles without insulation at joist [41] |
| Loft | U-value = 0.527 W/m2K | 12.5 mm plasterboard internally + 100 mm mineral wool, assuming the repeat bridging from the wooden joists was 30% of the area |
| Window | U-value = 2.8 W/m2K, g-value = 0.76 | Double-glazed unit with a 12 mm PVC frame [41] |
| Ground floor | U-value = 1.2 W/m2K | Suspended timber floor without insulation [41]. |
| Air permeability | Air Permeability rate = 12 m3/hm2@50 Pa | Average for dwellings built prior to 1920 according to BRE database of air leakage rate in UK dwellings [42] |
| Natural ventilation rate | Ventilation rate = 2 ach−1 when >24 °C | National Calculation Methodology (NCM) [37] |
| Heating set-point | Kitchen, Bathroom and bedroom (19.5 °C), Lounge (21 °C) | SAP [41] |
| Heat gains | Varies according to archetype | SAP [41] |
| Lighting heat gain | 4.6 W/m2 lux, assume 300 lux with controls | NCM [37] |
2.3. Development of a Metric to Evaluate Fabric Sensitivity
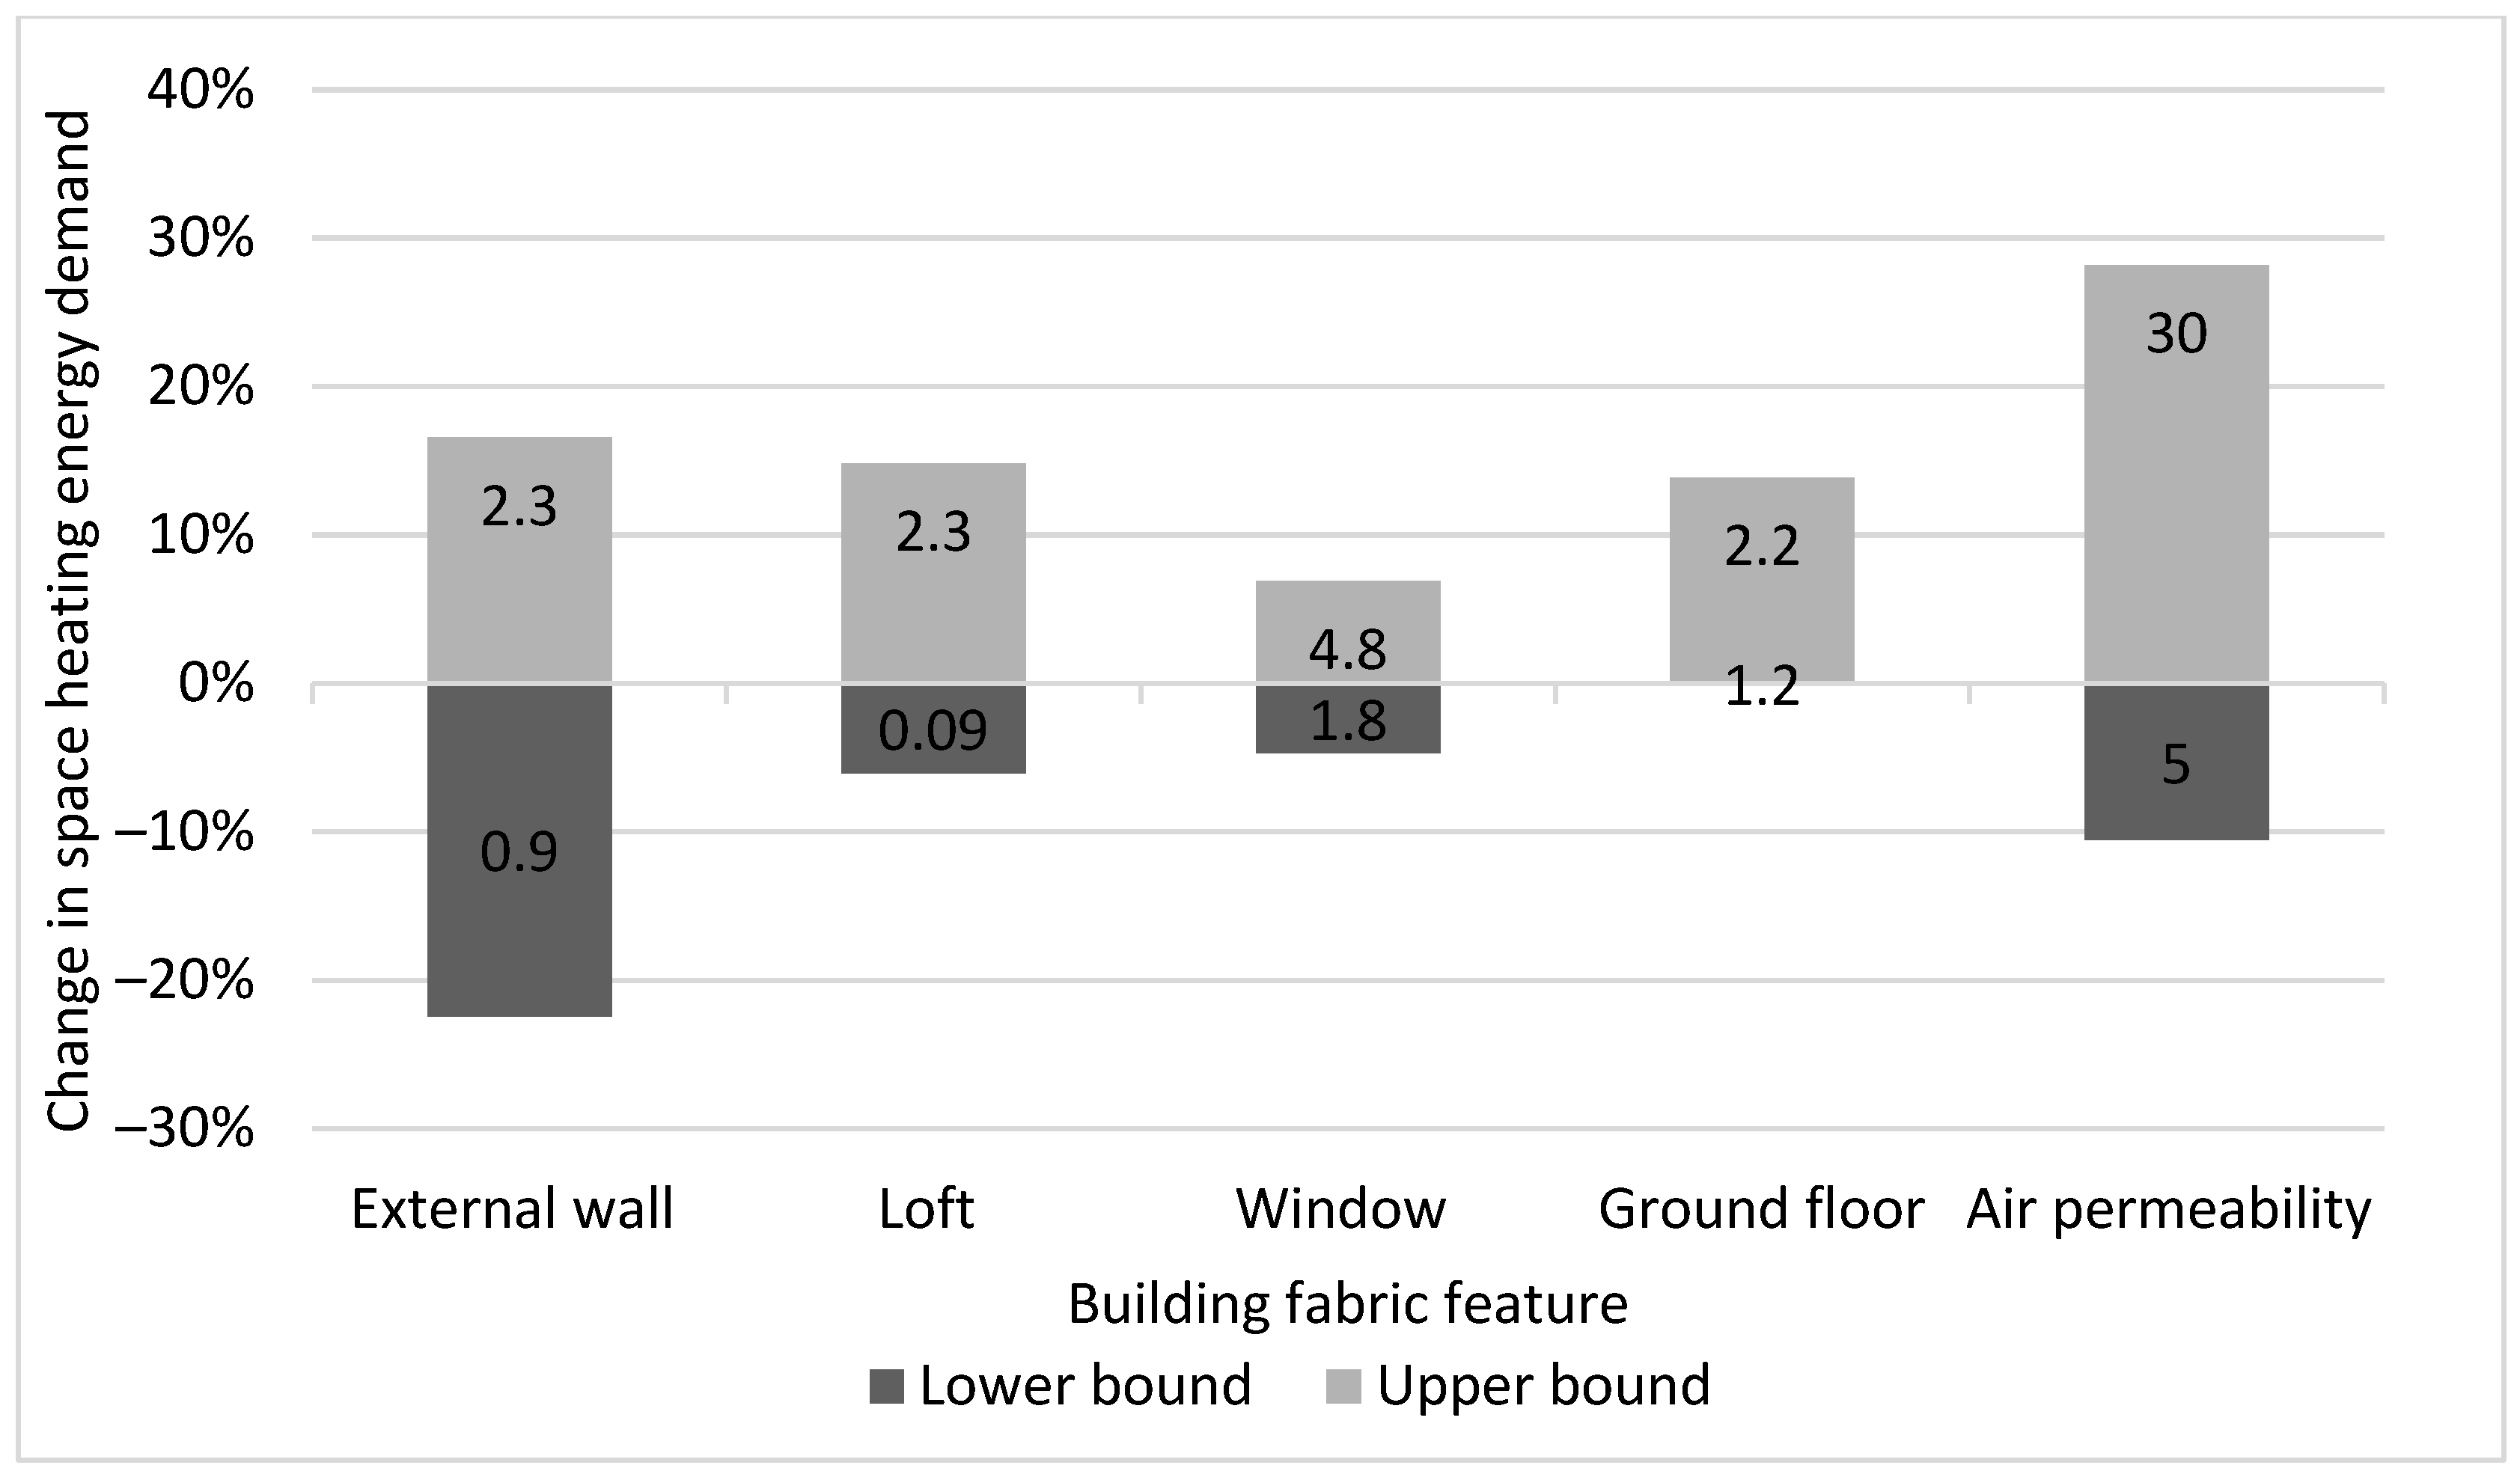
2.4. Development of Lower and Upper Bound Inputs
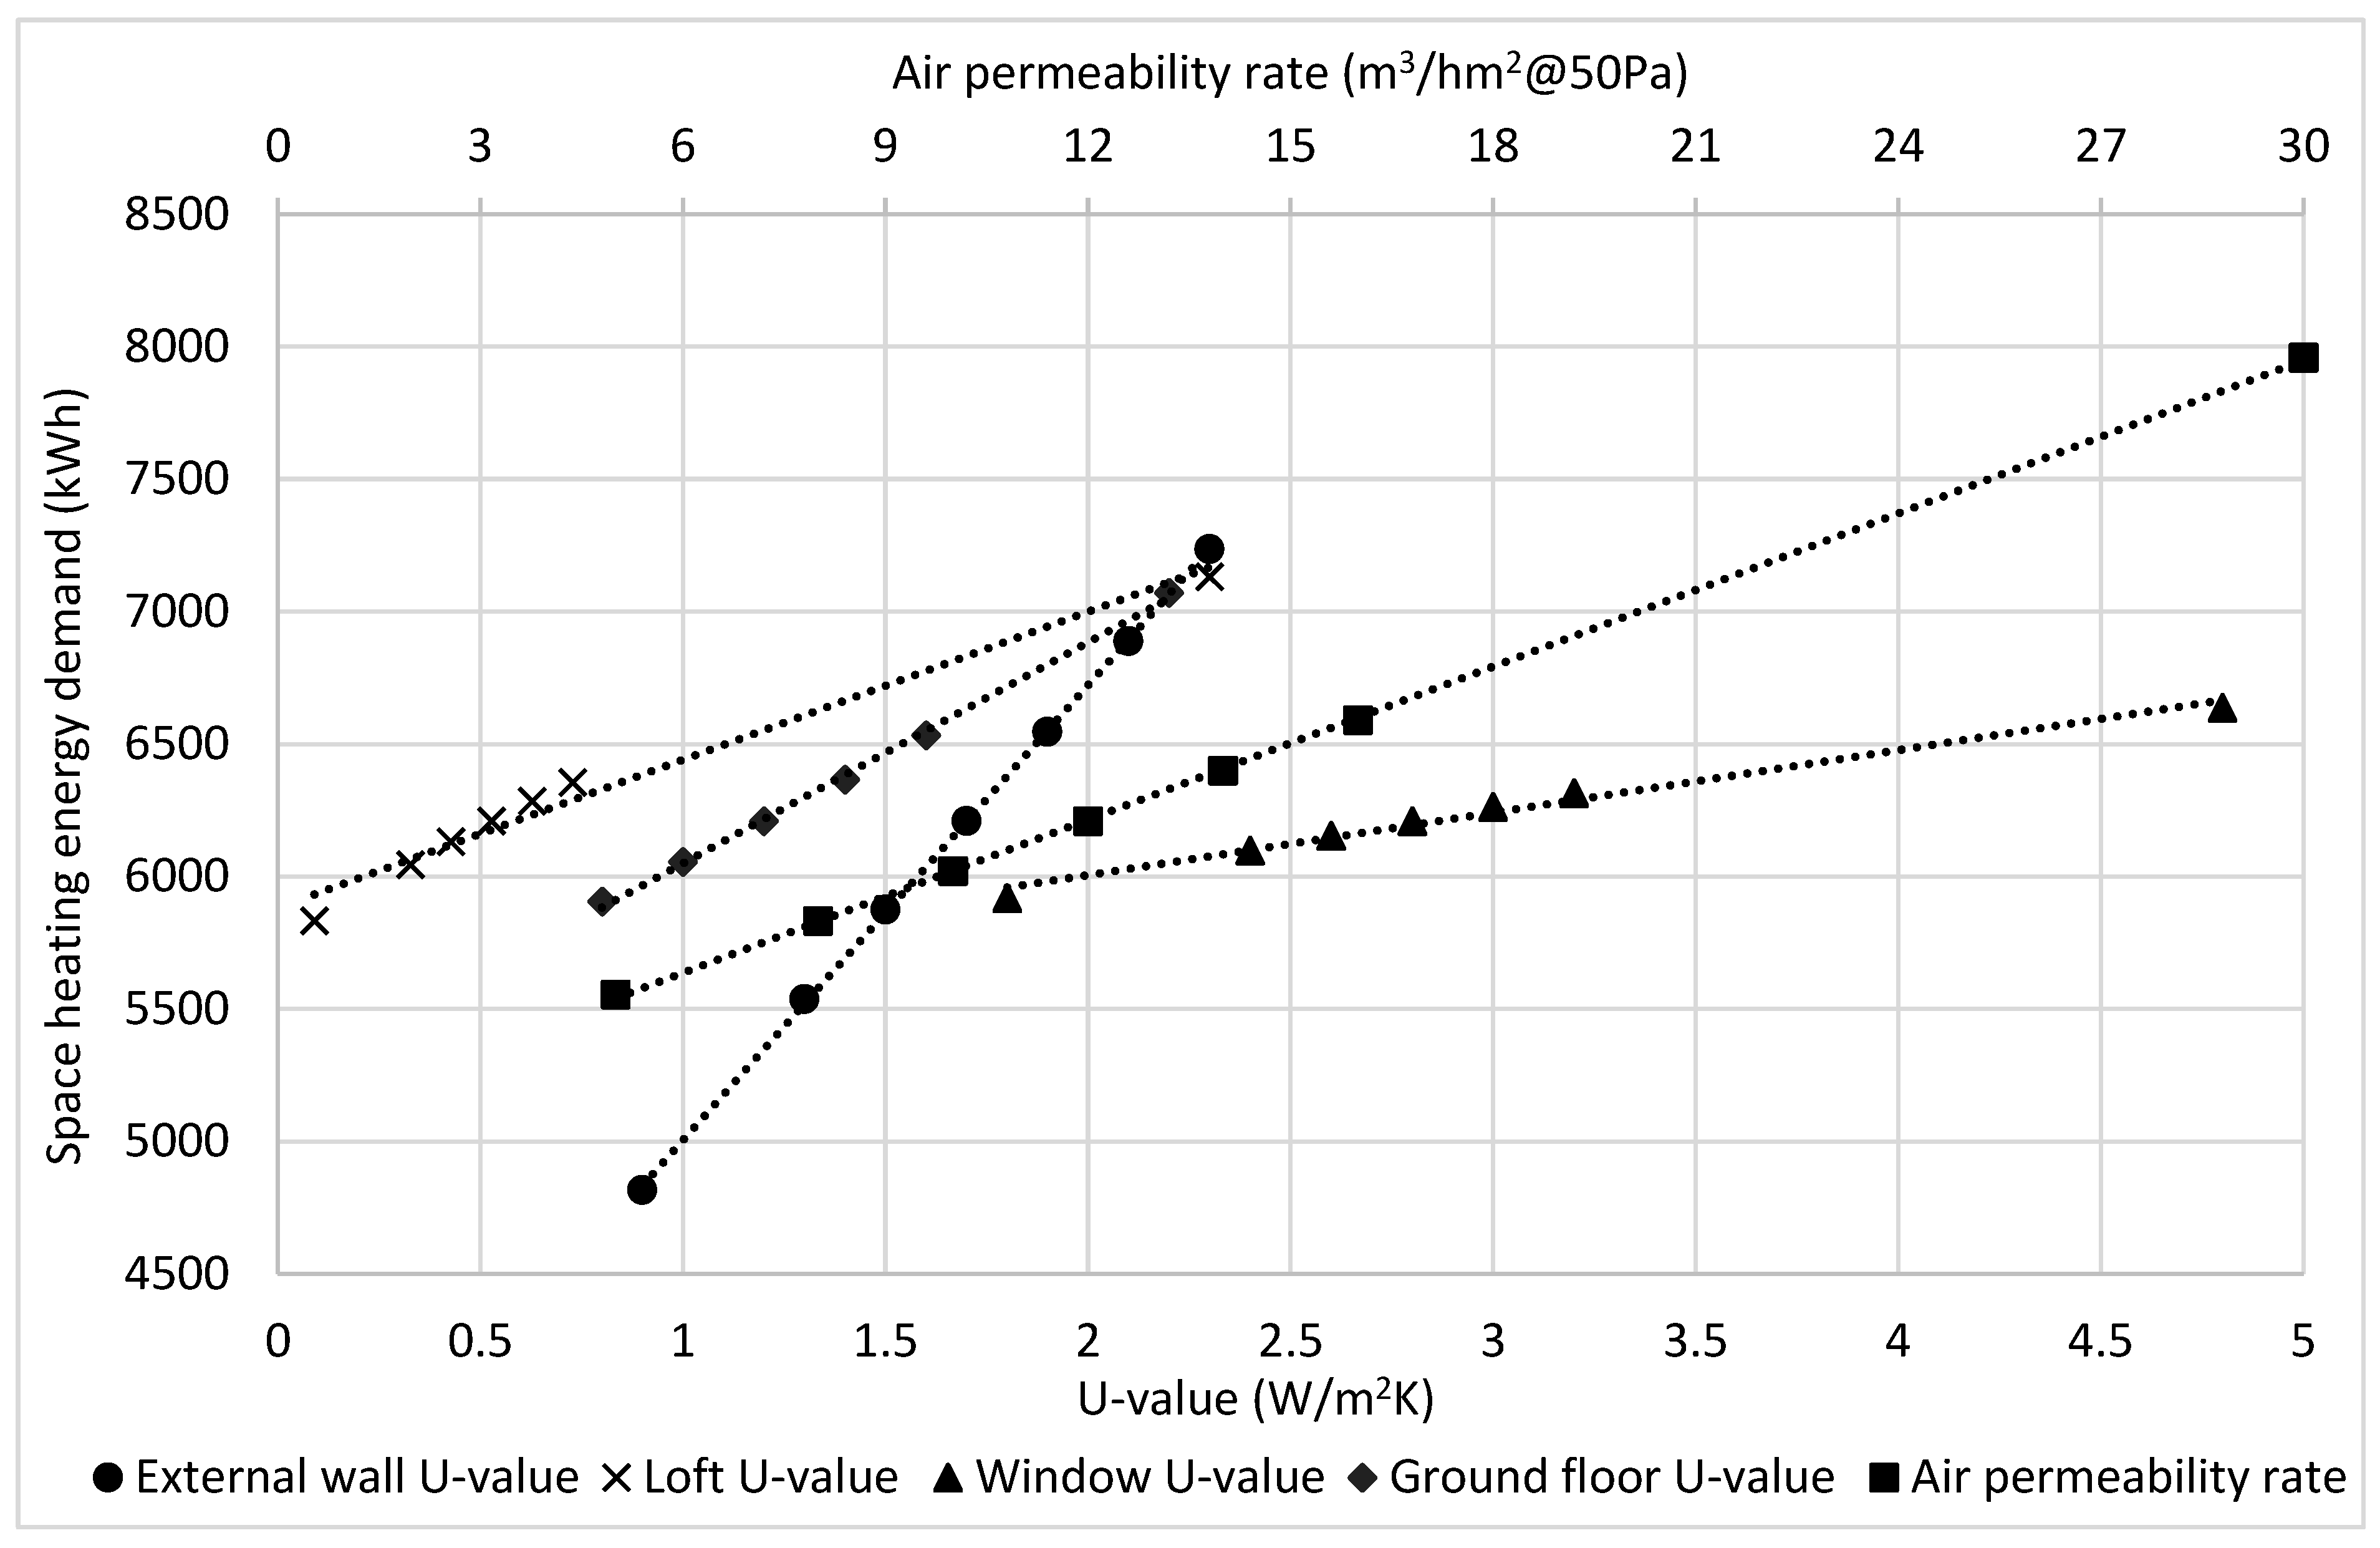
- U-value of external wall: Hulme and Doran (2015) measured the U-value for standard solid walls (solid brick walls with thickness < 330 mm) for 85 UK dwellings built before 1967; the range of the U-values found was 0.9 to 2.3 W/m2K [40];
- U-value of loft: A pre-retrofit UK dwelling can have no mineral wool insulation or up to 400 mm mineral wool insulation. Thus, the U-value of a loft is 2.3 W/m2K without mineral wool insulation, and a U-value of 0.09 W/m2K with 400 mm mineral wool insulation was selected [41];
- U-value of window: SAP (2012) suggested the U-value of 1.8 W/m2K for triple-glazed windows and 4.8 W/m2K for single-glazed windows [41]. As per SAP, the U-value for a double-glazed window varies from 2.0 to 3.1 W/m2K. Therefore, it is not considered in the analysis of lower and upper bounds for scenario evaluation;
- U-value of ground floor: Pre-retrofit solid-wall dwellings have suspended timber floors. Typically, pre-retrofit UK dwellings have no ground floor insulation, so the lower outlier is selected to be the same as the base case (1.2 W/m2K) installed. However, measurements from field studies suggested that the ground floor U-value can be much higher than 1.2 W/m2K, with 2.2 W/m2K obtained from a field study [38], which was used for the upper bound in this study;
- Air permeability rate: Stephen (2000) reported the air permeability of 384 UK dwellings using the blower door test, which revealed the range of air permeability to be 5 to 30 m3/m2h@50 Pa [42].
2.5. Development of Parameters Impacting Retrofit Performance
2.5.1. Parameter 1: Climates
2.5.2. Parameter 2: Window-to-Wall Ratios (WWR)
2.5.3. Parameter 3: Overshadowing
3. Results
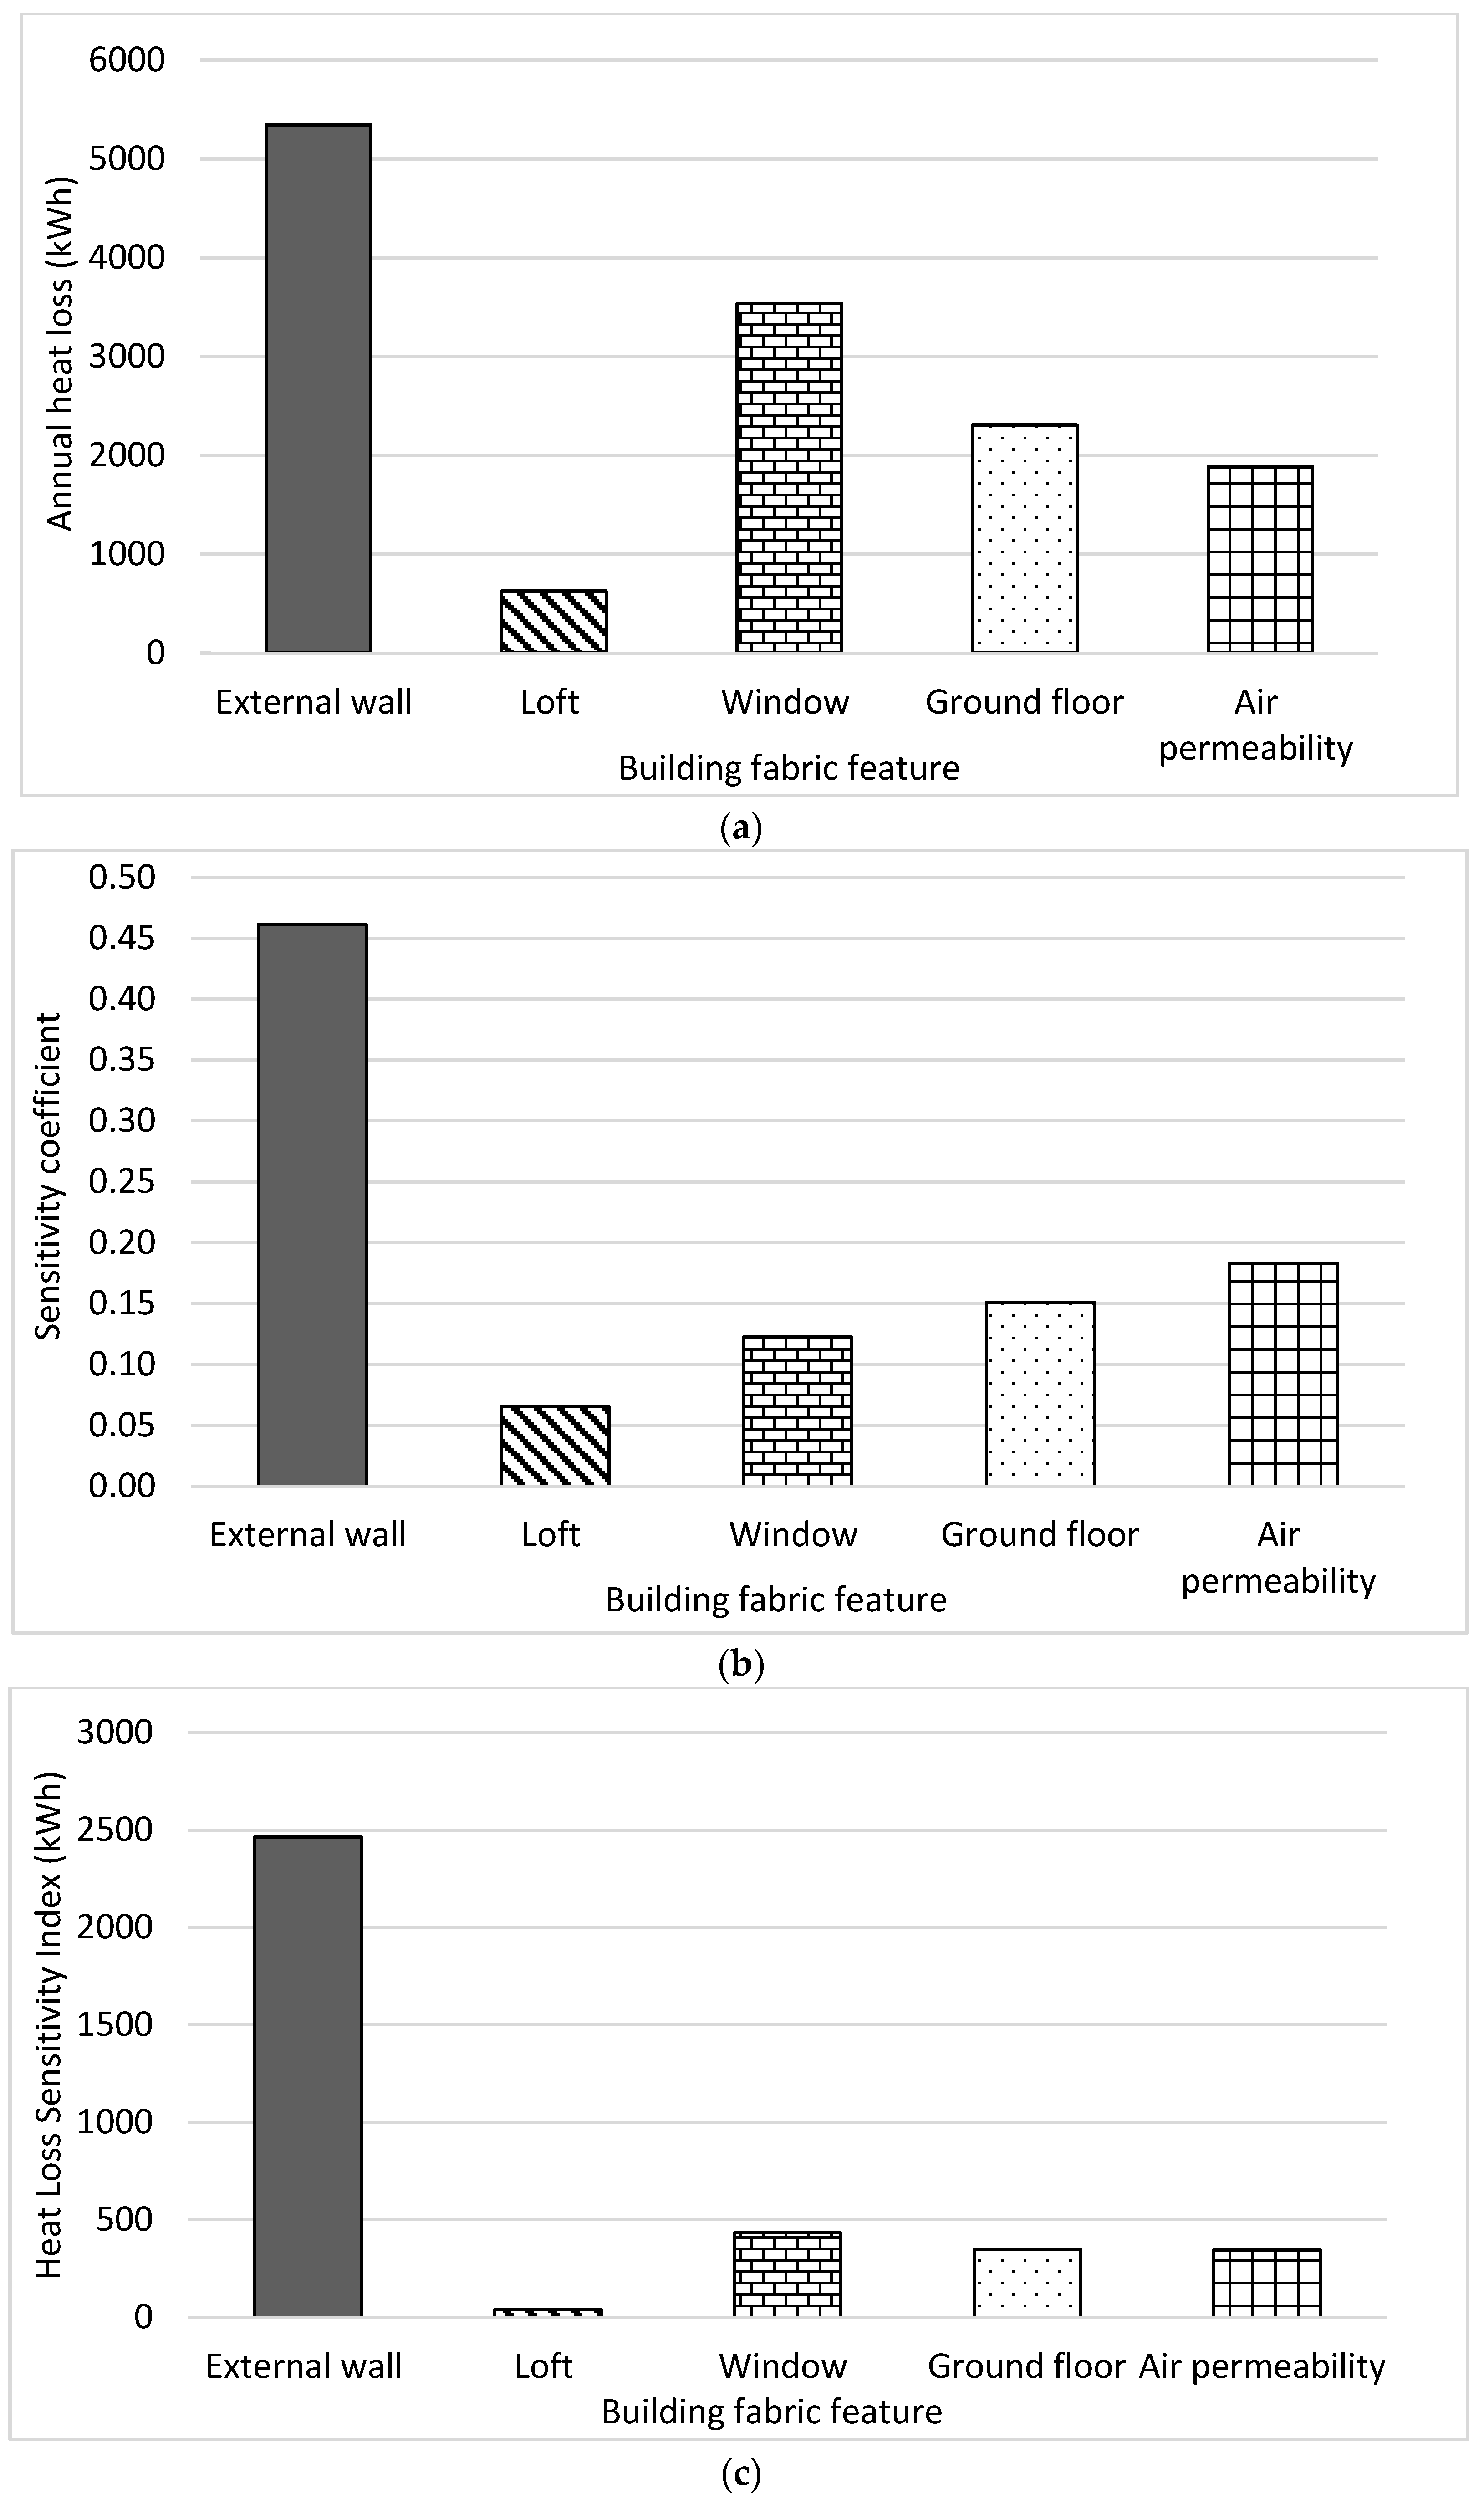
3.1. Sensitivity Coefficient
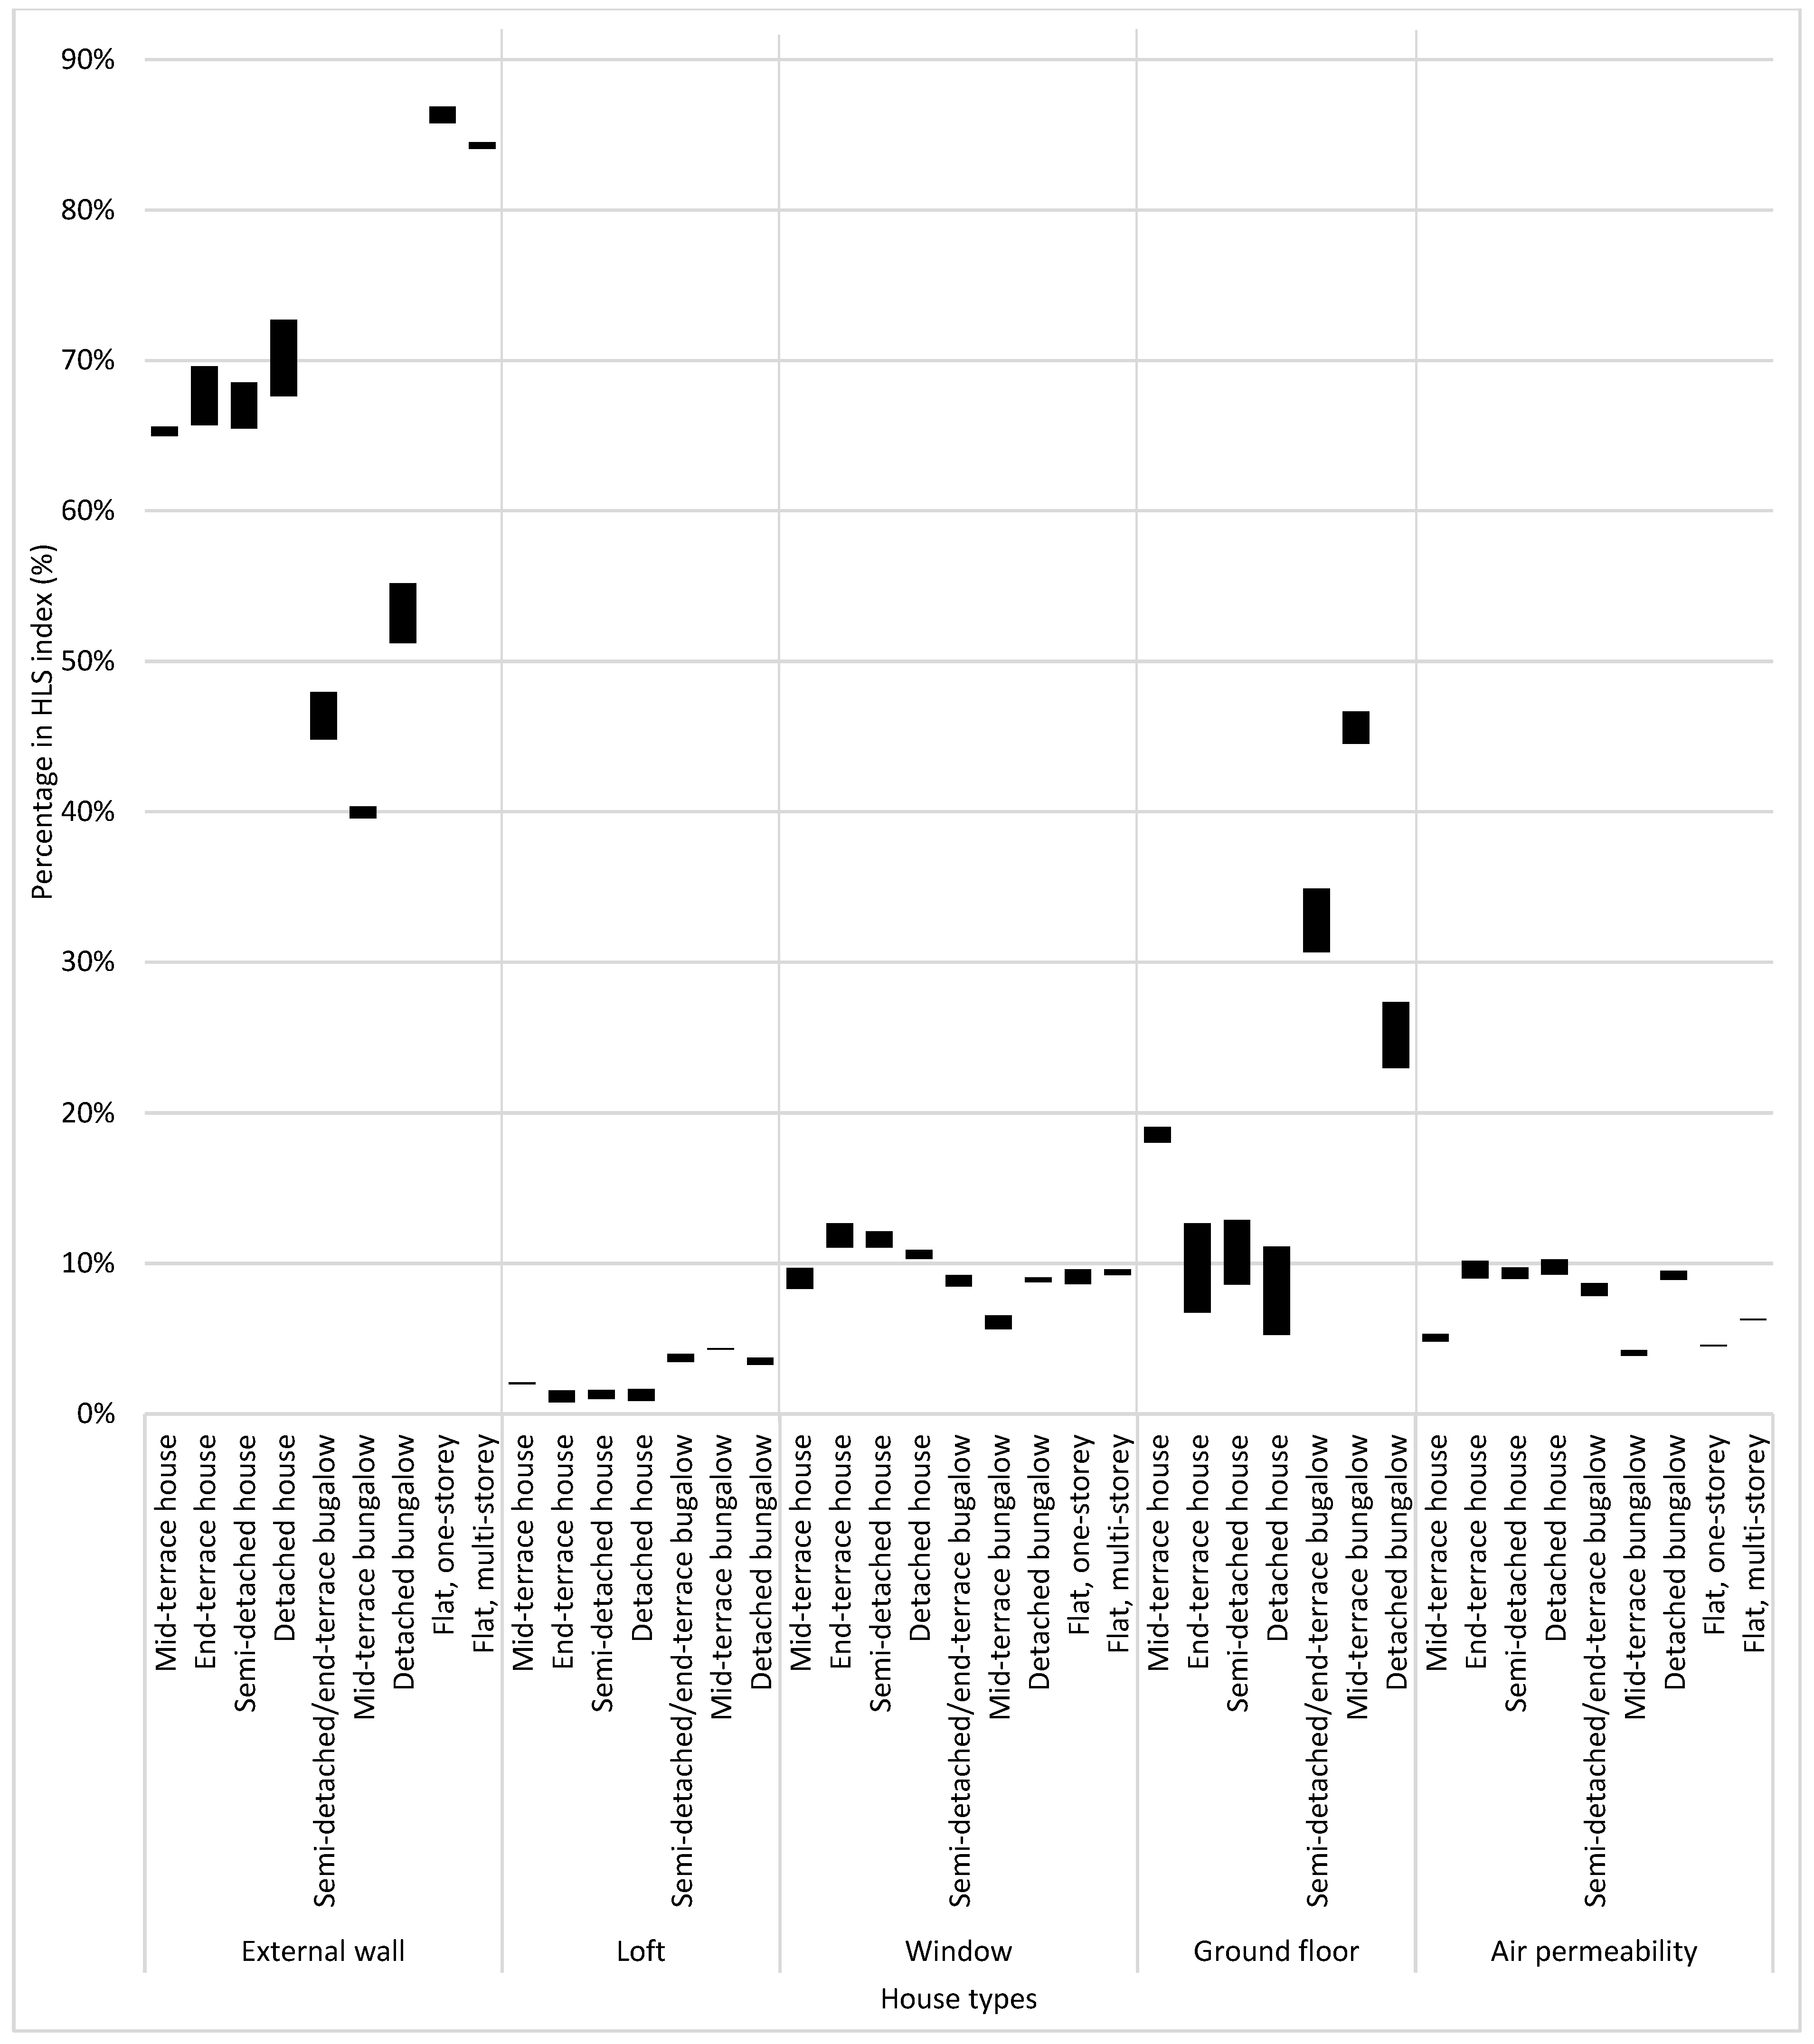
3.2. Heat Loss Sensitivity (HLS) Index and Lower and Upper Bounds
3.3. Fabric Sensitivity and Uncertainty Analysis: A Comparison of Dwelling Types
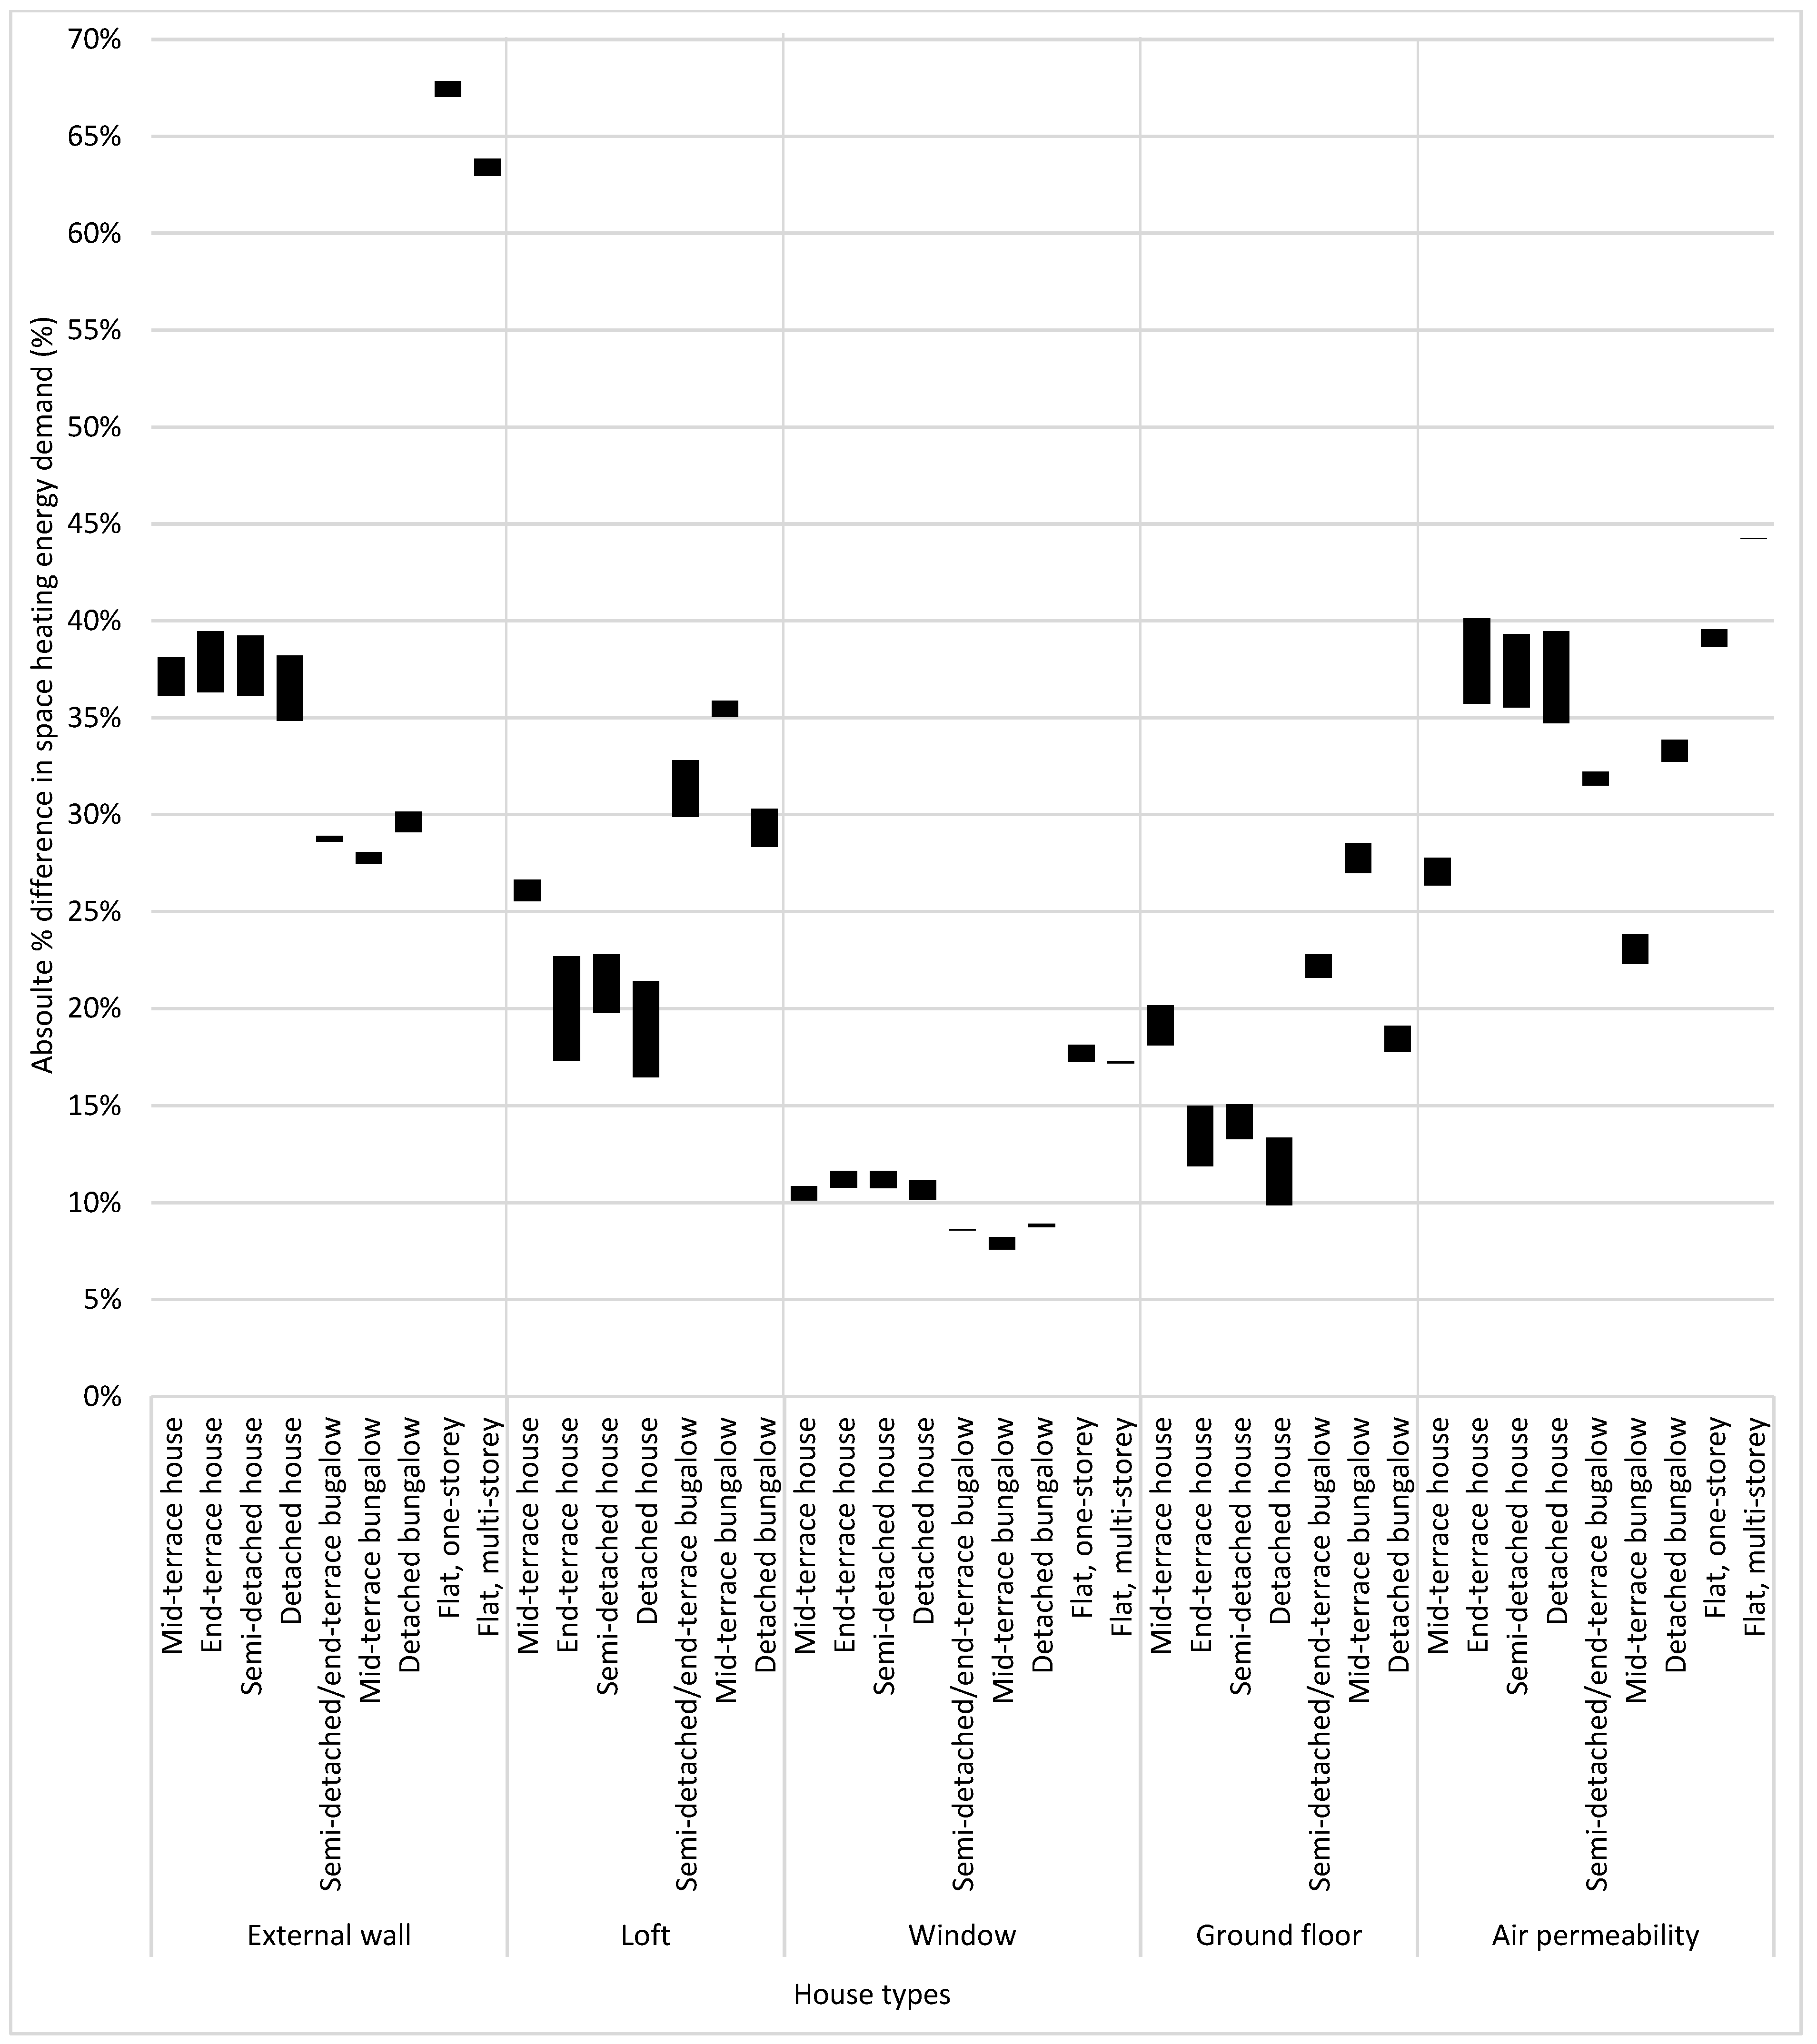
3.3.1. Space Heating Energy Demand
3.3.2. Significance of Fabric Sensitivity on Model Accuracy
3.3.3. Effect of Lower and Upper Bounds on Fabric Uncertainty
3.3.4. Selection of Representative Archetypes
3.4. Evaluation of Parameters Impacting Retrofit Performance
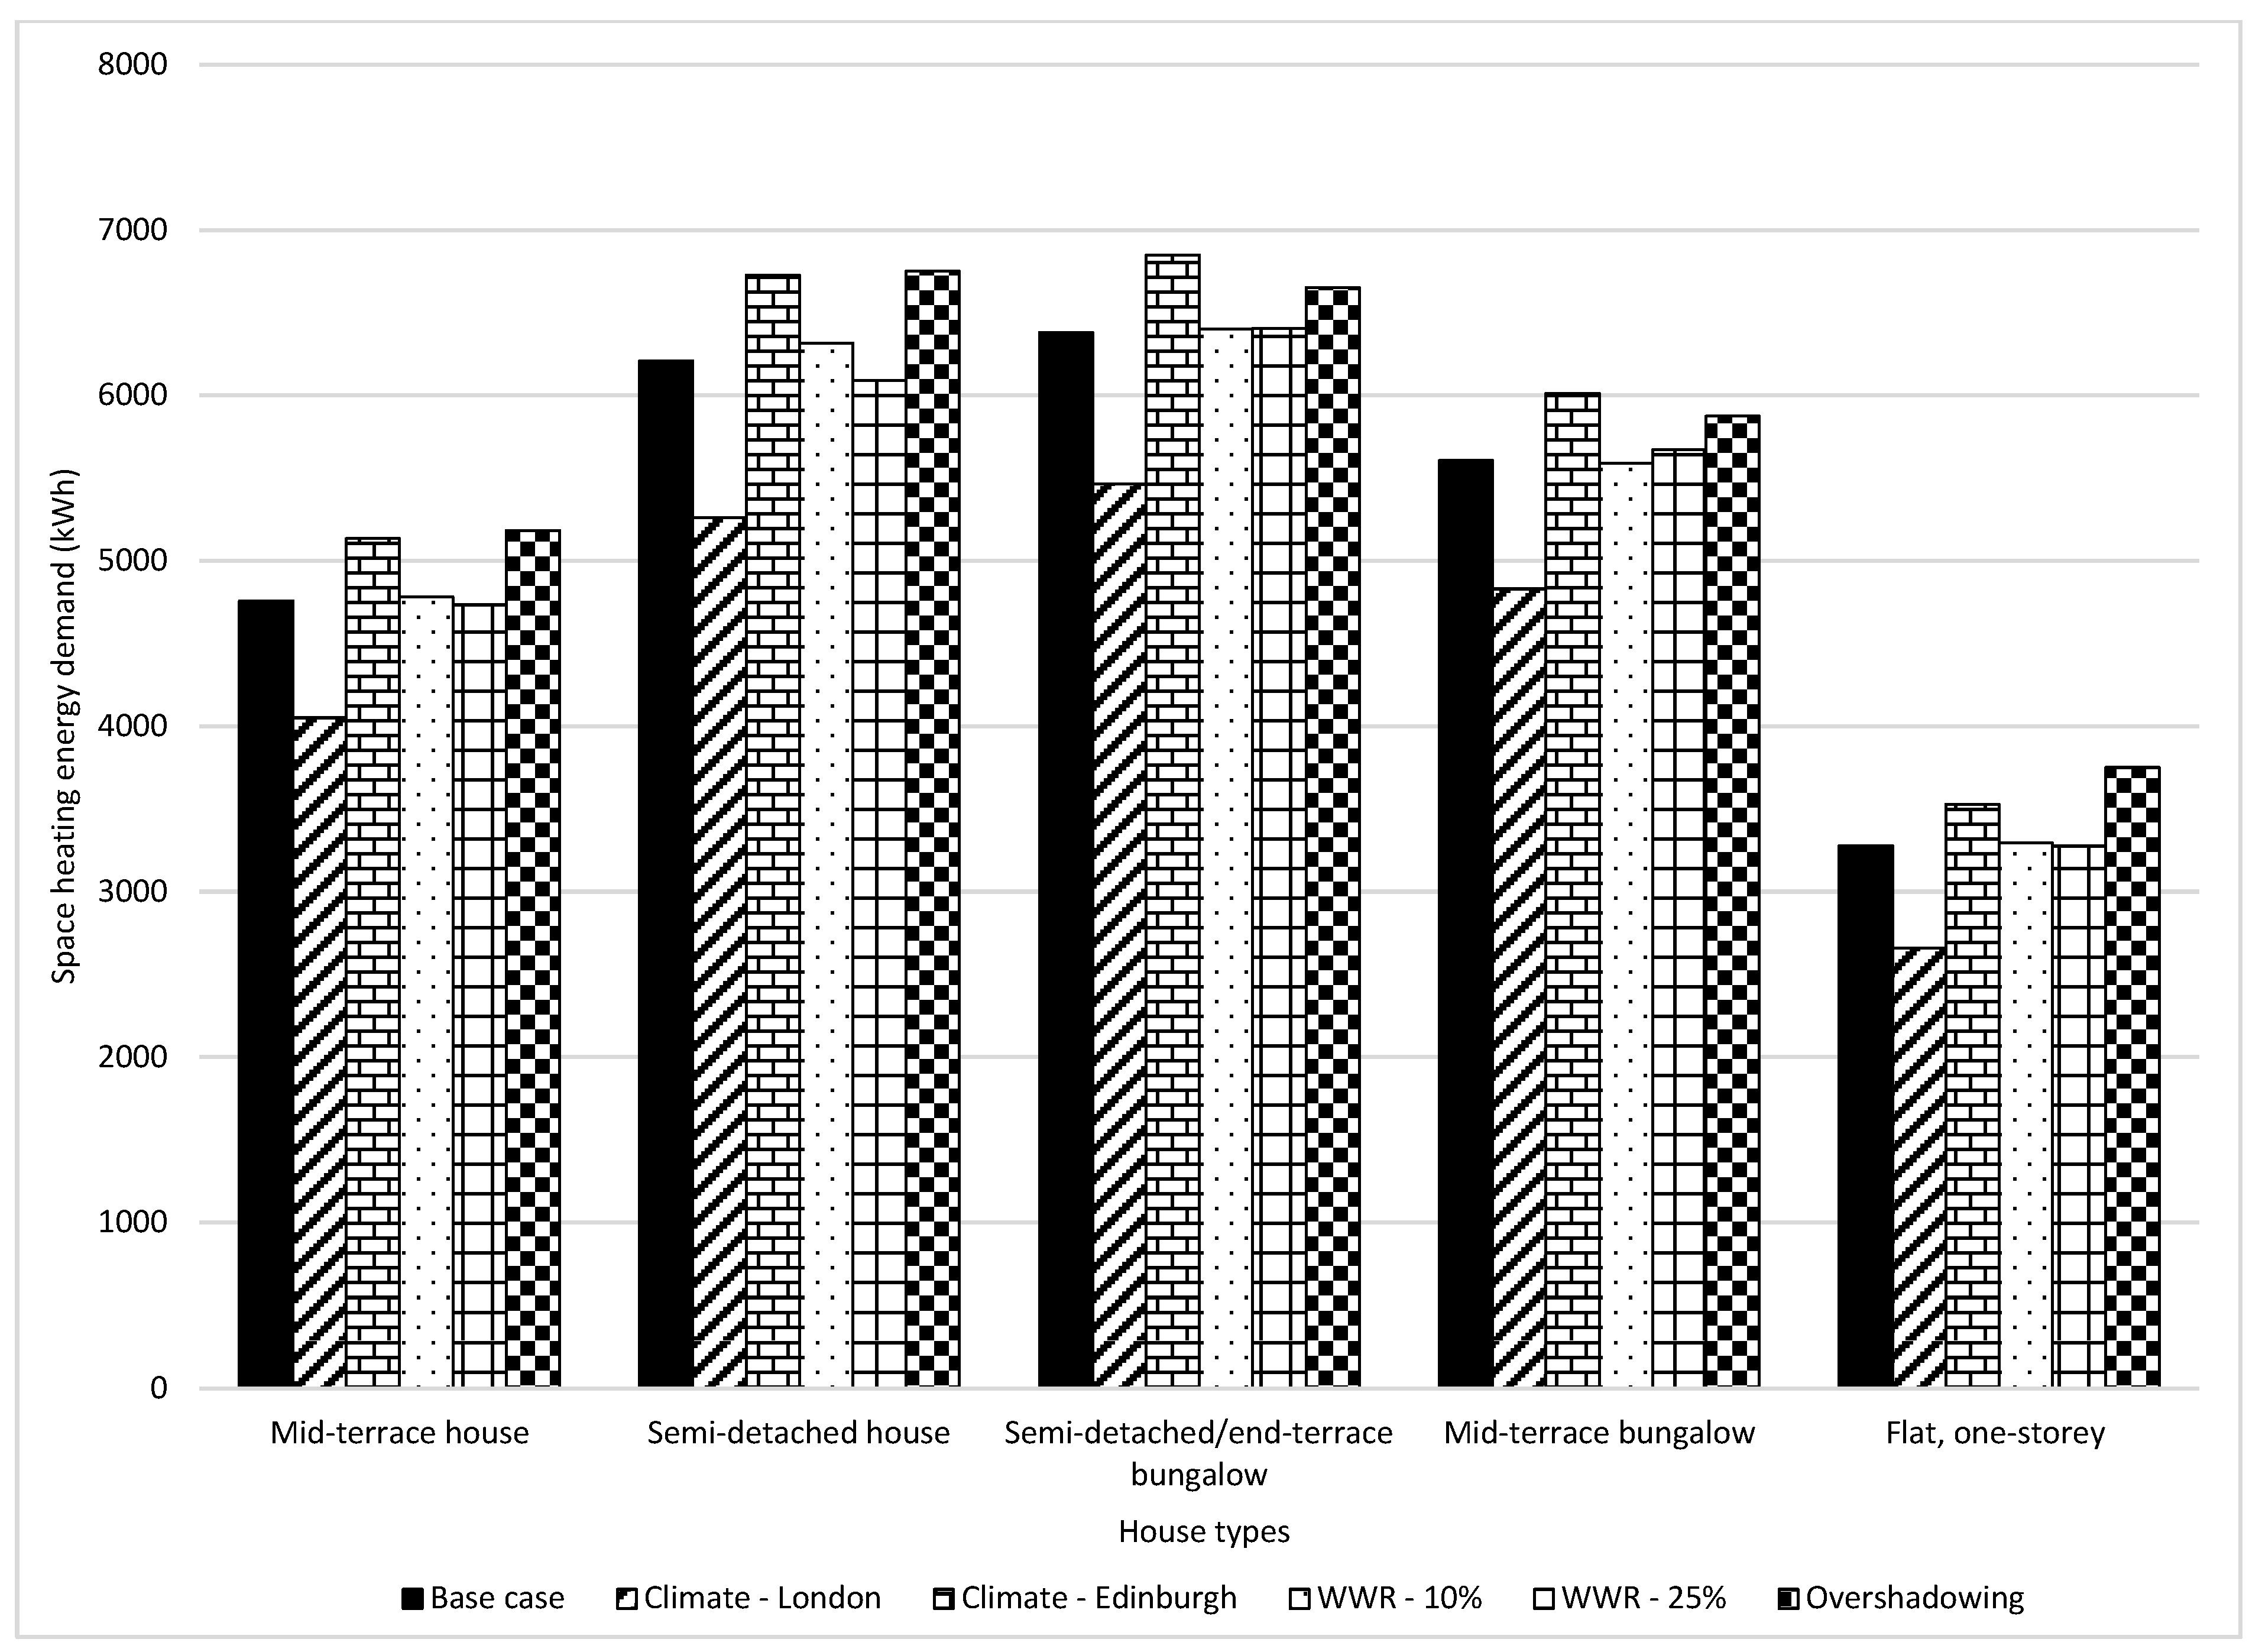
3.4.1. Impact on Space Heating Energy Demand
- Climates: The climate in London, which is warmer than Leeds, results in a decrease in space heating energy demand, ranging from 13.8–18.8%. Conversely, Edinburgh’s climate, colder than Leeds, necessitates a higher space heating energy demand, ranging from 7.3–8.3%.
- WWRs: Shifting the WWR from 15% to 10% and 25% does not significantly alter the overall space heating energy demand. However, it results in a reordering of retrofit importance, which will be further discussed in subsequent sections.
- Overshadowing: Overshadowing results in a higher increase in space heating energy demand for houses compared to bungalows. This could be attributed to the larger portions of the house being shaded from solar exposure, necessitating additional heating.
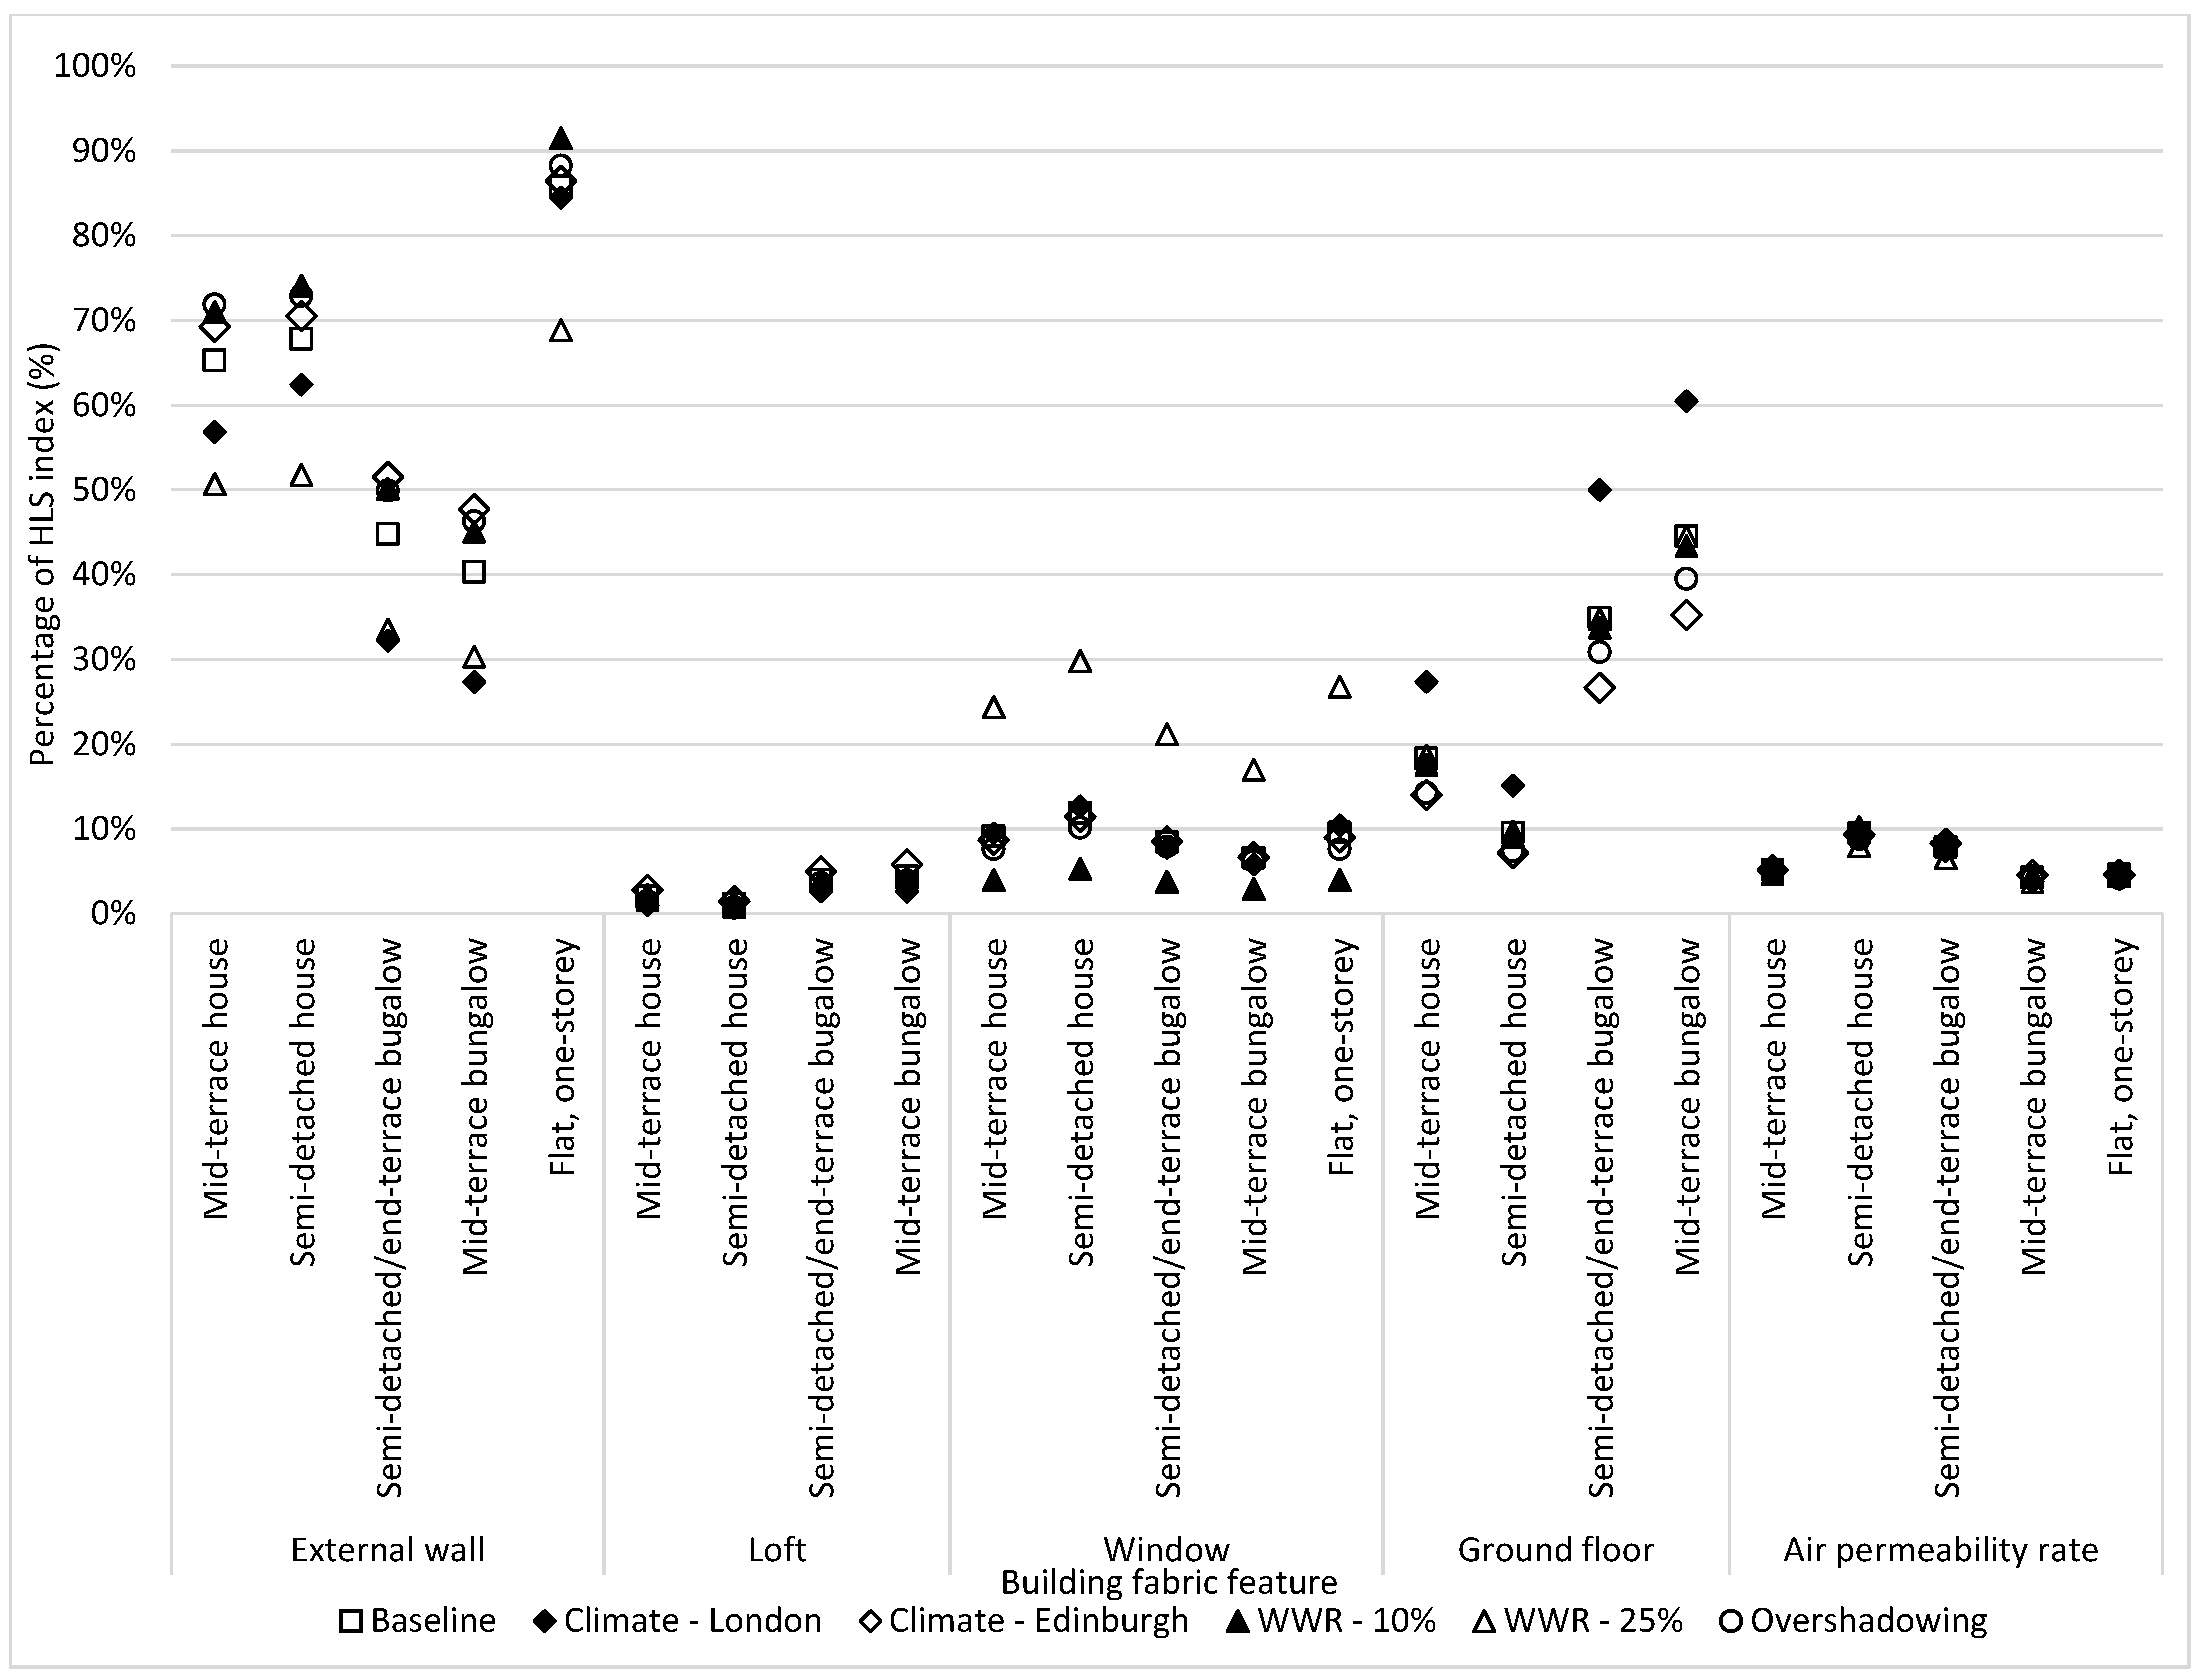
3.4.2. Impact on Heat Loss Sensitivity (HLS) Percentage
4. Discussion
- Solid external walls had the highest SC, HLS index, and impact on space heating demand when likely upper and lower bounds were considered for all archetype homes, regardless of bedroom size (Figure 8), climate, or window-to-wall ratio. They should, therefore, be prioritised in any retrofit projects on solid-walled homes. These findings suggest that the use of a limited default U-value for all solid-walled homes in RdSAP may be particularly problematic, as this is not likely to accurately represent the range in performance and benefits that may be achieved by SWI.
- Windows had a similar SC to air permeability and ground floors, but had a relatively lower HLS index, though in flats, where the WWRs are larger, the HLS index was higher. The range in likely performance for double-glazing is relatively low and, therefore, upgrading older double-glazing units may not need to be prioritised, unless the home has a particularly high WWR. Upgrading from single- to double-glazed windows should be prioritised in retrofitting.
- Air permeability had a similar SC to windows and ground floors and a relatively low HLS index. However, despite this, because there can be tremendous variation in air permeability in homes, it could be an important retrofit consideration for some, but not all, homes. For instance, in homes with excessive air leakage, air permeability can exceed external walls in terms of heat loss. Air permeability is, therefore, an important parameter to measure and it may be beneficial to set a requirement to measure air permeability in all homes having retrofit, as well as considering a minimum air permeability threshold for existing dwellings undergoing retrofits. More work would be needed to understand what an acceptable threshold for existing homes may be.
- Lofts had a similar SC to ground floors and air permeability and a greater SC than windows. However, they had among the lowest HLS indexes, meaning they may not usually need prioritising in retrofitting. Despite this, it is important to inspect the loft condition and existing insulation depths, since loft insulation may not always be to a good standard or even present, and in these cases, lofts become a significant retrofit consideration, especially in bungalows, where they can be as important as walls.
- Ground floors had a similar SC to lofts and air permeability and a relatively low HLS index in all homes, except bungalows, where the HLS index was higher, indicating that they should be higher retrofit priorities for bungalows. Furthermore, climatic region had a greater influence on ground floor retrofit than other retrofit types, perhaps indicating that ground floor retrofits should be higher priorities in areas of the UK where average annual ground floor temperatures are lower.
5. Conclusions
- External Wall Retrofitting: The HLS index validates professional intuition regarding the significance of external walls in retrofitting due to their high SC and annual heat loss. Policies should prioritise solid-wall insulation as a key retrofit measure.
- Air Permeability Assessment: Given the wide range of air permeability levels among homes, it is advisable to conduct an air permeability test, such as the Pulse test, before retrofitting. For homes with high air permeability, sealing gaps to improve airtightness could be a more cost-effective solution than implementing EWI, while also reducing carbon emissions.
- Tool Effectiveness across Different Conditions: Parametric simulations showed that climatic regions, WWRs, and overshadowing did not significantly alter the rankings of retrofit features. This confirms the tool’s applicability across diverse UK housing conditions.
Author Contributions
Funding
Data Availability Statement
Conflicts of Interest
References
- HM Goverment. 2019 UK Greenhouse Gas Emissions; Department of Business, Energy and Industrial Strategy: London, UK, 2021. [Google Scholar]
- HM Goverment. National Statistics, Energy Consumption in the UK 2021; Department of Business, Energy and Industrial Strategy: London, UK, 2021. [Google Scholar]
- HM Government. Policy Paper, The Ten Point Plan for a Green Industrial Revolution; Department of Business, Energy and Industrial Strategy: London, UK, 2020. [Google Scholar]
- Kelly, M.J. Retrofitting the existing UK building stock. Build. Res. Inf. 2009, 37, 196–200. [Google Scholar] [CrossRef]
- Power, A. Does demolition or refurbishment of old and inefficient homes help to increase our environmental, social and economic viability? Energy Policy 2008, 36, 4487–4501. [Google Scholar] [CrossRef]
- Boardman, B. Home Truths: A Low Carbon Strategy to Reduce UK Housing Emissions by 80% by 2050; University of Oxford Environmental Change Institute: Oxford, UK, 2007. [Google Scholar]
- Killip, G. Building a Greener Britain: Transforming the UK’s Existing Housing Stock; Environmental Change Institute: Oxford, UK, 2008. [Google Scholar]
- HM Government. Live Tables on Dwelling Stock Including Vacants. Table 101: By Tenure, United Kingdom; HM Government: London, UK, 2014. [Google Scholar]
- HM Government. Policy Paper, Clean Growth Strategy: Executive Summary; Department of Business, Energy and Industrial Strategy: London, UK, 2018. [Google Scholar]
- HM Government. The Climate Change Act 2008 (2050 Target Amendment) Order 2019; The Stationery Office Limited: London, UK, 2019. [Google Scholar]
- HM Goverment. Statistical Data Set; Live Tables on Energy Performance of Buildings Certificates, Table D1: Domestic Energy Performance Certificates for All Dwellings by Energy Efficiency Rating; Department of Business, Energy and Industrial Strategy: London, UK, 2021. [Google Scholar]
- HM Government. Annual Fuel Poverty Statistics in England, 2021 (2019 Data); Department of Business, Energy and Industrial Strategy: London, UK, 2021. [Google Scholar]
- HM Government. Press Release; Government Boosts Energy Efficiency Spending to £1.3 Billion with Extra Funding for Green Homes; Department of Business, Energy and Industrial Strategy: London, UK, 2021. [Google Scholar]
- HM Government. Household Energy Efficiency Statistics, Headline Release September 2021; Department of Business, Energy and Industrial Strategy: London, UK, 2021. [Google Scholar]
- HM Government. How Heating Controls Affect Domestic Energy Demand: A Rapid Evidence Assessment; Department of Energy & Climate Change: London, UK, 2014. [Google Scholar]
- HM Government. National Energy Efficiency Data-Framework (NEED): Summary of Analysis, Great Britain, 2021; Department of Business, Energy and Industrial Strategy: London, UK, 2021. [Google Scholar]
- HM Government. The Government’s Standard Assessment Procedure for Energy Rating of Dwellings, 2012nd ed.; DECC, Ed.; Building Research Establishment Ltd: Watford, UK, 2014. [Google Scholar]
- HM Government. PAS 2035:2019 Retrofitting Dwellings for Improved Energy Efficiency—Specification and Guidance; BSI Standards Limited 2019: London, UK, 2019. [Google Scholar]
- HM Government. Standard Assessment Procedure: Guidance on How Buildings Will Be SAP Energy Assessed under the Green Deal and on Recent Changes to Incentivise Low Carbon Developments; DECC, Ed.; HMSO: London, UK, 2013. [Google Scholar]
- Kelly, S.; Crawford-Brown, D.; Pollitt, M.G. Building performance evaluation and certification in the UK: Is SAP fit for purpose? Renew. Sustain. Energy Rev. 2012, 16, 6861–6878. [Google Scholar] [CrossRef]
- Zhang, Y.; Zhang, X.; Huang, P.; Sun, Y. Global sensitivity analysis for key parameters identification of net-zero energy buildings for grid interaction optimization. Appl. Energy 2020, 279, 115820. [Google Scholar] [CrossRef]
- Silva, A.S.; Ghisi, E. Estimating the sensitivity of design variables in the thermal and energy performance of buildings through a systematic procedure. J. Clean. Prod. 2020, 244, 118753. [Google Scholar] [CrossRef]
- Vivian, J.; Chiodarelli, U.; Emmi, G.; Zarrella, A. A sensitivity analysis on the heating and cooling energy flexibility of residential buildings. Sustain. Cities Soc. 2020, 52, 101815. [Google Scholar] [CrossRef]
- Mahar, W.A.; Verbeeck, G.; Reiter, S.; Attia, S. Sensitivity Analysis of Passive Design Strategies for Residential Buildings in Cold Semi-Arid Climates. Sustainability 2020, 12, 1091. [Google Scholar] [CrossRef]
- Maučec, D.; Premrov, M.; Leskovar, V.Ž. Use of sensitivity analysis for a determination of dominant design parameters affecting energy efficiency of timber buildings in different climates. Energy Sustain. Dev. 2021, 63, 86–102. [Google Scholar] [CrossRef]
- Pernetti, R.; Garzia, F.; Filippi Oberegger, U. Sensitivity analysis as support for reliable life cycle cost evaluation applied to eleven nearly zero-energy buildings in Europe. Sustain. Cities Soc. 2021, 74, 103139. [Google Scholar] [CrossRef]
- Ebrahimi-Moghadam, A.; Ildarabadi, P.; Aliakbari, K.; Fadaee, F. Sensitivity analysis and multi-objective optimization of energy consumption and thermal comfort by using interior light shelves in residential buildings. Renew. Energy 2020, 159, 736–755. [Google Scholar] [CrossRef]
- Prataviera, E.; Vivian, J.; Lombardo, G.; Zarrella, A. Evaluation of the impact of input uncertainty on urban building energy simulations using uncertainty and sensitivity analysis. Appl. Energy 2022, 311, 118691. [Google Scholar] [CrossRef]
- Na Tran, L.; Gao, W.; Ge, J. Sensitivity analysis of household factors and energy consumption in residential houses: A multi-dimensional hybrid approach using energy monitoring and modeling. Energy Build. 2021, 239, 110864. [Google Scholar] [CrossRef]
- Lomas, K.J.; Eppel, H. Sensitivity analysis techniques for building thermal simulation programs. Energy Build. 1992, 19, 21–44. [Google Scholar] [CrossRef]
- Kavgic, M.; Mumovic, D.; Summerfield, A.; Stevanovic, Z.; Ecim-Djuric, O. Uncertainty and modeling energy consumption: Sensitivity analysis for a city-scale domestic energy model. Energy Build. 2013, 60, 1–11. [Google Scholar] [CrossRef]
- Cheng, V.; Steemers, K. Modelling domestic energy consumption at district scale: A tool to support national and local energy policies. Environ. Model. Softw. 2011, 26, 1186–1198. [Google Scholar] [CrossRef]
- Hughes, M.; Palmer, J.; Cheng, V.; Shipworth, D. Sensitivity and uncertainty analysis of England’s housing energy model. Build. Res. Inf. 2013, 41, 156–167. [Google Scholar] [CrossRef]
- Firth, S.K.; Lomas, K.J.; Wright, A.J. Targeting household energy-efficiency measures using sensitivity analysis. Build. Res. Inf. 2010, 38, 24–41. [Google Scholar] [CrossRef]
- Hulme, J.; Henderson, J. ECO3 Deemed Scores Methodology; BRE: Watford, UK, 2018. [Google Scholar]
- DesignBuilder Software Ltd. DesignBuilder Version 7.0.2.006; DesignBuilder Software Ltd: Stroud, UK, 2022. [Google Scholar]
- HM Government. National Calculation Methodology (NCM) Modelling Guide (for Building other than Dwellings in England and Wales); BRE Ltd: London, UK, 2021. [Google Scholar]
- Glew, D. Demonstration of Energy Efficiency Potential (DEEP); Technical Report; Department for Energy Security and Net Zero: London, UK, 2024. Available online: https://www.gov.uk/government/publications/demonstration-of-energy-efficiency-potential-deep (accessed on 14 March 2024).
- Met Office. Met Office Integrated Data Archive System (MIDAS) Land and Marine Surface Stations Data (1853-Current); NCAS British Atmospheric Data Centre: London, UK, 2012. [Google Scholar]
- Hulme, J.; Doran, S. In-Situ Measurements of Wall U-Values in English Housing; BRE: Watford, UK, 2014. [Google Scholar]
- BRE. SAP 2012. The Government’s Standard Assessment Procedure for Energy Rating of Dwellings 2012; Building Research Establishment: Watford, UK, 2017. [Google Scholar]
- Stephen. BRE Report 359, Airtightness in UK Dwellings: BRE’s Test Results and Their Significance; Building Research Establishment: Watford, UK, 1998. [Google Scholar]
- Stone, A.; Shipworth, D.; Biddulph, P.; Oreszczyn, T. Key factors determining the energy rating of existing English houses. Build. Res. Inf. 2014, 42, 725–738. [Google Scholar] [CrossRef]
- Parker, J. The Leeds urban heat island and its implications for energy use and thermal comfort. Energy Build. 2021, 235, 110636. [Google Scholar] [CrossRef]
- Glew, D.; Parker, J.; Thomas, F.; Hardy, A.; Brooke-Peat, M.; Gorse, C. Thin Internal Wall Insulation (TIWI) Measuring Energy Performance Improvements in Dwellings Using Thin Internal Wall Insulation Annex C; Predicting TIWI Impact Energy & Hygrothermal Simulations; Technical Report; Department of Business, Energy and Industrial Strategy: London, UK, 2021. [Google Scholar]
- HM Government. The English House Condition Survey; Department of Communities and Local Government: London, UK, 2007. [Google Scholar]
- Statista. Average Number of Bedrooms in Newly-Built Houses in Britain in Each Decade Since the 1930s. Available online: https://www.statista.com/statistics/1056041/average-number-bedrooms-new-british-houses-1930-2020/#:~:text=From%20the%201930s%20until%20the,to%202.95%20rooms%20per%20house (accessed on 14 March 2024).
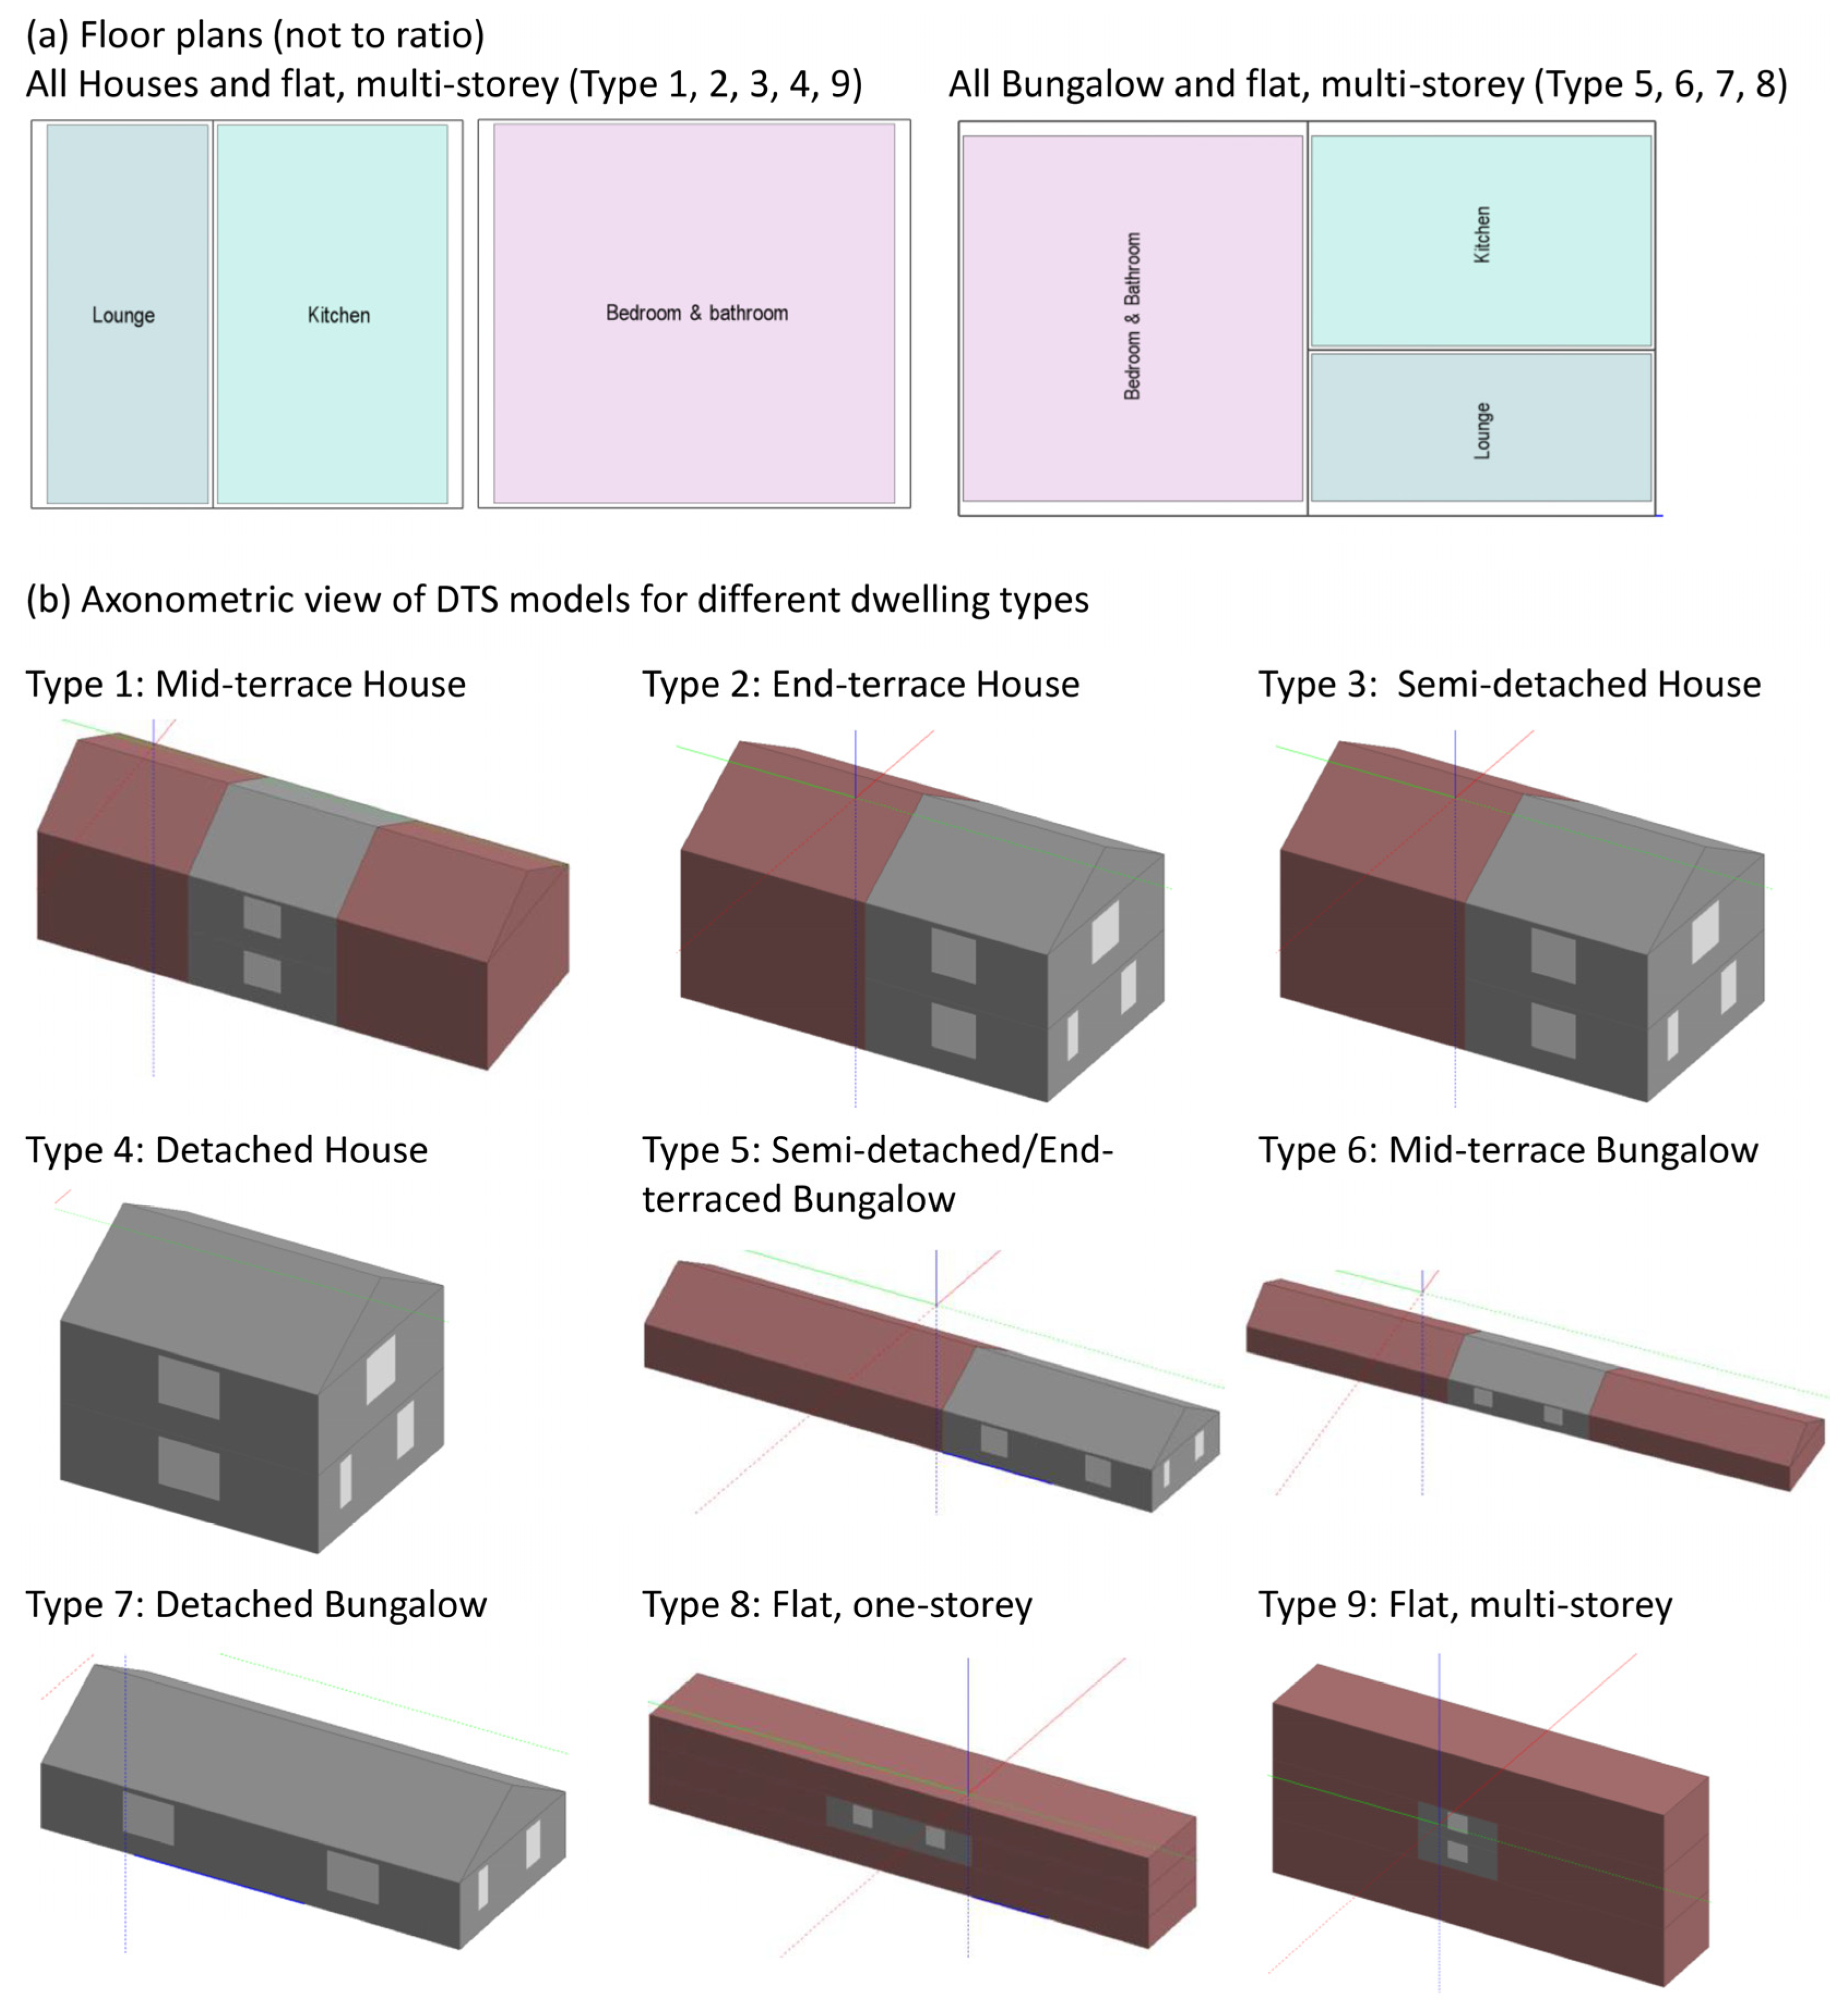


| Dwelling Type | No. of Bedrooms | Mean Total Floor Area (m2) |
|---|---|---|
| Type 1: Mid-terrace House | 1 | 51.0 |
| 2 | 69.4 | |
| 3 | 88.4 | |
| 4 | 127.8 | |
| 5 | 180.5 | |
| Type 2: End-terrace House | 1 | 51.0 |
| 2 | 69.4 | |
| 3 | 88.4 | |
| 4 | 127.8 | |
| 5 | 180.5 | |
| Type 3: Semi-detached House | 2 | 72.5 |
| 3 | 89.2 | |
| 4 | 134.6 | |
| 5 | 191.4 | |
| Type 4: Detached House | 2 | 99.7 |
| 3 | 115.7 | |
| 4 | 154.9 | |
| 5 | 228.7 | |
| 6 | 320.2 | |
| Type 5: Semi-detached or End-terrace Bungalow | 1 | 45.7 |
| 2 | 58.9 | |
| 3 | 87.1 | |
| Type 6: Mid-terrace Bungalow | 1 | 45.7 |
| 2 | 58.9 | |
| 3 | 87.1 | |
| Type 7: Detached Bungalow | 2 | 75.9 |
| 3 | 111.9 | |
| Type 8: Flat, one storey | 1 | 45.7 |
| 2 | 65.6 | |
| 3 | 86.5 | |
| Type 9: Flat, multi-storey, i.e., maisonettes | 2 | 73.8 |
| 3 | 100.7 |
| Building Fabric Features | Baseline | Perturbations | Lower Bound | Upper Bound | Reference |
|---|---|---|---|---|---|
| Solid external wall U-value (W/m2K) | 1.7 | 1.3, 1.5, 1.9, 2.1 | 0.9 | 2.3 | [40] |
| Loft U-value (W/m2K) | 0.527 | 0.327, 0.427, 0.627, 0.727 | 0.09 | 2.3 | [38] |
| Window U-value (W/m2K) | 2.8 | 2.4, 2.6, 3.0, 3.2 | 1.8 | 4.8 | [38] |
| Suspended ground floor U-value (W/m2K) | 1.2 | 0.8, 1.0, 1.4, 1.6 | 1.2 | 2.2 | [38] |
| Air permeability rate (m3/hm2@50 Pa) | 12 | 8, 10, 14, 16 | 5 | 30 | [42] |
Disclaimer/Publisher’s Note: The statements, opinions and data contained in all publications are solely those of the individual author(s) and contributor(s) and not of MDPI and/or the editor(s). MDPI and/or the editor(s) disclaim responsibility for any injury to people or property resulting from any ideas, methods, instructions or products referred to in the content. |
© 2024 by the authors. Licensee MDPI, Basel, Switzerland. This article is an open access article distributed under the terms and conditions of the Creative Commons Attribution (CC BY) license (https://creativecommons.org/licenses/by/4.0/).
Share and Cite
Tsang, C.; Parker, J.; Glew, D. A Heat Loss Sensitivity Index to Inform Housing Retrofit Policy in the UK. Buildings 2024, 14, 834. https://doi.org/10.3390/buildings14030834
Tsang C, Parker J, Glew D. A Heat Loss Sensitivity Index to Inform Housing Retrofit Policy in the UK. Buildings. 2024; 14(3):834. https://doi.org/10.3390/buildings14030834
Chicago/Turabian StyleTsang, Christopher, James Parker, and David Glew. 2024. "A Heat Loss Sensitivity Index to Inform Housing Retrofit Policy in the UK" Buildings 14, no. 3: 834. https://doi.org/10.3390/buildings14030834
APA StyleTsang, C., Parker, J., & Glew, D. (2024). A Heat Loss Sensitivity Index to Inform Housing Retrofit Policy in the UK. Buildings, 14(3), 834. https://doi.org/10.3390/buildings14030834