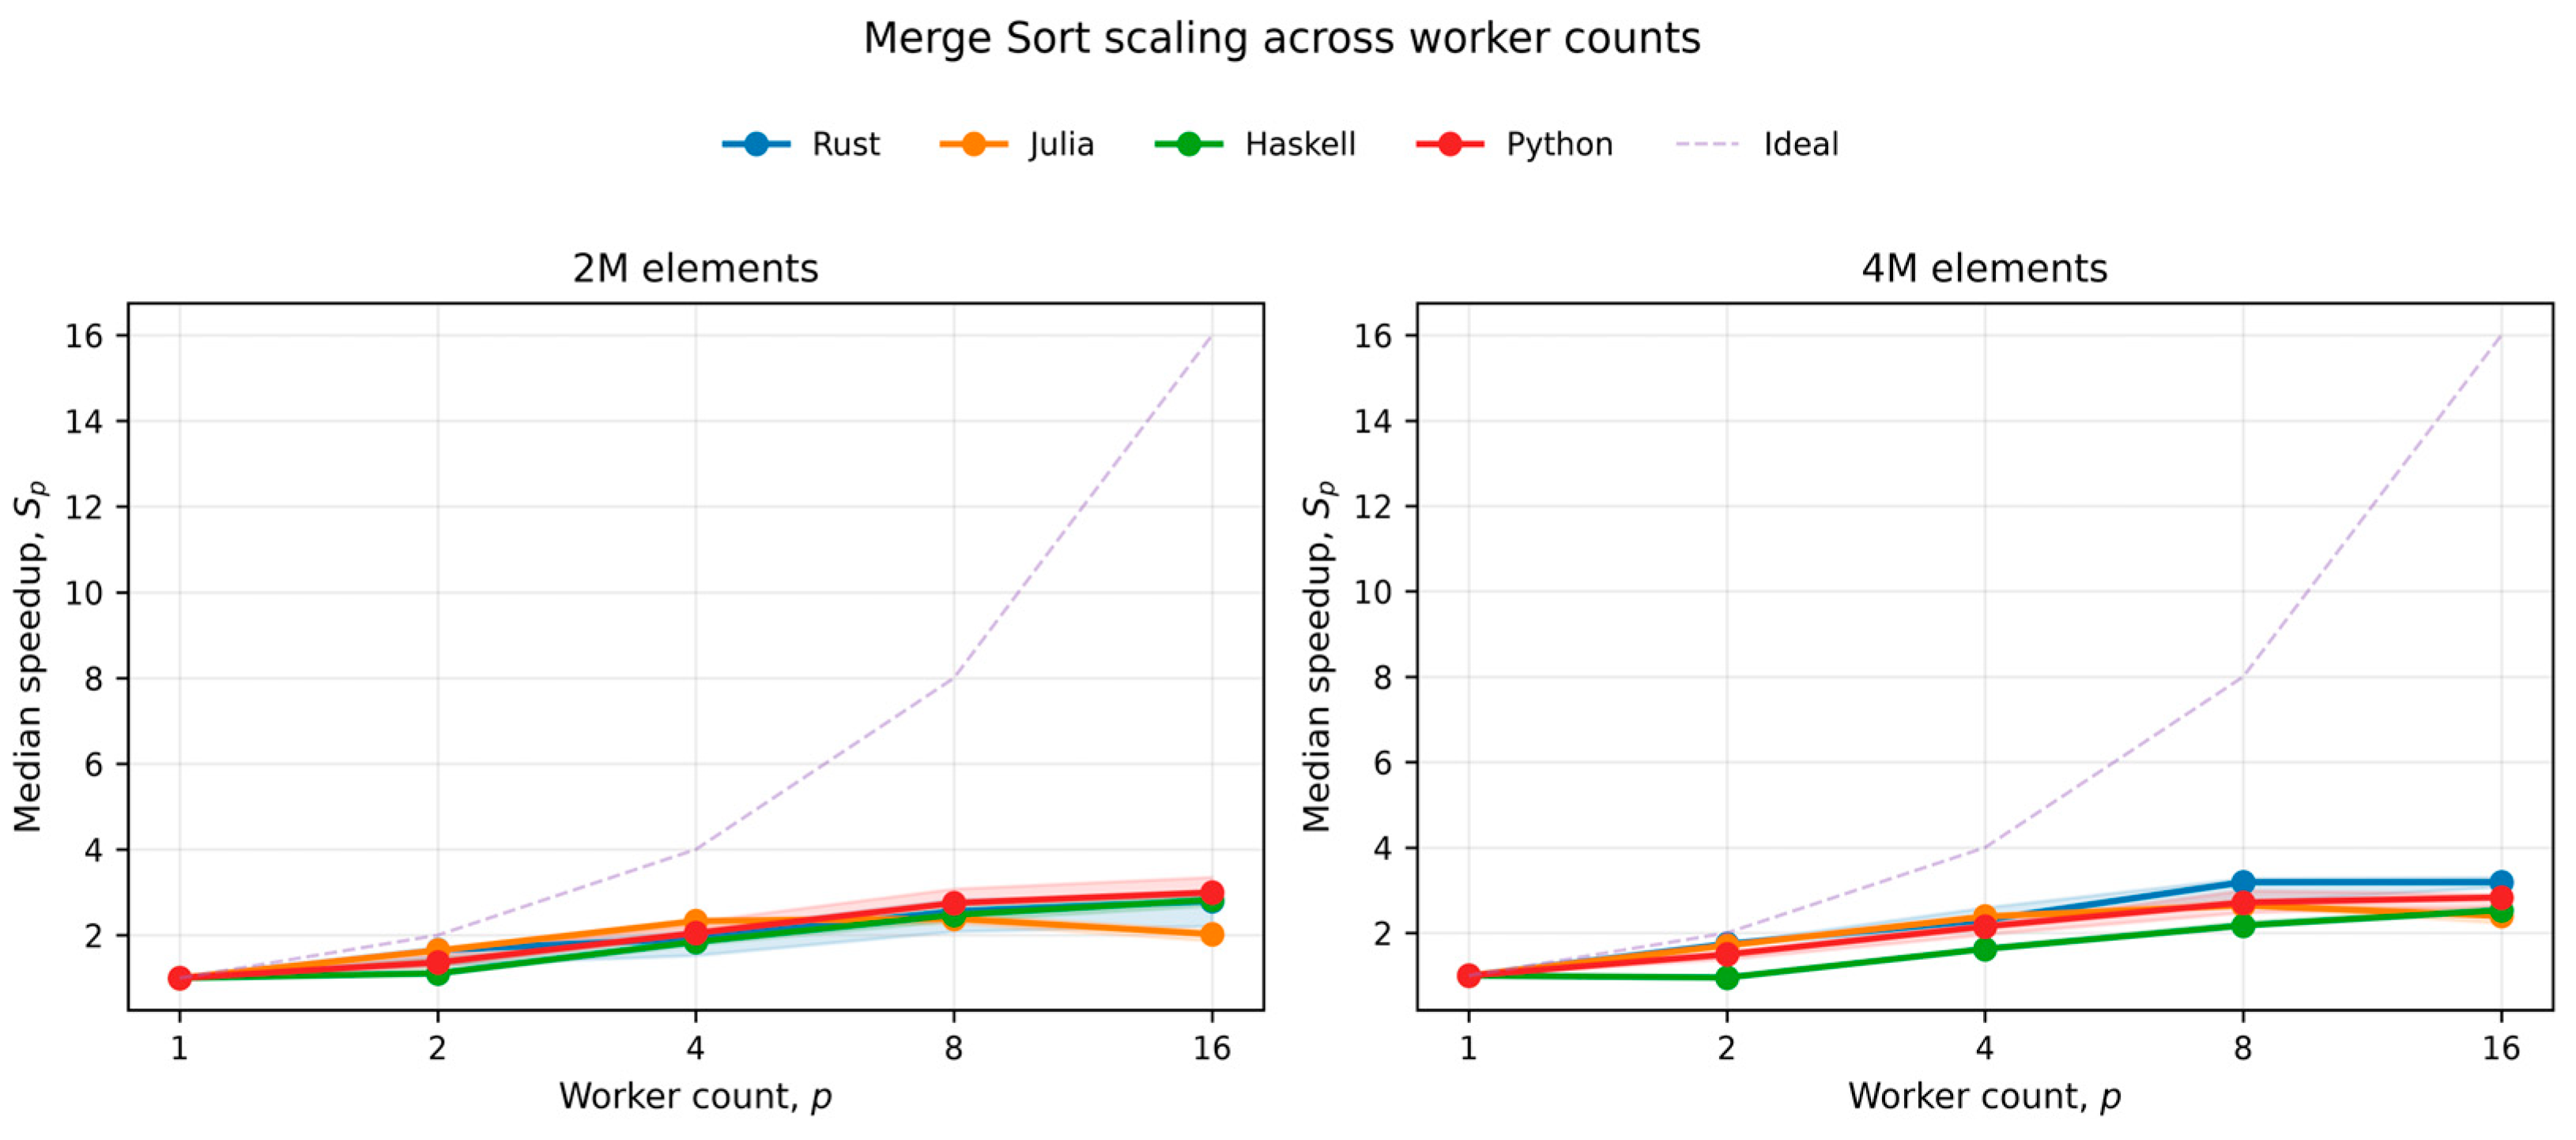
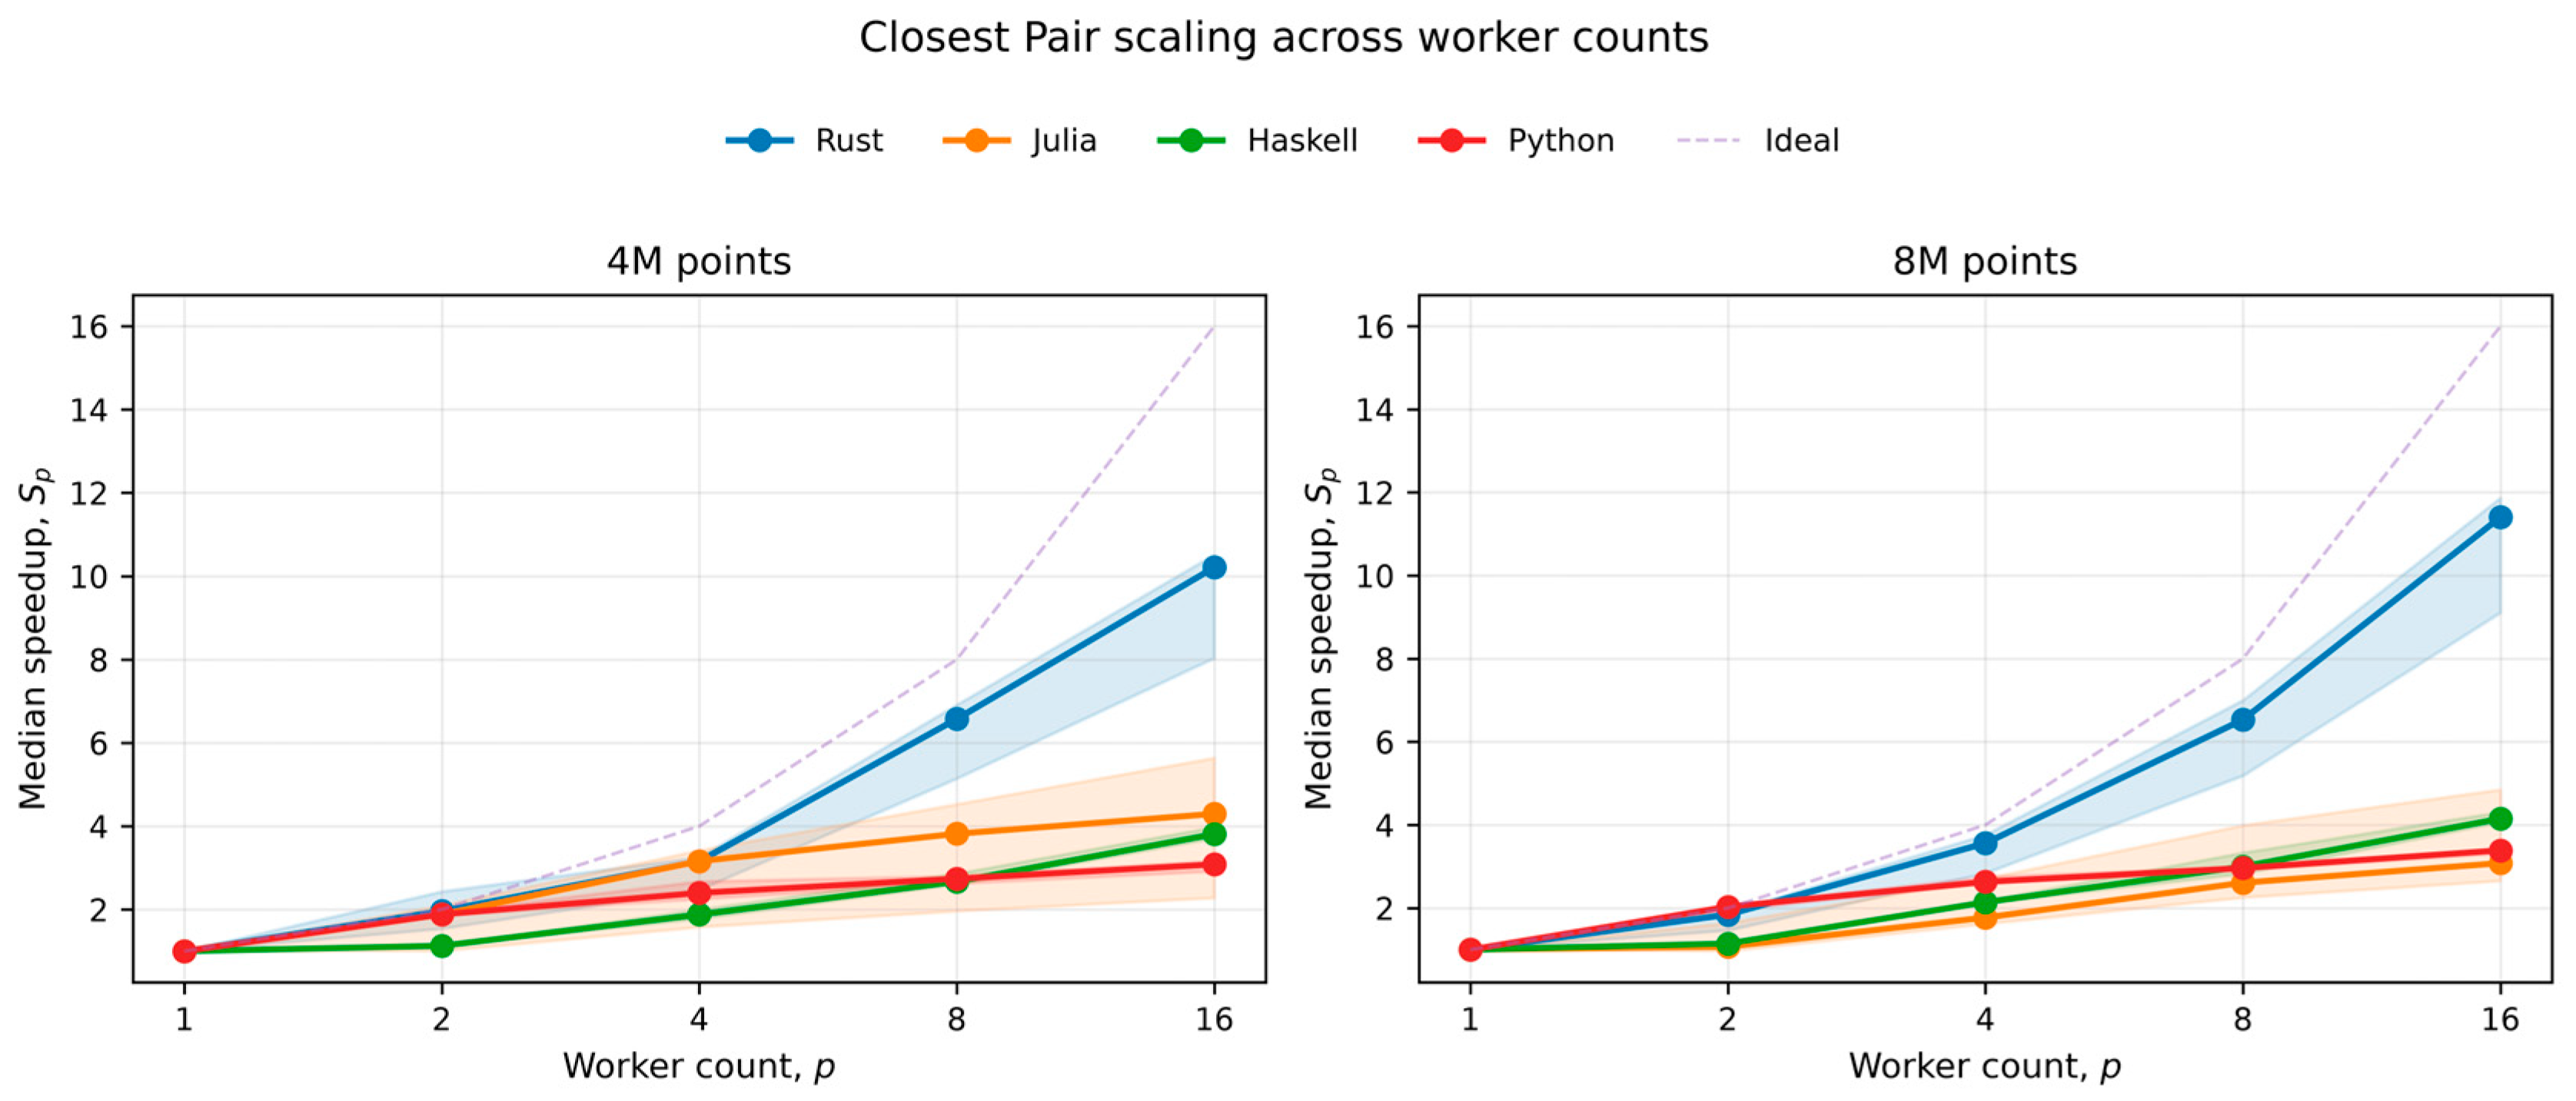
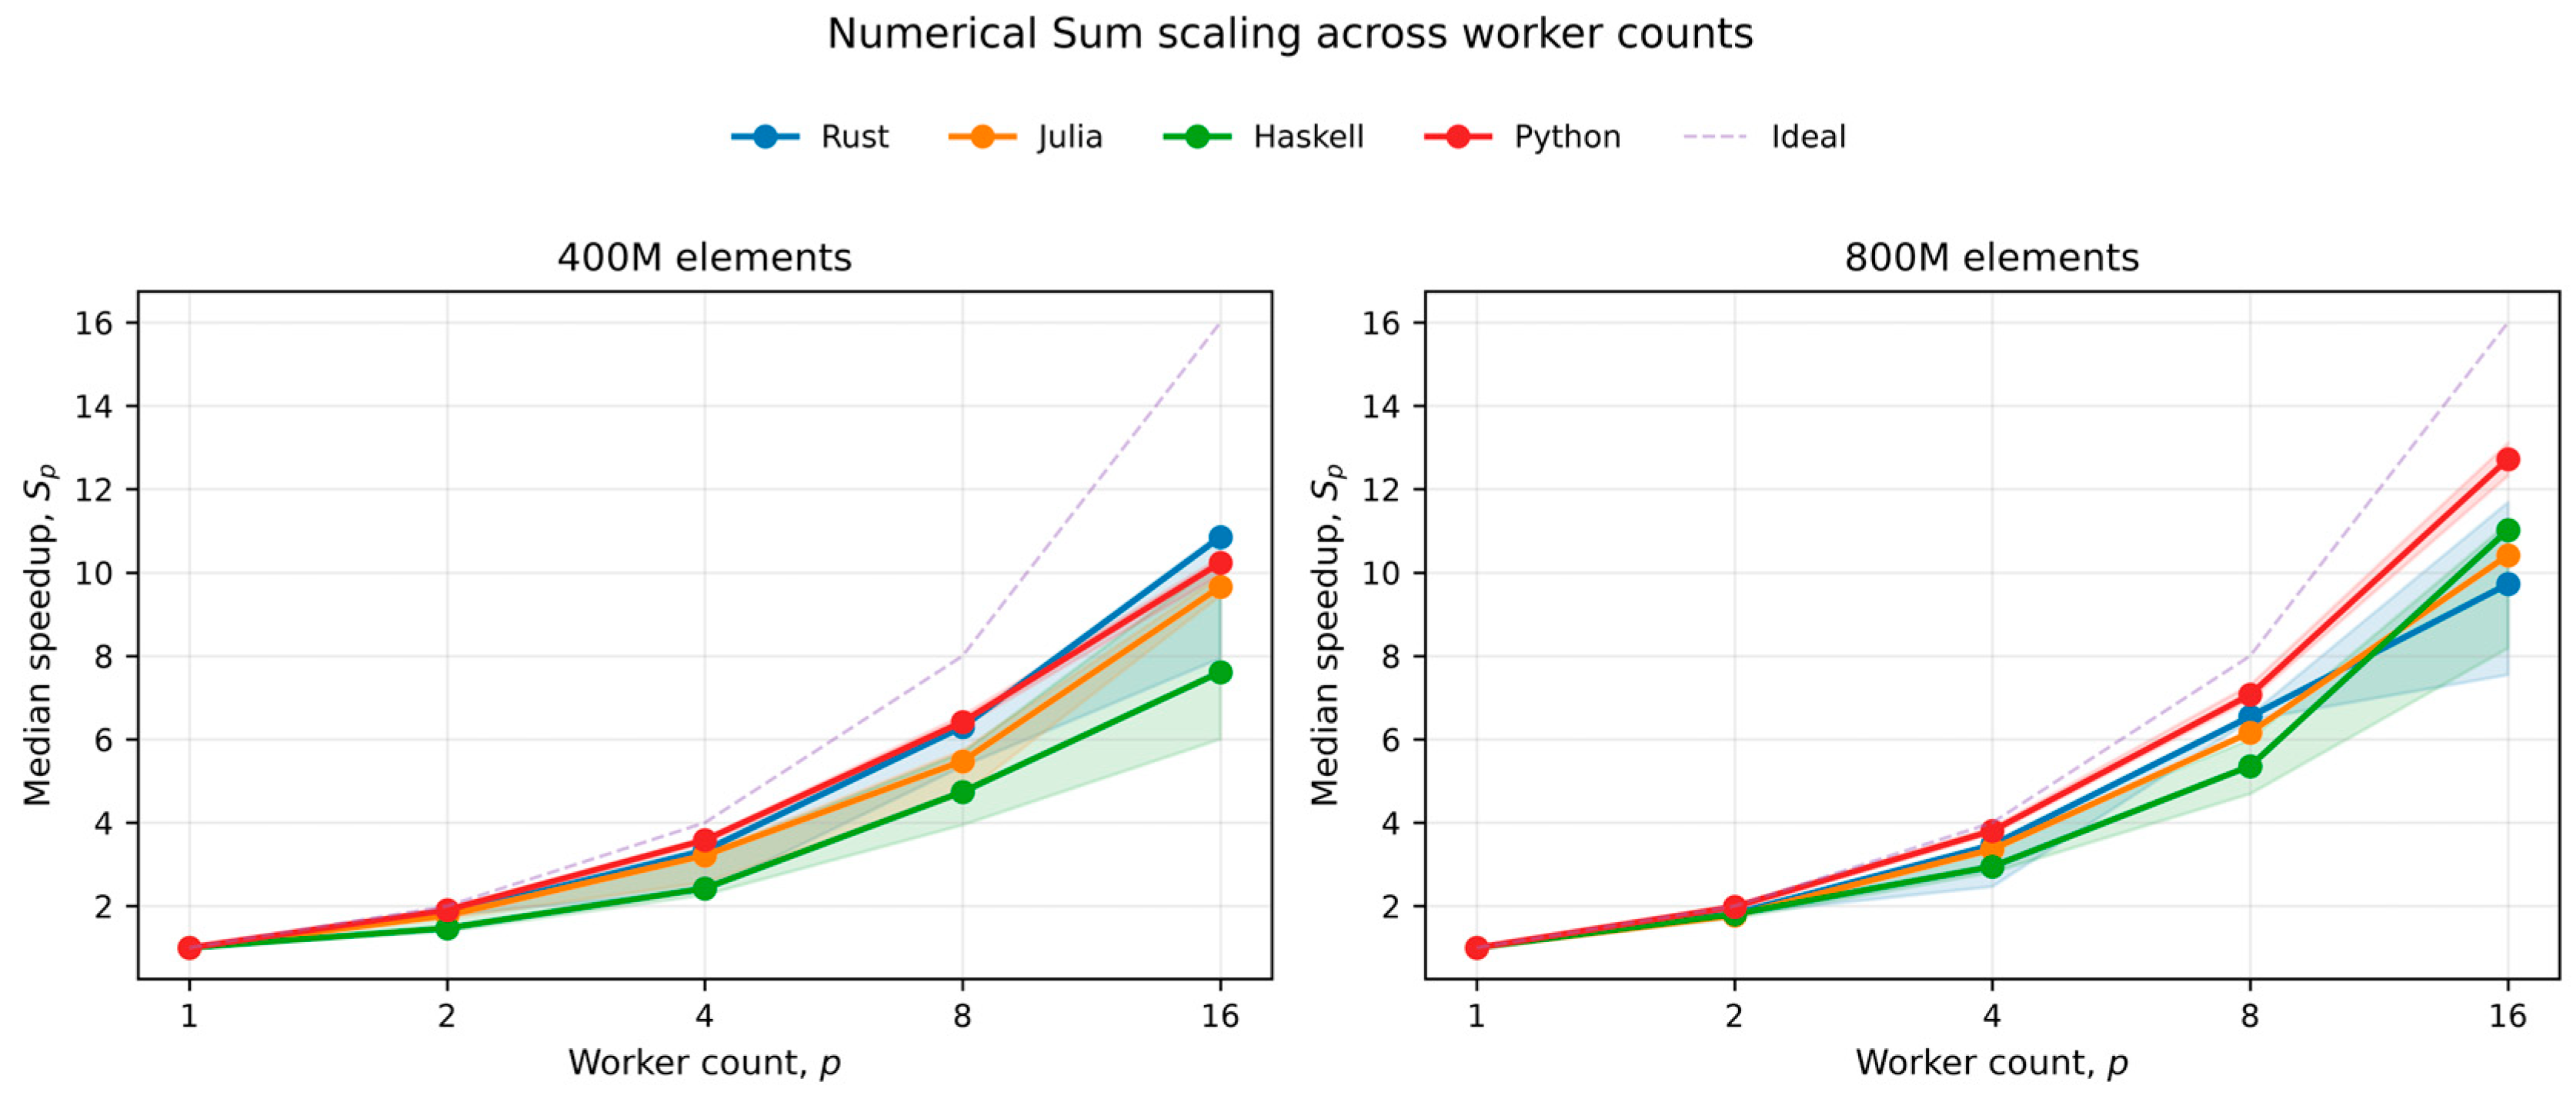
6.1. From Scaling Curves to Bottleneck Evolution
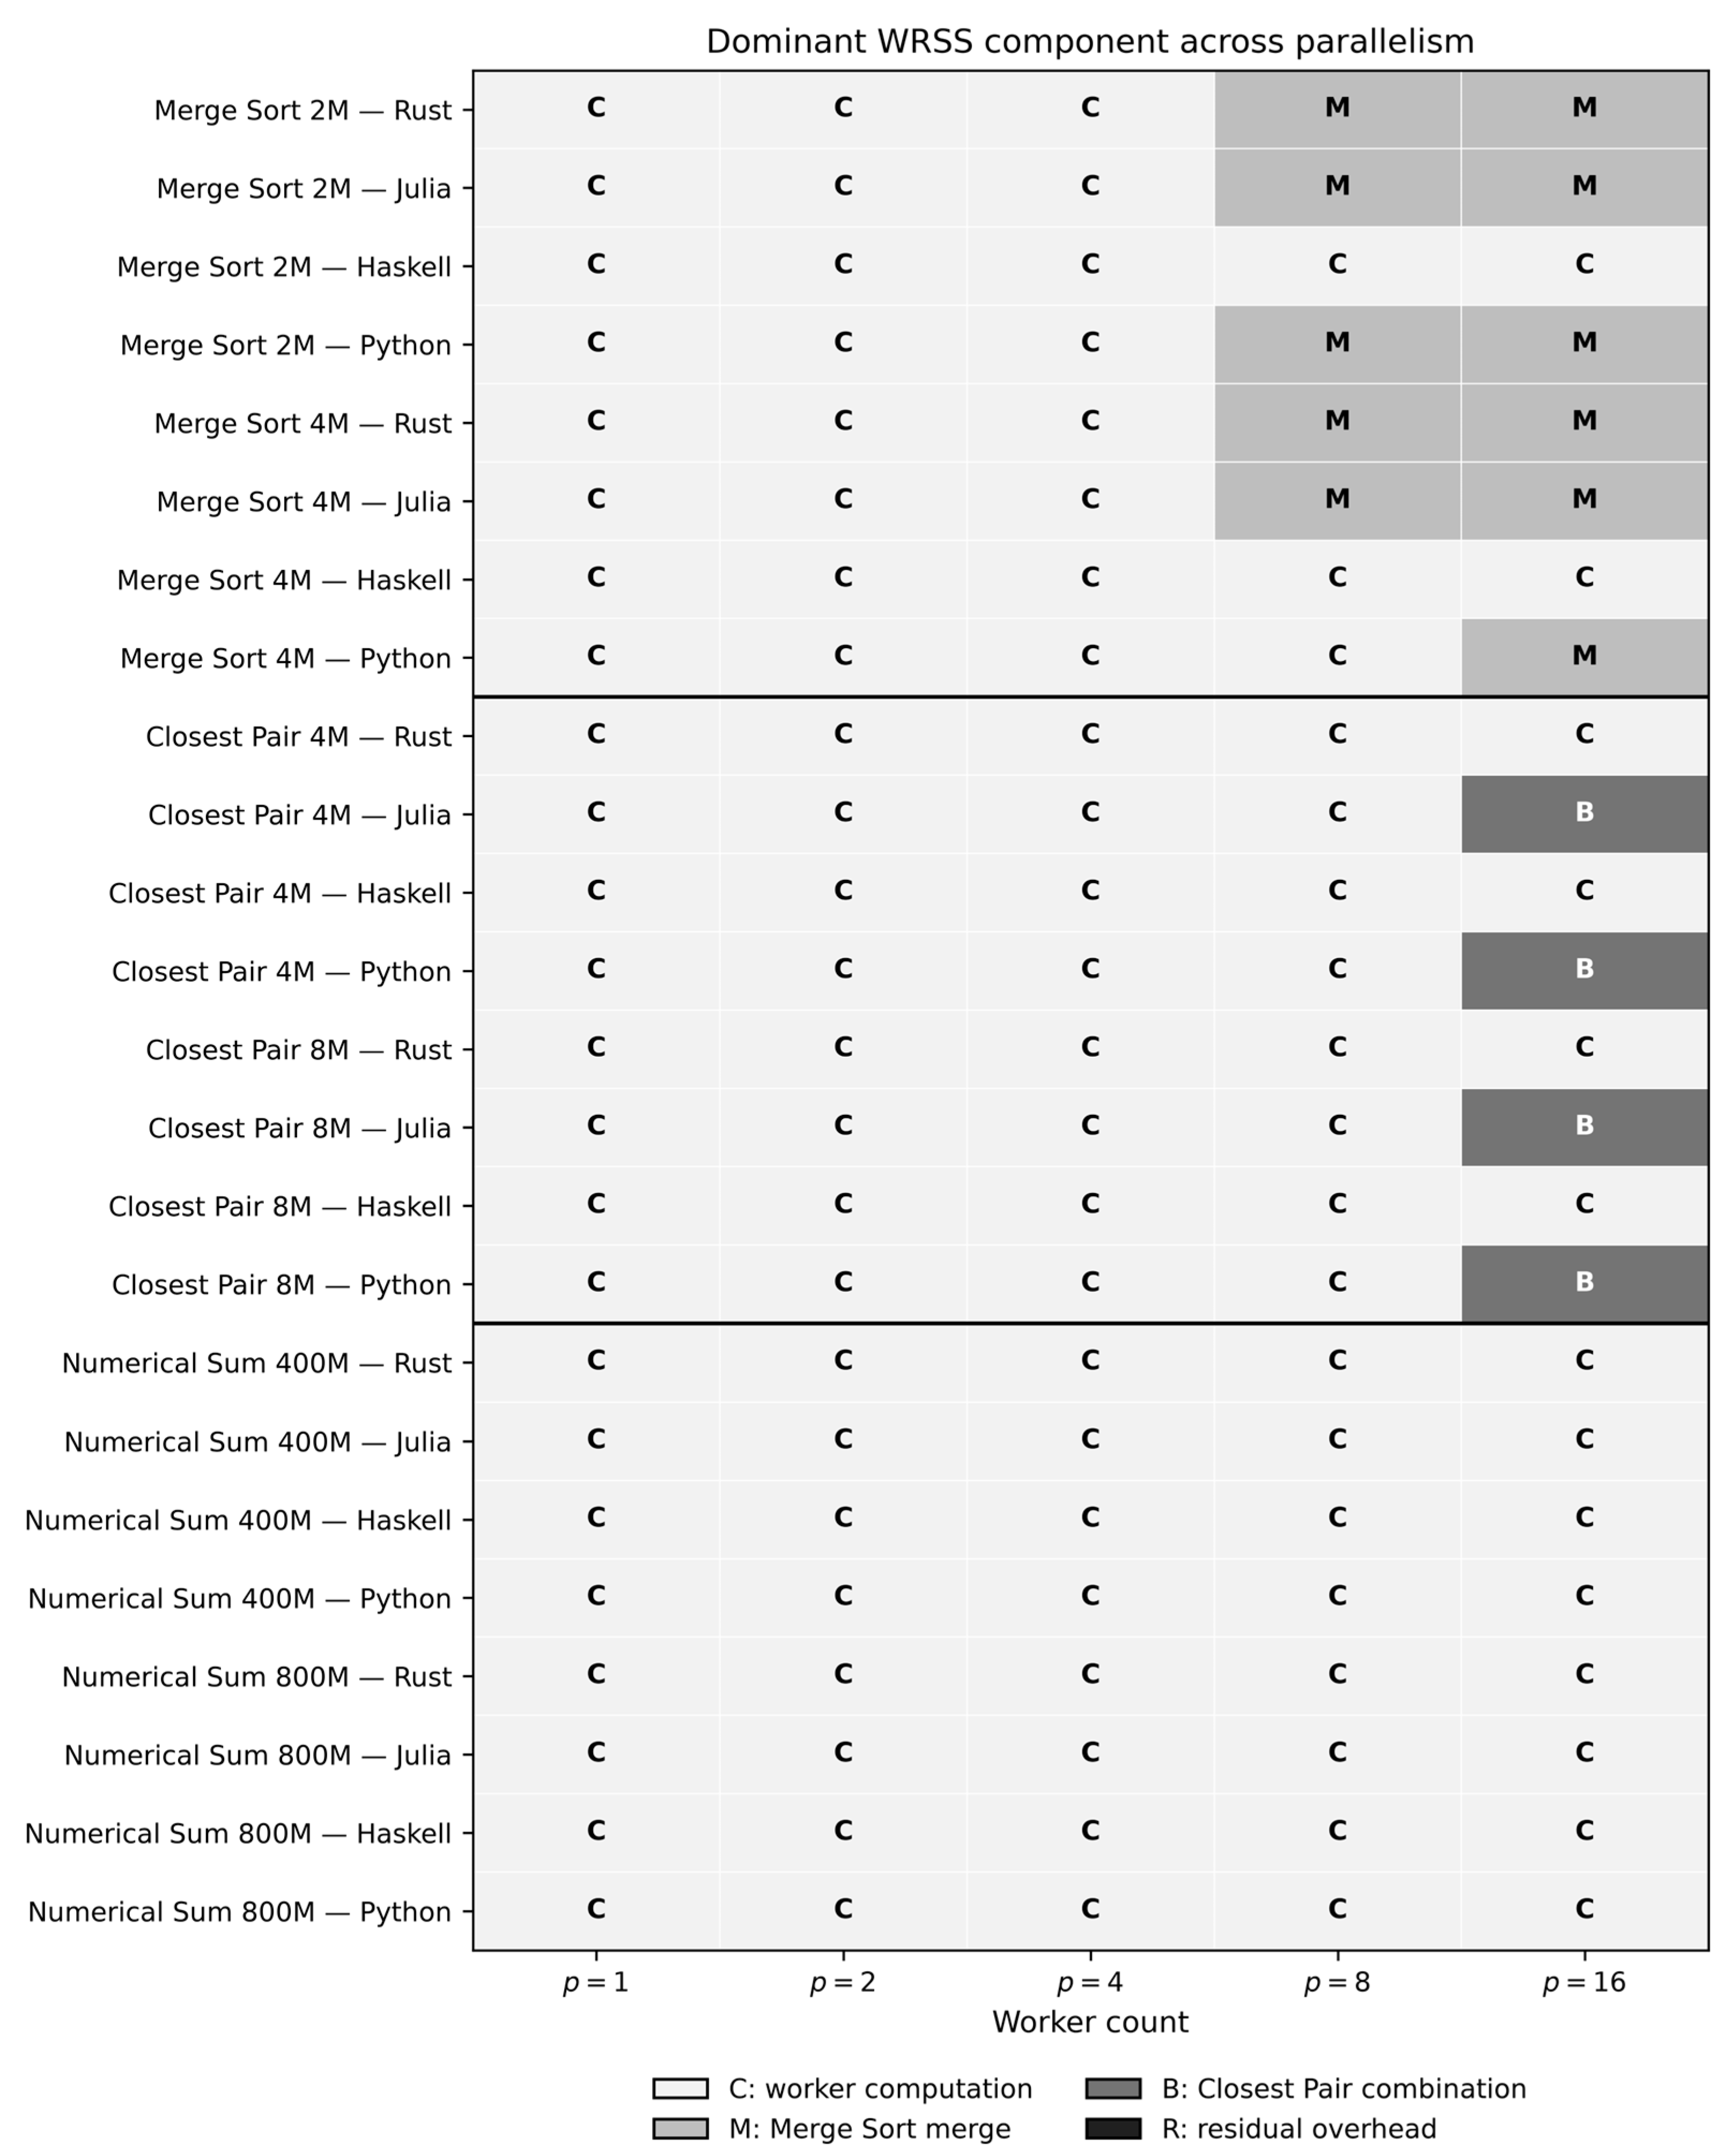
The above results support a narrower and more reproducible conclusion than a universal language ranking. The same runtime can occupy different WRSS regimes depending on the workload, input size, and worker count. All 24 conditions begin computation-dominated, but 10 conditions later change the dominant component. Most Merge Sort transitions occur by , reflecting the increasing importance of global merging as local sorting is divided among more workers. Closest Pair retains compute dominance longer, with only Julia and Python becoming combine dominated at . Numerical Sum never leaves the compute-dominant regime in the tested range.
This bottleneck-evolution view explains why the same worker count can produce different performance outcomes across workloads and implementations. For the Rust-based and Julia-based Merge Sort implementations, the residual fraction at is negligible, while the global merge stage is the dominant measured component. For the Python-based Closest Pair implementation, by contrast, both the combination stage and residual process/runtime overhead make substantial contributions to parallel-region time. At the 8M input and , they account for 49.32% and 25.42% of mean parallel-region time, respectively. WRSS therefore distinguishes configurations that may show similar departures from ideal speedup, but are limited by different measured components.
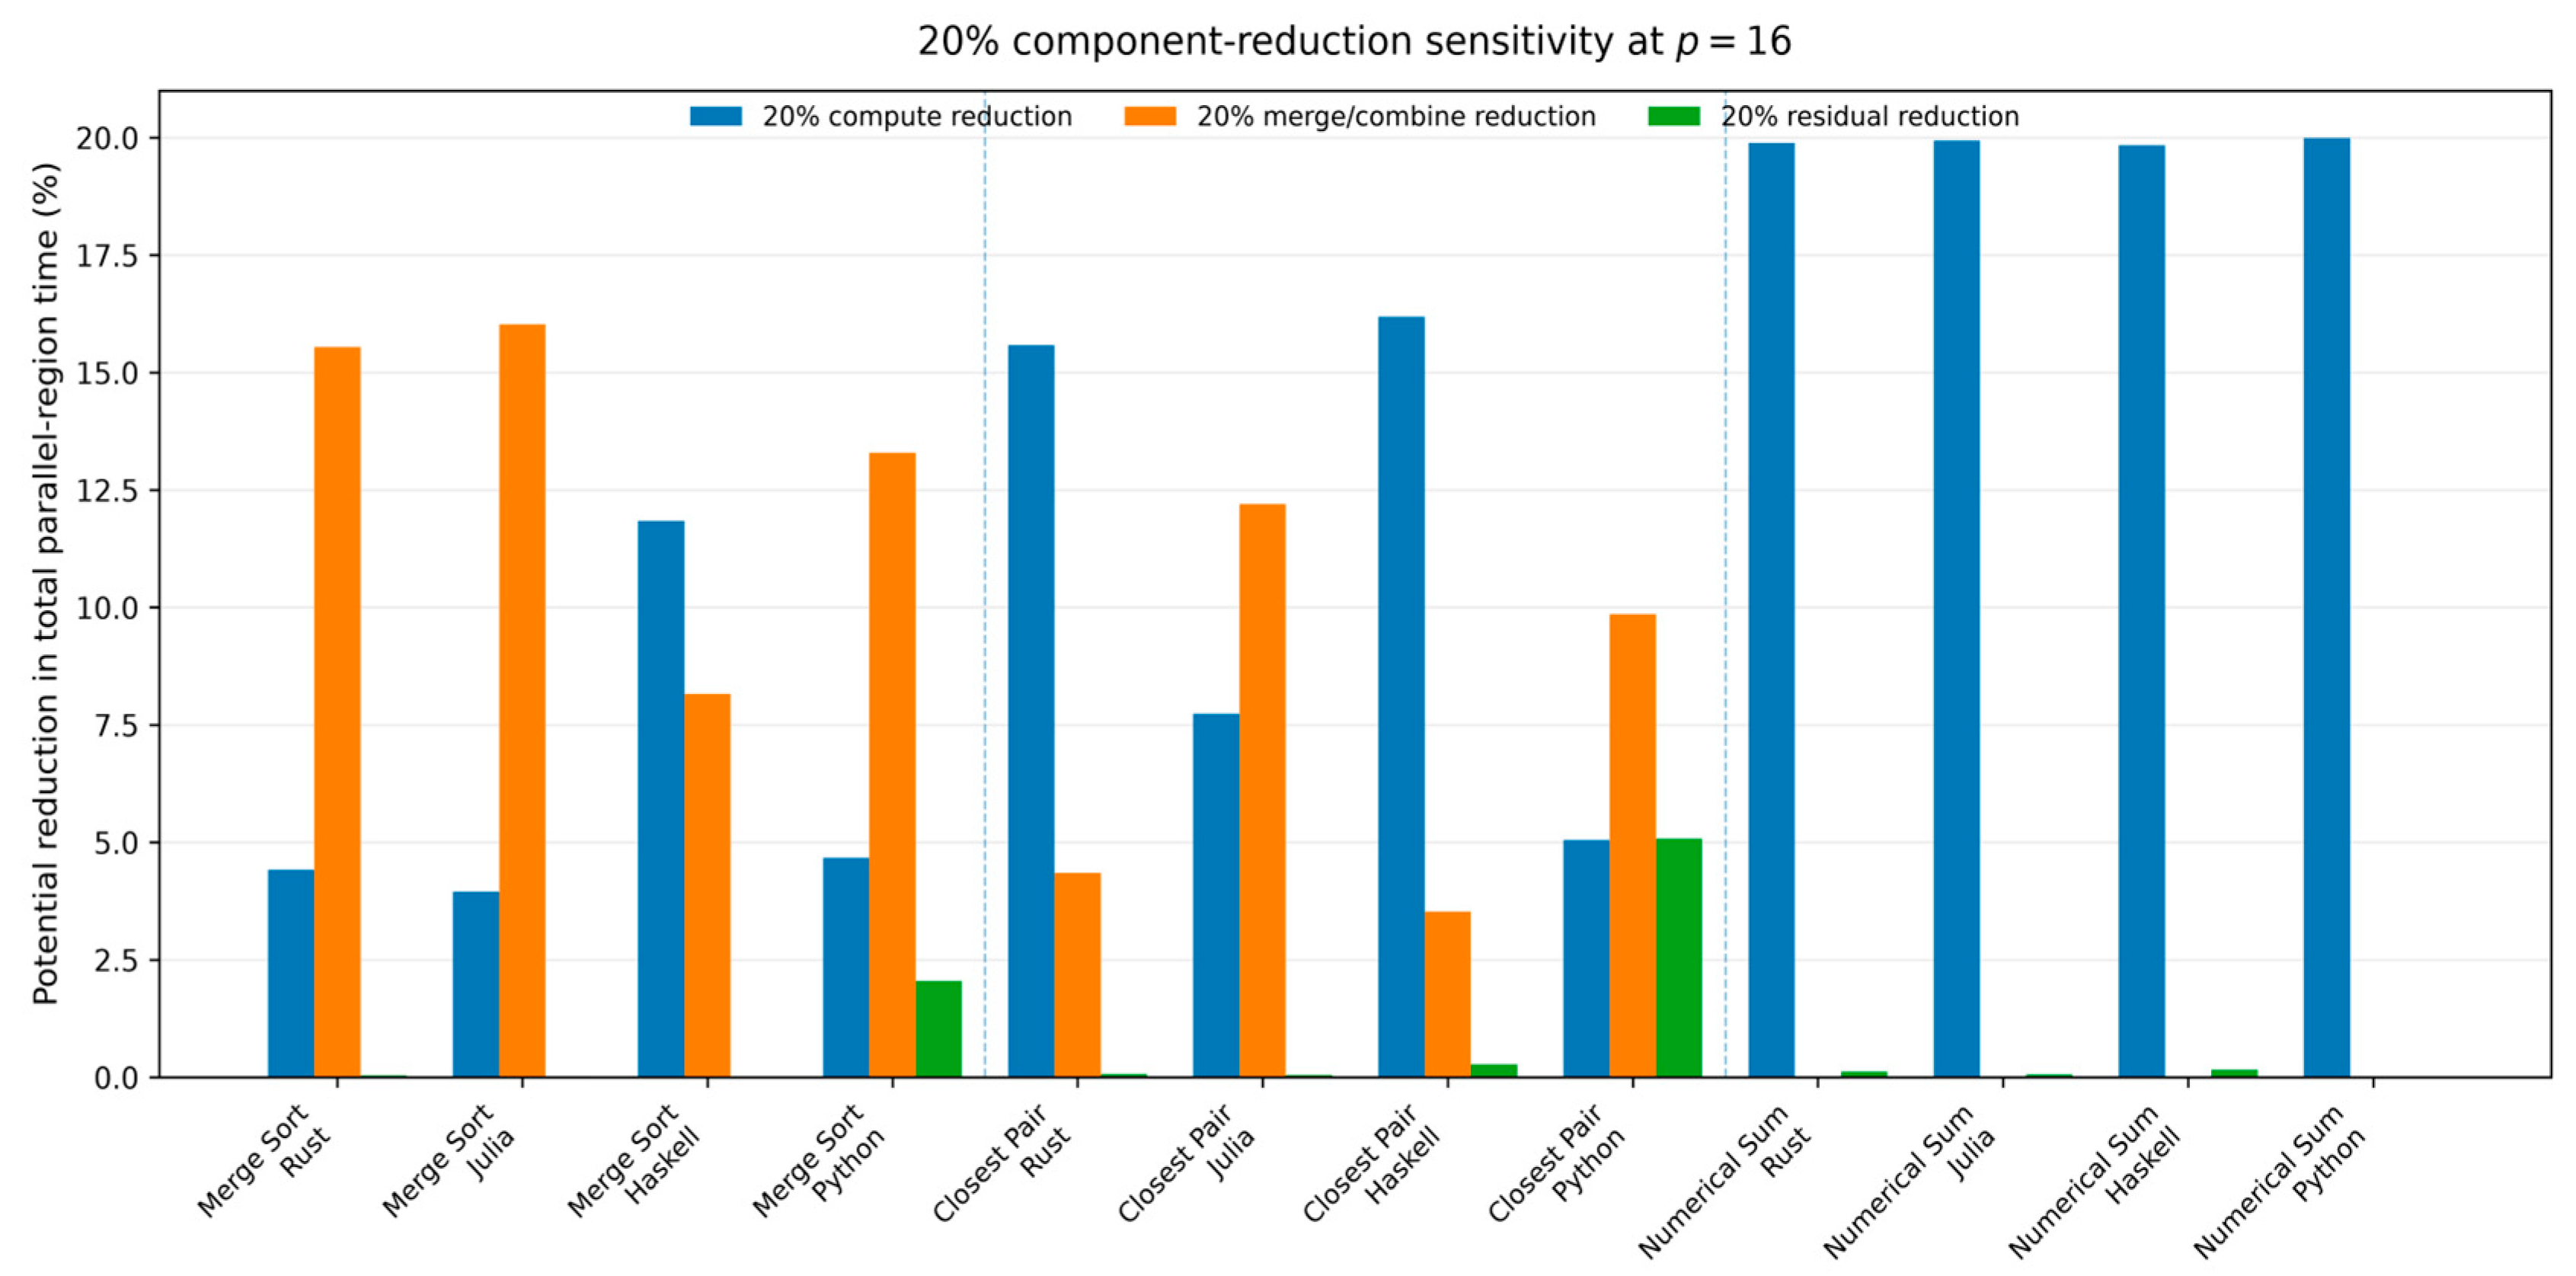
The component-reduction analysis adds a standardization to this diagnosis. It does not claim that a 20% optimization is achievable or independent in a real implementation. Instead, it answers a controlled sensitivity question: if one measured component were 20% smaller while the others remained unchanged, how much would total parallel time change? This is deliberately more limited than causal profiling such as Coz [
15], but it provides a directly comparable interpretation across the four runtime models because it is derived from the same measured decomposition.
6.3. Practical Interpretation
The proposed framework is intended for performance diagnosis after a representative parallel implementation or prototype is available, rather than for predicting performance before implementation. A practitioner can first execute the implementation across a small range of worker counts to observe how median speedup changes. The measured timing components can then be summarized using WRSS to determine how worker computation, algorithmic combination, and residual overhead evolve as parallelism increases. A BTP identifies whether the dominant measured component changes within the tested worker range, while the standardized component-reduction analysis quantifies how strongly total parallel-region time depends on each component. Together, these steps can guide decisions about worker count and identify which part of an existing implementation is the most relevant target for further optimization.
For example, for the Julia-based Merge Sort implementation with the 4M input at , a 20% reduction in merge time corresponds to a 16.03% potential reduction in total parallel-region time, whereas an equivalent reduction in residual overhead corresponds to only 0.02%. For the Python-based Closest Pair implementation with the 8M input, the corresponding potential reductions are 9.86% for the combination stage and 5.08% for residual overhead. These measurements indicate which components of the evaluated implementations warrant further investigation or optimization rather than relying only on absolute execution time or speedup.
The framework therefore provides implementation-level diagnostic guidance rather than prescribing a programming language before development begins. Within the implementations evaluated in this study, shared-memory mechanisms reduce the need to serialize large intermediate data structures, while process-based implementations benefit when data can be inherited or shared rather than repeatedly transferred. JIT-based implementations require appropriate control of first-use compilation when measured intervals are short, and algorithmic combine stages can become dominant regardless of runtime mechanism when worker computation decreases faster than the combine cost.
6.4. Limitations and Threats to Validity
Construct validity. WRSS is an instrumentation-based decomposition of the measured parallel region, not a complete physical model of communication or hardware resource contention. () intentionally remains a residual category and may combine synchronization, waiting, serialization, process transport, runtime bookkeeping, and other unisolated effects. The dominant WRSS component therefore identifies the largest measured category under the chosen timing boundaries, not necessarily a unique microarchitectural root cause.
BTP interpretation. BTP is defined only over the tested worker set . A transition between two tested values may occur at an unobserved intermediate core count, and no-transition conditions may transition beyond . BTP should therefore be interpreted as the first observed transition in this experiment rather than a universal threshold.
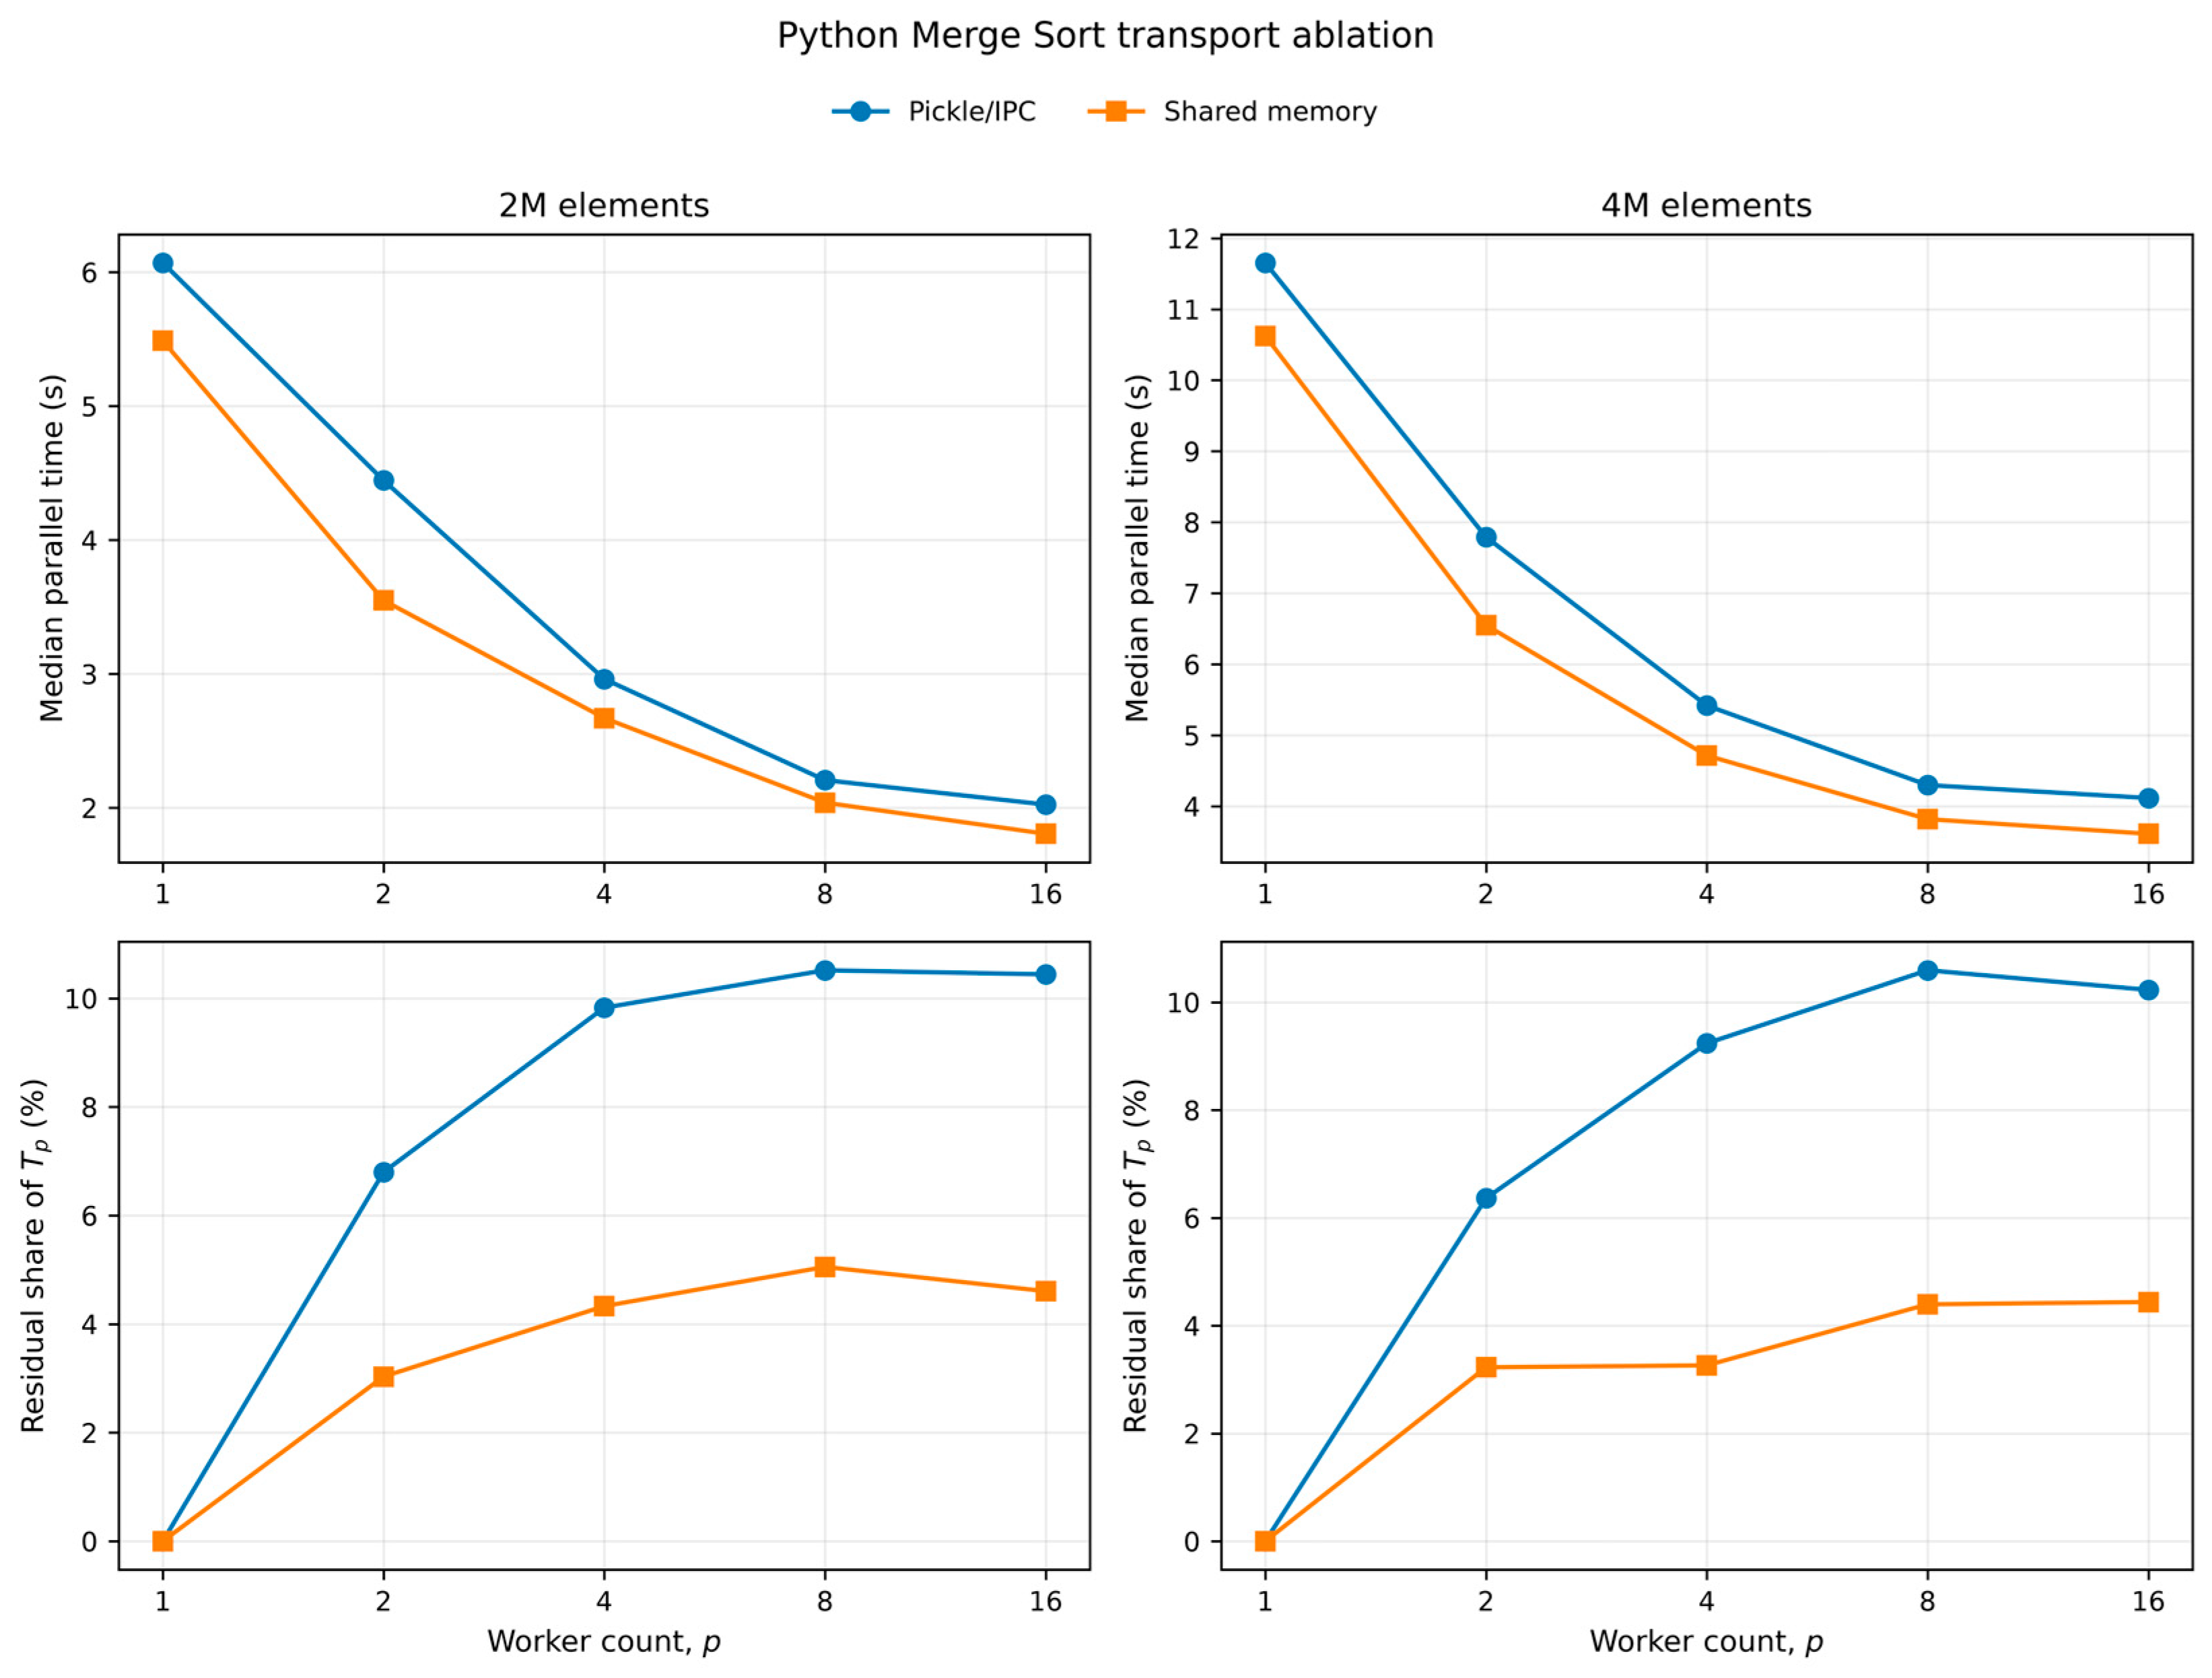
Component-sensitivity interpretation. The 20% component-reduction analysis is a standardized counterfactual sensitivity calculation, not a causal performance model. It assumes that one measured component can be reduced while the remaining components stay fixed. Real optimizations can alter several components simultaneously, change memory behavior, or introduce new costs. Because the same perturbation was applied to every component, the reported sensitivity is monotonic in component share; its purpose is to express total-runtime dependence in a common unit rather than to identify a bottleneck independently of WRSS. The Python shared-memory experiment is therefore used only as a mechanism-level check and not as numerical validation of the counterfactual calculation.
Internal validity. All measured runs used fixed physical-core affinity within one NUMA socket, randomized run order, a pre-run load admission gate, deterministic inputs, and 10 measured trials per configuration. Operating-system activity, cache state, memory-controller effects, and runtime nondeterminism could nevertheless contribute variation. The ancillary interference-monitor telemetry was recorded for transparency and was not used to exclude observations after timing.
Implementation equivalence. The same high-level algorithm, deterministic input, partitioning policy, and correctness criterion are used across languages, but exact data representations and runtime mechanisms necessarily differ. These differences are part of the phenomenon under study and are reported explicitly. For Python, process serialization is distinguished from shared-memory access through a targeted transport ablation.
External validity. This study uses one shared-memory x86-64 system. Scaling is evaluated over five worker counts and two sizes per workload, but results may differ on other processors, NUMA topologies, memory systems, operating systems, or distributed-memory platforms. The three workloads span distinct decomposition patterns but do not represent all classes of parallel software, such as graph analytics, irregular sparse kernels, or stencil computations.
Conclusion validity. Ten trials per experimental configuration provide substantially more distributional information than a single point estimate, but the sample remains finite. We therefore report variation, confidence intervals, and multiplicity-aware tests and avoid interpreting small runtime differences as universal language effects. Conclusions are limited to the tested implementations, versions, workload sizes, and hardware configuration.
Reproducibility. Final source trees, deterministic inputs, validation outputs, run schedules, raw trial logs, derived WRSS/BTP/component-sensitivity tables, analysis scripts, and SHA-256 manifests are retained. These artifacts allow the exact benchmark configuration and the analysis pipeline to be reconstructed without relying on undocumented environment state.




 ,
,