1. Introduction
The rapid growth of prediction markets in 2024–2025 represents one of the most significant innovations in decentralized finance. Platforms such as Polymarket and Kalshi have facilitated billions of dollars in trading volume on outcomes ranging from political elections to cryptocurrency prices. These markets have emerged as important mechanisms for information aggregation [
1,
2], with recent evidence suggesting improved accuracy in long-run forecasting [
3,
4]. Unlike traditional derivatives, these platforms offer binary options with discontinuous payoff structures: contracts pay
$1.00 if a condition is met at settlement and
$0.00 otherwise. This paper examines an important design question in financially-settled prediction markets: the potential for settlement rules to create incentives that affect trading in the spot markets used as settlement oracles. When the expected profit from securing a favorable settlement outcome exceeds the cost of temporarily distorting spot prices on constituent exchanges, rational actors may face settlement-related incentives that are reflected in observed price pressure patterns.
In this paper, a settlement oracle is the external price source or benchmark used to determine whether a prediction-market contract pays $1.00 or $0.00. An oracle-constituent exchange is a spot venue whose trades can enter the settlement benchmark or reference price in the institutional setting studied here; a non-constituent exchange is a comparison venue whose trades do not directly enter that benchmark, although it may still co-move with constituent venues through arbitrage and information transmission. In the baseline empirical design, Coinbase is treated as the benchmark-relevant venue and Binance as the non-constituent comparison venue; Kraken and Bitstamp are discussed only within the institutional setting of the Bitcoin benchmark family.
We focus on Bitcoin prediction markets for three reasons. First, Bitcoin contracts represent a substantial share of financial prediction market volume. Second, Bitcoin’s fragmented global liquidity across multiple exchanges creates natural variation in settlement index composition. Third, high-frequency data availability enables rigorous microstructure analysis of settlement-window pricing dynamics. Our empirical strategy exploits the fact that the CME CF Bitcoin Reference Rate—used by regulated prediction markets including Kalshi—is constructed from a subset of exchanges (Coinbase, Kraken, Bitstamp) while excluding the world’s largest spot venue (Binance). This creates an empirical comparison: if settlement rules are associated with settlement-related incentives, prices on constituent exchanges may decouple from non-constituent exchanges during settlement windows, particularly when Bitcoin trades near strike prices where payoff sensitivity is especially high. A key methodological innovation in our study is the use of actual contract-level data from Polymarket and Kalshi to identify economically relevant contract strikes. We select the strike nearest to the settlement window price with meaningful trading volume (exceeding $100,000). This approach helps ensure that we measure incentives at economically relevant strikes where any settlement-related effects are most likely to be visible in the data.
Using a difference-in-differences framework with 12 months of minute-level data, we document statistically significant and economically relevant price divergence. After controlling for Tether premium fluctuations—a critical confound given Binance’s USDT denomination—we find that a one standard deviation increase in strike proximity is associated with a 6.7 basis point cross-exchange price deviation between constituent and control exchanges during settlement windows (). At high incentive levels, the estimated magnitudes reach roughly 14–20 basis points. Monthly directional patterns are suggestive of the proposed incentive framework. When Bitcoin settles near strikes, the sign of the expiry-minus-placebo basis often aligns with the payoff-relevant direction. However, formal above-versus-below-strike regression tests are weaker, so the directional evidence should be interpreted as supportive but not definitive.
Our robustness analysis suggests that strike identification is important for detecting settlement-window price divergence associated with incentives.
Our findings contribute to three literatures. First, we extend research on limits to arbitrage [
5] by identifying settlement windows as periods when arbitrage may break down due to asymmetric information about the source of observed price pressure. Second, we build on the benchmark manipulation literature [
6] by documenting analogous pricing patterns in decentralized markets. Third, we add to the growing body of work on oracle risks in blockchain-based financial systems.
The remainder of this paper proceeds as follows.
Section 2 reviews related literature.
Section 3 develops theoretical predictions.
Section 4 describes data and methodology.
Section 5 presents results.
Section 6 discusses implications and possible design considerations.
Section 7 concludes.
4. Data and Methodology
4.1. Data Sources and Settlement Rules
We construct a high-frequency dataset covering February 2025 through January 2026. The dataset includes:
Spot prices: 1-min OHLCV data for BTC/USD (Coinbase) and BTC/USDT (Binance)
Tether rates: 1-min USDT/USD exchange rate from Coinbase Pro
Settlement dates: Monthly expiry schedule for Bitcoin prediction markets
Strike prices: Identified from actual Polymarket and Kalshi contract data (see
Section 4.3)
All timestamps are synchronized to UTC. The settlement window for CME CF Bitcoin Reference Rate is 15:00–16:00 London time, corresponding to the hourly calculation period specified in the CME methodology.
Table 1 summarizes the reduced-form research design and its principal identifying assumptions.
4.2. Event Windows and Placebo Construction
Our sample focuses on windows surrounding each monthly settlement event from 60 min before settlement begins through 90 min after settlement starts. The interval spans 150 elapsed minutes but, because both endpoints are included, contains 151 one-minute timestamps per event window. We also collect identical windows on the 15th of each month as placebo controls where available in the paper-facing regression panel. This yields a final regression sample of 3624 min-level observations across 12 expiry event windows and 12 placebo event windows (
). For event-time visualizations below, we center the analysis at settlement initiation.
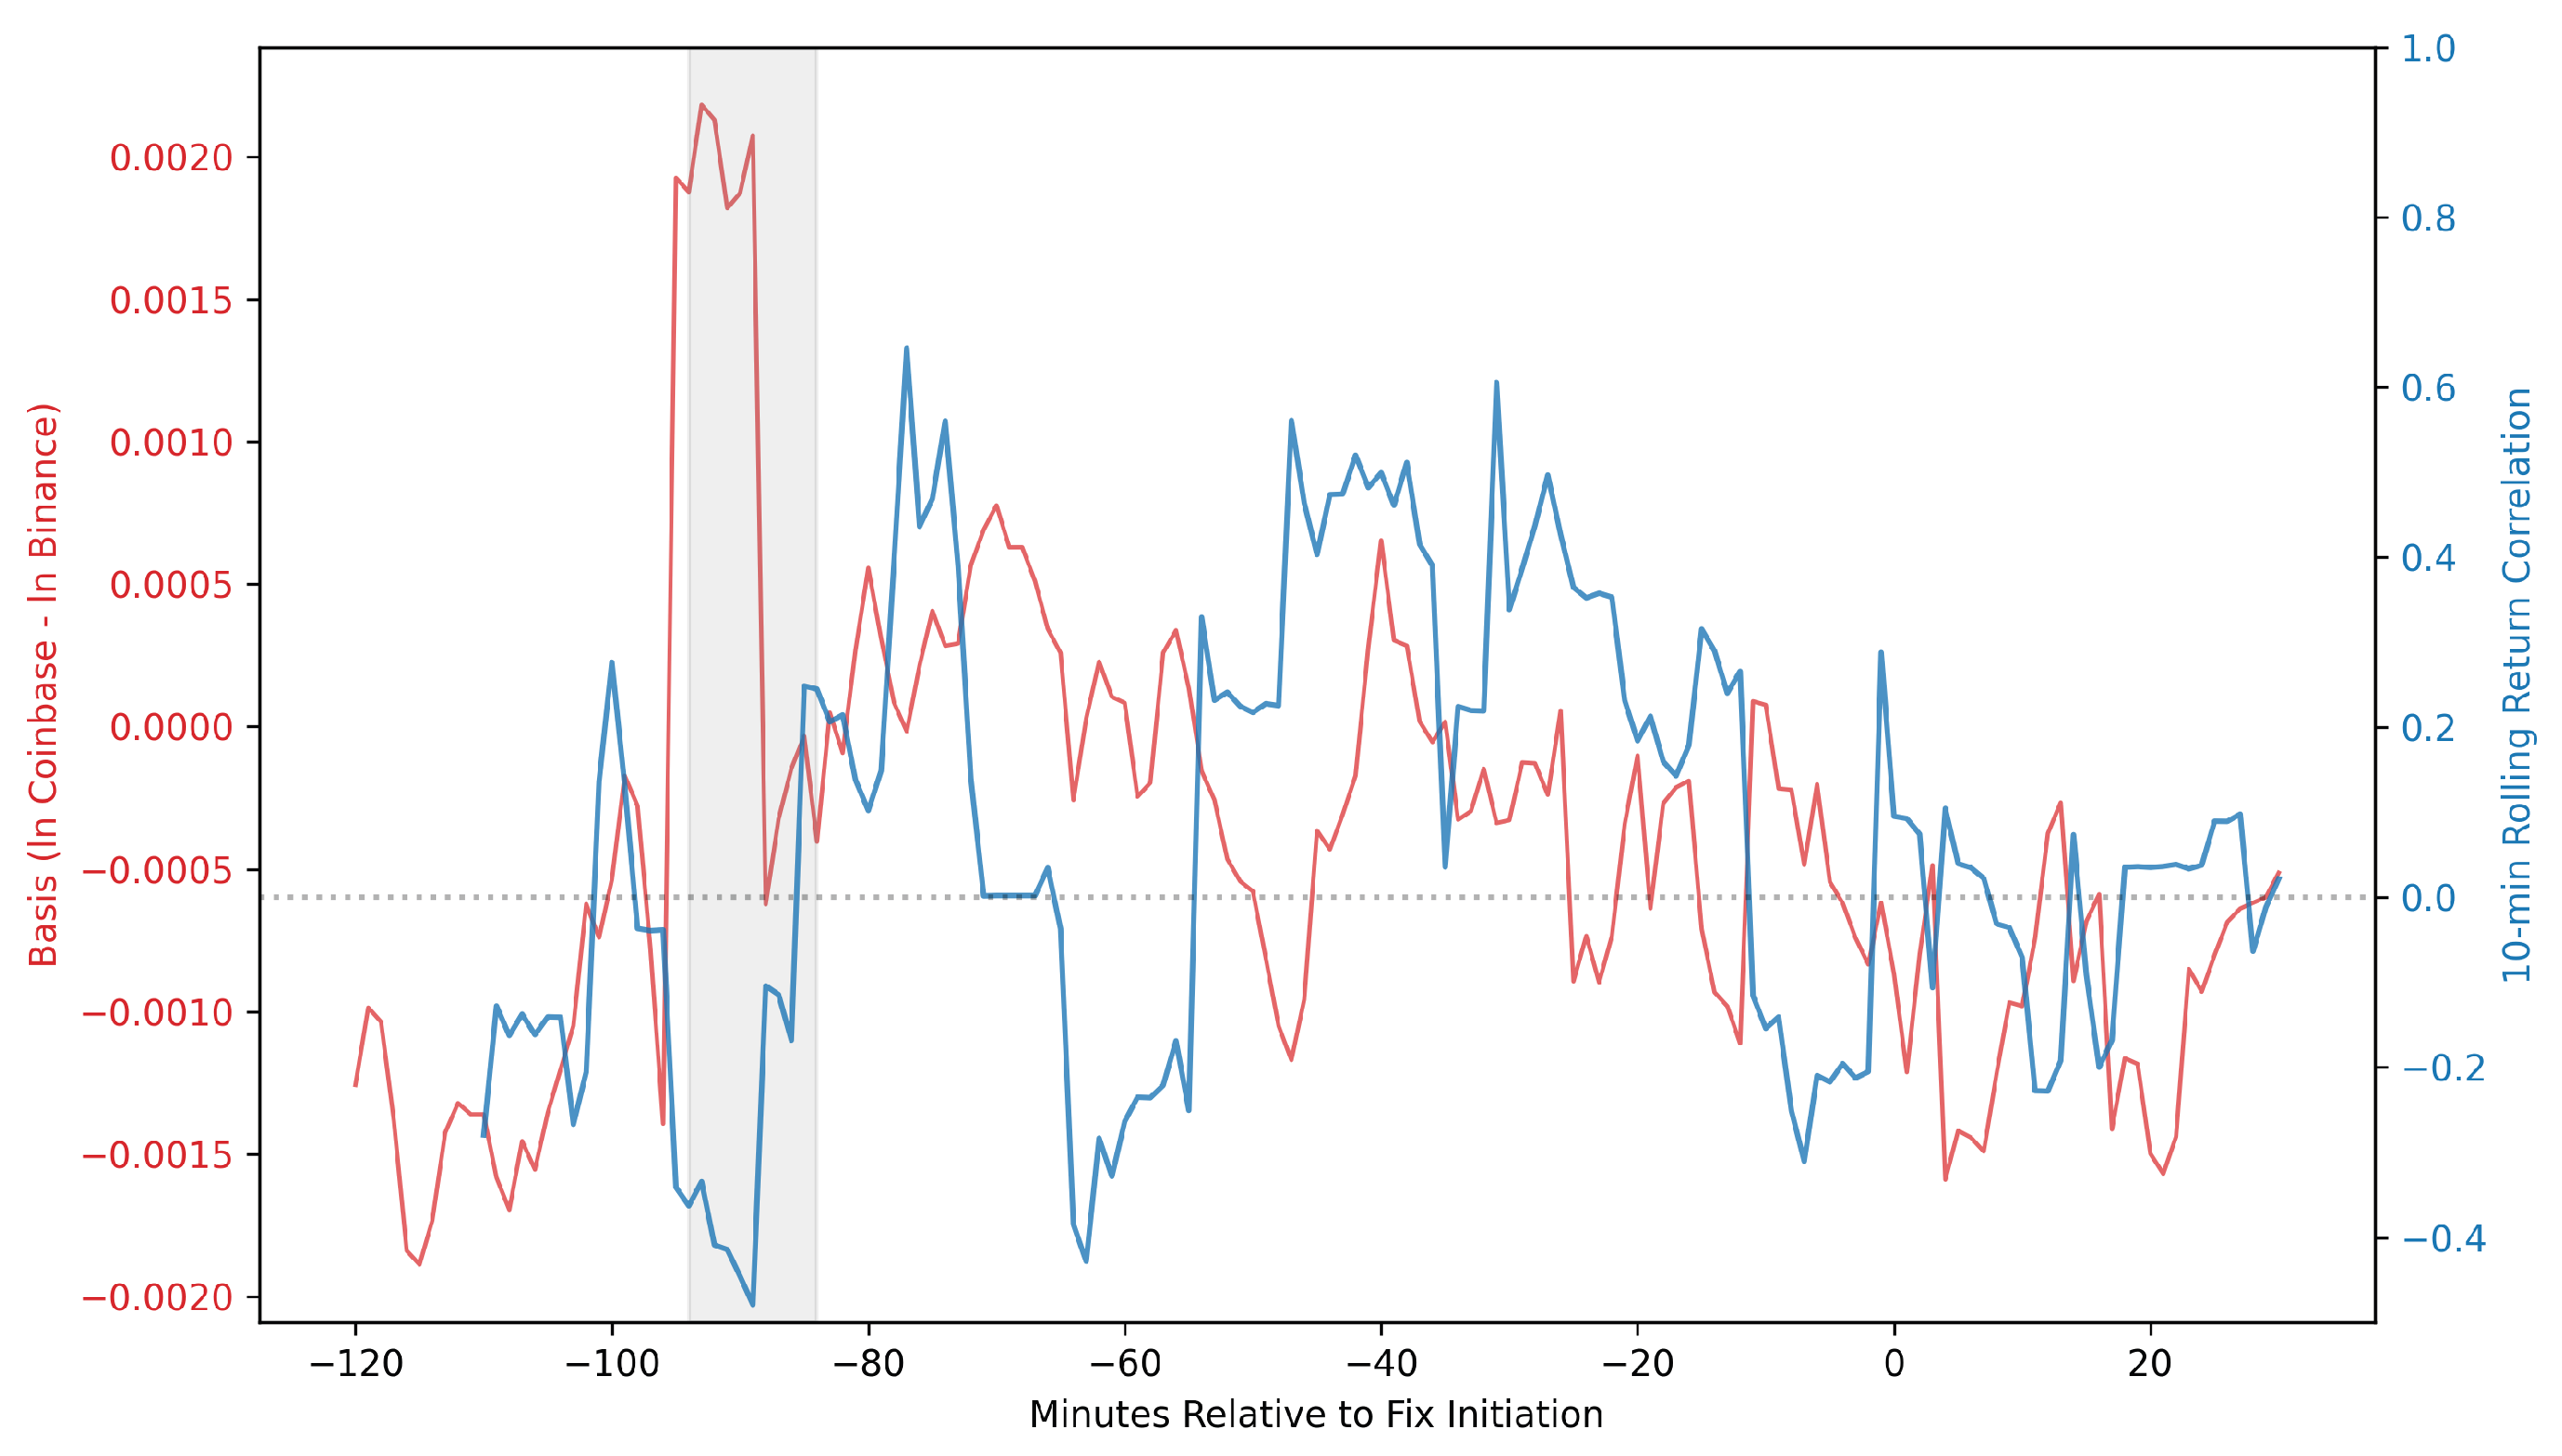
Figure 1 reports a broader descriptive window, while
Figure 2 uses a symmetric window of
for visualization clarity. The regression specification uses the full 150-min span, or 151 included one-minute timestamps, for estimation.
4.3. Strike Identification
We do not identify the relevant strike using the highest-volume Bitcoin contract on a given expiry date. That rule is economically incorrect because total monthly volume can be concentrated in contracts that are far from the settlement price or tied to longer-horizon speculation rather than the discrete payoff threshold that becomes most settlement-relevant during the window. An incentive-based measure should instead target the strike that is locally payoff-relevant at the moment settlement is determined.
Our revised procedure anchors strike selection to the settlement window itself. For each monthly expiry, we first compute the average Coinbase Bitcoin price during the 15:00–16:00 London settlement window. We then collect all Polymarket Bitcoin binary contracts expiring on that exact date, restrict attention to contracts with meaningful trading activity (volume greater than
$100,000), and select the strike with the smallest absolute distance to the settlement-window average price. We retain only strikes that lie within 5 percent of the settlement price, which ensures that the contract remained economically live during settlement.
Table 2 illustrates the construction for one representative minute, and
Table 3 reports the identified strikes along with corresponding settlement prices and contract volumes.
This procedure improves economic relevance but also creates an ex-post concern: the settlement-window price is observed after the event has occurred. The concern is not that the strike itself is invented ex post—the contracts and strikes existed before settlement—but that selecting the nearest economically live contract using the realized settlement-window average may mechanically favor strikes that look relevant after the fact. We therefore treat the strike-selection robustness checks below as an important part of the design rather than as cosmetic sensitivity analysis.
This refinement improves identification. The selected Polymarket strike is, on average, $904.84 from the settlement-window average price (median $585.56), with 75.0% of months within $1000 and 100.0% of months within 5.0% of the settlement price. Kalshi provides a secondary comparison benchmark. The corresponding Kalshi strike is even closer on average: $351.92 mean absolute distance (median $239.44), with 83.3% of months within $500 and 91.7% within 1.0% of the settlement price. Kalshi is closer than Polymarket in 75.0% of expiry months. These statistics indicate that the revised selection rule isolates strikes that were plausibly relevant for settlement incentives rather than contracts that merely accumulated the most total volume over the month.
We use the Polymarket-based strike as the primary strike measure because the empirical question concerns incentives generated by prediction-market settlement. Kalshi is used as an external comparison device rather than a substitute measure. In the panel analysis, we construct the incentive variable as the inverse distance between the spot price and the selected strike, standardized over the full sample. The robustness checks below show that the main result is stable across alternative strike-selection and specification choices.
4.4. Basis and Tether Adjustment
A critical methodological challenge arises from comparing USD-denominated prices (Coinbase) to USDT-denominated prices (Binance). When Tether trades away from $1.00 parity, this creates mechanical basis that is unrelated to settlement-related incentives.
We address this by adjusting Binance prices for real-time Tether premium:
where
is the contemporaneous Tether exchange rate for month
m and event-time minute
. This ensures our basis calculation compares like-for-like USD values.
Basis (Dependent Variable):
Under market efficiency, (after accounting for stable fee premia). Significant deviations indicate localized inefficiency. The dependent variable is already a Coinbase-minus-Binance basis, so the baseline specification is not an exchange-by-time panel with separate exchange fixed effects.
4.5. Incentive Metric
To capture non-linear pressure near strikes, we construct:
where
is the selected contract strike for month
m and
prevents division by zero. This metric spikes when price is close to the strike. We standardize
to have mean 0 and standard deviation 1 for interpretability.
4.6. Empirical Specifications
We employ a difference-in-differences estimator with month fixed effects as a reduced-form test of whether settlement-window divergence is stronger when settlement-related incentives are greater:
This specification captures pricing patterns consistent with the proposed incentive framework, but it does not directly observe trader intent, position concentration, or the specific mechanism generating order flow.
Where:
are month fixed effects
captures the average difference associated with being in an expiry window
captures the relationship between incentive and basis in non-expiry periods
is our coefficient of interest: the incremental association between incentive pressure and basis during expiry windows
denotes auxiliary controls examined in robustness analyses; in those specifications, volume refers to aligned minute-level traded volume on Coinbase () and Binance (), while volatility is studied separately through subsample splits rather than included in the baseline table
4.7. Inference
Standard errors are estimated using the Newey-West HAC estimator with 15 lags to account for serial correlation and heteroskedasticity in high-frequency financial data [
24].
The key identifying assumption is parallel trends: in the absence of expiry treatment, the basis would have evolved similarly on expiry days and placebo days. In this setting, that assumption supports a reduced-form comparison of whether observed pricing patterns are stronger when predicted settlement-related incentives are greater. We formally test this in
Section 5.2.
4.8. Robustness and Falsification Design
The monthly-actual specification is the paper’s reference design. The baseline choices of a 5% strike band, a
$100,000 contract-volume threshold, a 150-min event span with inclusive one-minute endpoints, and HAC(15) standard errors are used as middle-ground implementation values for tractability and interpretability;
Section 5.8 shows that the main interaction result remains stable across nearby alternatives, so these choices should be read as baseline conventions rather than as uniquely optimal parameters.
Placebo date (15th of the month). The 15th provides a mid-month benchmark that preserves the same calendar month and intraday clock structure as the expiry analysis while remaining far from month-end settlement. This makes it a natural falsification date without the same settlement incentives.
Event window (150 min). The baseline window covers 60 min before settlement begins and 90 min after settlement starts, which is intended to capture pre-settlement, settlement, and immediate post-settlement dynamics without extending so far that unrelated intraday noise dominates. This is also a standard event-study compromise between coverage and precision.
Strike band (5%). Restricting the sample to strikes within 5% of the settlement-window average price keeps the analysis focused on economically live contracts while excluding far out-of-the-money contracts with limited settlement relevance. The 5% cutoff also preserves a usable number of monthly observations.
Volume threshold ($100,000). Requiring at least $100,000 in contract volume filters out thinly traded markets that are less likely to generate economically meaningful settlement incentives. This threshold also reduces noise from idiosyncratic illiquid contracts.
Smoothing parameter (). The incentive metric uses to prevent the inverse-distance measure from becoming unstable when the spot price is extremely close to the strike. The sensitivity analysis over alternative values indicates that the sign and significance of the main interaction are not driven by this smoothing choice.
HAC lag choice (15). Newey-West HAC(15) standard errors are used to accommodate serial correlation and heteroskedasticity in minute-level basis data. Alternative lag choices are reported in the specification grid and do not change the sign of the main coefficient.
Controls and heterogeneity definitions. When volume controls are added, they correspond to aligned minute-level traded volume on Coinbase () and Binance () from the same timestamped panel. Volatility is not part of the baseline regression table; instead, the heterogeneity exercise uses a trailing 30-day realized-volatility measure, computed as the non-annualized standard deviation of daily log returns over the prior 30 days. High-volatility observations are those above the sample median of that measure, and low-volatility observations are those at or below it.
The confirmatory emphasis of the paper is on the reference monthly-actual specification and its close variants. By contrast, the volatility partition and the broader specification grid are exploratory robustness exercises used to assess how sensitive the reduced-form pattern is to reasonable implementation choices.
Software and reproducibility. The analysis is implemented in Python 3.11.11 using pandas, numpy, statsmodels, pyarrow, requests, and matplotlib. The project code constructs schedules, collects public exchange data, aligns event windows, builds incentive variables, estimates the regressions, and exports paper figures and tables. The processed analysis panels, validation files, generated figures, and generated LATEX tables are retained in the project directory so that the paper-facing regressions can be reproduced from processed data. Full raw-data replication is more limited because exchange APIs, historical endpoint availability, and external derivatives/order-book data access can change over time.
5. Empirical Results
5.1. Main Regression Results
Table 4 presents our primary findings. Model 1 shows a baseline specification without the interaction term. Model 2 introduces the key interaction between expiry status and incentive pressure, along with month fixed effects. The coefficient of interest,
(
,
), is highly statistically significant. This is consistent with a 6.74 basis point decline in the constituent-exchange basis relative to the control exchange during expiry windows when incentive pressure (price moving closer to strike) rises by one standard deviation. This pattern is suggestive of settlement-related effects, but it should be interpreted as reduced-form evidence rather than as direct evidence of trader intent or a uniquely identified mechanism. The sign of the interaction coefficient reflects the dominant marginal response at high incentive levels, rather than the unconditional average across all observations. Because the regression conditions on incentive intensity and includes month fixed effects,
should be interpreted as a within-month marginal effect rather than as a visual summary of the raw average paths shown in
Figure 1 and
Figure 2.
Economic Magnitude Interpretation: To contextualize the coefficient, our sample mean incentive during high-pressure periods (price within
$100 of strike) is 2.1 standard deviations above the mean. This corresponds to a predicted basis of:
This is the same order of magnitude as the observed aggregate decoupling across high-incentive expiry windows and is consistent with the linear specification capturing the broad settlement-window divergence pattern. At extreme incentive levels (3+ standard deviations), the predicted effect reaches about 20 basis points, consistent with the maximum observed deviations of 24–38 basis points across the monthly events reported later. For a Bitcoin price near $100,000, a 6.7 basis point basis movement corresponds to roughly $67 per BTC, while 14–20 basis points corresponds to roughly $140–$200 per BTC during a short settlement-relevant window. These magnitudes are informative about the size of the observed association, but they do not by themselves identify the underlying mechanism.
Hypothesis status: The main interaction result supports H1 in the limited reduced-form sense that settlement-window basis divergence is stronger when the price is closer to economically relevant strikes.
Because the panel is minute-level but the design is organized around monthly settlement events, the effective independent variation is much closer to 12 settlement events than to 3624 independent observations. The baseline HAC specification addresses serial correlation within the minute panel, but it should not be read as creating thousands of independent settlement experiments.
Table 5 therefore reports more conservative inference checks that cluster or aggregate closer to the event level. These checks directly address the event-level inference concern: event-date clustering preserves the minute-level estimand, event aggregation gives each event equal weight, and exact paired-month permutation relabels treatment within matched treatment-placebo months. The coefficient remains negative across these checks, while the associated
p-values weaken relative to the baseline HAC presentation.
The equal-weight event-level estimate is larger in magnitude than the minute-level estimate because the two procedures weight the underlying variation differently. Event aggregation gives each event window the same weight, whereas the minute-level regression is influenced by within-event minute variation and by the number of usable observations. The magnitude difference therefore indicates meaningful cross-event heterogeneity and possible influence from a subset of settlement events. It should not be interpreted as an independent replication or as mechanically stronger evidence; the common negative sign across inference procedures is the more stable feature.
Note on R-squared: The model without month fixed effects explains a small share of minute-level variation, while month fixed effects raise the reported by absorbing persistent month-level differences. This is typical for high-frequency return differentials (basis changes), where noise and event-specific conditions dominate short-term fluctuations. Our focus is on the economic magnitude and statistical significance of the settlement-window divergence effect, not the overall explanatory power of the model.
5.2. Event-Window Comparability Diagnostics
The validity of our reduced-form comparison depends on local event-window comparability: absent settlement-specific pressure, expiry and placebo windows in the same monthly setting should display similar basis behavior around the same clock-time structure. We assess this using descriptive event-time plots and pre-window tests.
5.2.1. Visual Diagnostic
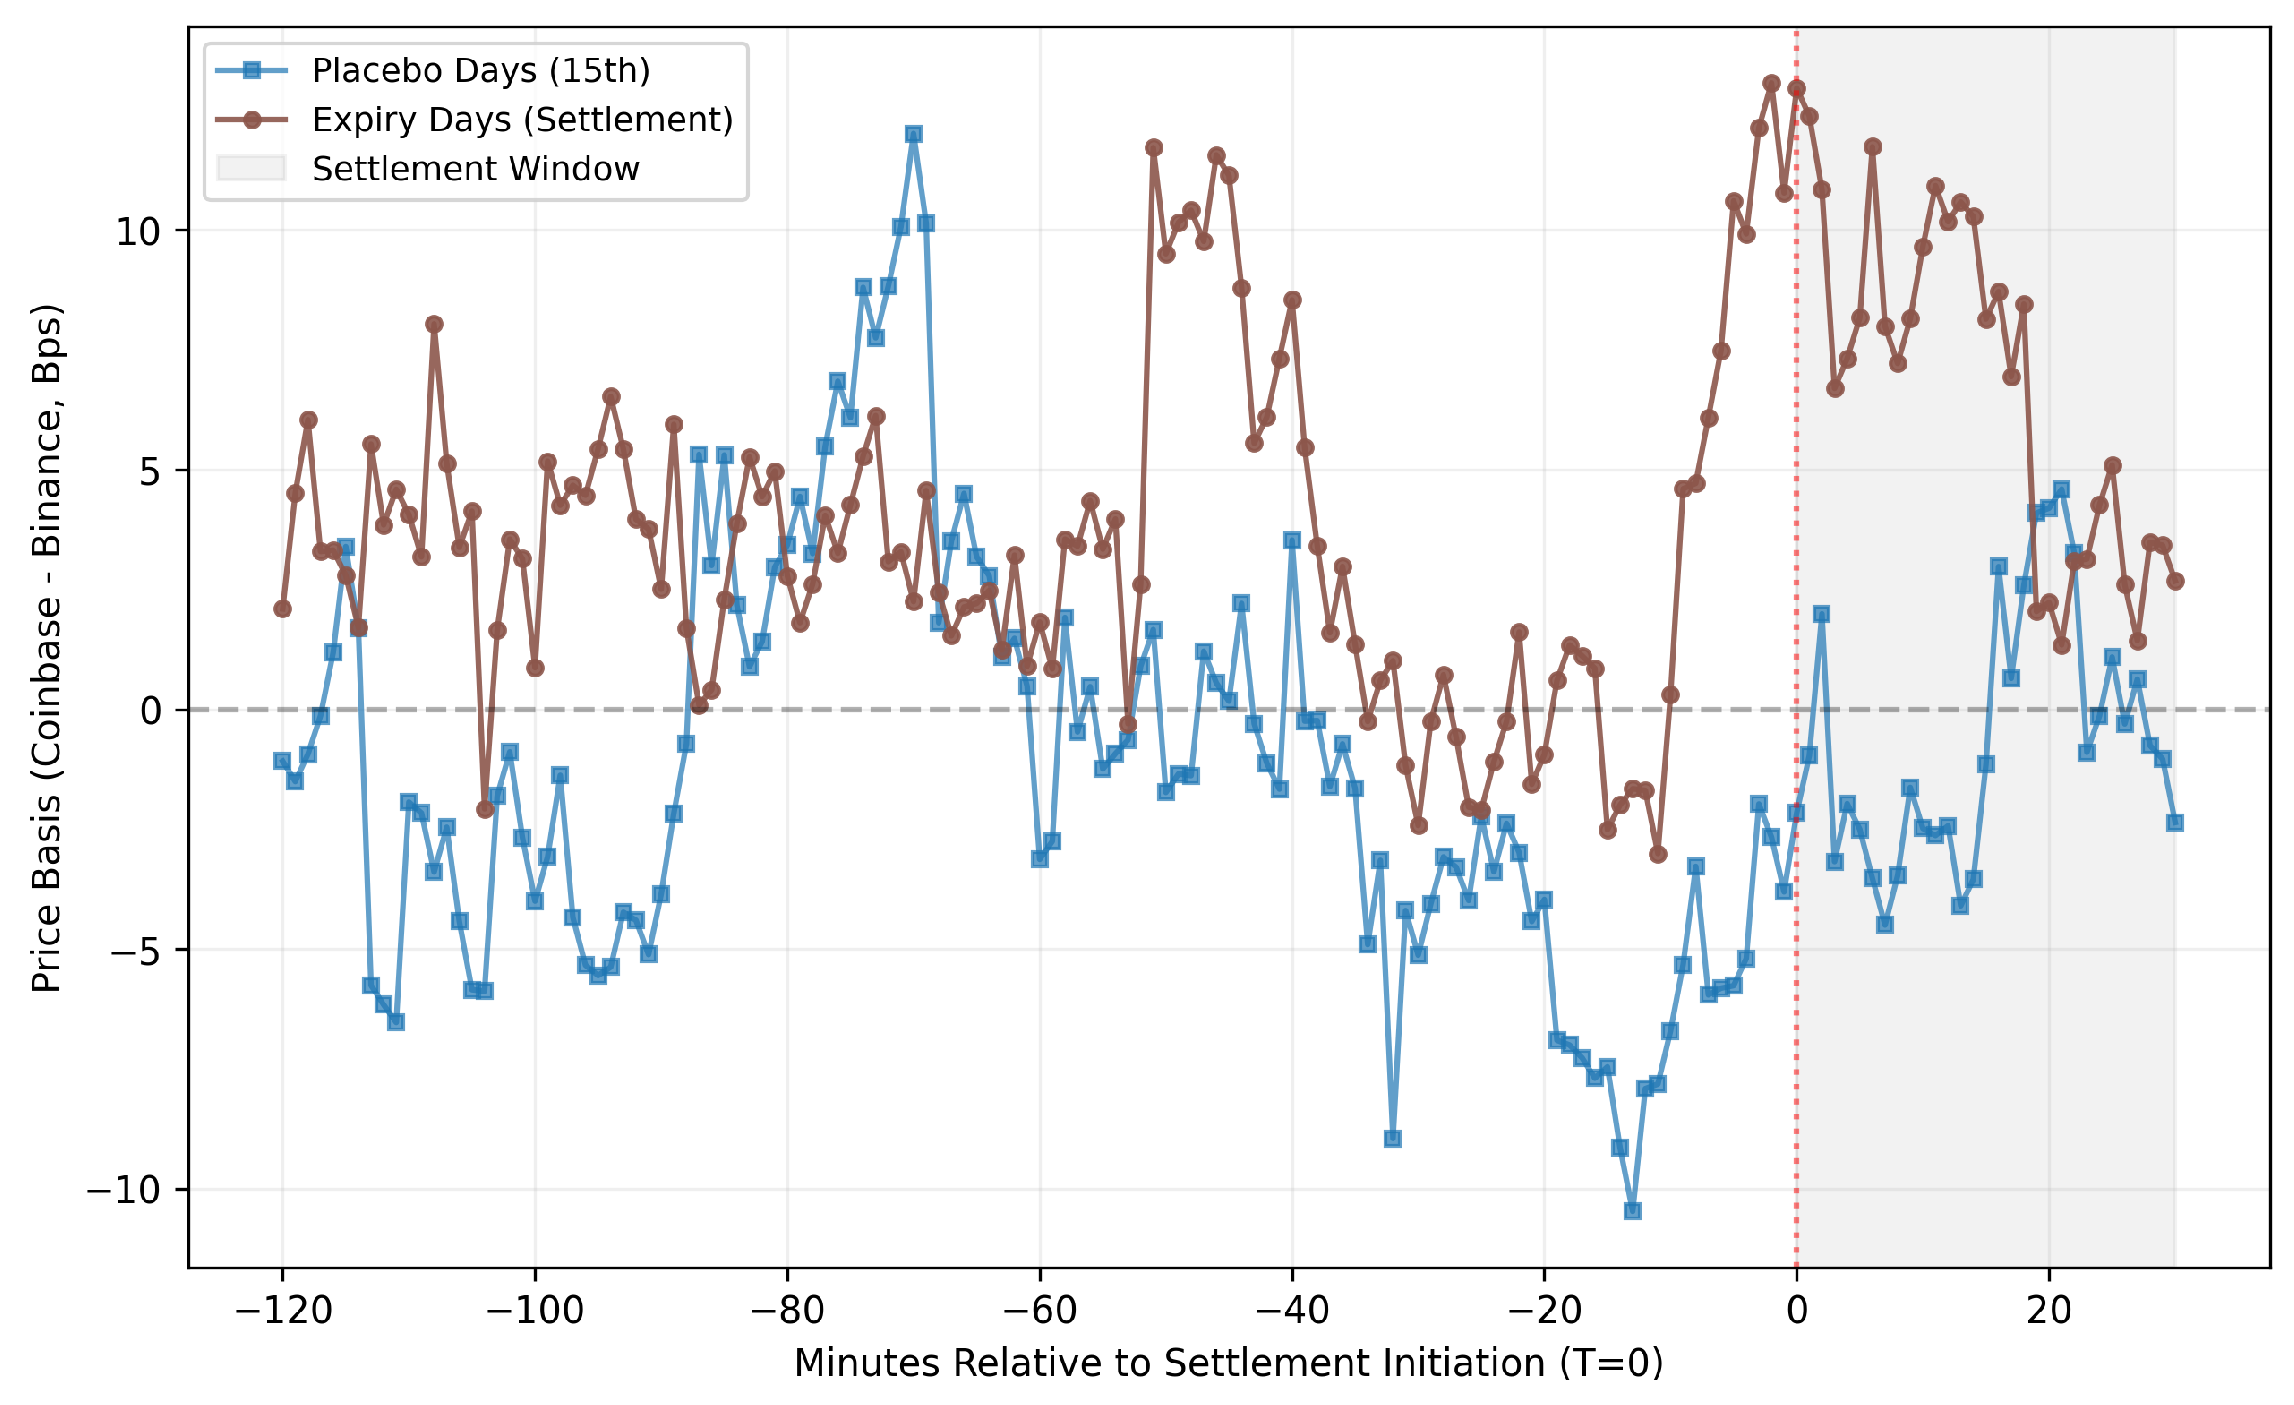
Figure 1 plots average basis for expiry days versus placebo days across a broader event-time window centered around settlement. In the rebuilt 24-event panel, the raw average expiry-placebo difference over the pre-window
is 7.93 basis points, and the exact paired-month sign-flip test for that mean pre-window difference yields
. During the post-settlement display window, the average treatment-placebo difference is 2.58 basis points, with the largest raw gap equal to 9.38 basis points at
. These patterns are consistent with local settlement-window divergence, but they should be interpreted as event-window diagnostics rather than as a conventional long-panel parallel-trends validation.
The positive average divergence in
Figure 1 is not contradictory to the negative interaction coefficient in
Table 4. The figure reports an unconditional average across months, while the regression coefficient
is a conditional within-month marginal effect that accounts for incentive intensity and month fixed effects. The two objects therefore answer different questions.
5.2.2. Formal Statistical Test
We formally assess pre-window comparability using exact paired-month sign-flip tests and clustered event-time pre-bin tests. For the average pre-window difference over , the exact paired-month test yields across 12 matched month pairs. The corresponding immediate pre-window test over is weaker (), and the clustered event-time regression rejects equality over the immediate pre-window (). These results indicate that broad pre-window comparability is not rejected, but local differences immediately before settlement are visible in the formal event- time specification.
For this reason, the figures and tests should be read as local diagnostics rather than as proof of a clean untreated counterfactual path. They support the reduced-form comparison only in a limited sense and do not eliminate all settlement-specific confounding.
5.3. Formal Event-Time Evidence
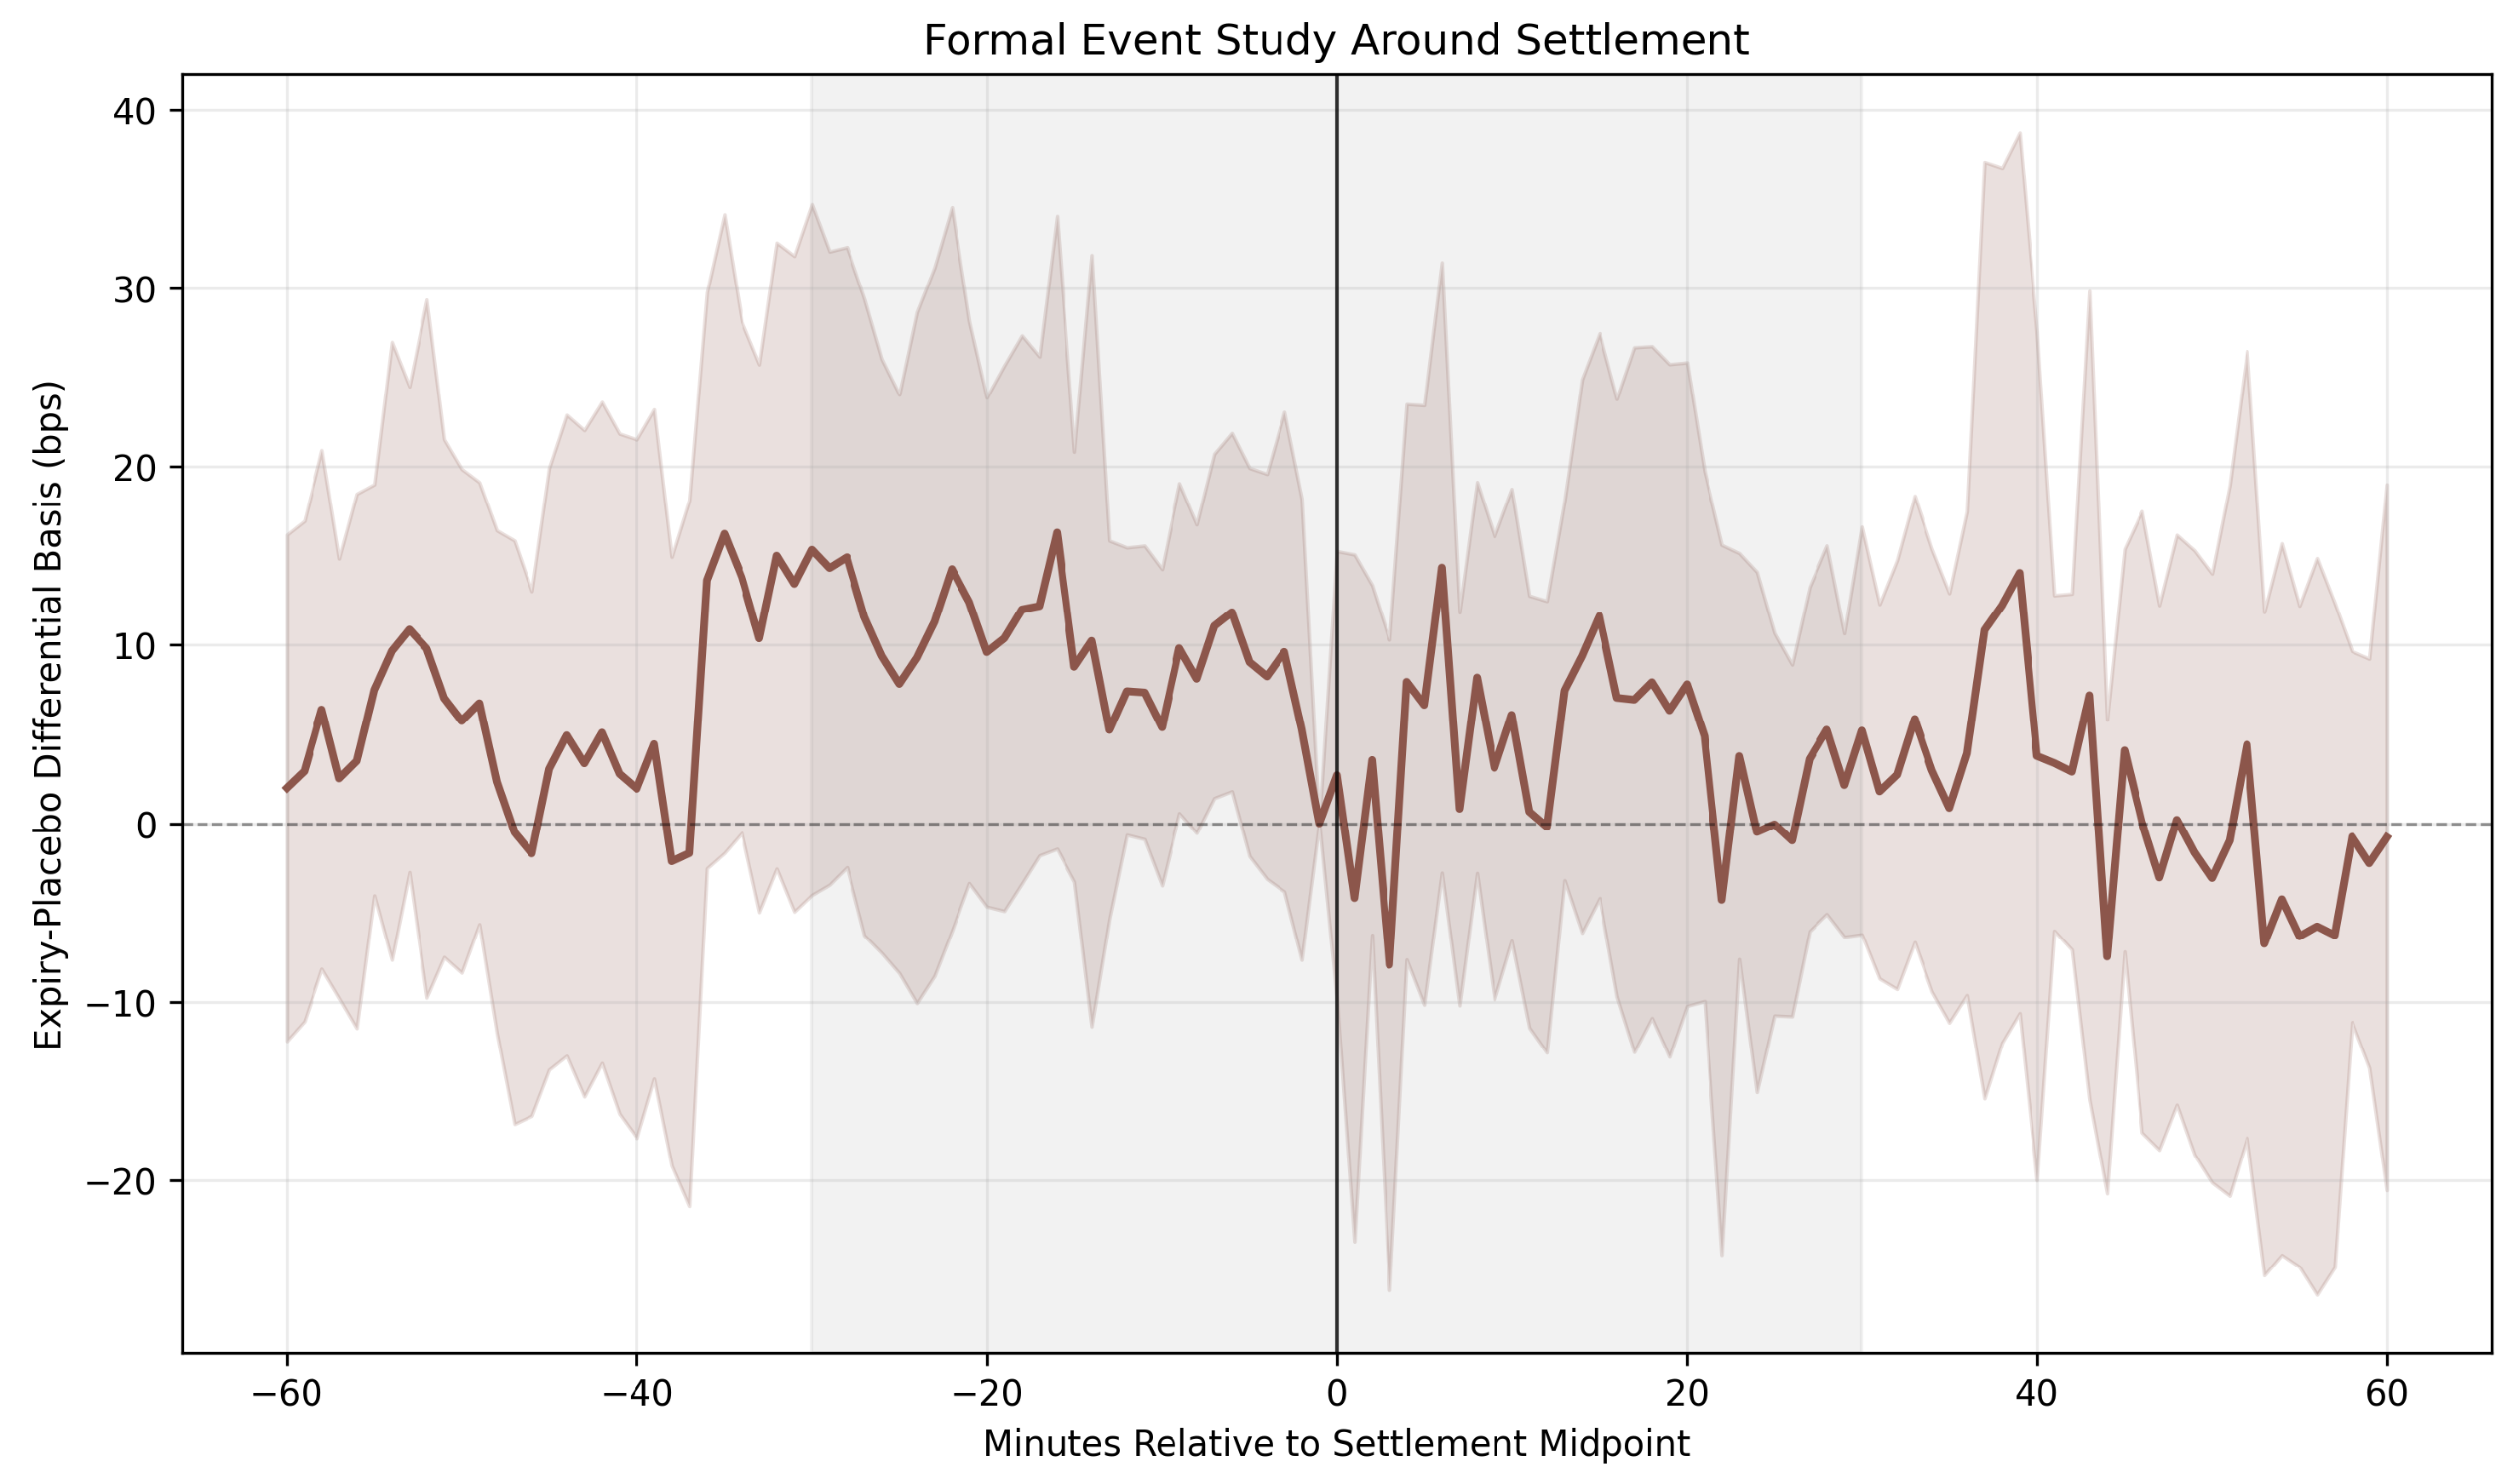
Figure 2 plots formal event-time interaction coefficients for expiry relative to placebo windows. Event time is centered at
, defined as the settlement midpoint, and the regression uses the symmetric window
, month fixed effects,
as the reference bin, and standard errors clustered by event date. The line reports the expiry-minus-placebo coefficient at each event minute and the shaded band reports the corresponding 95% confidence interval.
The coefficients vary around settlement and the largest absolute post-settlement estimate is 14.3 basis points at . However, the confidence intervals are wide and the immediate pre-period joint test rejects equality, so the figure is not a clean parallel-trends validation and does not identify the mechanism or trader behavior behind the observed pattern.
Table 6 summarizes the same formal regression shown in
Figure 2. It uses 24 event dates (12 expiry and 12 placebo windows). The immediate pre-period joint Wald test over
rejects equality in the local pre-window (
), reinforcing the need to interpret the dynamic estimates as a reduced-form event-window diagnostic rather than as clean causal evidence.
Hypothesis status: The event-time evidence is suggestive for H3 because settlement-window divergence is visible around the event, but the immediate pre-window differences mean it should be interpreted cautiously rather than as clean evidence of post-settlement reversion.
5.4. Monthly Heterogeneity and Directional Alignment
Table 7 reports settlement outcomes for all 12 expiry events in our sample, providing complete transparency regarding effect heterogeneity. The monthly classification is rule-based. Predicted directional pressure is upward (“Support”) when the settlement price ends above the relevant strike and downward (“Suppress”) when the settlement price ends below the strike; months with very small basis changes are labeled “Neutral” using the threshold described in
Table 7.
The results show substantial directional consistency: 10 of 12 months exhibit basis movements in the theoretically predicted direction (83.3% success rate). The two near-neutral months (September bps, November +0.39 bps) fall inside the basis-point neutral band and are therefore retained but counted as non-matches. February now uses the observed February 15 placebo window, so all monthly placebo entries are computed from same-month control data. Months with the largest positive deltas (March +29.61 bps, December +38.12 bps, April +10.53 bps, October +5.93 bps) coincide with Bitcoin settling above strike prices, while the largest negative deltas (May bps, July bps, June bps, August bps) coincide with Bitcoin settling below strikes. This directional pattern is compatible with incentive-driven explanations, though it remains reduced-form evidence and alternative settlement-specific explanations cannot be fully ruled out.
Hypothesis status: The monthly directional evidence is suggestive for H2 in the sense that most settlement months move in the predicted sign, while the small number of months and the neutral-band classification require caution.
5.5. Formal Directional Test
The descriptive sign-alignment exercise in
Table 7 yields 10 matches in 12 months (one-sided exact binomial
; two-sided
), but this result is sensitive to the small event count and the neutral-band classification.
Table 8 applies stricter event-level and slope-based criteria:
Table 7 uses expiry-minus-placebo monthly mean basis with a ±2 basis-point neutral band, whereas
Table 8 uses directionalized event-level scores and above-versus-below-strike slope tests. Under these stricter tests, the evidence is mixed; the treatment-incentive slopes are negative on both sides of the strike, but the slope difference is not statistically significant. We therefore interpret the monthly sign pattern as suggestive rather than as evidence of a clean directional-asymmetry mechanism.
5.6. Descriptive Microstructure Evidence
To address mechanism-related concerns, we examine whether the main settlement-window basis result is accompanied by visible changes in coarse one-minute microstructure proxies. Using one-minute OHLCV proxy measures, we do not find a statistically sharp settlement-window increase in abnormal volatility relative to placebo windows (, ), abnormal Coinbase log volume (, ), or immediate signed return differentials (, ). These coarse proxy measures do not identify order-book mechanism or trader behavior, but they suggest that the main basis result is not simply mirrored by an obvious aggregate spike in minute-level volume or volatility.
These measures are not substitutes for order-book imbalance, aggressive trade direction, signed trade volume, or depth-depletion tests. Those mechanism tests would require synchronized historical order-book and trade-direction data for Coinbase and Binance.
Appendix A provides supporting descriptive statistics and the August case study. The appendix evidence should be interpreted as illustrative only, not as causal evidence of a specific microstructure mechanism.
5.7. Robustness Checks
The results in this section correspond to the reference monthly-actual specification described in
Section 4.8 and represent the paper’s primary confirmatory evidence.
We conduct several robustness tests to assess the stability of our findings and examine alternative explanations.
5.7.1. Test 1: Placebo Date Falsification
We re-run Model 2 using data from the 15th of each month (identical 150-min spans with inclusive one-minute endpoints, but no expiry event). If our results reflected time-of-day effects, day-of-month patterns, or other spurious factors unrelated to settlement, we should observe similar coefficients on placebo dates. Result: In the main specification, the interaction coefficient is approximately . When we re-estimate the same regression on non-expiry placebo dates, the interaction coefficient becomes (). The placebo estimate is therefore not statistically significant, and its sign does not align with the main effect. This pattern is consistent with the placebo estimate being close to zero on non-settlement dates, although it does not eliminate the possibility that other unobserved differences between expiry and placebo days remain relevant. As an additional falsification check, we shift the settlement window forward by 60 min and re-estimate the same specification. The shifted-window specification yields and remains statistically significant. This estimate is suggestive of an effect concentrated around the settlement period, but it does not fully isolate timing and cannot fully rule out adjacent intraday influences. Taken together, these placebo and falsification results are consistent with a settlement-specific interpretation of the main finding, although alternative explanations cannot be fully excluded and the tests do not identify mechanism.
5.7.2. Test 2: Exchange Heterogeneity and Alternative Comparisons
Coinbase and Binance differ along several dimensions that matter for interpretation: clientele, geography, fee tiers, market-maker composition, USD versus USDT denomination, and exchange microstructure. The baseline design is therefore informative about settlement-window divergence between a benchmark-relevant venue and a major excluded venue, but it is not a fully exchange-invariant causal estimate.
Table 9 reports the available multi-exchange comparisons. The Binance baseline remains negative and statistically significant, and the excluded composite of Binance and OKX is also negative and significant. Coinbase–OKX alone is weak, and Coinbase–Bitstamp, an included-versus-included comparison, is near zero and insignificant. Coinbase–Kraken is negative and statistically significant, but its magnitude is much smaller than the Binance baseline. This pattern is consistent with the main result not being solely a Coinbase–Binance artifact, but it also shows that the effect is not uniform across every feasible exchange pair.
The Kraken comparison is useful because it is USD-denominated and therefore helps assess whether the baseline result is simply a Coinbase–USDT comparison artifact. However, Kraken can be benchmark-relevant in Bitcoin reference-rate designs, so it is not a clean non-constituent placebo in the same sense as Binance or OKX. The included-versus-included comparisons are also heterogeneous: Coinbase–Bitstamp is near zero and statistically insignificant, whereas Coinbase–Kraken is negative and statistically significant, despite both comparison venues belonging to the benchmark family. This mixed result prevents a clean interpretation based only on benchmark inclusion. It may reflect exchange-specific liquidity, benchmark weighting, clientele, or price-discovery differences, but the present data cannot separate these channels. We therefore interpret
Table 9 as evidence of venue heterogeneity and as a check against a purely USDT-denomination explanation, not as definitive proof of an included-versus-excluded exchange mechanism.
5.7.3. Test 3: Volume Controls
We augment the specification with aligned minute-level traded volume on Coinbase () and Binance () as additional controls. If the basis divergence simply reflected volume imbalances or liquidity differences between exchanges, controlling for these exchange-specific volume measures should attenuate the coefficient. Result: The coefficient remains negative and significant (, , ). This is suggestive of volume differences alone not fully accounting for the observed pattern, although the controls do not capture every dimension of liquidity or trading conditions and therefore cannot fully rule out related explanations.
5.7.4. Test 4: Volatility Subsample Analysis
We split the sample into high-volatility and low-volatility periods using a trailing 30-day realized-volatility measure for Bitcoin, computed as the non-annualized standard deviation of daily log returns over the prior 30 days, with observations above the sample median classified as high-volatility and observations at or below the median classified as low-volatility. This partition is exploratory and is used to study heterogeneity rather than as a pre-specified baseline specification; if settlement-related price pressure is easier during calm markets (when less volume is required to move prices), the effect should be stronger in low-volatility periods. Result: The effect is present in both subsamples but stronger during low-volatility periods () compared to high-volatility periods (). This pattern is suggestive of stronger effects during lower-volatility periods, which may be consistent with reduced background noise, though that interpretation is not directly tested here and the subsample split remains exploratory.
5.7.5. Test 5: Strike Selection Method
Our primary results rely on identifying economically relevant contract strikes using actual Polymarket contract data. To assess this approach, we compare results across three strike selection methods: (1) refined nearest strike with volume filter (primary specification), (2) refined nearest strike without volume filter, and (3) an inferred round-number proxy.
Table 10 presents the results. The two audited Polymarket strike-selection methods produce negative and highly statistically significant coefficients. By contrast, the inferred round-number proxy is positive and statistically insignificant. This pattern strengthens the view that the result depends on identifying the economically active contract strike rather than assigning a coarse price-level proxy, while also showing that strike measurement is an important source of design sensitivity.
5.7.6. Test 6: Round-Number Placebo Strikes
A related concern is that all selected contract strikes are salient round-thousand Bitcoin price levels. If the result were driven by generic round-number clustering rather than prediction-market settlement incentives, then proximity to nearby inactive round-number levels should reproduce the main interaction pattern.
To test this, we construct two placebo incentive measures. For each month, we replace the selected active Polymarket strike with the nearest inactive
$1000-grid round number and with the nearest inactive
$5000-grid round number, excluding the active contract strike itself. We then re-estimate the same month-fixed-effect interaction regression.
Table 11 shows that the active Polymarket strike remains strongly significant, while neither inactive round-number placebo measure is statistically significant.
This check weakens a simple generic round-number explanation. It does not rule out every price-level or derivatives-related channel, because round numbers can also matter through other markets, but the paper’s main strike-proximity result is not reproduced by nearby inactive round-number levels in the paper-facing sample. An even stronger placebo would compare active prediction-market strikes with inactive prediction-market strikes from the same expiry-date candidate set. We do not report that test here because the inactive candidate files require additional audit work to distinguish inactive, duplicated, and institutionally distinct contract definitions. The inactive round-number placebo is therefore the paper-facing falsification test, while inactive-contract strike placebos remain a useful extension for future work.
5.8. Additional Specification Sensitivity Checks
We evaluate 243 alternative specifications that vary the settlement-window length, strike cutoff, contract-volume threshold, smoothing parameter, and Newey-West lag length. Because all specifications are generated from the same 12 settlement events and vary overlapping implementation choices, this grid is an exploratory sensitivity analysis rather than a set of independent or pre-registered confirmatory tests. It should be interpreted as a map of specification sensitivity.
Across the grid, the interaction coefficient remains negative, with estimates ranging from to . The tighter 3% strike cutoff produces the greatest attenuation; changes in the volume threshold and smoothing parameter have more modest effects, while the HAC lag primarily changes the estimated standard error. These results indicate that the sign and approximate magnitude are not uniquely determined by one implementation choice, but they do not add independent event-level evidence or identify the underlying mechanism.
Table 12 reports representative grid specifications; the full grid is summarized as sensitivity evidence and not as 243 independent confirmations.
5.9. Alternative Explanations
Several alternative explanations remain relevant. First, liquidity fragmentation or exchange-specific participant composition could produce Coinbase–Binance divergence even absent settlement incentives. The multi-exchange checks above partially address this concern because the excluded composite remains negative and significant, the USD-denominated Kraken comparison has the same sign at smaller magnitude, and the included Bitstamp comparison is near zero; however, the weak Coinbase–OKX result shows that the pattern is not uniform across all excluded venues.
Second, generic round-number effects could matter because Bitcoin order flow and derivatives positioning may cluster around salient price levels. The inactive round-number placebo test weakens the simplest version of this explanation: nearby inactive $1000 and $5000 round-number levels do not reproduce the active-strike result. Still, this test cannot rule out all price-level clustering channels, especially if prediction-market strikes, spot-market limit orders, and derivatives strikes concentrate at similar levels.
Third, month-end CME or Deribit options expiries are a serious competing channel. CME publishes volume and open-interest resources and Deribit provides market-data APIs, while vendors provide historical crypto derivatives and order-book datasets. However, the current repo does not contain a clean historical panel of CME/Deribit strike-level open interest, strike concentration, max-pain, or expiry-by-minute exposure data for the paper’s sample. The analysis therefore cannot fully separate prediction-market settlement incentives from broader month-end crypto derivatives pressure. The empirical design is most informative about cross-exchange divergence around the settlement windows studied here; a fuller design would jointly model prediction-market strikes and conventional crypto-derivatives exposures.
Fourth, information shocks and stablecoin denomination effects could affect the basis. The placebo timing checks, Tether adjustment, and exchange comparisons reduce but do not eliminate these concerns. For this reason, the evidence is best interpreted as a structured reduced-form pattern consistent with settlement-related incentives, rather than as proof that a specific trader or mechanism caused the observed divergence.
5.10. What the Evidence Does and Does Not Establish
What the evidence suggests. The analysis documents several empirical regularities. First, settlement-window divergence across exchanges is present in the data. Second, this divergence is stronger when the underlying price is closer to economically relevant contract strikes. Third, the pattern is more pronounced on oracle-constituent exchanges relative to excluded exchanges. Fourth, the directional pattern is broadly consistent with payoff-relevant incentives.
What the evidence does not establish conclusively. The analysis does not directly identify the trader or traders generating the observed price pressure. It does not establish whether the behavior reflects deliberate manipulation, hedging, liquidity provision, or other strategic settlement-related activity. It also does not isolate the exact microstructure mechanism through which the divergence emerges, because true mechanism identification would require synchronized historical order-book and trade-direction data rather than one-minute OHLCV proxies. Finally, it remains an open question whether the findings generalize across all platforms, assets, or settlement designs.
7. Conclusions
This paper documents settlement-window price divergence in cryptocurrency prediction markets that is suggestive of settlement-related effects. Using high-frequency data, actual contract-level strike identification from Polymarket and Kalshi, and a difference-in-differences design, we find that constituent exchange prices diverge from non-constituent exchange benchmarks during settlement windows when binary option strikes are nearby. Using actual contract-level data from prediction markets, we document that a one standard deviation increase in strike proximity is associated with a 6.7 basis point price deviation during settlement windows ( in the baseline HAC specification). At high incentive levels (2+ standard deviations), the estimated magnitudes reach roughly 14–20 basis points, consistent with observed patterns. The monthly directional evidence and strike-selection robustness checks are compatible with incentive-driven explanations, while also indicating that strike measurement precision matters for detecting the pattern. These findings should nevertheless be interpreted with appropriate caution. The empirical design is reduced-form, does not directly observe trader identity or order-level mechanism, and does not fully isolate deliberate settlement-related trading from other settlement-specific dynamics. Because constituent and comparison exchanges differ in clientele, market structure, and denomination, the results should be interpreted as reduced-form evidence rather than a fully exchange-invariant causal estimate. Because the effective independent variation is closer to 12 settlement events than to 3624 independent minutes, the very small baseline p-values should be interpreted cautiously even though the coefficient remains negative under more conservative inference checks. Our results may have implications for market design. As prediction markets mature and achieve institutional scale, the assumption of “oracle independence”—that settlement data sources are unaffected by the derivatives they settle—may become more difficult to maintain. Markets used to settle derivatives larger than themselves may be more exposed to settlement-related price pressure within the setting studied here. For regulators and platform designers, these findings may point to settlement-window surveillance, disclosure around aggregate positioning, and oracle-construction choices as areas for further consideration. For researchers, the results also motivate further work on Oracle Extractable Value and related settlement-design questions, but only in a conjectural and forward-looking sense.
More broadly, our findings illuminate a fundamental tension in decentralized finance: the desire for permissionless, automated settlement conflicts with the need for robust settlement oracles. Addressing this tension may be important for prediction markets to achieve their potential as information aggregation mechanisms without unduly affecting the underlying markets they reference.
Future research should examine: (1) optimal oracle design under adversarial conditions with game-theoretic analysis, (2) cross-platform analysis as more prediction market data becomes available, (3) joint modeling of prediction-market strikes with CME/Deribit strike-level open interest and max-pain measures, (4) order-book and signed-order-flow mechanism tests using synchronized historical L2 data, (5) the interaction between OEV and traditional MEV in blockchain-based settlements, and (6) whether analogous settlement-related price pressure appears in other financially-settled prediction markets beyond cryptocurrency (e.g., weather derivatives, sports betting, political event contracts).