Abstract
Non-fungible tokens (NFTs) are a type of digital record of ownership used in a unique way: ensuring authenticity and uniqueness. Due to these characteristics, NFTs have been used in several markets: games, arts, and sports, among others. In 2020, the volume of negotiations of the NFTs was about USD 200 million. Despite the strong interest of economic agents in operating with NFTs, there are still gaps in the literature, regarding their dynamics and price interrelation with other potentially related assets, which deserve to be studied. In this sense, the main purpose in this paper is to analyze the cross-correlation between NFTs and larger cryptocurrencies. To this end, our methodological approach is based on a Detrended Cross-Correlation Analysis correlation coefficient, with a sliding windows approach. Our main finding is that the cross-correlations are not significant, except for a few cryptocurrencies, with weak significance at some moments of time. We also carried out an analysis of the long-term memory of NFTs, which demonstrated the antipersistence of these assets, with results seemingly corroborating the market inefficiency hypothesis. Our results are particularly important for different classes of investors, due to the analysis on different time scales.
1. Introduction
Non fungible tokens (NFTs) are a type of digital record of ownership, used in a unique way as a kind of intellectual property certificate, which guarantees authenticity and uniqueness. NFTs cannot be exchanged, due to their individual specifications, unlike cryptocurrencies. The main advantage of the technology is the possibility of guaranteeing the authenticity of something, without the need for a regulatory body [1]. Due to this, NFTs are being used for authenticity in several markets: games, arts, sports, and music, among others. NFTs are not a new technology per se, given the launch of the first one in 2012, called Colored Coins, also known as Bitcoin 2.x, although that was without much success.
Currently, the most common example of a NFT is the ERC-721 standard, which operates on the Ethereum network, but there are also other standards, such as Enjin’s ERC-1155, which is designed for use in video games. Ethereum is probably the second-most-famous cryptocurrency in the world, after Bitcoin. For a NFT, however, it is fundamental, because the cryptographic key is stored in the Blockchain Ethereum (ETH), which supports the recording of the extra information that differentiates ETH as a virtual currency from a NFT as a single asset (see, for example, [2]).
The financial trading volume of the three major NFT markets was about USD 342 million in February 2021, as interest in digital collectibles increased. For comparison purposes, NFTs worth just USD 12 million were traded in December 2020, while the full-year of trading was about USD 200 million [2]. A signal of the increasing interest in NFTs is demonstrated by the fact that, in March 2021, a single NFT digital collage by the artist Mike Winkelmann was sold at a Christie’s auction for USD 69.3 million [3]. With this, the popularity of NFTs has increased, as can be seen in Figure 1. This figure shows the weekly searches for the term “non-fungible tokens” in the last five years (between 29 June 2016 to 29 June 2021), according to Google Trends. The increase in searches, especially between mid-2020 and early 2021, can clearly be seen. With the increase in the demand for NFTs and cryptocurrencies, initial coin offerings (ICO) have emerged, which are a new form of funding that generates billions to the blockchain, potentially challenging traditional equity or business angel offerings. They represent a new business branch, emerging from crowdfunding by employing blockchain technology to issue and exchange shares in startup companies. From an issuing company’s perspective, ICOs have several benefits. First, startups raise capital from investors without diluting their holdings. Second, the ICO mechanism allows reaching a global investor base with almost no transaction costs [4,5].
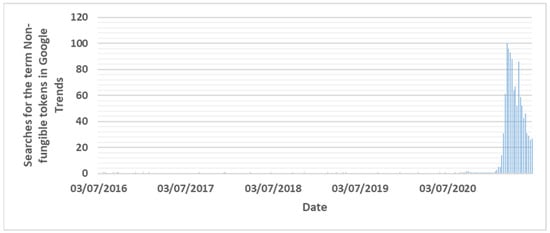
Figure 1.
Searches in Google Trends for the term “non-fungible tokens” worldwide, between 29 June 2016 and 29 June 2021.
Studies into NFTs and finance are scarce, however. Ref. [6] found low volatility transmission across NFTs, Bitcoin, and Ethereum returns, with limited low spillover between these assets, even across NFT markets. Using a wavelet coherence analysis, the authors found some comovements between the Decentral and LAND token markets and between the Bitcoin and Ethereum cryptocurrencies. Their results show that NFTs and the cryptocurrency markets appear to be distinct. Other examples of studies involving NFTs are those of [7,8], which, although not directly related with our work, demonstrate the relevance of the NFTs in different research areas. Furthermore, ref. [9] analyzed the interaction between the cryptocurrency and the NFT markets, with their results showing that BTC and ETH prices affect the NFT market, while the NFT market does not significantly influence the price of cryptocurrencies. Finally, ref. [10] carried out a systematic review on NFTs, concluding there was a scarcity of articles published in major economics journals, despite the growing interest in the topic.
The Efficient Markets Hypothesis (EMH) refers to the way asset prices reflect available information [11]. Studies into the efficiency of cryptocurrency markets have been carried out by several authors, with some evidence of possible inefficiency (see, for example, ref. [12] for a survey). Regarding NFTs, ref. [13] analyzes market efficiency from the dataset of all secondary markets trading Decentral and LAND tokens, between March 2019 and March 2021, and found antipersistence in daily data and a pattern close to the efficiency for weekly data.
Regarding the cryptocurrency market, there are many studies assessing their market efficiency (see [14,15,16,17], among many others). Recently, and already considering the COVID-19 pandemic crisis, ref. [18] used the generalized Hurst exponent to analyze five cryptocurrencies: Bitcoin, Ethereum, Ripple, Litecoin, and Binance. The authors concluded that in all cases, except for Bitcoin, the value of the Hurst exponent decreased when the COVID-19 pandemic spread, showing that these cryptocurrencies have become less multifractal and, therefore, more efficient. Furthermore, based on an asymmetric multifractal detrended fluctuation analysis, ref. [19] studied Bitcoin, Litecoin, Ripple, and Ethereum and found that they became less efficient after the beginning of the pandemic.
Specifically analyzing the reality of Fintech, we could find several papers devoted to this topic. Ref. [20] used an exploratory study to assess the evolution of data aggregation as well as the infrastructure in Fintech operations, through a vast database with thousands of respondents. Among the main results, it was found that Fintechs offer innovative financial services, while reaching additional markets than those of traditional financial intermediaries. Ref. [21] studied the economic basis of projects implemented by Fintechs, in order to compare their efficiency against conventional banks, through the traditional analysis of cost–benefit and total cost of ownership, concluding for the greater operational efficiency of Fintechs. Ref. [22] analyzed the use of financial services by Fintechs in the pre- and post-COVID period in Bulgaria. Based on a questionnaire with hundreds of individuals, those authors found that most respondents did not adequately know the technologies of Fintech firms before the pandemic, although they started to use these tools more often after that particular crisis. Finally, ref. [23] examined the risk profile of Fintechs against non-Fintech firms in the US, using traditional econometric methods and machine learning, concluding that no significant differences exist between Fintech and non-Fintech firms, for that particular issue.
2. Materials and Methods
Both data regarding NFTs and cryptocurrencies were retrieved from the websites nofunglible.com and coinmarketcap.com, the former corresponding to NFT sales in USD and the latter to the valuation of the cryptocurrencies under analysis. This study used daily data from 23 June 2017 to 28 February 2021, with the choice of the cryptocurrencies made by considering the ones with the highest trading volume at the moment of the first observation.
Regarding the methodology and considering the type of data, we decided to apply two different statistical physics methods: Detrended Fluctuation Analysis (DFA) and Detrended Cross-Correlation Analysis (DCCA), in particular its correlation coefficient (). With DFA, we intend to assess the long-range dependence of each individual time series, while with we assess the paired correlation long-range dependence.
The DFA is applied for individual time series, as follows:
- (i)
- Let of length , starting by the calculation of the profile , with the mean observed value;
- (ii)
- This profile is then divided into different boxes of length ;
- (iii)
- From each one, the local trend is calculated through the ordinary least squares, to detrend the profile and to calculate ;
- (iv)
- After repeating the process for the different size boxes, the log–log regression is applied between and , with the DFA being expressed by the power law , which identifies α as the Hurst exponent.
If , the time series could be described as a random walk, which in the context of financial markets means that the asset is efficient. If , the time series has a persistent behavior, and if it has an antipersistent behavior.
Originally proposed by [24], the DFA has been previously applied in financial markets and even in the cryptocurrency market. The studies of [14,25,26] are just some examples of studies applying DFA.
The DCCA makes a similar analysis to the one of the DFA, but for paired relationships and with similar steps, as follows:
- (i)
- Based on two different time series, and , with equal length, the first step is the calculation of the profiles and , with for the mean observed values;
- (ii)
- Both profiles are divided into boxes of length n, and the local trends and are also obtained through ordinary least squares;
- (iii)
- The local trends are used to detrend the profiles and to obtain the covariance of the residuals, given by ;
- (iv)
- These residuals are the base of the calculation of the detrended covariance, given by ;
- (v)
- Proposed by [27], the DCCA was combined with the DFA by [28], generating the DCCA correlation coefficient (), given by
This is an efficient coefficient [29,30] and testable through the procedure of [31], which was used in this paper to obtain the confidence levels. The has already been used in finance, including in the cryptocurrency market, by [17], for example. In our study, in both cases, we wanted to evaluate the evolution of the parameters over time, so we applied sliding windows approaches, based on windows of 250 observations. Other applications in finance include [32,33,34,35,36].
Based on these robust methodologies, we want to analyze the evolution of the efficiency of the assets under analysis (through the use of DFA with a sliding windows approach), as well as the way those assets evolve, considering their cross-correlations. Considering the possible lack of liquidity of NFT, it is possible that a given asset could suffer from some kind of inefficiency, which could be relevant when analyzing the cross-correlation with the cryptocurrency market.
3. Results
We started our analysis by calculating the DFA with sliding windows, obtaining the results presented in Figure 2. As can be seen, most of the assets under analysis evolved from DFA exponents higher than 0.5 to a pattern at around the 0.5 level. The exceptions are clearly USDT and NFT, which present a strong antipersistent behavior throughout the period under analysis.
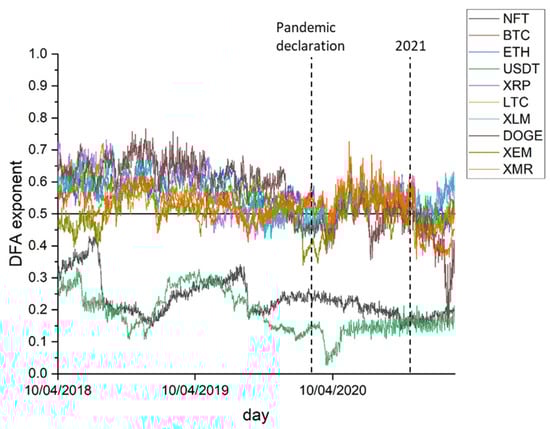
Figure 2.
Evolution of the Hurst exponents over time.
Regarding the cryptocurrencies, since 2018 the DFA has tended to approach the 0.5 level, which is consistent with the random walk behavior and with market efficiency. However, with the COVID-19 pandemic that affected financial markets at the beginning of 2020, represented in the figure by the first vertical dashed line, we can see that cryptocurrencies seemed to become less efficient, with a slight but visible increase in the DFA exponent, showing a persistent behavior.
Other behaviors observed were the clear antipersistent behavior of Dogecoin and Litecoin and the more visible and persistent behavior of XRP and XLM. This may be associated with the volume traded on the cryptocurrency market since the COVID-19 pandemic, with a greater increase in prices in some cases (for example, between 7 March 2020 to 6 March 2021, Bitcoin rose from USD 5182 to USD 61,195.3, representing an increase of more than 1000% over a one-year period).
For NFTs, after the COVID-19 pandemic, the DFA value fell, showing greater antipersistence, a trajectory contrary to market efficiency. This may be related to the fact that NFT markets are still new, so they do not have as many agents involved as other markets.
Regarding the , Figure 3 presents the evolution of the correlation coefficients between NFTs and the different cryptocurrencies, for the time scales of 4, 16, 33, and 60 days. It can be observed that most of the cryptocurrencies present nonstatistically significant correlations with NFTs, during most of the periods under analysis.
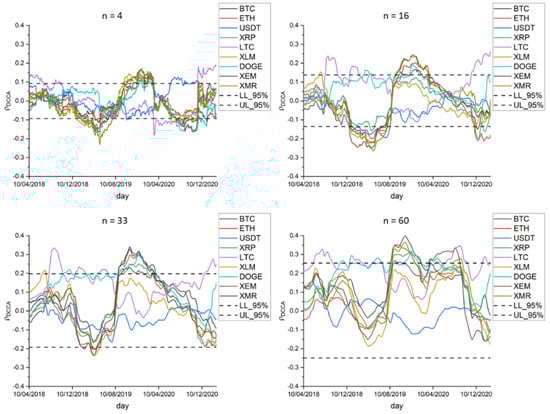
Figure 3.
Evolution of the between NFT and the different cryptocurrencies under analysis, for time scales of 4, 16, 33, and 60 days. Dashed lines represent the 95% confidence interval limits, to test the statistical significance of the correlations.
Evaluating the behavior of the 4-day time scale, it can be seen that, at the beginning of 2019, there was a negative cross-correlation between the returns of the NFTs and the analyzed cryptocurrencies. Between the end of 2019 and the beginning of 2020, the returns of the analyzed NFTs and cryptocurrencies showed a positive cross-correlation, significant albeit relatively weak. At the end of 2020, a positive cross-correlation between the returns of NFTs and the Litecoin cryptocurrency can be identified.
For the time scales of 16 and 33 days, we can find a similar movement, with a weak negative cross-correlation between the returns of NFTs and some cryptocurrencies, in early 2019, with that cross-correlation becoming positive in late 2019 and early 2020. After that, the only significant correlation was the one between NFTs and Litecoin. For the longer time scale (60 days), no negative cross-correlation was detected. On the contrary, the Bitcoin, Dogecoin, Ethereum, Litecoin, and XRP cryptocurrencies showed weak and positive cross-correlations with NFTs, in mid-2019 and mid-2020.
It is noteworthy that the existent significant correlations are relatively weak, with no values above 0.4 at any time during the period under analysis. These results corroborate the findings of [6], which concluded that NFTs are relatively independent assets in relation to the cryptocurrency market, i.e., movements in cryptocurrencies do not affect NFTs nor affect them weakly and at certain moments.
4. Conclusions
NFTs are assets used in several markets, such as sports, arts, and entertainment, with a popularity that has increased recently. At the same time, some cryptocurrencies such as Bitcoin and Ethereum have been setting record prices in 2020 and at the beginning of 2021. Based on this, we analyzed the cross correlation between the NFT market and some cryptocurrencies to identify whether the boom in the NFT market correlates with the boom in the cryptocurrency market.
Most of the time, a nonsignificant correlation was found between NFTs and cryptocurrencies; when the correlations are significant, they are weak and restricted to some cryptocurrencies. This is evidence that NFT returns are not correlated with those of cryptocurrencies, corroborating the results found by [6], namely that NFTs are a distinct class of assets. Despite the fact that some NFTs are created using a similar structure to some cryptocurrencies, such as in the case of Ethereum, the price dynamics of these markets are independent.
The dependence of the assets under analysis could be related to their market efficiency, as NFTs show an antipersistent behavior throughout the period under analysis, a similar result to that found by [13]. Moreover, after the start of the COVID-19 pandemic, NFT returns became less efficient, which could be associated with the large trading volume that was registered during this period, making the market more predictable.
Furthermore, analyzing the efficiency of the cryptocurrencies until the COVID-19 pandemic crisis indicates that these cryptocurrencies were becoming more efficient. However, this changed after the COVID-19 crisis, with some signs of persistence, except for Dogecoin. At the beginning of 2021, some cryptocurrencies became persistent (XRP and XLM) and others became antipersistent (Dogecoin and Litecoin), showing that the COVID-19 pandemic changed the market efficiency of some cryptocurrencies, given the detected heterogeneous behavior.
The chosen methodologies are relevant for the purpose of our study. Firstly, DFA is a robust methodology that is able to detect long-range dependence, even in the presence of a nonstationary time series. DCCA and its correlation coefficient share the same feature, although they are being used to analyze the relationship between variables for different time scales (while other methodologies do not allow this feature). In particular, the results show the absence of a relationship between the compared assets. It is possible that the difference of liquidity levels could demonstrate that both markets are segmented, which could be relevant for investors, when building their portfolios.
The present work has the limitation of estimating the correlation between assets in a monofractal way. A generalization of this estimate and, consequently, an improvement would be the use of a multifractal correlation (MF-DCCA), which would allow for a more detailed analysis. A suggestion for future work, therefore, would be the use of this tool. Moreover, despite the conclusion about the possible existence of inefficiency, a deeper study about the possible sources of inefficiencies would also be interesting and worth considering for future research.
Author Contributions
Conceptualization, É.P., P.F. and D.Q.; methodology, É.P., P.F. and D.Q.; formal analysis, É.P., P.F. and D.Q.; writing—original draft preparation, É.P., P.F. and D.Q.; writing—review and editing, É.P., P.F. and D.Q. All authors have read and agreed to the published version of the manuscript.
Funding
P.F. is pleased to acknowledge financial support from Fundação para a Ciência e a Tecnologia (grant UIDB/05064/2020).
Institutional Review Board Statement
Not applicable.
Informed Consent Statement
Not applicable.
Data Availability Statement
The data presented in this study are available on request from the corresponding author.
Conflicts of Interest
The authors declare no conflict of interest.
References
- Musan, D.I. NFT.Finance Leveraging Non-Fungible Tokens; Imperial College London: London, UK, 2020; Available online: https://www.imperial.ac.uk/media/imperial-college/faculty-ofengineering/computing/public/1920-ug-projects/distinguished-projects/NFT.-financeLeveraging-Non-Fungible-Tokens.pdf (accessed on 12 August 2022).
- Chohan, U.W. Non-Fungible Tokens: Blockchains, Scarcity, and Value. Critical Blockchain Research Initiative (CBRI) Working Papers. 2021. Available online: https://papers.ssrn.com/sol3/papers.cfm?abstract_id=3822743 (accessed on 12 August 2022).
- Crow, K.; Ostroff, C. Beeple NFT Fetches Record-Breaking $69 Million in Christie’s Sale. Wall Street J. 2021. Available online: https://www.wsj.com/articles/beeple-nft-fetches-record-breaking-69-million-in-christies-sale-11615477732 (accessed on 12 August 2022).
- Ofir, M.; Sadeh, I. ICO vs IPO: Empirical Findings, Information Asymmetry and the Appropriate Regulatory Framework. Vanderbilt J. Transnatl. Law 2020, 53, 525–613. [Google Scholar] [CrossRef]
- Miglo, A. Theories of Crowdfunding and Token Issues: A Review. J. Risk Financ. Manag. 2022, 15, 218. [Google Scholar] [CrossRef]
- Dowling, M. Is non-fungible token pricing driven by cryptocurrencies? Finance Res. Lett. 2021, 44, 102097. [Google Scholar] [CrossRef]
- Heinonen, H.; Semenov, A.; Boginski, V. Collective Behavior of Price Changes of ERC-20 Tokens. In Computational Data and Social Networks; Proceedings of the 9th International Conference, CSoNet 2020, Dallas, TX, USA, 11–13 December 2020; Lecture Notes in Computer Science; Chellappan, S., Choo, K.K.R., Phan, N., Eds.; Springer: Cham, Swizerland, 2020; Volume 12575. [Google Scholar] [CrossRef]
- Treiblmaier, H. Beyond Blockchain: How Tokens Trigger the Internet of Value and what Marketing Researchers Need to Know About Them. J. Mark. Commun. 2021. [Google Scholar] [CrossRef]
- Ante, L. The Non-Fungible Token (NFT) Market and Its Relationship with Bitcoin and Ethereum. FinTech 2022, 1, 216–224. [Google Scholar] [CrossRef]
- Bao, H.; Roubaud, D. Non-Fungible Token: A Systematic Review and Research Agenda. J. Risk Financial Manag. 2022, 15, 215. [Google Scholar] [CrossRef]
- Fama, E. Efficient Capital Markets: A Review of Theory and Empirical Work. J. Financ. 1970, 25, 383–417. [Google Scholar] [CrossRef]
- Kyriazis, N. A Survey on Efficiency and Profitable Trading Opportunities in Cryptocurrency Markets. J. Risk Financ. Manag. 2019, 12, 67. [Google Scholar] [CrossRef]
- Dowling, M. Fertile LAND: Pricing non-fungible tokens. Financ. Res. Lett. 2021, 44, 102096. [Google Scholar] [CrossRef]
- Urquhart, A. The inefficiency of Bitcoin. Econ. Lett. 2016, 148, 80–82. [Google Scholar] [CrossRef]
- Sigaki, H.Y.; Perc, M.; Ribeiro, H.V. Clustering patterns in efficiency and the coming-of-age of the cryptocurrency market. Sci. Rep. 2019, 9, 1440. [Google Scholar] [CrossRef] [PubMed]
- Sensoy, A. The inefficiency of Bitcoin revisited: A high-frequency analysis with alternative currencies. Financ. Res. Lett. 2019, 28, 68–73. [Google Scholar] [CrossRef]
- Ferreira, P.; Kristoufek, L.; Pereira, É. DCCA and DMCA correlations of cryptocurrency markets. Phys. A Stat. Mech. Appl. 2020, 545, 123803. [Google Scholar] [CrossRef]
- Mnif, E.; Jarboui, A.; Mouakhar, K. How the cryptocurrency market has performed during COVID 19? A multifractal analysis. Financ. Res. Lett. 2020, 36, 101647. [Google Scholar] [CrossRef]
- Naeem, M.A.; Bouri, E.; Peng, Z.; Shahzad, S.J.H.; Vo, X.V. Asymmetric efficiency of cryptocurrencies during COVID19. Phys. A Stat. Mech. Appl. 2021, 565, 125562. [Google Scholar] [CrossRef]
- Ionescu, L. Digital Data Aggregation, Analysis, and Infrastructures in FinTech Operations. Rev. Contemp. Philos. 2020, 19, 92–98. [Google Scholar]
- Popova, Y. Economic Basis of Digital Banking Services Produced by FinTech Company in Smart City. J. Tour. Serv. 2021, 23, 86–104. [Google Scholar] [CrossRef]
- Vasenska, I.; Dimitrov, P.; Koyundzhiyska-Davidkova, B.; Krastev, V.; Durana, P.; Poulaki, I. Financial transactions using fintech during the COVID-19 crisis in Bulgaria. Risks 2021, 9, 48. [Google Scholar] [CrossRef]
- Morales, L.; Gray, G.; Rajmil, D. Emerging Risks in the FinTech Industry—Insights from Data Science and Financial Econometrics. Anal. Econ. Man. Financ. Mark. 2022, 17, 9–36. [Google Scholar]
- Peng, C.; Buldyrev, S.; Havlin, S.; Simons, M.; Stanley, E.; Goldberger, A. Mosaic organization of DNA nucleotides. Phys. Rev. E 1994, 49, 1685–1689. [Google Scholar] [CrossRef] [PubMed]
- Kristoufek, L. On Bitcoin markets (in)efficiency and its evolution. Phys. A Stat. Mech. Appl. 2018, 503, 257–262. [Google Scholar] [CrossRef]
- Quintino, D.; Campoli, J.; Burnquist, H.; Ferreira, P. Efficiency of the Brazilian Bitcoin: A DFA approach. Int. J. Financ. Stud. 2020, 8, 25. [Google Scholar] [CrossRef]
- Podobnik, B.; Stanley, H. Detrended Cross-Correlation Analysis: A new method for analyzing two nonstationary time series. Phys. Rev. Lett. 2008, 100, 084102. [Google Scholar] [CrossRef] [PubMed]
- Zebende, G. DCCA cross-correlation coefficient: Quantifying level of cross-correlation. Phys. A Stat. Mech. Appl. 2011, 390, 614–618. [Google Scholar] [CrossRef]
- Kristoufek, L. Measuring correlations between non-stationary series with DCCA coefficient. Phys. A Stat. Mech. Appl. 2014, 402, 291–298. [Google Scholar] [CrossRef]
- Zhao, X.; Shang, P.; Huang, J. Several fundamental properties of DCCA cross-correlation coefficient. Fractals 2017, 25, 1750017. [Google Scholar] [CrossRef]
- Podobnik, B.; Jiang, Z.; Zhou, W.; Stanley, H. Statistical tests for power-law crosscorrelated processes. Phys. Rev. E 2011, 84, 066118. [Google Scholar] [CrossRef]
- Wang, G.J.; Xie, C.; Chen, S.; Yang, J.J.; Yang, M.Y. Random matrix theory analysis of cross-correlations in the US stock market: Evidence from Pearson’s correlation coefficient and detrended cross-correlation coefficient. Phys. A Stat. Mech. Appl. 2013, 392, 3715–3730. [Google Scholar] [CrossRef]
- Wang, G.J.; Xie, C.; Chen, Y.J.; Chen, S. Statistical properties of the foreign exchange network at different time scales: Evidence from detrended cross-correlation coefficient and minimum spanning tree. Entropy 2013, 15, 1643–1662. [Google Scholar] [CrossRef]
- Wang, G.J.; Xie, C.; Lin, M.; Stanley, H.E. Stock market contagion during the global financial crisis: A multiscale approach. Financ. Res. Lett. 2017, 22, 163–168. [Google Scholar] [CrossRef]
- Hussain, M.; Zebende, G.F.; Bashir, U.; Donghong, D. Oil price and exchange rate co-movements in Asian countries: Detrended cross-correlation approach. Phys. A Stat. Mech. Appl. 2017, 465, 338–346. [Google Scholar] [CrossRef]
- Okorie, D.I.; Lin, B. Stock markets and the COVID-19 fractal contagion effects. Financ. Res. Lett. 2021, 38, 101640. [Google Scholar] [CrossRef] [PubMed]
Publisher’s Note: MDPI stays neutral with regard to jurisdictional claims in published maps and institutional affiliations. |
© 2022 by the authors. Licensee MDPI, Basel, Switzerland. This article is an open access article distributed under the terms and conditions of the Creative Commons Attribution (CC BY) license (https://creativecommons.org/licenses/by/4.0/).