Abstract
Seed microbes play crucial roles in plant health, but studying their diversity is challenging due to host DNA contamination. This study aimed to optimise methodologies for investigating seed microbiomes across diverse plant species, focusing on the efficacy of peptide nucleic acid (PNA) clamps to reduce host DNA amplification. We tested PNA clamps on three plant species: Melaleuca quinquenervia (tree), Microlaena stipoides, and Themeda triandra (grasses). The effectiveness of PNA clamps was assessed through in silico analysis, axenic tissue culture, and metabarcoding techniques. In silico analysis confirmed the specificity of PNA clamps to the 16S rRNA gene V4 region of chloroplasts in the grass species. Axenic tissue culture experiments showed that applying PNA clamps at both 1 µM and 0.25 µM concentrations significantly reduced plant DNA amplification. Metabarcoding analyses further confirmed that PNA clamps effectively suppressed host DNA, enhancing microbial diversity estimates across all three species while preserving core microbial taxa. The efficacy of the clamps varied among host species, with T. triandra exhibiting the highest blocking efficacy, and chloroplast clamps outperforming mitochondrial ones. This study demonstrates that PNA clamps are a useful for improving seed endophyte metabarcoding datasets, although they require optimisation for some plant species. This knowledge will contribute to enhancing our understanding of seed microbiome diversity and its ecological implications.
1. Introduction
Seeds are the main dispersal agent for most plants and the microbes contained in and on seeds form part of the first natural microbial inoculant available to the emerging seedling [1]. Identifying which microbial species are present and hence quantifying their diversity aids in determining their role in seed health. This has been of concern for plant pathologists and seed scientists, as many beneficial and pathogenic microbes are seed-associated or seed-borne [2]. More recently, the investigation of seed microbiomes has focussed on culture-independent approaches, whereby the diversity of seed microbes is gained without the need to culture individual organisms from the seed. This approach is seen as advantageous, as many seed endophytes have been identified as requiring tailored media or are difficult to culture [3]. High-throughput amplicon sequencing of the 16S or ITS/18S ribosomal RNA genes, also called metabarcoding, is one of the most widely adopted approaches for characterising the diversity and composition of microbial communities within the tissue of a host plant [4]. Within seed studies, metabarcoding has been adopted to assess grain spoilage and quality in rice [5], to differentiate between normal and abnormal seed phenotypes [6], and to identify microbes associated with differences in germination rates between seed batches [7]. The resultant amplification products from seed-microbe samples comprise a large amount of host plant DNA. This can limit the resultant sequencing depth of the microbial community and the capacity to detect rare taxa, resulting in underestimates of microbial diversity [8]. This is especially relevant when using universal primers that amplify chloroplast and mitochondrial copies from the host plant, and the microbes of interest. Additionally, it has been suggested that seed microbiomes are less diverse than other plant compartments, resulting in a large proportion of plant to microbial DNA in extracted samples [9]. Extraction techniques that avoid the disruption of the host tissue and instead soak the seed tissue overnight to release endophytes [9], or solely investigating the epiphytic seed community [10], have been developed to circumvent the issue of host DNA contamination. It is unclear whether these techniques can capture intracellular endophytes and those within the seed embryo [11]. Therefore, using the entire seed sample would increase the chances of capturing microbes associated with the embryo. Consequently, DNA extraction methods that involve the entire seed tissue are preferred.
The use of peptide nucleic acid (PNA) clamps is one approach used to reduce host plant sequence recovery. PNA clamps are short oligonucleotide chains that bind to host targets and can be used to supress host plastid and mitochondrial amplification [12]. PNA is a synthetic DNA mimic in which the DNA deoxyribose phosphodiester backbone is replaced with a synthetic peptide-like backbone of N-(2-amino-ethyl) glycine (AEG). This backbone results in a more thermally stable bond between the PNA and DNA, resulting in higher biding affinity and specificity than using DNA-based blocking oligonucleotides [13]. The clamps bind within the DNA sequence targeted for amplification and can either block amplicon elongation or primer annealing, and as a result reduce the amplification of the host DNA [14]. PNA clamps have been designed to work for the blocking of many regions, including the V4 region of the 16S rRNA gene, with clamps designed by Lundberg, Yourstone, Mieczkowski, Jones, and Dangl [14] using root and leaf tissues from Arabidopsis thaliana. Fitzpatrick et al. [15] identified that these clamps were only suitable for a few plant species from limited plant families. These findings were based solely on the testing of root tissue samples, and as such, there is limited understanding of the utility of these clamps for seed microbiomes.
The co-amplification of plant DNA has been shown to be more problematic within plant green tissue such as leaves [16], and it is unknown as to whether PNA clamping will be necessary for mature seeds that have a much lower chloroplast content relative to leaves. Studies demonstrate that mitochondrial content can vary between different tissues of a plant [17], with mitochondria in dry seeds existing as promitochondria [18]. The efficacy of PNA clamps is also sensitive to endophytic colonisation load, with chloroplast and mitochondrial clamps only effective when endophyte colonisation load is high [19], whilst other studies have only found clamps to be effective where there is a high plant to microbial DNA ratio [20]. Considering that microbial diversity and colonisation load have been identified as being lower in seed tissue, relative to other plant compartments [21], PNA clamps may not be as effective. The co-amplification of host organelles is less of an issue for seed fungi as the universal primers utilised exhibit higher specificity towards microbial DNA, rendering PNA clamps unnecessary [22]. Some bacterial 16S rRNA gene PCR primers have been designed to exclude the plastid sequences in plants (e.g., 799F/1193R) [23,24]; however, there are currently no primers that can avoid plant mitochondrial sequences [13]. Though PNA clamps are starting to be used in studies of seed microbiomes [25,26], their efficacy has not been tested across multiple plant species, especially with non-crop plants.
Changes in the composition of seed microbial communities or the relative abundance of certain taxa across different treatments is of interest in seed studies. Therefore, having reliable taxonomic identification and abundance measurements is of importance. The addition of PNA clamps has been identified as a potential way that taxonomic biases can be introduced into a dataset; this may be due to off-target binding [4] or interference with PCR efficiency [27]. Changes in the community composition as a result of PCR-blocking oligonucleotides has been observed within studies of arthropods [28], but no effect on composition has been observed within many other systems such as corals [29], and importantly, within plant root microbiomes [4,15,20]. It is currently unknown as to whether the use of PNA clamps affects the community composition of seed microbiota.
Research investigating seed microbes within natural ecosystems is in its infancy [30]. The aim of this study was to develop methodology to accurately capture the diverse seed microbiome to provide more robust and accurate estimates through increasing microbial read depth in the metabarcoding of seed endophyte communities. Here we assess whether the use of universal PNA clamps (designed to work with multiple plant species) improves microbial read number from field collected seeds and assess whether the use of PNA clamps affects diversity and composition estimates. This study demonstrates that the PNA clamp use requires some optimisation for each plant species but highlights that once optimised, the use of PNA clamps results in more comprehensive seed microbiome diversity datasets. This increased knowledge about the diversity of microbial species that exist within seeds will result in a better understanding about their role in host plants.
2. Materials and Methods
2.1. Plant Species
Seeds from Melaleuca quinquenervia (Cav.) S.T.Blake (Myrtaceae), Microlaena stipoides (Labill.) R.Br. (Poaceae, subfamily Oryzoideae), and Themeda triandra Forssk. (Poaceae, subfamily Panicoideae) were used in the experiments. Melaleuca quinquenervia is a large tree that produces seed within woody capsules. Each capsule contains around 250–300 very small seeds [31,32], with about 34,000 weighing approximately 1 g, each seed being approximately 1 mm long. Microlaena stipoides is a C3 perennial grass that produces drooping stalks of spikelets. The naked caryopses (grains) are similar in shape to rice grains but smaller, approximately 5 mm long with a mass that varies widely from 1 mg to 7 mg [33]. Themeda triandra is a C4 perennial grass that occurs naturally in Africa, Asia, and Australia. The spikelets are clustered with several sterile spikelets surrounding a single fertile spikelet. Each seed weighs approximately 10 mg and has a single hydroscopic awn [34].
2.2. Initial Peptide-Nucleic Acid (PNA) Clamp Function Tests
PNA clamp verification was performed using a stepwise approach following the methodology of Taerum, Steven, Gage, and Triplett [4]. The specificity of the chloroplast PNA (pPNA) clamps was assessed using an in silico analysis of PNA clamp binding sites within the 16S rRNA gene V4 region of the host plastomes. Mitochondrial sequences were not publicly available for the host species of interest. The chloroplast genomes of M. leucadendra (accession MT700493), the closest relative to M. quinquenervia in the database, M. stipoides (accession GU592211), and T. triandra (accession MT505020) were downloaded from the National Centre for Biotechnology Information (NCBI) database and the binding of the pPNA clamp sequence 5′-GGCTCAACCCTGGACAG-3′ [14] on the 16S rRNA gene V4 region of the host chloroplast was tested using the ‘map to reference tool’ in Geneious Prime 2023.2.1. This PNA clamp was designed by Lundberg, Yourstone, Mieczkowski, Jones, and Dangl [14], using root tissue from multiple plant species, whilst its efficacy was only tested using A. thaliana tissue.
A reduction in host plant DNA amplification as a result of the addition of the PNA clamps was tested for using relatively pure DNA extracted from an axenic tissue culture of Actinotus helianthii (Apiaceae) obtained from Amanda Rollason at the Australian Botanic Gardens, Mount Annan, Australia. Axenic tissue culture of the host species of interest was not available at the time of this study, as grasses have been identified as being recalcitrant to cell culture techniques [35], and tissue cultures of M. quinquenervia are not currently developed for ex situ conservation of this species. Actinotus helianthii belongs to a plant family that had previously been shown to have high levels of plastid contamination [15]. Additional DNA samples were constructed where DNA extracted from pure-cultured seed-associated bacterial strain Pseudomonas rhodesiae AW424 was mixed with the axenic tissue culture plant DNA in two ratios. Firstly, in equal amounts of plant DNA to bacterial DNA (T3) and secondly, with 80 percent plant DNA combined with 20 percent bacterial DNA (T4) to determine whether increasing bacterial DNA in the sample (as a proxy for increased endophytic load) affected the host DNA suppression.
A Macherey NagelTM Nucleomag Plant DNA Extraction kit was used for the DNA extraction of the Actinotus helianthii (Apiaceae) axenic tissue culture samples within a laminar flow, as per the manufacturer’s instructions. PCR amplification of the V4 region of the 16S rRNA gene using primers 515f 5′-GTGYCAGCMGCCGCGGTAA-3′ [36] and 806r 5′-GGACTACNVGGGTWTCTAAT-3′ [37] with and without clamps was tested. Two different clamp concentrations (0.25 μM and 1 μM) (T1 and T2, respectively) were tested based on the concentration suggested by the clamp supplier, and that used in [15], respectively. We wanted to assess whether there was any additional benefit to using the clamps at the higher concentration, as it had been observed that a higher concentration than recommended by the supplier had been used in the literature. Three replicates were tested per treatment. Chloroplast and mitochondrial PNA clamps (pPNA and mPNA clamps, respectively), pPNA 5′-GGCTCAACCCTGGACAG-3′ [14] and mPNA 5′-GGCAAGTGTTCTTCGGA-3′ [14], were purchased from PNA Bio (CA, USA). Each PCR contained 12.5 μL of MyTaq HS polymerase Mix (Bioline, Meridian Bioscience, France), 2 μL of DNA template (2–5 ng/μL), 0.4 μM of each primer, 1 μM or 0.25 μM each of pPNA and mPNA clamps, and molecular grade nuclease-free water to 25 μL. PCR conditions were 1 cycle × 95 °C for 3 min; 35 cycles × 95 °C for 15 s, 55 °C for 30 s, and 72 °C for 30 s for extension; and 1 cycle × 72 °C for 7 min for the final extension [15]. For reactions where the clamp was added, an additional annealing step of 75 °C for 10 s after the initial annealing step was added to allow for the binding of the PNA clamps to the host DNA. DNA extraction and PCR negative controls (number of replicates (n) = 6) were also amplified whereby for the latter, the sample template was replaced with molecular grade water to identify contaminants introduced during the PCR. A fluorometric quantification of the resultant PCR product (Qubit 3.0 fluorometer using the 1X DS DNA HS Assay kit (Invitrogen, Carlsbad, CA, USA)) was used to determine whether there was a reduction in the amplification of plant DNA when PNA clamps were added. A one-way analysis of variance (ANOVA) in JMP v17.2.0 was used to test for differences in PCR product concentration as a result of clamp or bacterial addition. Post hoc Tukey’s HSD tests were performed to test between treatment combinations.
2.3. PNA Clamp Metabarcoding
A metabarcoding run was performed to test the impact of PNA clamps on the diversity and composition of the seed microbiome of the three hosts, and the magnitude of host plant DNA amplification reduction when the clamps were added. Seed samples were collected from multiple plants from 24 sites along the east coast of New South Wales, Australia (Table S1). A total of 40 seed samples (M. quinquenervia = 10, M. stipoides = 11, T. triandra = 19 samples) were collected. At each site, healthy plants (no visible disease symptoms) were selected arbitrarily for seed collection, with each plant being greater than a 5 m distance from each other to retain spatial independence. Seeds from three mature infructescences/spikelets were collected per individual. Seeds were stored at 4 °C on the day of collection and then stored at −80 °C until processing (Table S1).
Seeds were surface sterilised by serial immersion under agitation in a bench top tube rotator (VWR, #10136-084) in 0.5% household bleach (4% w/v) solution for 2 min followed by rinsing with sterile de-ionised water twice, followed by immersion in 70% ethanol for 2 min, followed by rinsing in sterile de-ionised water twice [38]. The efficacy of the surface sterilisation method was verified using the protocol of [30]. Surface-sterilised seeds were lyophilised, and ground under liquid nitrogen until powdered in a sterile mortar and pestle. Each sample comprised 50 mg of lyophilised seed from one maternal plant. DNA was extracted from each sample using the Macherey NagelTM Nucleomag Plant DNA Extraction kit as per the manufacturer’s instructions. Sample-free negative controls (n = 3) were also included to identify contaminants introduced during DNA extraction. DNA yield (ng of DNA per μL of sample) was assessed by quantification on the Qubit 3.0 fluorometer using the 1X DS DNA HS Assay kit (Invitrogen, Carlsbad, CA, USA), and DNA quality was assessed using 260/280 and 260/230 ratios attained via spectrophotometry on the NanoDrop One instrument (ThermoFisher, Waltham, MA, USA).
Two separate 16S rRNA gene V4 region Illumina MiSeq libraries were prepared for each sample from the same DNA aliquot, one with the PNA clamps added and one without. A two-round amplification process was used to amplify the DNA samples. For the first-round, extracted DNA and negative controls were amplified by PCR in triplicate using bacterial primers with Illumina Nextera adapters (underlined) designed at the Walter and Eliza Hall Institute (WEHI) targeting ~ 291 bp of the V4 region of the 16S rRNA gene: 515f 5′-GTGACCTATGAACTCAGGAGTCGTGYCAGCMGCCGCGGTAA-3′ [36] and 806r 5′-CTGAGACTTGCACATCGCAGCGGACTACNVGGGTWTCTAAT-3′ [37]. This primer pair and region was selected as when compared to three other pairs targeting hypervariable regions of the 16S rRNA gene frequently used in microbiome studies, the pair provided greater depth and taxa coverage at both the phylum and genus level [39]. Each PCR contained 12.5 μL of MyTaq HS polymerase Mix (Bioline, Meridian Bioscience, France), 2 μL of DNA template (2–5 ng/μL), 0.4 μM of each primer, 1 μM each of pPNA 5′-GGCTCAACCCTGGACAG-3′ and mPNA 5′-GGCAAGTGTTCTTCGGA-3′ clamps, and molecular grade nuclease-free water to 25 μL. PCR conditions were 1 cycle × 95 °C for 3 min; 18 cycles × 95 °C for 15 s, 55 °C for 30 s, and 72 °C for 30 s; and 1 cycle × 72 °C for 7 min. For libraries where the clamp was added, an additional annealing step of 75 °C for 10 s was added. PCR negative controls (n = 3) were also amplified whereby the sample template was replaced with molecular grade water to identify contaminants introduced during the PCR. The triplicate PCR products from each sample were then pooled.
PCR products were purified by size selection using Ampure XP magnetic beads (Agencourt, Becker Coulter, Australia), as per the manufacturer’s instructions. A subsample of each PCR product was run on a 1% electrophoresis gel to check amplicon size. A total of 10 μL of the first-round PCR product was used in the second-round PCR, combined with 10 μL of MyTaq HS polymerase Mix (Bioline, Meridian Bioscience, France), and 0.25 μM of each forward and reverse custom barcode designed by the WEHI. PCR conditions were 1 cycle × 95 °C for 3 min; 24 cycles × 95 °C for 15 s, 60 °C for 30 s, and 72 °C for 30 s; and 1 cycle × 72 °C for 7 min. Sequencing libraries were created by pooling 5 μL from each reaction and performing a final bead clean up as performed previously. Each library was checked for quality and quantity to guide pool normalisation (2200 TapeStation), then sequenced on a single Illumina MiSeq run using v3 (2 × 300 bp) chemistry at the WEHI, Melbourne, Australia.
2.4. Metabarcoding Data Processing
De-multiplexed paired-end reads were processed using the Quantitative Insights Into Microbial Ecology QIIME2 [40] pipeline version 2021.8. Cutadapt [41] was used to remove primers, using an error rate of 0.20. DADA2 [42] was used to merge trimmed forward and reverse reads, denoise and remove poor-quality reads (mean Qscore < 30), perform dereplication, and eliminate chimeras. Reads sharing 100% sequence similarity were assigned to amplicon sequence variants (ASVs). Taxonomy for each ASV was assigned against the SILVA SSU database (version 138) [43] trained with a naïve Bayes classifier against the same V4 region targeted for sequencing [44]. Rarefaction curves were visualised using the diversity alpha-rarefaction function in QIIME2 [40] pipeline version 2021.8. Curves were constructed to a maximum depth of 22,000 reads for each of the clamped and non-clamped datasets.
All data were analysed in R v4.2.3 [45] and statistical significance was determined at α = 0.05. Potential contaminant ASVs were identified and removed from the dataset according to their abundance in the extraction (n = 3) and PCR negative controls (n = 3) relative to the seed samples using the prevalence method in the R package ‘decontam’ [46], with p = 0.1.
The proportion of reads that were plant host chloroplast and mitochondria was calculated manually using the taxonomy label annotations from the SILVA SSU database (version 138) and the ASV abundance matrices. For subsequent analyses testing for changes in the bacterial diversity and composition as a result of the PNA clamps, reads assigned as either plant chloroplast or mitochondria were filtered out of the dataset. To assess whether higher microbial diversity was gained through the addition of the PNA clamps, and whether this differed between the host species, alpha-diversity measures (observed richness, Simpson’s 1-D index, and Shannon’s diversity) were calculated using the R package ‘microbiome’ [47] using the estimate-richness function. These diversity measures were compared using a two-way ANOVA and post hoc pairwise comparisons using Tukey’s HSD implemented using the function emmeans in the package ‘nlme’. Confirmation that the diversity measures followed a normal distribution was undertaken through the visualisation of quantile plots and the Shapiro–Wilks test for normality using the shapiro.test function. The diversity measures were also shown to support the assumption of homogeneity of dispersion amongst groups using the betadisper function in ‘vegan’ [48].
Bray–Curtis dissimilarities were calculated amongst samples from Hellinger transformed abundance data. A two-way permutational analysis of variance (PERMANOVA) was used to assess the effect of host species and treatment (clamped or non-clamped) and their interaction, on bacterial community composition using the package ‘phyloseq’ [49] and the adonis2 function in the package ‘vegan’ [48]. Post hoc pairwise comparisons were undertaken using the function adonis.pair in the package ‘EcolUtils’ [50]. Bray–Curtis dissimilarities between clamped and non-clamped samples were visualised using a principal coordinates analysis (PCoA). An indicator species analysis was performed using the package ‘indicspecies’ [51] to identify bacterial species that benefitted from the addition of the clamps, as shown by a statistically significant association with the clamped dataset. The analysis was performed separately for each host species at a minimum positive predictive value (At) = 0.2, a minimum sensitivity (Bt) = 0.2, and alpha = 0.05.
3. Results
3.1. PNA Clamp Initial Verification
In silico analysis showed the universal chloroplast PNA clamp (pPNA) successfully mapped to the 16S rRNA gene V4 region of the chloroplast of each plant species. The pPNA mapped for all three hosts with 100% sequence similarity (Figure 1). The mPNA clamps were not able to be tested as mitochondrial 16S rRNA gene data were unavailable in public repositories for these species.
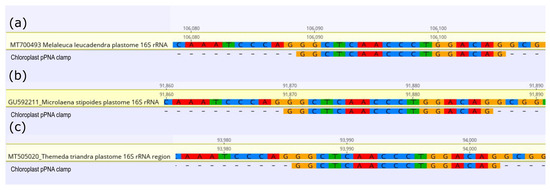
Figure 1.
Alignments of 16S ribosomal RNA gene fragments of (a) Melaleuca leucadendra, (b) Microlaena stipoides, and (c) Themeda triandra aligned with the universal chloroplast peptide nucleic acid (pPNA) clamp designed by Lundberg et al., 2013 [13].
Initial conventional PCR tests, using 16S rRNA gene universal primers on DNA extracted from axenic plant tissue culture in clamped and non-clamped reactions, showed that the addition of the PNA clamps resulted in a significant reduction in plant DNA amplification in subsequent PCRs (ANOVA F4,14 = 26.34, p < 0.05). Reactions without the clamps had PCR products with a total concentration of 19.4 ng/μL (± 1.23), with the addition of 0.25 μM of clamp this was reduced to 15.5 ng/μL (± 0.55) (T1, Figure 2). Increasing the clamp concentration from 0.25 μM to 1 μM (T2, Figure 2) did not significantly decrease plant DNA amplification (p > 0.05). In mixed templates where bacteria were added in two different ratios, the resultant PCR products had a similar concentration (p > 0.05) (T3 and T4, Figure 2).
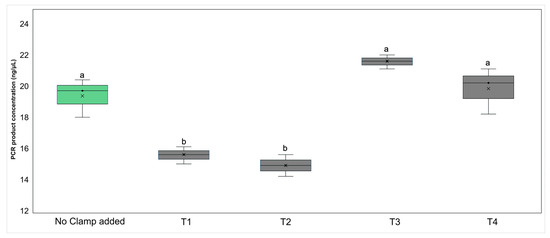
Figure 2.
Box and whisker plot showing the mean (×) number, interquartile range (box), and minimum and maximum number (whiskers) of the 16S rRNA gene V4 region PCR product concentration (ng/μL) of the control (no clamp added) and treatments (T1–T4). The PCR template was DNA extracted from axenic plant tissue culture with chloroplast and mitochondria-blocking peptide nucleic acid clamps added to the reaction in two concentrations: 0.25 μM (T1) or 1 μM (T2). Axenic plant DNA was also added to bacterial DNA in two ratios, 50:50 (T3) and 80:20 (T4), both with clamps added at a 1 μM concentration. Groups with different letters above the bars had different PCR product concentrations, as shown through post hoc Tukey’s HSD tests.
3.2. PNA Clamp Effects on Plant DNA Reads
Illumina metabarcoding sequencing of the V4 region of the 16S rRNA gene for 40 seed samples with and without PNA clamps, (including extraction and PCR controls) resulted in 3,812,667 raw reads (minimum 26; mean 38,511; and maximum 137,095 per sample). The read coverage per sample of the clamped and non-clamped datasets was similar prior to cleaning and host DNA removal steps (without clamps = 32,166 reads per sample and with clamps = 32,806 per sample). After merging, denoising, and chimera filtering, 2,968,610 reads remained (minimum 8; mean 29,985; and maximum 40,713 reads per sample).
A total of 495 bacterial ASVs were generated and assigned taxonomy. Ten ASVs were identified as extraction contaminants based on prevalence, with reads assigned to these ASVs comprising less than 1% of the dataset (Table S2). Twenty-seven ASVs were identified as PCR contaminants, with reads assigned to these ASVs comprising 15% of the dataset (Table S2). Many of the ASVs identified as PCR contaminants were identified as Ralstonia picketti, which has been previously identified as a common reagent contaminant [52,53], with this identified within all PCR control replicates in this study. All contaminant reads were removed from the dataset prior to further analyses.
The addition of the PNA clamps reduced the sequencing of host plant reads in seed samples, but the blocking effect differed between the three plant species. For M. quinquenervia, M. stipoides, and T. triandra, without clamps, plant reads (chloroplast and mitochondrial) comprised 99%, 95%, and 79% of the reads per sample, respectively. With the addition of PNA clamps, these values were reduced to 87%, 65%, and 24%, respectively.
The addition of PNA clamps significantly increased the average number of microbial sequences per sample (ANOVATreatment F1,59 = 22.9, p < 0.05), with this being significant for all species tested (no significant interaction term; ANOVATreatment*HostSpecies F2,59 = 4.72, p > 0.05) (Figure 3). Overall, Themeda triandra benefitted the most from the addition of the clamps, showing an average increase of 17,174 bacterial reads per sample when clamps were added. Microlaena stipoides had an average increase of 9073 reads per sample, whilst M. quinquenervia had an increase of 2735 reads per sample (Figure 3).
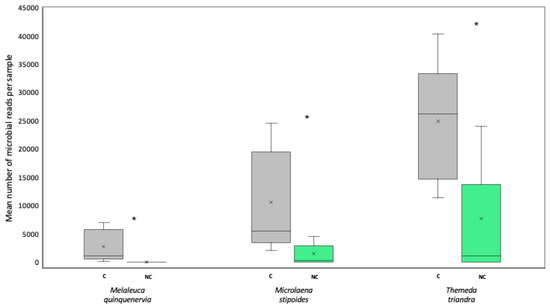
Figure 3.
Box and whisker plot showing the mean (×) number, interquartile range (box), and minimum and maximum number (whiskers) of microbial reads for seed samples of Melaleuca quinquenervia, Microlaena stipoides, and Themeda triandra sequenced with (grey) (C) or without (green) (NC) peptide nucleic acid clamps added to the metabarcoding library. Asterisks indicate significant differences between clamped and non-clamped datasets for each host at p < 0.05.
3.3. Most Abundant ASVs with and Without PNA Clamps Added to Metabarcoding Library
The addition of PNA clamps reduced the mean percentage of plant derived reads per sample from 89% to 52%, resulting in plant DNA still needing to be filtered out from both metabarcoding datasets. DNA contaminants were comprised of host plant 16S rRNA gene reads from both chloroplasts and mitochondria. We were able to identify that there were mitochondrial reads present, as these reads were identified as having high sequence similarity to 16S rRNA gene mitochondrial reads of related plant species. Without the clamps, plant host 16S rRNA gene chloroplast reads were the most abundant ASVs, followed by plant host 16S rRNA gene mitochondrial reads, comprising 1,356,704 reads assigned to five ASVs (Table 1). The addition of the clamps resulted in chloroplast reads no longer being the dominant contaminant, as mitochondrial reads now comprised the top two most abundant ASVs, comprising 553,726 reads. Chloroplast reads were still present, but in much lower abundance. Pantoea agglomerans and P. ananatis (Erwiniaceae) bacteria were the next most abundant ASVs in both datasets (Table 1).

Table 1.
Most abundant amplicon sequence variants (ASVs) identified from sample replicates sequenced (a) without peptide nucleic acid clamps or (b) with peptide nucleic acid clamps. Columns show the taxonomy for that amplicon sequence variant (ASV) assigned from the SILVA SSU database (version 138). Source column is the 16S rRNA gene region that amplified, PC = plant chloroplast, PM = plant mitochondria, and B = bacterial nuclear. No. of Reads column shows the number of reads that were assigned to that ASV.
We observed differences in the clamping effectiveness of the chloroplast clamps between the host species. For M. stipoides and T. triandra, reads assigned to ASVs identified as chloroplast were greatly reduced (507,898 reads in the non-clamped dataset, with this reduced by 484,299 reads in the clamped dataset). For M. quinquenervia, a much smaller reduction was observed, with chloroplast-assigned reads initially adding to 292,468 reads only being reduced by 60,269 reads with the addition of chloroplast clamps. Mitochondrial clamps reduced the number of reads assigned to ASVs identified as mitochondrial, but were less effective than the chloroplast clamps, reducing mitochondrial reads by approximately 10,000 reads for each of the hosts, resulting in mitochondrial reads being the main contaminant remaining in the clamped dataset (Table 1).
3.4. PNA Clamp Effects on Alpha Diversity Measures
The addition of PNA clamps resulted in a higher bacterial richness (observed richness) (ANOVATreatment F1,59 = 35.9, p < 0.05), with this being significant for all species tested (no significant interaction term; ANOVATreatment×HostSpecies F2,59 = 1.33, p > 0.05) (Figure 4a). Simpson’s diversity measures were also higher for all host species when PNA clamps were added (ANOVATreatment F1,59 = 12.3, p < 0.05; ANOVATreatment×HostSpecies F2,59 = 1.33, p > 0.05) (Figure 4b), whilst if Shannon’s diversity measure was considered, only M. quinquenervia showed a more diverse community with the addition of the clamps (ANOVA Treatment×HostSpecies F2,59 = 3.62, p < 0.05) (Figure 4c). For replicates that did not have clamps added, 27 of 40 had less than 1500 microbial reads, whilst adding clamps resulted in only three samples from 40 having less than 1500 reads. The construction of rarefaction curves of the microbial reads from clamped data resulted in sample curves approaching asymptotes for all but three samples, whilst replicates where the clamp was not added did not approach asymptotes for all samples (Figure S1).
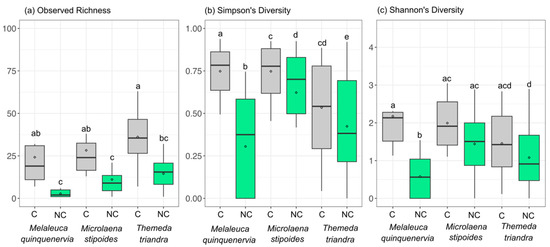
Figure 4.
Box and whisker plot showing the mean (◊), interquartile range (box), and minimum and maximum value (whiskers) of (a) observed richness, (b) Simpson’s diversity indices, and (c) Shannon’s diversity indices for samples sequenced with (C) (grey) or without (NC) (green) PNA clamps added to the Illumina metabarcoding library. Groups not sharing the same letter differ at p < 0.05 using post hoc Tukey’s HSD tests between all groups.
3.5. PNA Clamp Effects on Community Composition
A total of 132 bacterial ASVs were identified for the replicates without clamps added, with 53 of these not being identified in the clamped dataset, with these ASVs comprising less than 1% of the total reads of the non-clamped dataset (Table 2). An inspection of the identity of these ASVs revealed that they belonged to genera that were also identified from the clamped dataset, but were unique at the ASV level. From the clamped dataset, 363 ASVs were identified, with 284 of these being unique to the clamped dataset (Table 2). Seventy-nine ASVs were identified in both the clamped and the non-clamped datasets (shared ASVs), with these ASVs comprising the abundant ASVs within each dataset.
Table 2.
Shared and unique bacterial amplicon sequence variants (ASVs) between samples sequenced with and without peptide nucleic acid clamps in the clamped and non-clamped datasets. The percentage of reads that were unique to each dataset, and the percentage of reads that were shared were also calculated.
Despite a large proportion of the ASVs being retained when the PNA clamps were added, the additional read depth per sample gained by adding the clamps resulted in additional microbial ASVs being identified. Furthermore, the additional 284 bacterial ASVs identified through the addition of the clamps comprised only 14.39% of the reads from this dataset, and represented rare ASVs.
The addition of the clamps resulted in a significant difference in the composition of the bacterial community relative to the unclamped dataset (PERMANOVATreatment F1,75 = 2.0083, p < 0.05), with this result being observed for all the three host plant species (no significant interaction term; PERMANOVATreatment×HostSpecies F2,75 =1.18, p > 0.05). The principal coordinates analysis shows some similarity between the bacterial community from the clamped and non-clamped samples (samples where ellipses intersect), but additionally, samples from each group that are dissimilar from the rest (Figure 5).
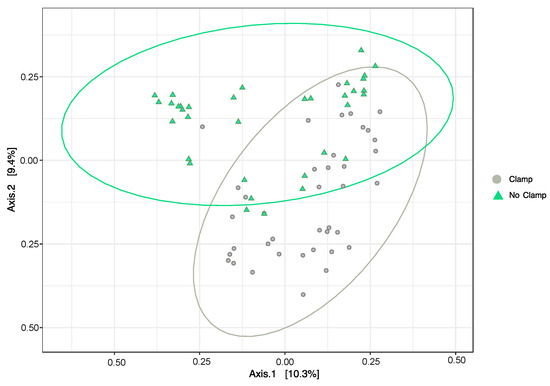
Figure 5.
Principal coordinates analysis (PCoA) using Bray–Curtis dissimilarity measures between the bacterial community composition of samples from Melaleuca quinquenervia, Microlaena stipoides, and Themeda triandra with PNA clamps added (grey circles) or without (green triangles). Ellipses show 95% confidence interval. Samples closer together have a more similar bacterial community.
For M. quinquenervia, the most abundant bacterial family differed between the clamped and non-clamped datasets, with Enterobacteriaceae and Sphingomonadaceae being dominant in the non-clamped and clamped datasets, respectively (Figure 6). For the two grasses, Erwiniaceae is the dominant family irrespective of whether clamps were added, and all of the families identified in the non-clamped dataset are retained when clamps are added, but when clamps are added for M. stipoides, an additional two, and for T. triandra, an additional seven, families are identified (Figure 6).
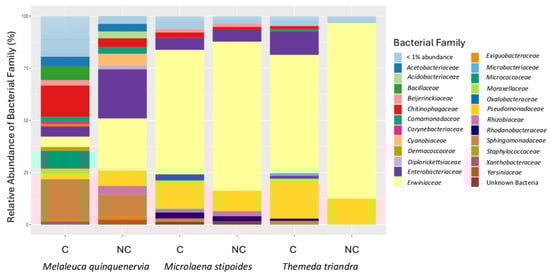
Figure 6.
Relative abundance (percentage of 16S rRNA gene sequences) of bacterial families identified from amplification of the V4 region of the 16S rRNA gene from DNA extracted from seeds of Melaleuca quinquenervia, Microlaena stipodies, and Themeda triandra, with (C) or without (NC) peptide nucleic acid clamps added to the Illumina metabarcoding library.
3.6. Bacterial Species Associated with the Clamped Dataset
A total of twelve ASVs were significantly associated with the clamped dataset across the three host plant species (Figure 7; Table S3). Despite 53 ASVs being unique to the non-clamped dataset, no ASVs were shown to have a significant association with the non-clamped dataset. For M. quinquenervia, eight ASVs saw a significant association with the clamped dataset (Figure 7; Table S3), six for M. stipoides and seven for T. triandra. Qipengyuania flava, Micrococcus aloeverae, and Bacillus pumilus were identified as ASVs that were significantly associated with the clamped dataset for all three host species. The Indicator Value [54]—a measure of the strength of the association of a species with a particular group—ranged from 0.577 to 0.750, with the highest value assigned to Bradyrhizobium sp. from M. stipoides. Three species assigned to the bacterial family Bacillaceae were associated with the clamped dataset, representing the highest number for one family.
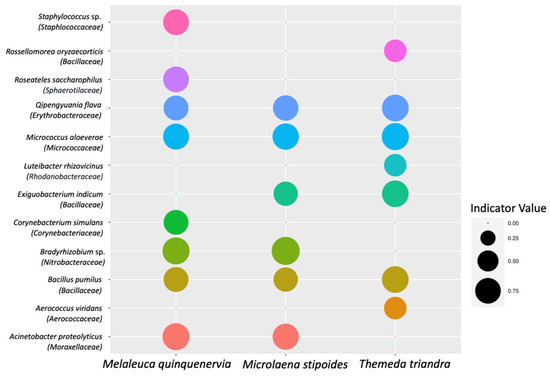
Figure 7.
Indicator Values for bacterial amplicon sequence variants (ASVs) that were identified as having a significant association with the clamped dataset (p < 0.05). Bubble sizes reflect the Indicator Value for that bacterial ASV from samples of either Melaleuca quinquenervia, Microlaena stipoides, or Themeda triandra. Indicator Values are between zero and one, with higher values indicating a stronger association with a host species.
4. Discussion
We investigated the efficacy of the universal PNA clamps designed by Lundberg, Yourstone, Mieczkowski, Jones, and Dangl [14] for seed microbiomes from three distantly related host species. We showed the chloroplast PNA clamps were effective in significantly reducing host chloroplast amplification, but the mitochondrial clamp was less effective for mitochondrial host reads. We saw little effect on bacterial community composition, with abundant ASVs being retained with the addition of the clamps, with the added microbial read depth allowing for the detection of rare ASVs within the seed microbiome. Our results demonstrate that universal PNA clamps can be an effective and broadly applicable tool for reducing host chloroplast contamination in seed microbiome studies, enabling deeper, more accurate characterisation of microbial diversity without distorting the underlying community structure.
4.1. Universal PNA Clamps Effectively Reduce Host Chloroplast, but Not Mitochondrial Reads
The universal pPNA clamp showed a 100% sequence similarity to M. stipoides and T. triandra, for the chloroplast 16S rRNA gene, and was a 100% match to M. leucadendra a closely related species of M. quinquenervia. PNA clamps are increasingly being used for seed microbiome studies but are used without optimisation and a 0.75 μM concentration is commonly used for each clamp [26,55,56]. Although the supplier recommends increasing clamp concentration to enhance host blocking, our initial tests found no significant reduction in plant DNA amplification with higher PNA levels. This suggests lower concentrations may be just as effective, though our method did not differentiate between chloroplast and mitochondrial DNA. One possible explanation for why increasing the PNA concentration did not increase host DNA suppression, is that a saturation point beyond which additional PNA offers no added benefit may have been reached, as has been suggested by [57]. Increasing PNA concentration too high also could increase the possibility of blocking amplification of the target region, through the formation of secondary structures inhibiting access for polymerases [28].
Results from the metabarcoding demonstrated that the addition of pPNA and mPNA clamps reduced the number of host chloroplast and mitochondrial reads, but both chloroplast and mitochondrial reads were still present in the clamped datasets when both clamps were added, each at 1 μM concentration. In particular, many reads from the host plant chloroplast and mitochondrial organelles still comprised the M. quinquenervia dataset (on average 87% of the reads per sample), with the best reduction of the amplification of host plant 16S rRNA gene reads within T. triandra (reduced to, on average, 24% of reads per sample). One possible explanation for the differences in the efficacy of the clamps between hosts is that the clamps did not match well to M. quinquenervia 16S rRNA gene host plant DNA relative to the grasses. Without chloroplast or mitochondrial 16S rRNA gene sequences publicly available for M. quinquenervia it was difficult to assess in silico PNA clamp mismatches with host DNA, and the reduced efficacy (99% of reads without clamps, only reduced to 84% of reads with the addition of clamps) of both clamps for M. quinquenervia seed may solely be due to mismatches in the clamp sequence to that of the host 16S rRNA gene. This could be remedied by designing clamps specific to M. quinquenervia, as has been utilised within other host-associated studies [4,15]. This presents a particular limitation for native plant species, as public repositories often lack sufficient single gene and whole genome data for these taxa. This underscores the need for increased organelle sequencing of native plants to expand the genomic resources available for effective PNA clamp design.
Once PNA clamps were added, chloroplast contamination was reduced, but mitochondrial 16S rRNA gene reads became dominant in all host species. This suggests the mPNA mitochondrial clamp may not have great efficacy in seeds. These results contrast with those of floral tissues where mitochondrial read contamination was very low (<5% of reads), and upon addition of the mPNA clamps, the mitochondrial DNA amplification was completely suppressed [58]. In seeds, mitochondria are abundant and play essential roles in germination and metabolic activity, potentially leading to higher mitochondrial DNA content and making it more challenging for PNA clamps to fully suppress amplification. In contrast, floral tissues may have lower mitochondrial DNA levels or more accessible target regions for clamp binding, improving mPNA efficacy. Mitochondria have two types; complex I is in higher amounts in green organs, and in contrast, complex II is represented by lower amounts in green organs, but is in higher amounts in non-green organs, especially seeds [59]. Research by Sakai and Ikenaga [60] tested the efficacy of PNA clamps designed for the roots of spinach and cucumber and demonstrated that the mitochondrial clamps were required at a much higher concentration (greater than 1 μM) for an effective suppression of mitochondrial gene amplification, whilst concentrations of 0.2 μM of the chloroplast clamps were sufficient for chloroplast amplification suppression. These findings suggest increasing the concentration of the mPNA clamps may improve the reduction of plant host reads from seed microbiome studies, given they are more similar to root than leaf tissue. Researchers should also consider the costs associated with PNA clamps and the observation in this study that the rarefaction curves approached an asymptote for most samples despite the mitochondrial reads present, which suggests the additional concentration may not influence observed diversity measures.
4.2. Addition of PNA Clamps Did Not Bias Bacterial Community Composition
Without PNA clamps, seed endophyte diversity estimates per sample did not approach the asymptote in rarefaction curve analyses, suggesting that the dataset was not adequate for providing robust estimates of diversity without the addition of clamps. Additionally, many of the samples that did not have the clamps added, once plant reads were removed, had less than 100 reads left, which would ordinarily be removed from a study. The addition of the clamps showed a significant increase in the observed richness (Figure 4a) and Simpson’s diversity (Figure 4b), for all host species. We showed that the addition of the clamps increased the number of bacterial ASVs identified from samples, with T. triandra demonstrating the largest rise in observed ASVs (richness) with the addition of the clamps. Much of the increased richness was due to increases in the number of rare ASVs identified, as for all hosts we saw increases in the number of ASVs with less than 1% abundance. Although PERMANOVA tests of the community composition between clamped and non-clamped samples showed that there was a significant difference in the composition of the bacterial communities between the two datasets, the abundant ASVs were retained, with shared ASVs (ASVs found in the non-clamped dataset which were also recovered in the clamped dataset) comprising 85% of the clamped dataset. We found that rare bacterial ASVs were significantly associated with the clamped dataset, supporting the idea that clamps increased read depth and revealed previously undetected rare ASVs being ‘missed’ when clamps were not added. There were three ASVs that for all host species were rare taxa only recovered when clamps were added. These were Micrococcus aloeverae, Qipengyuania flava, and Bacillus pumilus. These species have been identified as plant growth promoting bacteria, with M. aloeverae producing indole-3-acetic acid [61], Q. flava inhibiting soil pathogen growth [62], and B. pumilus promoting plant growth in stressful conditions [63].
4.3. Cost Comparison: Adding PNA Clamps Versus Increasing Read Depth per Sample
Increasing read depth (the number of sequencing reads) is one way to circumvent host DNA contamination, with PNA clamps providing an alternative way to increase read counts across samples. We provide two scenarios based on the findings from the plant species investigated within this study to consider the cost savings in using PNA clamps compared to increasing read depth. For most seed samples, when plant reads were removed, 10,000 reads were sufficient to capture the bacterial diversity, with most samples approaching the asymptote at this point (Figure S1). Increasingly, seed microbiome studies are looking at longitudinal [64,65,66] or often biogeographical patterns [67,68,69], and so a higher number of samples are required to answer these questions.
In a hypothetical scenario of a study with 200 samples, presently, high throughput sequencing utilising the MiSeq Illumina platform with a V3 flow cell would cost about AUD 3400 per run, excluding sample preparation, and returns approximately 25 million reads with an average read retention of 85% after quality control for a total of 21,250,000 reads per run. If 10,000 reads are required to assess the bacterial microbiome of each sample, and 99% of the post-quality control reads are lost to host DNA contamination (as in M. quinquenervia), the required read depth is 1,000,000 reads per sample. This sample study would only be able to include 21 samples per sequencing run to achieve appropriate read coverage per sample, requiring nine and a half MiSeq sequencing runs, which would cost, at a minimum, AUD 30,400. In contrast, PNA clamps used at the concentration utilised in this study cost around AUD 0.48 per sample and, on average, decreased host contamination from 99% to 87%. For the same 200 samples, adding the PNA clamps would cost AUD 96, but the required sequencing would be able to fit into one MiSeq sequencing run, as the samples would only require a raw read depth of 76,923 reads each. In this scenario, using PNA clamps saves at least AUD 20,000.
Although M. quinquenervia represented a case of severe host DNA contamination, T. triandra exhibited comparatively low initial contamination (79%), with PNA clamps effectively reducing it further to 24%. Using the same premise as above, samples with the clamps added would only require a raw read depth of 13,157 reads per sample, meaning again that all 200 samples could fit one MiSeq sequencing run. In fact, further samples could be added to the run and the sequencing depth would still be adequate. Overall, employing PNA clamps will usually be much less expensive than additional read depth per well and will allow seed microbiome researchers to maintain higher sample sizes with necessary microbial sequence coverage.
4.4. Proposed Decision Matrix for PNA Clamp Workflow and Verification
Determining that the chosen PNA clamp is appropriate for the study or optimising a universal clamp to suit the plant species of choice is frequently prohibitively labour intensive and the verification and validation steps undertaken for PNA clamps vary between studies and between study systems. Here, we present a decision flowchart which could be used to decide whether clamps are necessary for seeds of a particular plant species (Figure 8). Pathways depend on whether reference sequences are available for the plant host species of interest, or whether universal primers show via in silico analyses, using tools like Primer-BLAST [70] or MFEprimer [71], that the clamps should work. We refer to relevant studies for designing PNA clamps if pre-existing PNA clamps are unsuitable for seeds of the plant species of interest and highlight that ascertaining the effective clamp concentration for each host species is an important step prior to bioinformatic filtering and downstream analyses.
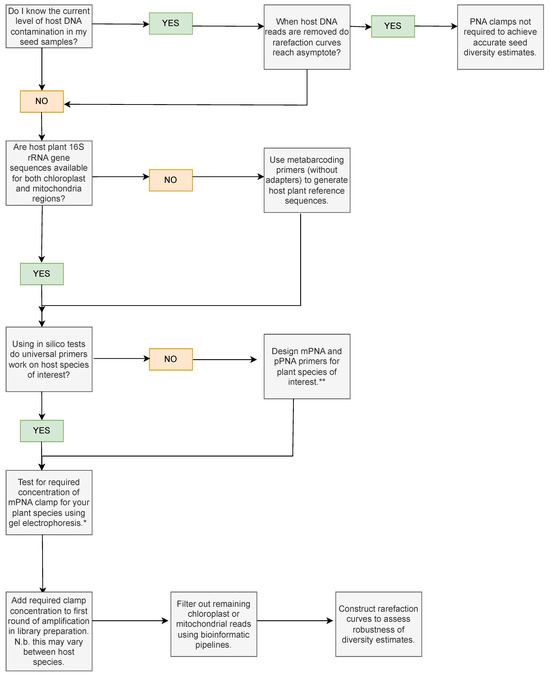
Figure 8.
Decision flowchart showing key considerations and experiments that can be used to assess whether PNA clamps are needed for the study species of interest. * Ref. [60] provides an electrophoresis methodology to test mPNA clamp concentrations. ** Ref. [13] provides a protocol to design PNA clamps for the 16S rRNA gene region.
5. Conclusions
Studying seed microbiomes presents specific methodological challenges, particularly due to high levels of host DNA contamination. Our results show that incorporating PNA clamps into PCR protocols significantly reduced the amplification of host DNA, thereby improving the detection of rare bacterial taxa. However, we also observed variation in the effectiveness of PNA clamps across the three native Australian plant species examined. This suggests that optimisation (particularly of mitochondrial clamp concentrations) may be necessary for certain taxa. To support a broader application of this approach, we developed a cost–benefit analysis highlighting the economic advantages of PNA clamp use and provided a practical decision matrix and workflow to assist researchers, especially those new to seed microbiome studies. Collectively, these contributions facilitate a more accurate and cost-effective characterisation of bacterial communities in native plant seeds.
Supplementary Materials
The following supporting information can be downloaded at https://www.mdpi.com/article/10.3390/seeds4030028/s1: Figure S1: Rarefaction curves of clamped and non-clamped datasets; Table S1: Seed sample collection location details; Table S2: Summary of contaminant taxa from metabarcoding library; Table S3: Indicator species analysis significance values summary.
Author Contributions
Conceptualization, A.A.M., M.M.v.d.M., E.C.Y.L., D.R.B. and L.L.B.; methodology, A.A.M., E.C.Y.L. and M.M.v.d.M.; formal analysis, A.A.M.; writing—original draft preparation, A.A.M.; writing—review and editing, A.A.M., L.L.B., D.R.B., E.C.Y.L. and M.M.v.d.M.; funding acquisition, M.M.v.d.M., E.C.Y.L. and A.A.M. All authors have read and agreed to the published version of the manuscript.
Funding
This research was funded by an Australian Research Training Scholarship from the Australian Government to A.A.M as part of her Doctor of Philosophy at the University of Melbourne, Australia. D.R.B. was supported by a Symbiosis in Aquatic Systems grant from the Gordon and Betty Moore Foundation (Grant 9351).
Institutional Review Board Statement
Not applicable.
Informed Consent Statement
Not applicable.
Data Availability Statement
The original data presented in the study are openly available in the National Centre for Biotechnology Information (NCBI) Sequence Read Archive.
Acknowledgments
We would like to thank Patricia Lu-Irving and Ashley Shade for their guidance on using PNA clamps.
Conflicts of Interest
The authors declare no conflicts of interest. The funders had no role in the design of the study; in the collection, analyses, or interpretation of data; in the writing of the manuscript; or in the decision to publish the results.
Abbreviations
The following abbreviations are used in this manuscript:
| PCR | Polymerase chain reaction |
| PNA | Peptide nucleic acid clamps |
| ASV | Amplicon sequence variant |
| mPNA | Mitochondrial peptide nucleic acid clamp |
| pPNA | Chloroplast nucleic acid clamp |
| WEHI | Walter and Eliza Hall Institute |
References
- Ridout, M.E.; Schroeder, K.L.; Hunter, S.S.; Styer, J.; Newcombe, G. Priority effects of wheat seed endophytes on a rhizosphere symbiosis. Symbiosis 2019, 78, 19–31. [Google Scholar] [CrossRef]
- War, A.F.; Bashir, I.; Reshi, Z.A.; Kardol, P.; Rashid, I. Insights into the seed microbiome and its ecological significance in plant life. Microbiol. Res. 2023, 269, 127318. [Google Scholar] [CrossRef] [PubMed]
- Gerna, D.; Clara, D.; Allwardt, D.; Mitter, B.; Roach, T. Tailored media are key to unlocking the diversity of endophytic bacteria in distinct compartments of germinating seeds. Microbiol. Spectr. 2022, 10, e00172-22. [Google Scholar] [CrossRef] [PubMed]
- Taerum, S.J.; Steven, B.; Gage, D.J.; Triplett, L.R. Validation of a PNA clamping method for reducing host DNA amplification and increasing eukaryotic diversity in rhizosphere microbiome studies. Phytobiomes J. 2020, 4, 291–302. [Google Scholar] [CrossRef]
- Qi, Z.; Zhou, X.; Tian, L.; Zhang, H.; Lei, Y.; Tang, F. Assessment of wheat grain quality in China during harvest and storage using a mycobiome approach. Food Secur. 2024, 16, 1619–1632. [Google Scholar] [CrossRef]
- Nanfack, A.D.; Nguefack, J.; Musonerimana, S.; La China, S.; Giovanardi, D.; Stefani, E. Exploiting the microbiome associated with normal and abnormal sprouting rice (Oryza sativa L.) seed phenotypes through a metabarcoding approach. Microbiol. Res. 2024, 279, 127546. [Google Scholar] [CrossRef]
- Acuña, J.J.; Hu, J.; Inostroza, N.G.; Valenzuela, T.; Perez, P.; Epstein, S.; Sessitsch, A.; Zhang, Q.; Jorquera, M.A. Endophytic bacterial communities in ungerminated and germinated seeds of commercial vegetables. Sci. Rep. 2023, 13, 19829. [Google Scholar] [CrossRef]
- Kurm, V.; Geisen, S.; Gera Hol, W.H. A low proportion of rare bacterial taxa responds to abiotic changes compared with dominant taxa. Environ. Microbiol. 2019, 21, 750–758. [Google Scholar] [CrossRef]
- Bintarti, A.; Sulesky-Grieb, A.; Stopnisek, N.; Shade, A. Endophytic microbiome variation among single plant seeds. Phytobiomes J. 2022, 6, 45–55. [Google Scholar] [CrossRef]
- Russell, D.; Rajabal, V.; Alfonzetti, M.; van der Merwe, M.M.; Gallagher, R.V.; Tetu, S.G. Seed banking impacts native Acacia ulicifolia seed microbiome composition and function. Environ. Microbiome 2025, 20, 4. [Google Scholar] [CrossRef]
- Thomas, P.; Rajendran, T.P.; Franco, C.M. Cytobacts: Abundant and diverse vertically seed-transmitted cultivation-recalcitrant intracellular bacteria ubiquitous to vascular plants. Front. Microbiol. 2022, 13, 806222. [Google Scholar] [CrossRef] [PubMed]
- Nielsen, P.E.; Egholm, M. An introduction to peptide nucleic acid. Curr. Issues Mol. Biol. 1999, 1, 89–104. [Google Scholar] [PubMed]
- Kawasaki, A.; Ryan, P. Peptide Nucleic Acid (PNA) Clamps to Reduce Co-amplification of Plant DNA During PCR Amplification of 16S rRNA Genes from Endophytic Bacteria. Plant Microbiome Methods Protoc. 2021, 2232, 123–134. [Google Scholar]
- Lundberg, D.S.; Yourstone, S.; Mieczkowski, P.; Jones, C.D.; Dangl, J.L. Practical innovations for high-throughput amplicon sequencing. Nat. Methods 2013, 10, 999–1002. [Google Scholar] [CrossRef]
- Fitzpatrick, C.R.; Lu-Irving, P.; Copeland, J.; Guttman, D.S.; Wang, P.W.; Baltrus, D.A.; Dlugosch, K.M.; Johnson, M.T. Chloroplast sequence variation and the efficacy of peptide nucleic acids for blocking host amplification in plant microbiome studies. Microbiome 2018, 6, 144. [Google Scholar] [CrossRef]
- De Souza, R.S.C.; Okura, V.K.; Armanhi, J.S.L.; Jorrín, B.; Lozano, N.; Da Silva, M.J.; González-Guerrero, M.; de Araújo, L.M.; Verza, N.C.; Bagheri, H.C. Unlocking the bacterial and fungal communities assemblages of sugarcane microbiome. Sci. Rep. 2016, 6, 28774. [Google Scholar] [CrossRef]
- Lee, C.P.; Eubel, H.; Solheim, C.; Millar, A.H. Mitochondrial proteome heterogeneity between tissues from the vegetative and reproductive stages of Arabidopsis thaliana development. J. Proteome Res. 2012, 11, 3326–3343. [Google Scholar] [CrossRef][Green Version]
- Czarna, M.; Kolodziejczak, M.; Janska, H. Mitochondrial proteome studies in seeds during germination. Proteomes 2016, 4, 19. [Google Scholar] [CrossRef]
- Moronta-Barrios, F.; Gionechetti, F.; Pallavicini, A.; Marys, E.; Venturi, V. Bacterial microbiota of rice roots: 16S-based taxonomic profiling of endophytic and rhizospheric diversity, endophytes isolation and simplified endophytic community. Microorganisms 2018, 6, 14. [Google Scholar] [CrossRef]
- Viotti, C.; Chalot, M.; Kennedy, P.G.; Maillard, F.; Santoni, S.; Blaudez, D.; Bertheau, C. Primer pairs, PCR conditions, and peptide nucleic acid clamps affect fungal diversity assessment from plant root tissues. Mycology 2024, 15, 255–271. [Google Scholar] [CrossRef]
- Abdelfattah, A.; Tack, A.J.; Lobato, C.; Wassermann, B.; Berg, G. From seed to seed: The role of microbial inheritance in the assembly of the plant microbiome. Trends Microbiol. 2023, 31, 346–355. [Google Scholar] [CrossRef] [PubMed]
- Borodušķe, A.; Ķibilds, J.; Fridmanis, D.; Gudrā, D.; Ustinova, M.; Seņkovs, M.; Nikolajeva, V. Does peptide-nucleic acid (PNA) clamping of host plant DNA benefit ITS1 amplicon-based characterization of the fungal endophyte community? Fungal Ecol. 2023, 61, 101181. [Google Scholar] [CrossRef]
- Chelius, M.; Triplett, E. The Diversity of Archaea and Bacteria in Association with the Roots of Zea mays L. Microb. Ecol. 2001, 41, 252–263. [Google Scholar]
- Beckers, B.; Op De Beeck, M.; Thijs, S.; Truyens, S.; Weyens, N.; Boerjan, W.; Vangronsveld, J. Performance of 16s rDNA primer pairs in the study of rhizosphere and endosphere bacterial microbiomes in metabarcoding studies. Front. Microbiol. 2016, 7, 650. [Google Scholar] [CrossRef]
- Jonkers, W.; Gundel, P.E.; Verma, S.K.; White, J.F. Seed microbiome research. Front. Microbiol. 2022, 13, 943329. [Google Scholar] [CrossRef]
- Wassermann, B.; Rybakova, D.; Adam, E.; Zachow, C.; Bernhard, M.; Müller, M.; Mancinelli, R.; Berg, G. Studying seed microbiomes. In The Plant Microbiome: Methods and Protocols; Springer: Cham, Switzerland, 2021; pp. 1–21. [Google Scholar]
- El-Fateh, M.; Chatterjee, A.; Zhao, X. A systematic review of peptide nucleic acids (PNAs) with antibacterial activities: Efficacy, potential and challenges. Int. J. Antimicrob. Agents 2024, 63, 107083. [Google Scholar] [CrossRef]
- Piñol, J.; Mir, G.; Gomez-Polo, P.; Agustí, N. Universal and blocking primer mismatches limit the use of high-throughput DNA sequencing for the quantitative metabarcoding of arthropods. Mol. Ecol. Resour. 2015, 15, 819–830. [Google Scholar] [CrossRef]
- Reigel, A.M.; Owens, S.M.; Hellberg, M.E. Reducing host DNA contamination in 16S rRNA gene surveys of anthozoan microbiomes using PNA clamps. Coral Reefs 2020, 39, 1817–1827. [Google Scholar] [CrossRef]
- Mertin, A.A.; Philpott, M.; Blackall, L.L.; French, K.; Liew, E.C.; Van Der Merwe, M.M. Integrating seed microbiome knowledge into restoration and ex situ conservation of native Australian plants. Aust. J. Bot. 2023, 71, 379–394. [Google Scholar] [CrossRef]
- Myers, R.L. Site susceptibility to invasion by the exotic tree Melaleuca quinquenervia in southern Florida. J. Appl. Ecol. 1983, 20, 645–658. [Google Scholar] [CrossRef]
- Rayachhetry, M.B.; Van, T.K.; Center, T.D. Regeneration potential of the canopy-held seeds of Melaleuca quinquenervia in south Florida. Int. J. Plant Sci. 1998, 159, 648–654. [Google Scholar] [CrossRef]
- Mitchell, M. Ecology of Microlaena stipoides in Grazing Systems. Ph.D. Thesis, Charles Sturt University, Bathurst, NSW, Australia, 2013. [Google Scholar]
- Mason, B.D. Directions for Best Management of Kangaroo Grass (Themeda triandra Forssk.) Re-Establishment in Southeastern Australian Native Grassland Remnants. Ph.D. Thesis, Victoria University, Melbourne, VIC, Australia, 2005. [Google Scholar]
- Vasil, I.K. Developing cell and tissue culture systems for the improvement of cereal and grass crops. J. Plant Physiol. 1987, 128, 193–218. [Google Scholar] [CrossRef]
- Parada, A.E.; Needham, D.M.; Fuhrman, J.A. Every base matters: Assessing small subunit rRNA primers for marine microbiomes with mock communities, time series and global field samples. Environ. Microbiol. 2016, 18, 1403–1414. [Google Scholar] [CrossRef] [PubMed]
- Apprill, A.; McNally, S.; Parsons, R.; Weber, L. Minor revision to V4 region SSU rRNA 806R gene primer greatly increases detection of SAR11 bacterioplankton. Aquat. Microb. Ecol. 2015, 75, 129–137. [Google Scholar] [CrossRef]
- Mertin, A.; Laurence, M.; van der Merwe, M.; French, K.; Liew, E. The culturable seed mycobiome of two Banksia species is dominated by latent saprotrophic and multi-trophic fungi. Fungal Biol. 2022, 126, 738–745. [Google Scholar] [CrossRef]
- Wasimuddin; Schlaeppi, K.; Ronchi, F.; Leib, S.L.; Erb, M.; Ramette, A. Evaluation of primer pairs for microbiome profiling from soils to humans within the One Health framework. Mol. Ecol. Resour. 2020, 20, 1558–1571. [Google Scholar] [CrossRef]
- Bolyen, E.; Rideout, J.R.; Dillon, M.R.; Bokulich, N.A.; Abnet, C.C.; Al-Ghalith, G.A.; Alexander, H.; Alm, E.J.; Arumugam, M.; Asnicar, F. Reproducible, interactive, scalable and extensible microbiome data science using QIIME 2. Nat. Biotechnol. 2019, 37, 852–857. [Google Scholar] [CrossRef]
- Martin, M. Cutadapt removes adapter sequences from high-throughput sequencing reads. EMBnet. J. 2011, 17, 10–12. [Google Scholar] [CrossRef]
- Callahan, B.J.; McMurdie, P.J.; Rosen, M.J.; Han, A.W.; Johnson, A.J.A.; Holmes, S.P. DADA2: High-resolution sample inference from Illumina amplicon data. Nat. Methods 2016, 13, 581–583. [Google Scholar] [CrossRef]
- Quast, C.; Pruesse, E.; Yilmaz, P.; Gerken, J.; Schweer, T.; Yarza, P.; Peplies, J.; Glöckner, F.O. The SILVA ribosomal RNA gene database project: Improved data processing and web-based tools. Nucleic Acids Res. 2012, 41, D590–D596. [Google Scholar] [CrossRef]
- Bokulich, N.A.; Subramanian, S.; Faith, J.J.; Gevers, D.; Gordon, J.I.; Knight, R.; Mills, D.A.; Caporaso, J.G. Quality-filtering vastly improves diversity estimates from Illumina amplicon sequencing. Nat. Methods 2012, 10, 57. [Google Scholar] [CrossRef] [PubMed]
- R Core Team. R: A Language and Environment for Statistical Computing; R Foundation for Statistical Computing: Vienna, Austria. Available online: https://www.R-project.org/ (accessed on 13 June 2025).
- Davis, N.M.; Proctor, D.M.; Holmes, S.P.; Relman, D.A.; Callahan, B.J. Simple statistical identification and removal of contaminant sequences in marker-gene and metagenomics data. Microbiome 2018, 6, 226. [Google Scholar] [CrossRef] [PubMed]
- Lahti, L.; Shetty, S. Tools for Microbiome Analysis in R, Microbiome Package Version 1.23. 2017. Available online: https://www.bioconductor.org/packages/release/bioc/html/microbiome.html (accessed on 13 June 2025).
- Oksanen, J.; Blanchet, F.G.; Kindt, R.; Legendre, P.; O’hara, R.; Simpson, G.L.; Solymos, P.; Stevens, M.H.H.; Wagner, H. Vegan: Community Ecology Package, R Package Version 1.17-2. 2010. Available online: https://CRAN.R-project.org/package=vegan (accessed on 13 June 2025).
- McMurdie, P.J.; Holmes, S. phyloseq: An R package for reproducible interactive analysis and graphics of microbiome census data. PLoS ONE 2013, 8, e61217. [Google Scholar] [CrossRef] [PubMed]
- Salazar, G. EcoUtils: Utilities for Communtiy Ecology Analysis, R Package Version 0.1. 2024. Available online: https://github.com/GuillemSalazar/EcolUtils (accessed on 13 June 2025).
- Cáceres, M.D.; Legendre, P. Associations between species and groups of sites: Indices and statistical inference. Ecology 2009, 90, 3566–3574. [Google Scholar] [CrossRef]
- Salter, S.J.; Cox, M.J.; Turek, E.M.; Calus, S.T.; Cookson, W.O.; Moffatt, M.F.; Turner, P.; Parkhill, J.; Loman, N.J.; Walker, A.W. Reagent and laboratory contamination can critically impact sequence-based microbiome analyses. BMC Biol. 2014, 12, 87. [Google Scholar] [CrossRef]
- Dyrhovden, R.; Rippin, M.; Øvrebø, K.K.; Nygaard, R.M.; Ulvestad, E.; Kommedal, Ø. Managing contamination and diverse bacterial loads in 16S rRNA deep sequencing of clinical samples: Implications of the law of small numbers. Mbio 2021, 12, 10.1128/mbio.00598-21. [Google Scholar] [CrossRef]
- Dufrêne, M.; Legendre, P. Species assemblages and indicator species: The need for a flexible asymmetrical approach. Ecol. Monogr. 1997, 67, 345–366. [Google Scholar] [CrossRef]
- Kim, H.; Jeon, J.; Lee, K.K.; Lee, Y.-H. Longitudinal transmission of bacterial and fungal communities from seed to seed in rice. Commun. Biol. 2022, 5, 772. [Google Scholar] [CrossRef]
- Kim, H.; Kim, C.; Lee, Y.-H. The single-seed microbiota reveals rare taxa-associated community robustness. Phytobiomes J. 2023, 7, 324–338. [Google Scholar] [CrossRef]
- Lefèvre, E.; Gardner, C.M.; Gunsch, C.K. A novel PCR-clamping assay reducing plant host DNA amplification significantly improves prokaryotic endo-microbiome community characterization. FEMS Microbiol. Ecol. 2020, 96, fiaa110. [Google Scholar] [CrossRef]
- Steven, B.; Huntley, R.B.; Zeng, Q. The influence of flower anatomy and apple cultivar on the apple flower phytobiome. Phytobiomes 2018, 2, 171–179. [Google Scholar] [CrossRef]
- Peters, K.; Nießen, M.; Peterhänsel, C.; Späth, B.; Hölzle, A.; Binder, S.; Marchfelder, A.; Braun, H.-P. Complex I–complex II ratio strongly differs in various organs of Arabidopsis thaliana. Plant Mol. Biol. 2012, 79, 273–284. [Google Scholar] [CrossRef] [PubMed]
- Sakai, M.; Ikenaga, M. Application of peptide nucleic acid (PNA)-PCR clamping technique to investigate the community structures of rhizobacteria associated with plant roots. J. Microbiol. Methods 2013, 92, 281–288. [Google Scholar] [CrossRef]
- Ahmad, E.; Sharma, S.K.; Sharma, P.K. Deciphering operation of tryptophan-independent pathway in high indole-3-acetic acid (IAA) producing Micrococcus aloeverae DCB-20. FEMS Microbiol. Lett. 2020, 367, fnaa190. [Google Scholar] [CrossRef] [PubMed]
- Liu, Y.; Pei, T.; Du, J.; Yao, Q.; Deng, M.-R.; Zhu, H. Comparative genomics reveals genetic diversity and metabolic potentials of the genus Qipengyuania and suggests fifteen novel species. Microbiol. Spectr. 2022, 10, e01264-01221. [Google Scholar] [CrossRef]
- Dobrzyński, J.; Jakubowska, Z.; Dybek, B. Potential of Bacillus pumilus to directly promote plant growth. Front. Microbiol. 2022, 13, 1069053. [Google Scholar] [CrossRef]
- Abdelfattah, A.; Wisniewski, M.; Schena, L.; Tack, A.J. Experimental evidence of microbial inheritance in plants and transmission routes from seed to phyllosphere and root. Environ. Microbiol. 2021, 23, 2199–2214. [Google Scholar] [CrossRef]
- Barret, M.; Briand, M.; Bonneau, S.; Préveaux, A.; Valière, S.; Bouchez, O.; Hunault, G.; Simoneau, P.; Jacques, M.-A. Emergence shapes the structure of the seed microbiota. Appl. Environ. Microbiol. 2015, 81, 1257–1266. [Google Scholar] [CrossRef]
- Johnston-Monje, D.; Gutiérrez, J.P.; Lopez-Lavalle, L.A.B. Seed-transmitted bacteria and fungi dominate juvenile plant microbiomes. Front. Microbiol. 2021, 12, 737616. [Google Scholar] [CrossRef]
- Zheng, Y.; Gong, X. Niche differentiation rather than biogeography shapes the diversity and composition of microbiome of Cycas panzhihuaensis. Microbiome 2019, 7, 152. [Google Scholar] [CrossRef]
- Fonseca-García, C.; Coleman-Derr, D.; Garrido, E.; Visel, A.; Tringe, S.G.; Partida-Martínez, L.P. The cacti microbiome: Interplay between habitat-filtering and host-specificity. Front. Microbiol. 2016, 7, 150. [Google Scholar] [CrossRef] [PubMed]
- Zhou, X.; Wang, J.-T.; Zhang, Z.-F.; Li, W.; Chen, W.; Cai, L. Microbiota in the rhizosphere and seed of rice from China, with reference to their transmission and biogeography. Front. Microbiol. 2020, 11, 995. [Google Scholar] [CrossRef] [PubMed]
- Ye, J.; Coulouris, G.; Zaretskaya, I.; Cutcutache, I.; Rozen, S.; Madden, T.L. Primer-BLAST: A tool to design target-specific primers for polymerase chain reaction. BMC Bioinform. 2012, 13, 134. [Google Scholar] [CrossRef] [PubMed]
- Qu, W.; Zhang, C. Selecting Specific PCR Primers with MFEprimer. In PCR Primer Design; Springer: Cham, Switzerland, 2015; pp. 201–213. [Google Scholar]


Disclaimer/Publisher’s Note: The statements, opinions and data contained in all publications are solely those of the individual author(s) and contributor(s) and not of MDPI and/or the editor(s). MDPI and/or the editor(s) disclaim responsibility for any injury to people or property resulting from any ideas, methods, instructions or products referred to in the content. |
© 2025 by the authors. Licensee MDPI, Basel, Switzerland. This article is an open access article distributed under the terms and conditions of the Creative Commons Attribution (CC BY) license (https://creativecommons.org/licenses/by/4.0/).