1. Introduction
For the production of steel constructions in the northern and Arctic regions, which are designed for high levels of cyclic loads with varying amplitudes, only high-quality heavy plate steel with enhanced requirements for low-temperature toughness and fracture toughness is used. Illustrative examples of structures subjected to variable forces are offshore fixed platforms in the energy sector, where primary cyclic loads are generated by marine currents, wind, waves, and, sometimes, ice floes, resulting in complex stress diagrams at various points of contact. As an example,
Figure 1 shows the wind direction frequency characteristics and hourly wind speed index (with an average speed of 9.6 m/s) near the Horns Rev2 offshore wind farm in the North Sea, close to the Danish shore. These graphs clearly demonstrate the nature and degree of asymmetry in the environmental impacts on offshore platform operation and, consequently, reasonable variability in the degree and direction of asymmetric cyclic loads.
Under such aggressive environmental conditions, the most stressed structural components may experience rapid failure due to internal defects or fatigue cracks forming in localized areas of high stress. Consequently, Annex F has been added to the latest revision of the offshore standard EN 10225-1:2019 [
1] to regulate the procedure for pre-qualification testing of heavy plate steel for fixed offshore structures operating in the northern and Arctic regions. The regulation includes evaluating the steel’s fracture toughness, for which CTOD (Crack Tip Opening Displacement) tests are conducted according to ISO 12135 [
2]. These tests measure the maximum opening of a pre-induced fatigue crack before the critical moment of its opening at temperatures ranging from −10 to −40 °C. These tests enable the determination of several crucial steel properties, including the critical crack tip opening δ (in mm), the J-integral, and the stress intensity coefficients Kc under plane strain and KIc of the first strain mode [
3,
4].
Figure 1.
Frequency characteristics of wind direction (
a) and hourly wind speed index (
b) [
5] near the Horns Rev2 offshore wind farm in the North Sea.
Figure 1.
Frequency characteristics of wind direction (
a) and hourly wind speed index (
b) [
5] near the Horns Rev2 offshore wind farm in the North Sea.
The experience of conducting and analyzing CTOD test results of steels produced through thermomechanical processing (TMCP) shows that in some cases, the interpretation of CTOD test results could be more complicated due to the need to examine the fracture surface of samples to identify the so-called “pop-in” effects on the strain curves. According to existing BS, ASTM, and ISO standards, such an occurrence can be deemed critical. At the same time, the fracture of the tested specimen shows the formation of transverse (secondary) splits in the direction of the plate’s thickness without significant crack propagation in the plane of the pre-induced fatigue crack. In the case of TMCP steels, the appearance of short-term spikes in the fracture diagrams, similar to a potential “pop-in” effect, does not always indicate a brittle fracture mechanism of the steel and may depend on extraneous factors [
6].
One such factor is related to the specifics of the formation of the microstructural state and crystallographic texture of the steel oriented along the deformation direction [
7,
8], especially during low-temperature thermomechanical processing of heavy plates of thickness groups below 25 mm, where the level of low-temperature deformation riveting is high. In the case of high purity of TMCP steel on non-metallic inclusions, the mechanism of separation may also be due to the anisotropy of critical tearing stresses in the plane of the plates and in the Z-direction [
9].
The objective of this article is to identify the type and nature of secondary separations in CTOD samples through macro-, micro-, and fractographic studies, as well as to evaluate the relationship between the fracture characteristics and the test results with the occurrence of potential “pop-in” effects on the fracture diagrams of low-carbon microalloyed heavy plate steel S460MLO for offshore applications produced through the thermomechanical control process.
2. Materials and Methods
Basic oxygen furnace (BOF) cast slabs with a thickness of 355 mm were used as the examined material. The chemical composition of the steels under investigation is provided in
Table 1. Two types of microalloying were employed: Nb-V-Ti and Nb-Ti. Slabs were rolled on a reversible hot rolling mill 4200 [
10] according to the technology of low-temperature, two-stage, thermomechanical rolling for a final plate thickness of 23 mm, with the end of deformation in the γ + α-region. The level of basic mechanical properties corresponds to heavy plates of quality grade S460MLO according to EN 10225-1:2019.
From the rolled plates, series of samples were selected for mechanical testing (
Figure 2a). Half of the samples underwent additional heat treatment, including controlled heating from a temperature of 400 °C at a rate of 55 °C/h to 580 ± 3 °C, holding for 60 min, and controlled cooling to 400 °C at a rate of 55 °C/h. These specified process parameters simulate the heat treatment of critical joints of structures after assembly or repair welding (PWHT).
Microstructural investigations and fractographic analysis of the structure and fracture zones were conducted using an optical microscope (OM) Carl Zeiss Axio Observer 7 MAT and a scanning electron microscope (SEM) Tescan MIRA3. For consistency of observations, the principal directions of the material were indicated: rolling direction (RD), which corresponds to the direction of plate rolling during production; normal direction (ND), which is perpendicular to the plate surface and represents the thickness direction; and transverse direction (TD), which extends along the width of the plate and is perpendicular to both RD and ND.
The investigated steels have a homogeneous ferritic–pearlitic microstructure with light bending (
Figure 2b) and elongated ferrite grains. The average conditional ferrite grain diameter in the surface layers is approximately 4.3 µm; in the quarter, it is 5.7 µm, and in the center, it is ~6 µm.
The average mechanical characteristics of the investigated steels in the initial state are as follows: yield strength R
eH: 514 MPa and 509 MPa; tensile strength R
m: 566 MPa and 545 MPa; and elongation A
200 = 25% and 22%, respectively, for Steel A and Steel B. The values of the impact energy KVT
−40 are in the range of 285–305 J (Steel A) and 138–292 J (Steel B). Ultrasonic testing in both cases showed S
3E
4 results according to the EN 10160 standard [
11]. After additional heat treatment for Steel A, the average values were as follows: R
eH = 504 MPa, R
m = 556 MPa, A
200 = 27%, and KVL
−40 = 211–307 J. For Steel B, R
eH = 489 MPa, R
m = 535 MPa, A
200 = 25%, and KVL
−40 = 111–128 J.
CTOD tests to determine the criteria of static fracture toughness were conducted on a universal testing system Zwick/Roell Z600 (ZwickRoell GmbH & Co. KG, Ulm, Germany) with freely moving outer rollers using single edge notch bending (SENB) specimens made of base metal with dimensions of 20 × 40 × 185 mm, in accordance with ISO 12135 (
Figure 3). The testing procedure included three key stages: sample preparation, fatigue pre-cracking, and monotonic fracture testing at sub-zero temperatures.
A sharp notch of 17–18 mm depth was machined into the samples, followed by the application of cyclic loading to grow a fatigue crack to the specified depth (
Figure 3a). The fatigue crack was grown by applying cyclic three-point bending loads with a load ratio of R ≈ 0.1, typically at a frequency of 40 Hz, until the crack reached a nominal depth ratio of a/W = 0.5, ensuring a total notch length within the range of a = 0.45–0.55 W. The fatigue loading was conducted with a load range of P
min = 1.8 kN to P
max = 18 kN. The total number of loading cycles varied between 30,000 and 40,000.
Final fracture testing was performed under displacement-control at a rate of 1.5 mm/min after thermal conditioning. Each specimen was cooled to the target temperature (−10, −20, −30, or −40 °C) in a cooled test chamber and held at that temperature for at least 60 min prior to loading. Temperature control was achieved using a thermocouple on the surface of the specimen and close to the notch.
The applied force and crack mouth opening displacement were recorded in real time using a clip gauge mounted across the notch. The loading system included support jigs and a central loading jig to ensure correct three-point bending conditions (
Figure 3b). The span between the supports was 160 mm, and the preload force was 0.5 kN.
where
The critical value of CTOD was determined using Formulas (1) and (2), taking into account the thickness (B) and height (W = 2B) of the specimen, the span of the testing machine (S), the size of the induced fatigue crack (ao), the distance from the measurement point of the notch opening above the specimen surface (z; a value of z = 0 was used), the yield strength at the testing temperature (σYS), the test temperature, the force (F), displacement (V), Young’s modulus (E), and Poisson’s ratio (ν).
3. Results
3.1. Discussion
The values of critical Crack Tip Opening Displacement (δ, mm) obtained after serial tests for the steels under investigation in the TMCP and TMCP + PWHT states are presented in
Table 2. Overall, the investigated steels demonstrated a sufficient level of fracture toughness across the entire temperature range of the tests. The crack opening value did not drop below 1.00 mm. Steel A exhibited approximately 10% higher overall relative fracture toughness than Steel B in the initial condition and approximately 30% higher when PWHT was applied. The application of the PWHT resulted in lower CTOD values and an increased probability of short-term shear and load reduction, characterized as a potential “pop-in” effect. (
Figure 4b). The nature of such shifts along the contour of the short-term stress drop (sharp jump transition) and the moment of appearance (close to the section of transition from elastic to plastic deformation) resemble the yield point in tensile stress–strain diagrams during tensile tests in the plane of the rolling direction.
Examining the fracture diagrams after CTOD tests for both Steel A and Steel B (
Figure 4), several typical zones can be identified. The initial zone, characterized by a linear relationship between displacement and applied force, corresponds to the stage of elastic deformation. The initial zone, characterized by a linear relationship between displacement and applied force, corresponds to the stage of elastic deformation. Then, the slope of the curve changes, and with increasing load within the fatigue crack, plastic deformation develops. As an example,
Figure 4b highlights a potential “pop-in” event and the final rupture point.
Analysis of the logarithmic odds ratio (χ2 = 7.23, p = 0.057) showed that there was no statistically significant relationship (significance level α = 0.05) between test temperature and the occurrence of short-term shear with load drop at the diagrams. Therefore, the probability of the occurrence of shear (potential “pop-in” effect) can be considered a statistically random variable.
In [
12], the significance and mechanism of separations during various mechanical tests of pipe steels are investigated in detail. The authors suggest not to take into account such short-term load reduction as a critical “pop-in” effect in determining the CTOD value and to put the main emphasis on the macroscopic appearance of the fracture surface while considering the mechanisms and regularities of separations’ formation in the obtained fractures after CTOD tests.
3.2. Visual Fracture Analysis
The characteristic visual appearance of the samples selected after testing at different temperatures is given for Steel A in
Figure 5a and for Steel B in
Figure 5b. After PWHT, the fracture structure is shown in
Figure 5c,d. Regardless of chemical composition and final treatment, all samples are characterized by a high number of transverse separations. In cases of the registration of potential “pop-in” spikes on the diagrams (
Figure 4b), the secondary separations observed in the fractures (
Figure 5b,d) extend into the induced crack region and propagate in it for a length of 0.5–0.9 mm. The number of spikes on the diagram corresponds to the number of separations that have entered the induced crack zone. The further the separations have propagated into the induced crack region, the more clearly the potential “pop-in” spikes are discernible on the diagram. It is this feature, noted on individual samples, to which the authors attribute the manifestation of the potential “pop-in” effect.
It can be assumed that the appearance of secondary splits is due to the action of transverse forces directed along the thickness of the plate. When these forces act on elongated microstructural elements perpendicular to the main fracture plane (i.e., aligned in the ND) and serving as the crack initiation point, separations can occur. This type of fracture occurs due to the coincidence of crystallographic planes with reduced layer bonding energy [
13]. One of the main reasons for shear detection may be the parallel arrangement of elongated microstructural or crystallographic elements along the thickness of the plate. Also, separations could be related to the texture of the material [
12].
Visually, the investigated separations are split perpendicular to the direction of the main crack development in planes parallel to the surface of the plate. The separations are observed along the entire ND (normal direction) across the plate’s thickness, often initiated by stresses acting in the transverse direction (TD), indicating that this is not a single-layer effect, as can occur when opening along the center line of segregation. Rather, plastic tightening of the sample along the edges leads to an increase in the stress state close to the plane strain state when the connectivity of layers in the RD (rolling direction) decreases, which is directly related to the features of the formed microstructure. Heating the steels to 580 ± 3 °C and holding for 60 min resulted in a general increase in the number of delaminations visible on the surface of the fractures, which, in turn, increased the probability of separations coming to the surface of the preliminary notch zone.
3.3. Microstructural Analysis of Separations
The microstructural condition of the examined samples was investigated in the TMCP (
Figure 2) and TMCP + PWHT condition. To identify the nature of separations, the microstructure at crack nucleation and propagation was analyzed and compared with the microstructure of the base metal. The microstructure in the regions adjacent to the separations exhibits greater elongation along the deformation direction of the separations. Several main crack morphologies were identified at the termination points of visible separation boundaries. In the case of potential “pop-in” separations (
Figure 6a), the crack ends along the boundary of the elongated deformed ferrite grain; it does not propagate deeply, and it has no side branches. The relief of the walls is smooth, with a small number of rounded depressions on one side and protrusions on the opposite side. The protrusions and depressions are nearly symmetrical and have angles close to 90°.
When medium and smaller separations are observed, the cracks do not always propagate to the surface of the investigated grinding plane. In such cases, intense plastic flow of the metal is observed in the vicinity of the separations (
Figure 6b). The absence of homogeneity in the bending strain bands along the metal cross-section (RD-ND plane) can be explained by the alternation of adjacent regions with pronounced plastic flow during local bending [
14]. This phenomenon is characteristic of the microstructural condition of the steel, which is defined by elongated ferrite grains formed through heavy deformation below the Ar
3 temperature.
3.4. Morphological Analysis of Separations
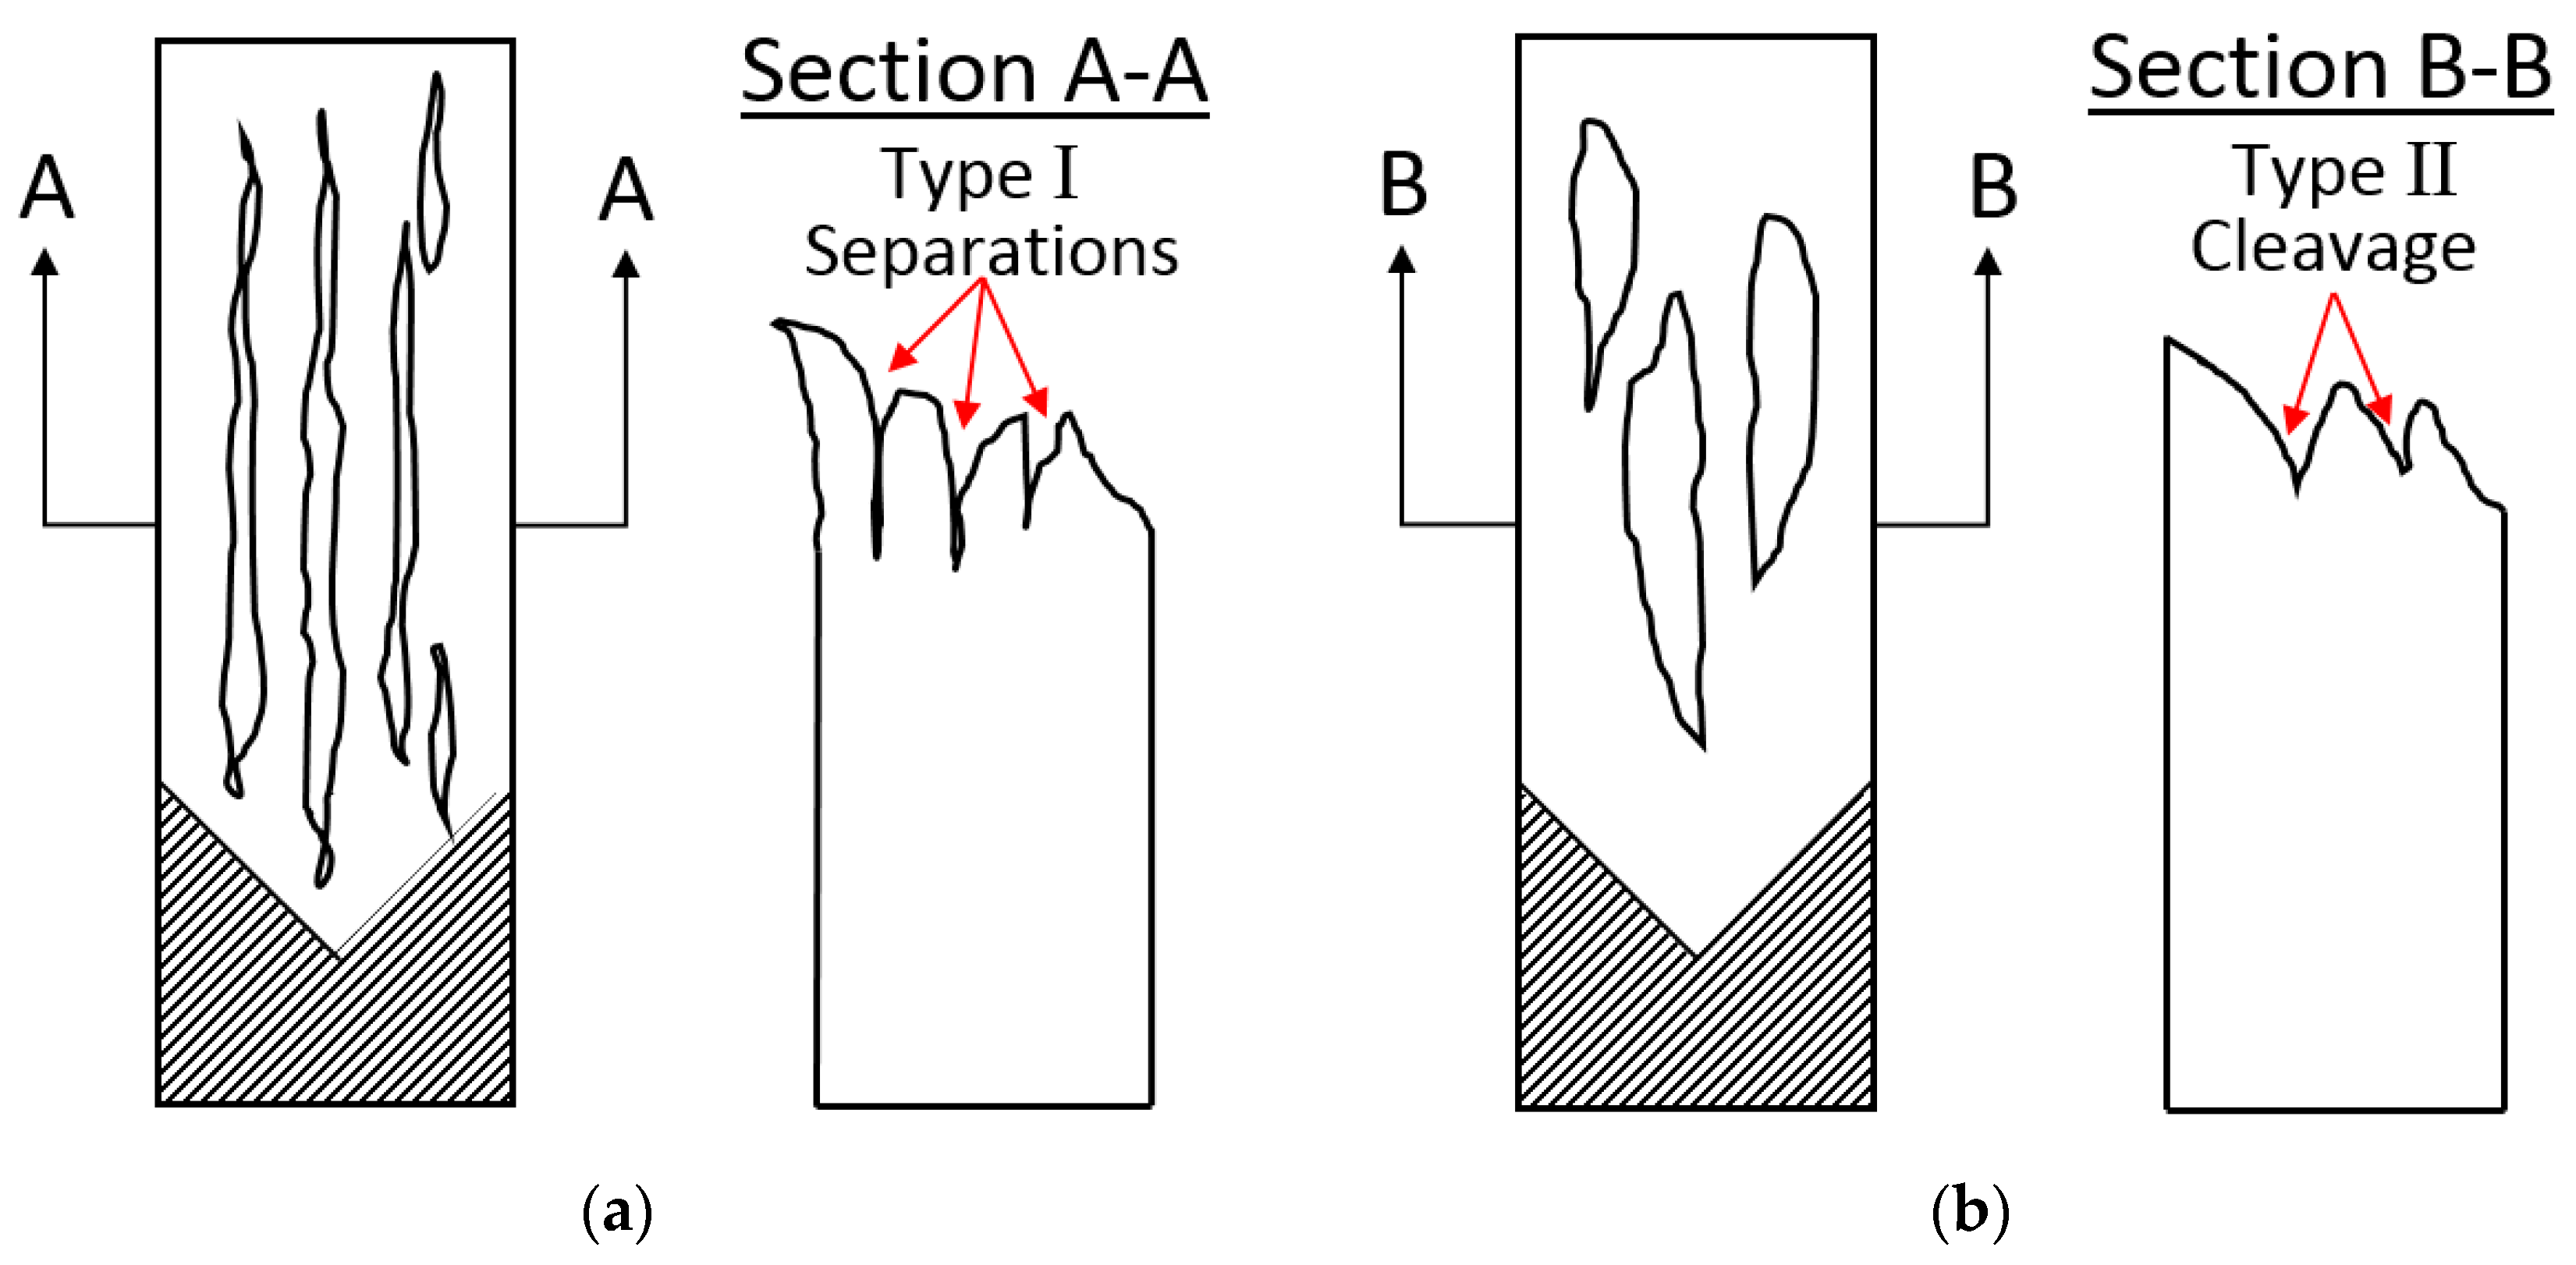
The morphological analysis was conducted following similar principles for describing the fracture nature after the drop weight tear test (DWTT) regulated by EN 10274 [
15] and API RP 5L3 [
16], which categorize separations into two types. The first type propagates parallel to the plate plane and terminates in a sharp crack (
Figure 7a).
Such separations are not considered brittle characteristics and are referred to as “Separations”. The second type is termed “Cleavage”, and the separations in this case have a blunted termination (
Figure 7b) and are oriented at a slight angle to the sheet surface. This type should be classified as a brittle component. In the case of separations of the first type, their formation occurs during plastic deformation preceding fracture, while separations of the second type result from fatigue crack propagation [
17]. Visually, it is not always straightforward to determine the type of separation in samples after DWTT and CTOD tests, as significant differences can be observed only on cross-sections of the fracture surface [
18] and in fractographic studies.
In the present study, all observed separations can be confidently classified as type I (“Separations”) in accordance with EN 10274 and API 5L3. These features are characterized by parallel orientation to the rolling plane, ductile fracture morphology, and the absence of cleavage facets or transgranular crack propagation. These morphological features suggest that the observed separations result from interlayer delamination along the rolling direction rather than from brittle fracture and therefore should not be considered critical fracture events.
The macroscopic analysis showed that after completing the CTOD tests, all fractures of the samples can be classified into the following areas (
Figure 5b): the pre-induced fatigue crack zone, the fracture zone, the zone of fracture before complete sample failure, and the fracture retraction zone [
19]. Two large separations were observed on the cross-section along the ND; the first measured 11.3 mm in length, with an opening of up to 3.5 mm, while the second measured 9.2 mm and 3 mm, respectively. Medium-sized separations exhibited openings of up to 2.8 mm, while smaller separations were evident within the gaps among the larger ones. The retraction area comprised approximately 15% (abs.) of the total, with a minimum retraction width of 16.1 mm. Additionally, the sample subjected to PWHT had two large separations in the central portion of the fracture, with length-to-opening ratios of approximately 13 mm/2.9 mm for the first separation and 14.9 mm/2.6 mm for the second. Furthermore, there were five medium separations with openings of up to 2 mm, along with numerous elongated, smaller separations. The retraction area accounted for roughly 11% of the total, with a minimum retraction width of 17 mm.
The panoramic photographs of the sample surface cross-section were graphically processed so that the outline of separations along the ND was clearly visible (
Figure 8). Analysis of the cross-section of the fractures allowed for determining the nature of propagation and the depth of the separations. The deep separations, which define the potential “pop-in” spike in the diagram for the initial state, reach 5.7 mm, while for the PWHT condition, they reach 5.6 mm. The ends of the separations appear as single openings or multiple thin cracks. The opening angles at the endpoints are sharp and oriented perpendicular to the fracture surface, i.e., along the TD relative to the rolling plane.
Analysis of the cross-section of the fractures allowed for determining the nature of propagation and the depth of the separations. The deep separations, which define the potential “pop-in” spike in the diagram for the initial state, reach 5.7 mm, while for the PWHT condition, they reach 5.6 mm. The ends of the separations appear as single openings or multiple thin cracks. The opening angles at the endpoints are sharp and oriented perpendicular to the fracture surface.
3.5. Fractographic Analysis of Separations
The detailed scanning electron microscopy studies are illustrated using an example of the sample after CTOD tests at −40 °C. Following visual (
Figure 5d) and macroscopic (
Figure 9a) analyses, four regions (
Figure 9b) have been chosen to describe the nature of fracture propagation within separations.
Area 1 (
Figure 9(b1)) is located at the edge of the largest separation, opposite to the direction of fatigue crack propagation. At low magnifications (×200) in this zone, only a ductile type of fracture is discernible, but at ×500 and ×2000, small areas with a mixed fracture character can be distinguished. Nevertheless, the ductile component prevails in this area, and the area of fracture caused by a brittle mechanism is small. Area 2 (
Figure 9(b2)), located on the inner side of the same separation, also exhibits predominantly ductile fracture, as confirmed by the presence of a dimple fracture structure. For area 3 (
Figure 9(b3)), where the separation extends into the induced crack zone, causing the potential “pop-in” spike, a mixed type of fracture is characteristic. Individual local brittle areas of instantaneous fracture are detected in the form of streamlet–let relief (quasi-cleavage), likely occurring in areas with a pearlitic component. Area 4 (
Figure 9(b4)), free from separations and located in the zone of initial fracture, is characterized by the presence of dimples typical of ductile fracture [
20,
21].
It is likely that the formation of separations occurs by facilitating delamination through chipping of planes along the rolling direction (RD), resulting in the formation of a certain number of separations in the plastically deformed fracture zone ahead of the growing crack front [
22]. The results obtained suggest a need for a deeper understanding and refinement of the CTOD test results’ interpretation for TMCP steels with layered microstructures. In particular, separations that exhibit ductile fracture morphology and cause only localized deviations in the load–displacement curve (such as potential “pop-in” spikes) should not be directly classified as critical events.
If separations formed by this mechanism exhibit a potential “pop-in” spike, then they probably should not be considered as the final event during the test, unlike cases where the spike is caused by the propagation of the main fatigue crack deep into the sample through brittle mechanisms.
This observation provides a broader perspective on the fracture behavior of modern offshore steels, where separation-related features are not necessarily indicators of performance degradation but instead reflect the complex interaction of microstructural anisotropy and fracture mechanics [
23].
Summarizing the conducted studies, it can be noted that the areas of the surface of the examined separations are predominantly characterized by a ductile fracture. Therefore, such metal can be considered a multilayer material, where strength and ductility are determined by the energy of crack propagation occurring at each transition from one layer to another.
4. Conclusions
Low-carbon microalloyed 23 mm thick steel heavy plates of quality grade EN10225-1:2019 S460MLO were CTOD tested in TMCP and TMCP + PWHT conditions. Investigating the relationship between fracture types, fracture characteristics, and CTOD test results in the test temperature range of −10 … −40 °C, the authors determined the following.
- -
All fractures of the samples are characterized by a high number of secondary splittings. The examined splittings belong to the type I separations according to the classification of EN 10274, API 5L3, with a predominant ductile fracture mechanism.
- -
An individual peculiarity of fractures with CTOD specimen splits is the presence of statistically random short-term bursts with load reduction, registered on the diagrams of “load—crack opening displacement” as a potential “pop-in” effect. The appearance of such short-term spikes in the investigated cases is attributed to the emergence of individual separations from the fracture zone into the primary induced fatigue crack zone. In this case, the fracture also occurs through a ductile mechanism, and the main fracture toughness indicator δ (mm) remains at a high level (more than 1.0 mm), indicating that such short-term spikes should not be interpreted as indicators of brittle behavior or material failure during the CTOD test of the investigated steel type.
- -
Application of additional heat treatment to the investigated TMCP steel increases the likelihood of potential “pop-in” spikes appearing on the fracture diagram. This is likely due to relaxation between microstructural layers and simplification of conditions for the occurrence of a greater number and depth of separations.
These results suggest that local load drops caused by separations with ductile morphology should not be automatically classified as critical fracture events in CTOD tests. Such an interpretation helps provide a more balanced assessment of fracture behavior in steels with layered microstructures.
By combining CTOD test results with microstructural and fractographic analysis, a more comprehensive and realistic assessment of the fracture resistance of TMCP steels can be achieved, enabling more accurate evaluation and guiding further improvements in material quality for offshore applications.
The results of the research have been used successfully in passing NLMK DanSteel certification tests of heavy plate products in the quality categories S460MLO, S420MLO, and S355MLO according to the standards EN10225-1:2019 and NORSOK M-120 [
24], including pre-qualification for operation in Arctic areas.


