Article

Ultrasonic Atomization of a Refractory High-Entropy Alloy TiZrNbHfTa for Additive Manufacturing

1
Mechanical Engineering Department, J.B. Speed School of Engineering, University of Louisville, Louisville, KY 40292, USA
2
Additive Manufacturing Institute of Science and Technology (AMIST), J.B. Speed School of Engineering, University of Louisville, Louisville, KY 40292, USA
*
Author to whom correspondence should be addressed.
Powders 2026, 5(3), 25; https://doi.org/10.3390/powders5030025
Submission received: 12 June 2026 / Revised: 11 July 2026 / Accepted: 14 July 2026 / Published: 16 July 2026

Abstract

Growing attention in additive manufacturing (AM) of high-entropy alloys has intensified the demand for techniques in creating high-quality powder for AM. This study characterizes the effectiveness of a multifunctional vacuum arc melting (VAM) and ultrasonic-plasma atomization (UPA) system for creating TiZrNbHfTa powder. The focus is to evaluate the morphology, microstructural homogeneity, and phase composition of ultrasonically atomized powder to assess process capability for preparing powder feedstock for AM. Atomized powder was sieved into three size ranges, 15–63 µm, 63–125 µm, and 125–250 µm for characterization by scanning electron microscopy (SEM), electron dispersive spectroscopy (EDS), X-ray diffraction (XRD), and micro-computed tomography (micro-CT). SEM, EDS, and XRD results show that the powder is highly homogenous with an elemental distribution independent of powder size range and a microstructure comprising a BCC solid solution and minor monoclinic Ti oxide. Micro-CT scans indicate low porosity (0.24%, 0.08%, 0.24%) and high sphericity (0.93, 0.90, 0.93) for the 15–63 µm, 63–125 µm, and 125–250 µm distributions, respectively. Overall, the key innovation of this study is the successful application of ultrasonic atomization to produce high-quality TiZrNbHfTa refractory high-entropy alloy powder for additive manufacturing, a technique that has a limited scope of research. Specifically, this work demonstrates that ultrasonic atomization can produce highly homogeneous powder with high sphericity, low porosity, and a particle size distribution suitable for laser powder bed fusion and powder directed energy deposition, establishing ultrasonic atomization as a viable route for producing refractory high-entropy alloy powder for AM.

Graphical Abstract

1. Introduction

Conventional alloys are derived from the “base element paradigm” in which principal and minor elements are amalgamated to define and enhance the fundamental structure of the composition [1]. Hume–Rothery rules guide the selection of constituents, operating by selection of the corner regions of the system’s phase diagram to predict the formation of solid solutions [2]. Phase instability is exacerbated by the number of constituents, limiting the paradigm’s usability for selecting multicomponent alloys and increasing the likelihood of intermetallic phase growth, which inherently produce undesirable mechanical behavior [3].
Recent breakthroughs discovered that a near equiatomic (~5–35 at.%) alloy comprising multi-principal constituents reduces the likelihood of intermetallic phases primarily by raising the mixing entropy of the material system (the high-entropy effect); this alloy is referred to as the high-entropy alloy (HEA) [4]. The high-entropy effect exists because of the proportionality between the number of constituents and mixing entropy paired with the atomic size difference between constituents and mixing enthalpy [5]. Computational techniques, such as CALPHAD, employ these relationships to predict isomorphous HEAs by approximating the minimum Gibb’s free energy at a specified temperature, providing insight on phase stability [6,7]. These techniques have provided extraneous information on HEAs with desirable mechanical properties which include ultrahigh fracture toughness, hardness, melting temperature, creep resistance, and ultralow ductility, the latter of which is typically found in HEAs and challenges conventional subtractive manufacturing processes. Additive manufacturing (AM) proposes itself as a novel solution for overcoming these intrinsic challenges of forming and machining these often brittle HEAs [8,9,10].
Powder directed energy deposition (P-DED) and powder bed fusion (PBF) dominate the scope of AM with HEAs [11]. P-DED employs a nozzle to deposit powder feedstock and melt each deposited layer with an energy source such as a laser or electron beam [12] and PBF operates by depositing a sheet of powder onto a plate and using an energy source to selectively melt the powders, repeating the process until the desired form is reached [13]. PBF and P-DED predominantly employ mechanically alloyed and atomized powder with typical sizes ranging from 15 to 63 μm and 63 to 125 μm, respectively. Performance metrics for powder quality are based upon the homogeneity, morphology, and size distribution of the powder [14,15], which affect the quality of AM parts [16].
Mechanically alloyed powder is developed by colliding raw elemental constituents with grinding balls together in a particular vessel, welding and fracturing the constituents until a roughly spherical net shape is reached [17]. Compared to atomized powder, the technique is inexpensive and desirable for rapid screening of various alloy compositions but is similarly limited by scalability for high volume production. Process efficiency is dependent on the ball-to-powder ratio (BPR), which is proportional to the homogeneity and sphericity of the powder. The challenge with this process is the limitation of powder volume produced, caused by the requirement of higher BPR to form high-entropy alloy powder, typically 10:1 or greater [18]. Sintering techniques are often employed to increase homogeneity, allowing smaller BPRs and greater powder volume, with various sintering temperatures studied for high-entropy alloys [19]; however, the inherent challenges with homogenization, sphericity, and porosity due to the agglomeration of powder makes mechanical alloying unattractive for creating AM powder feedstock [20].
Gas atomization is the conventional technique for producing powder for AM [21]. In this process, high-pressure gas jets impinge on a molten material stream, dispersing it into a shower of droplets that solidify during flight [22]. Powder particle size is primarily governed by the nozzle and stream velocities, as well as the nozzle–stream angle of attack [23]. Key advantages of gas atomization include high powder throughput and compositional homogeneity, as the powders are derived from a pre-alloyed melt. However, the high ejection velocities promote particle agglomeration and induce morphological defects due to collisions between particles and the chamber walls, ultimately degrading powder quality [24].
Ultrasonic atomization (UA) has received growing attention as a viable mechanism for creating high-quality powders for AM [25,26,27,28] with publications doubling from 2016 to 2026. This process forces acoustic waves through a vibrating plate (sonotrode), which interact with a liquid film of material to induce fragmentation of droplets [29]. These vibrations develop capillary waves which break up to form surface ligaments leading to the expulsion of droplets [30]. The droplets solidify during ejection to form powders. The low velocity of powders during ejection reduces agglomeration, increasing sphericity and reducing surface defects [31]. Commercial UA devices use excitation frequency of the vibrations as the control factor of powder size and operate in a vacuum inert atmosphere to minimize oxidation of the powders [32]. Reduced system complexity, high powder quality, and a fundamentally different mechanism for powder preparation distinguish ultrasonic atomization as an innovative powder production technique. Furthermore, the limited body of research investigating its feasibility for preparing HEA powder highlights a significant opportunity for advancement of knowledge in this space.
A refractory high-entropy alloy (RHEA), that has received growing attention is the TiZrNbHfTa alloy, introduced in 2011 [33]. This composition is primarily distinguished by moderate room temperature ductility and high tensile strength [34]. The BCC structure is attributable to the ductility of the composition, making the alloy desirable for AM because of its inherent formability. This research aims to employ a plasma-assisted ultrasonic atomization (UPA) device to prepare high-quality TiZrNbHfTa powder for AM. Morphology, size distribution, elemental homogeneity, and phase composition of the powder will be systematically analyzed to assess powder quality and viability of this approach for creating AM feedstock.

2. Materials and Methods

2.1. Sample Preparation

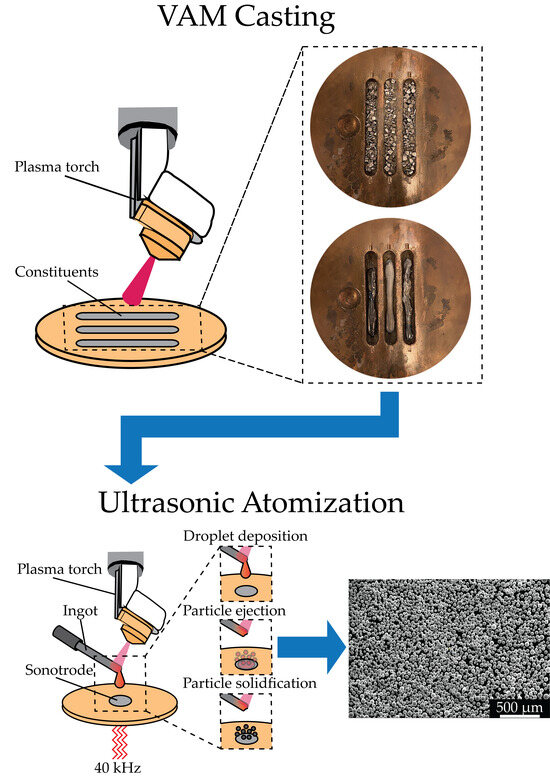
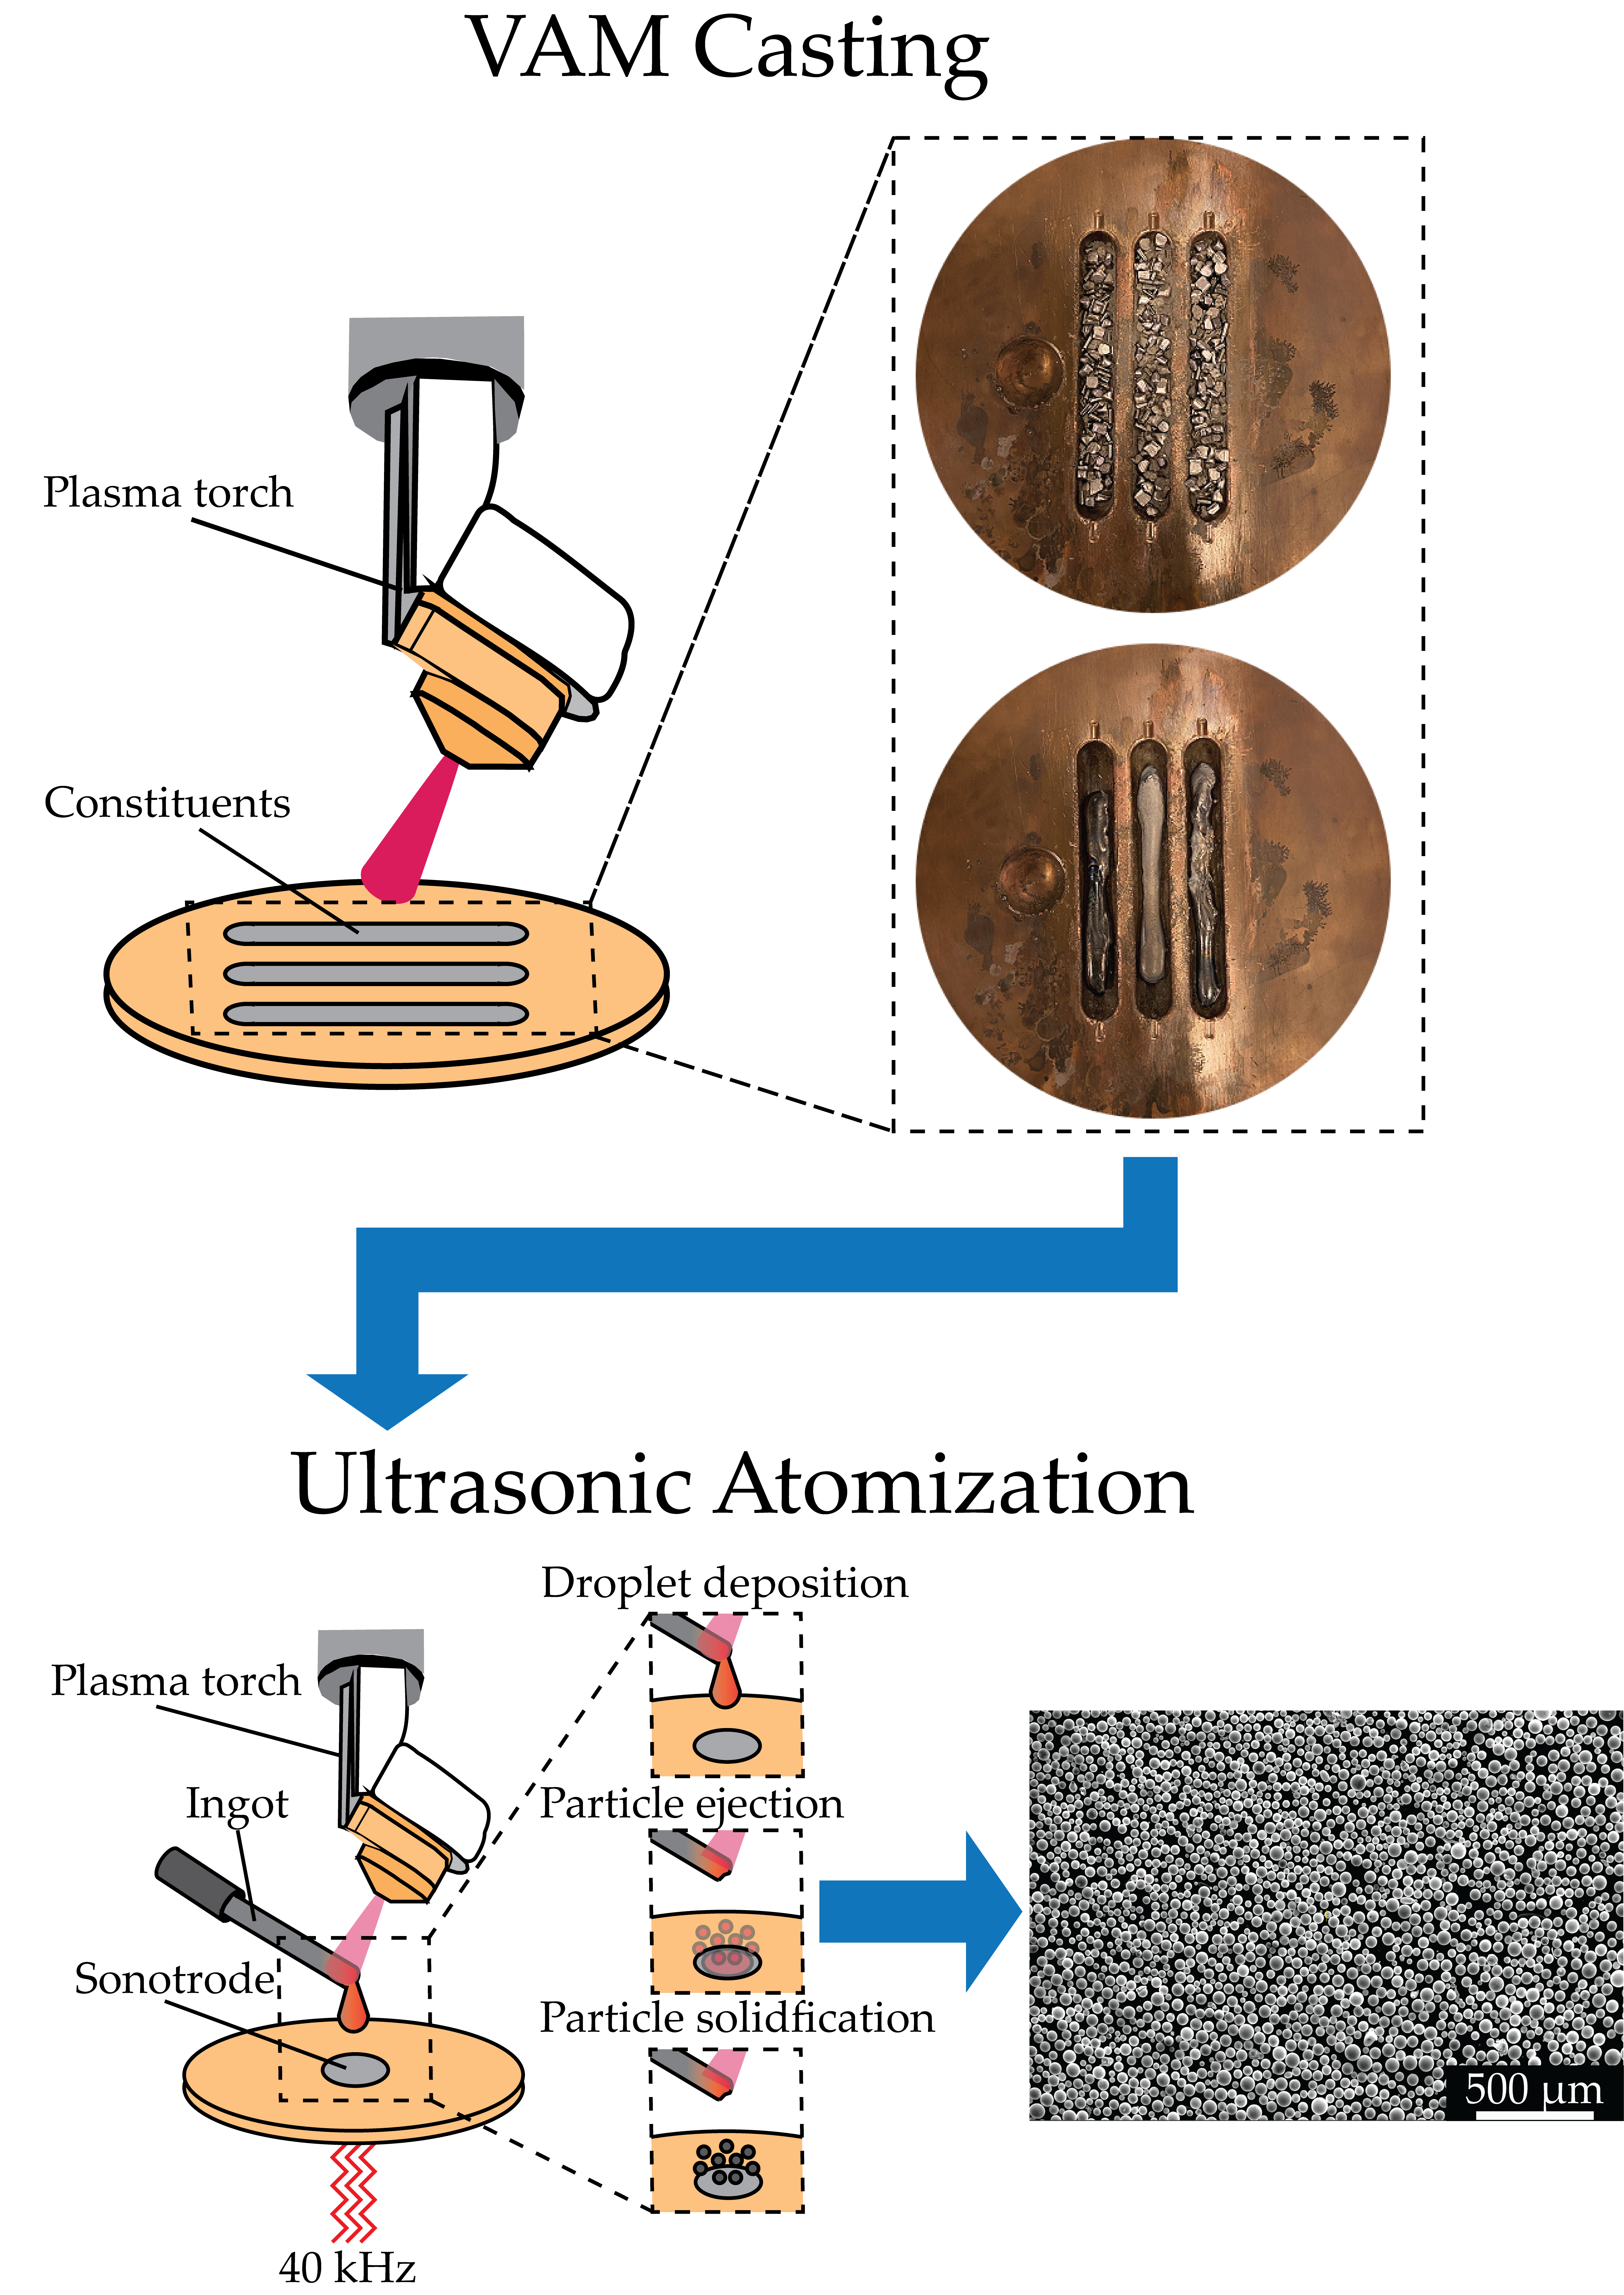
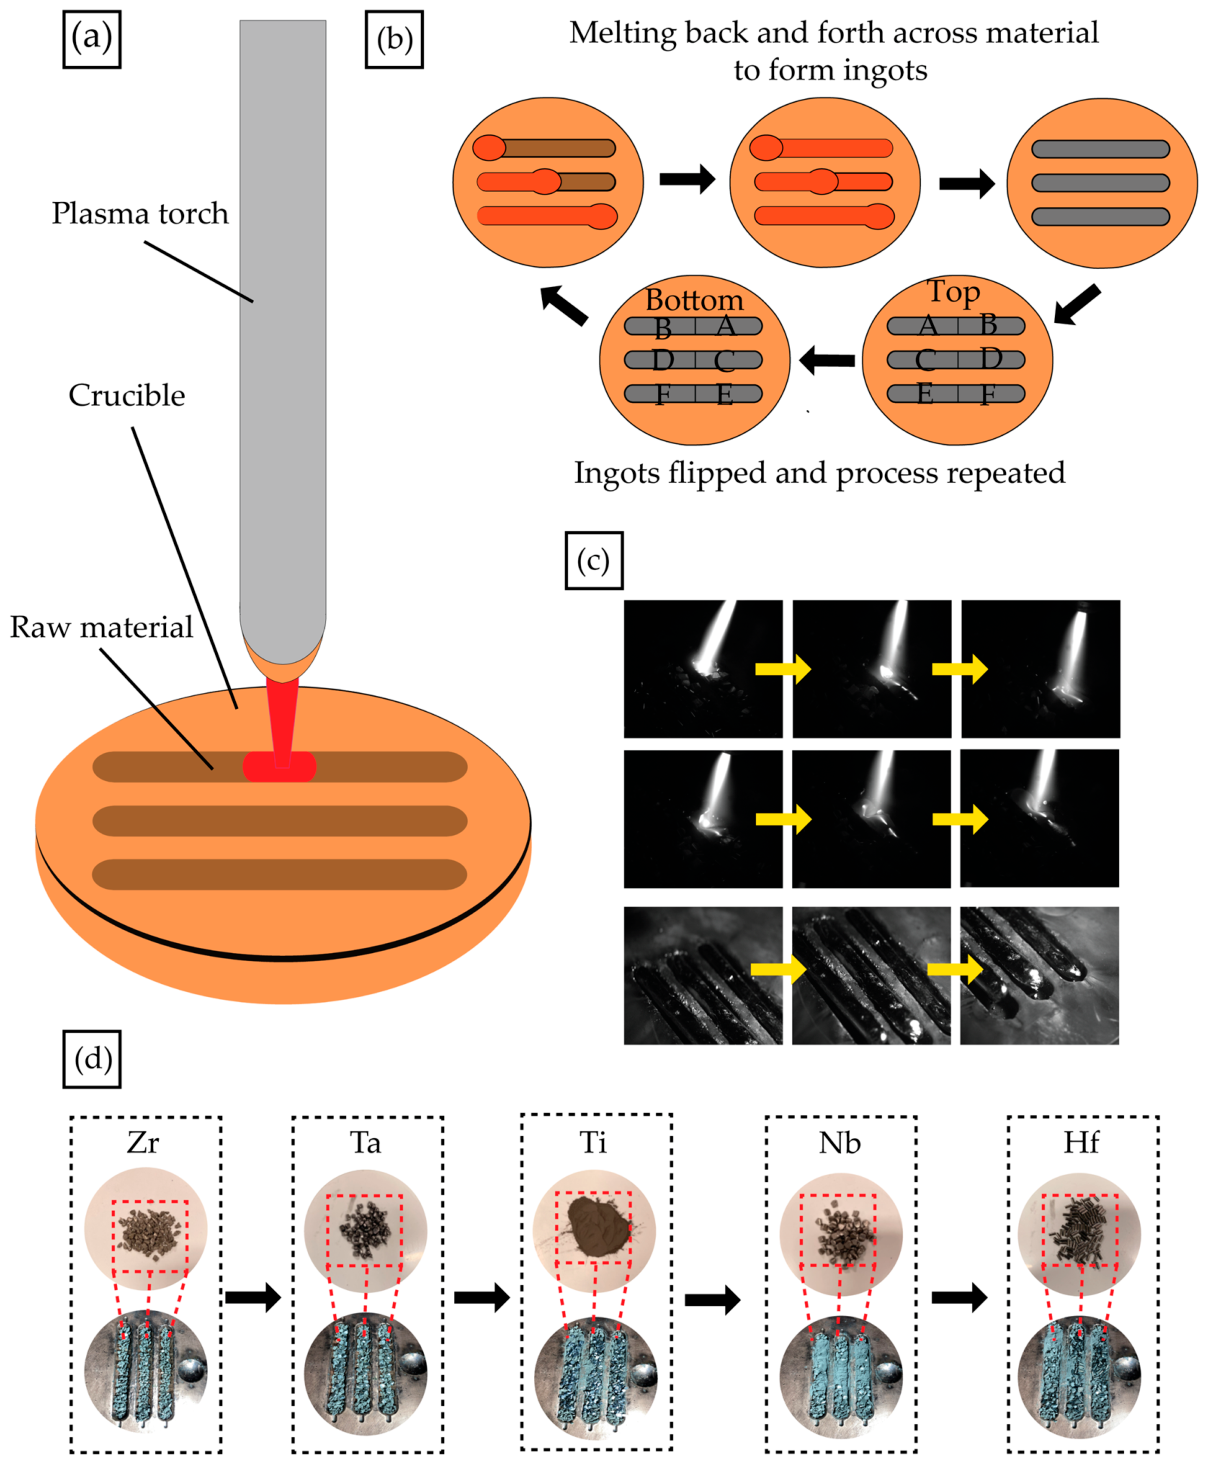
In this investigation, an AMAZEMET rePowder system was used to prepare the TiZrNbHfTa powder. The first phase of the system is based on a cold crucible vacuum arc melting (VAM) strategy. This strategy employs a cooled copper crucible (15 °C) and a focused plasma torch (275 amps) in an inert atmosphere (<5 ppm, O2 argon) to cast the composition from raw material. High-purity (at.% > 99.90) granular material was used in the casting process. Batches of material were prepared using a laboratory scale (A&D EJ-303). Material was spread in a layer-wise configuration in the molds to encourage element distribution across the length of the molds (Figure 1d). Casting was performed by transitioning the torch over each mold to distribute the melt pool, followed by flipping the material and repeating the process to generate ingots (Figure 1a–c).

2.2. Powder Development

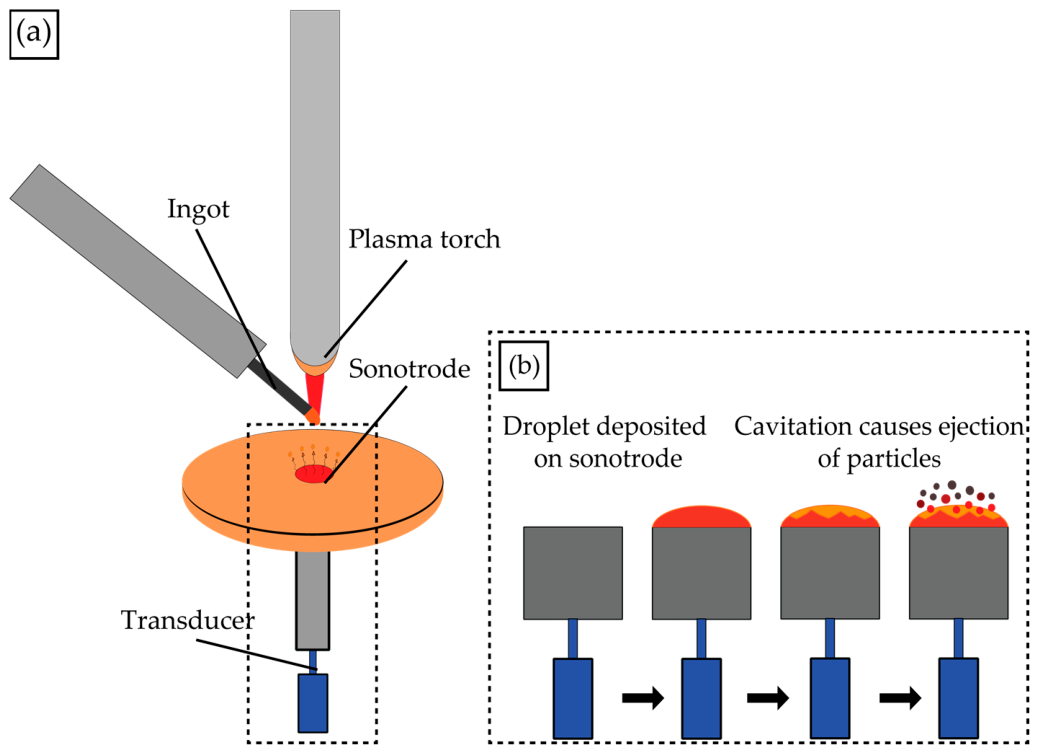
The second phase of powder production with the AMAZEMET rePowder system is based on a plasma-assisted cold crucible ultrasonic atomization (UPA) platform operating in the same inert atmosphere as the VAM technique. Operation is performed by suspending the ingots above a TZM sonotrode and using a plasma torch to melt the tip of the ingot, directing a droplet of material onto the sonotrode. The TZM sonotrode is based on a TiZrMo alloy and is specifically designed by AMAZEMET for use with HEAs to reduce the likelihood of contamination between droplet and sonotrode material. The sonotrode is also cooled to 15 °C during operation to prevent the device from melting into the material. A transducer applies vibrations through the sonotrode for atomization of the material. Due to the high surface tension and poor wettability of the material, machine parameters were chosen as maximum amplitude (100%) and 325 amps to reduce surface tension and increase pressure at the sonotrode–droplet interface. The highest available frequency, 40 kHz, was selected to minimize powder size. Argon gas forced the powder into a chamber for retrieval (Figure 2). Powder was sieved to 15–63 µm, 63–125 µm, and 125–250 µm ranges using a vibratory sieve (Retsch AS 200) and produced at a rate of ~2.5 g/min.

2.3. Material Characterization

Scanning electron microscopy (SEM, Thermo Scientific Apreo C LoVac SEM, Waltham, MA, USA) and electron dispersive spectroscopy (EDS, Thermo Scientific Apreo C LoVac SEM) were used to characterize element distribution and morphology of the ingots and powders. X-ray diffraction (XRD, BRUKER Discovery D8 HR-XRD, Billerica, MA, USA) equipped with Bruker EVA Software and ICCD PDF-2 was employed on the powder to distinguish crystal phases and analyze the effect of the process on the crystallographic profile of the material. Porosity and sphericity were characterized by employing Micro-CT (Thermo Scientific Heliscan Mk2) on the sieved size ranges of powders. These techniques were used to evaluate phase and elemental homogeneity as well as powder morphology for the sieved size ranges. Statistical analyses were performed on the data derived from the material characterization processes to determine process repeatability.

2.4. Statistical Analyses

Statistical analyses were performed, creating a General Linear Model (GLM) in Minitab (Minitab 22) to evaluate the effects of ingot (sample), sampling location (point), and ingot face (side) on the measured elemental composition of the ingots. The model included sample, point, side, and element as fixed factors, along with the sample × element, point × element, and side × element interaction terms to determine whether the atomic % (at.%) for each element depended on the ingot or orientation in which the at.% is measured. Likewise, the same analyses were repeated on powder to determine the effects of powder size range on element distribution, sphericity, and porosity. Statistical significance was assessed at a 95% confidence level (α = 0.05). Interval plots with 95% confidence intervals were generated to visualize differences among factor levels and to aid in the interpretation of significant interactions along with standard deviations (SD) to assess variability within and between samples. These analyses were used to determine the repeatability of the process for developing high-quality powder with a focus on morphological and chemical composition of ingots and powder as performance metrics.

3. Results and Discussion

3.1. Characterization of Ingots by EDS

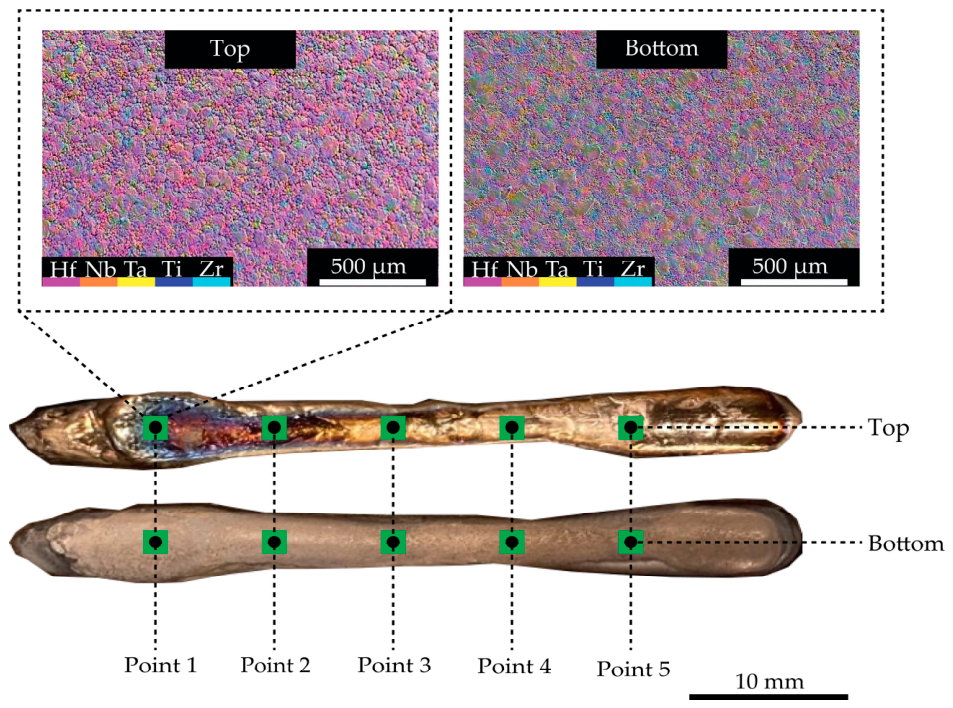
Ingot characterization was performed by employing EDS to analyze the elemental composition across the as-cast ingots. Three individual ingots (samples) were tested via EDS. For each of the three ingots, EDS was performed along the longitudinal axis at five points across the top and five points across the bottom (Figure 3) using element mapping to determine element distribution on the scanned areas, for a total of 30 scans. Table 1 summarizes the mean at.% of each element using this technique along with the standard deviation (SD) across the measured points for each of the samples. The sample labels are denoted as sample-side in column 1 so that the table can clearly show the mean at.% distribution between samples with the respective side dependency. Sample refers to the ingot being characterized, while side (bottom, top) refers to the side closest to the torch in the final phase of casting. EDS mapping procedure and labels are illustrated (Figure 3).
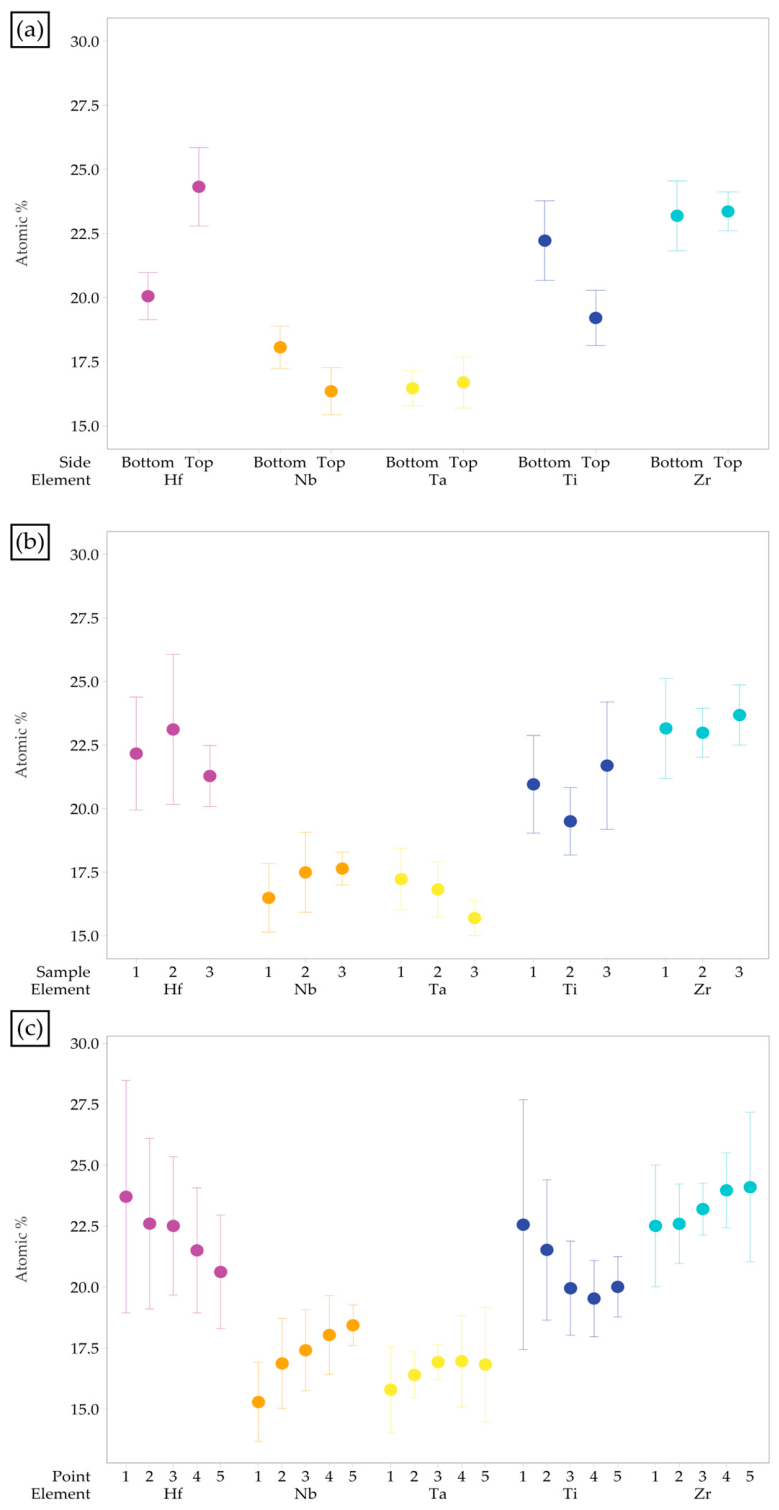
The SDs shown in Table 1 indicate minor fluctuations in mean at.%, with the SD values below 2 at.% for most of the observations; however, larger SDs were observed for Zr and Ti. Compositional fluctuations could be attributed to minor element segregation during casting and ingot preparation. To further evaluate process repeatability, a factorial analysis of variance (ANOVA) was performed to assess interactions among point, side, sample, and element using the mean at.% values for each element at a 95% confidence level (α = 0.05). Interval plots were developed based on the ANOVA model to visualize interactions among factors (Figure 4). The ANOVA model indicates no statistically significant interaction between point × element (p = 0.054 > 0.05); however, statistically significant side × element (p < 0.001) and sample × element interactions (p = 0.039 < 0.05) are observed. Examination of the interval plots indicates that the side × element interaction is driven primarily by Hf and Ti. Rapid solidification from the chilled crucible could have caused preferential incorporation of Hf in the bottom of the ingot during early solidification, resulting in enrichment of Ti in the top of the melt pool. The variability and sample × element interactions across the ingots likely stems from the casting technique and is primarily associated with Nb. The mean at.% for the constituents are within ±4 at.% of the nominal composition (20 at.%), independent of location, orientation, and sample, which confirms process reliability for alloy casting within ±5 at.%.

3.2. Characterization of Powder with EDS and SEM

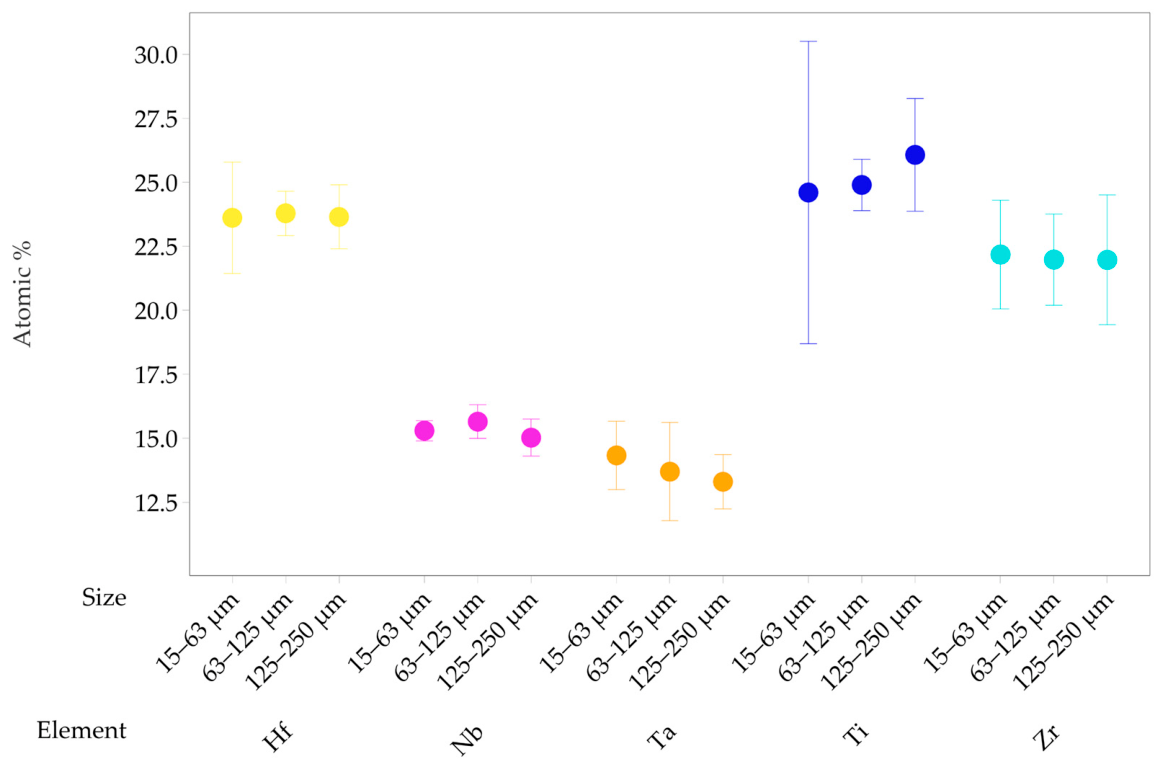
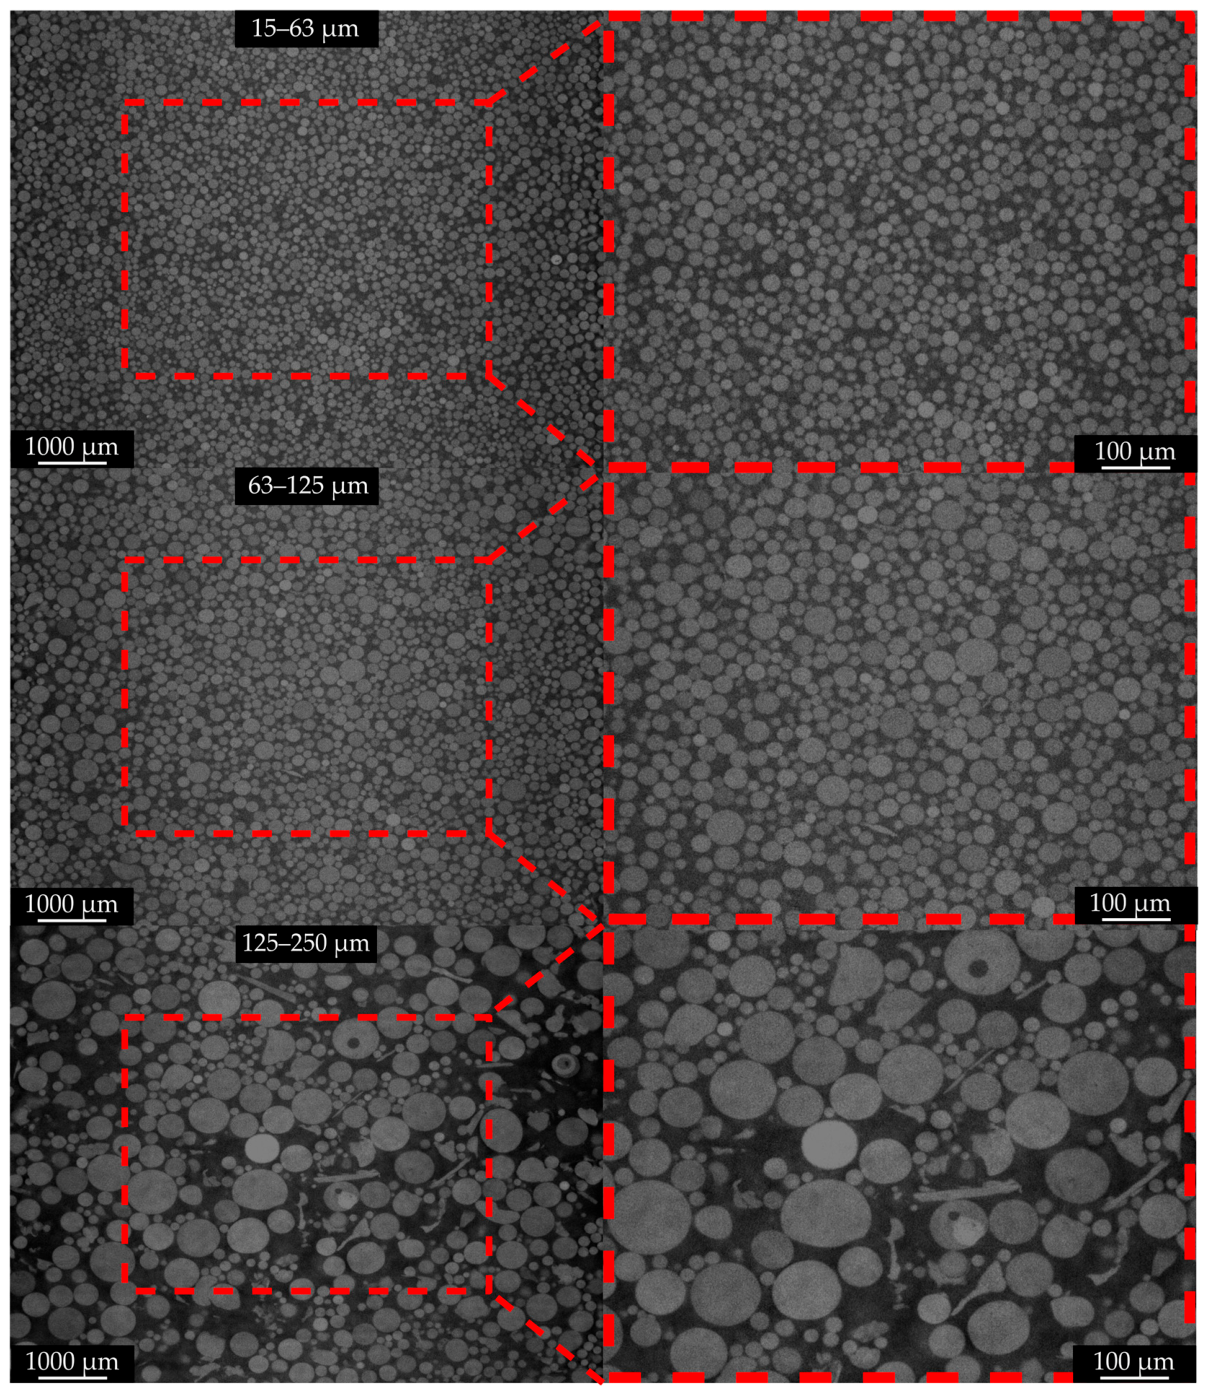
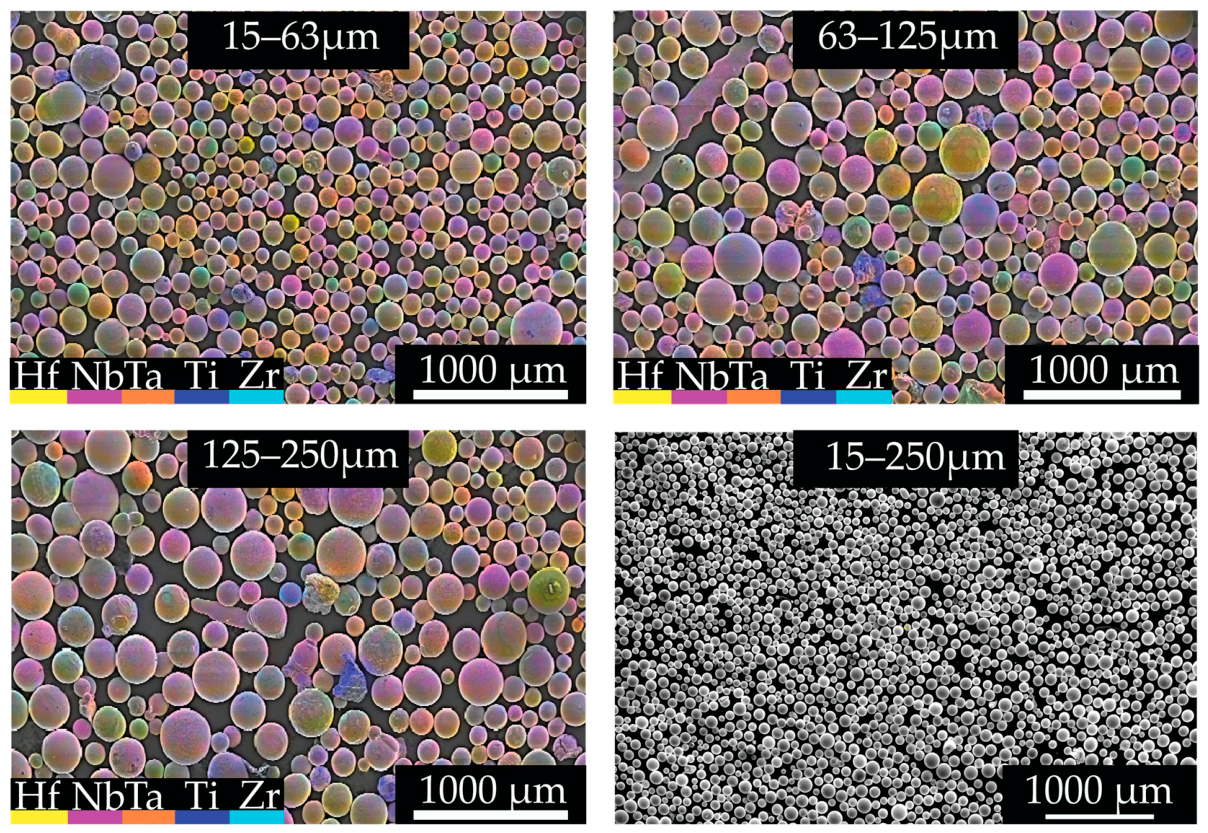
Table 2 presents the mean at.% and SD observed for each element across the 15–63 µm, 63–125 µm, and 125–250 µm size ranges. SD of mean at.% is within ±1 at.% across most of the elements, with an outlier observed in the 15–63 µm size range for Ti. This outlier is likely attributable to minor local compositional variations during casting and is within ±2 at.%. EDS mapping was performed in three arbitrary locations for each size range, followed by SEM images taken over the entire range of sizes (15–250 µm) to compare element distribution and morphology between the distributions. This analysis was carried out by using an ANOVA model with the at.% as the response for a 95% confidence level (α = 0.05). The ANOVA model indicates no statistically significant size × element interaction for the measured at.% (p = 0.462 > 0.05). Interval plots generated from the ANOVA model illustrate the significance levels for the size × element interactions (Figure 5). The SEM and EDS images show that the powder appears highly spherical and homogeneous with minimal surface defects and element segregation, independent of the size and element (Figure 6). The powder is also free of significant denting or satellite particles suggesting that the interactions between the powder and the chamber wall during the process have minimal effect on the powder quality. Fragments are observed in the powder, defects that could be attributable to incomplete atomization from thin layers of material propagating off the sonotrode before atomization.
The overall SD for the mean at.% for the powder (±1 at.%) is half that of the SD within the ingots (±2 at.%) including and excluding the outliers. This data suggests that droplet formation during atomization could be responsible for further homogenizing the material. Driving factors for this potential mechanism are the deposition of multiple droplets from various points along the ingots cross section. As these droplets compile on the sonotrode, they form a singular melt pool causing interactions between elements that were localized throughout the ingot’s cross section. Segregation of Ti is also present in the powder, independent of size range prominent in the debris, which could stem from oxide formation, causing phase separation. The at.% is consistent for each of the size distributions, representing that the individual element segregation does not influence the powder size, and that each range contains highly homogeneous powder with a maximum deviation of ±7 at.% from the theoretical composition (20 at.%). This demonstrates that the technique can create homogenous HEA powder for PBF (15–63 µm), P-DED (63–125 µm), and larger powder (125–250 µm) that could potentially be used in AM as well.

3.3. Characterization of Powder by XRD

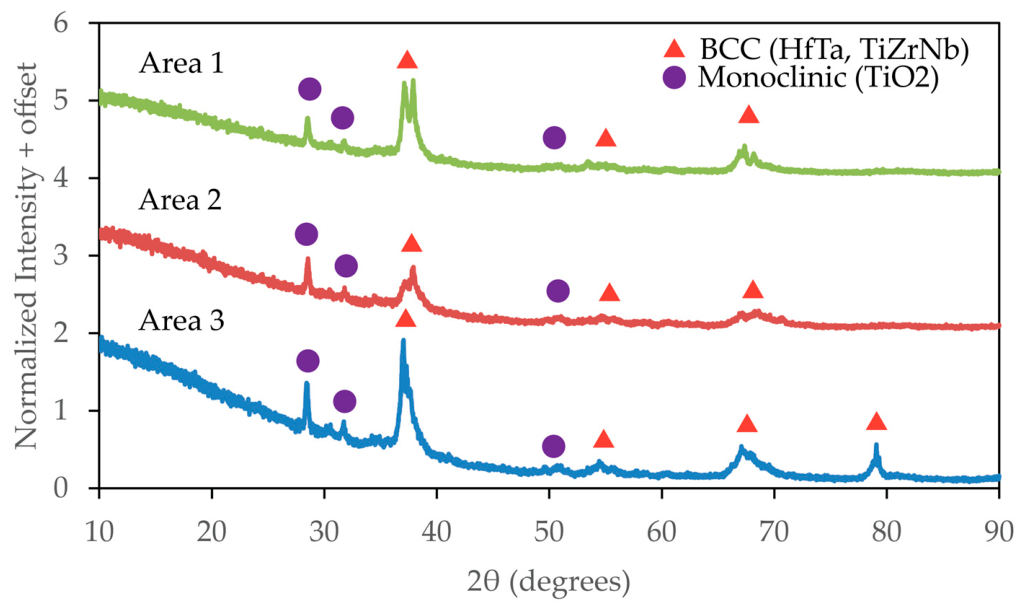
XRD was performed in three arbitrary areas on one sample group containing 15–250 µm powder with the diffraction peaks shown (Figure 7). The analysis reveals a dominant BCC solid solution phase with indexes at (110), (200), (211), (220), and (310) planes. Reference patterns of Ti-Zr-Nb and Hf-Ta reflected the peaks shown in the diffraction pattern, indicative of solid solution formation throughout all constituents. In addition, a monoclinic TiO2 oxide phase is observed in weak diffraction patterns. Ti has the highest oxygen affinity in the alloy which reconciles with the Ti segregation from the EDS scans (Figure 6). Oxidation is likely attributed to typical sensitivity of HEA’s to oxygen exposure, which could have occurred during powder handling and analysis.

3.4. Characterization of Powder by Micro-CT

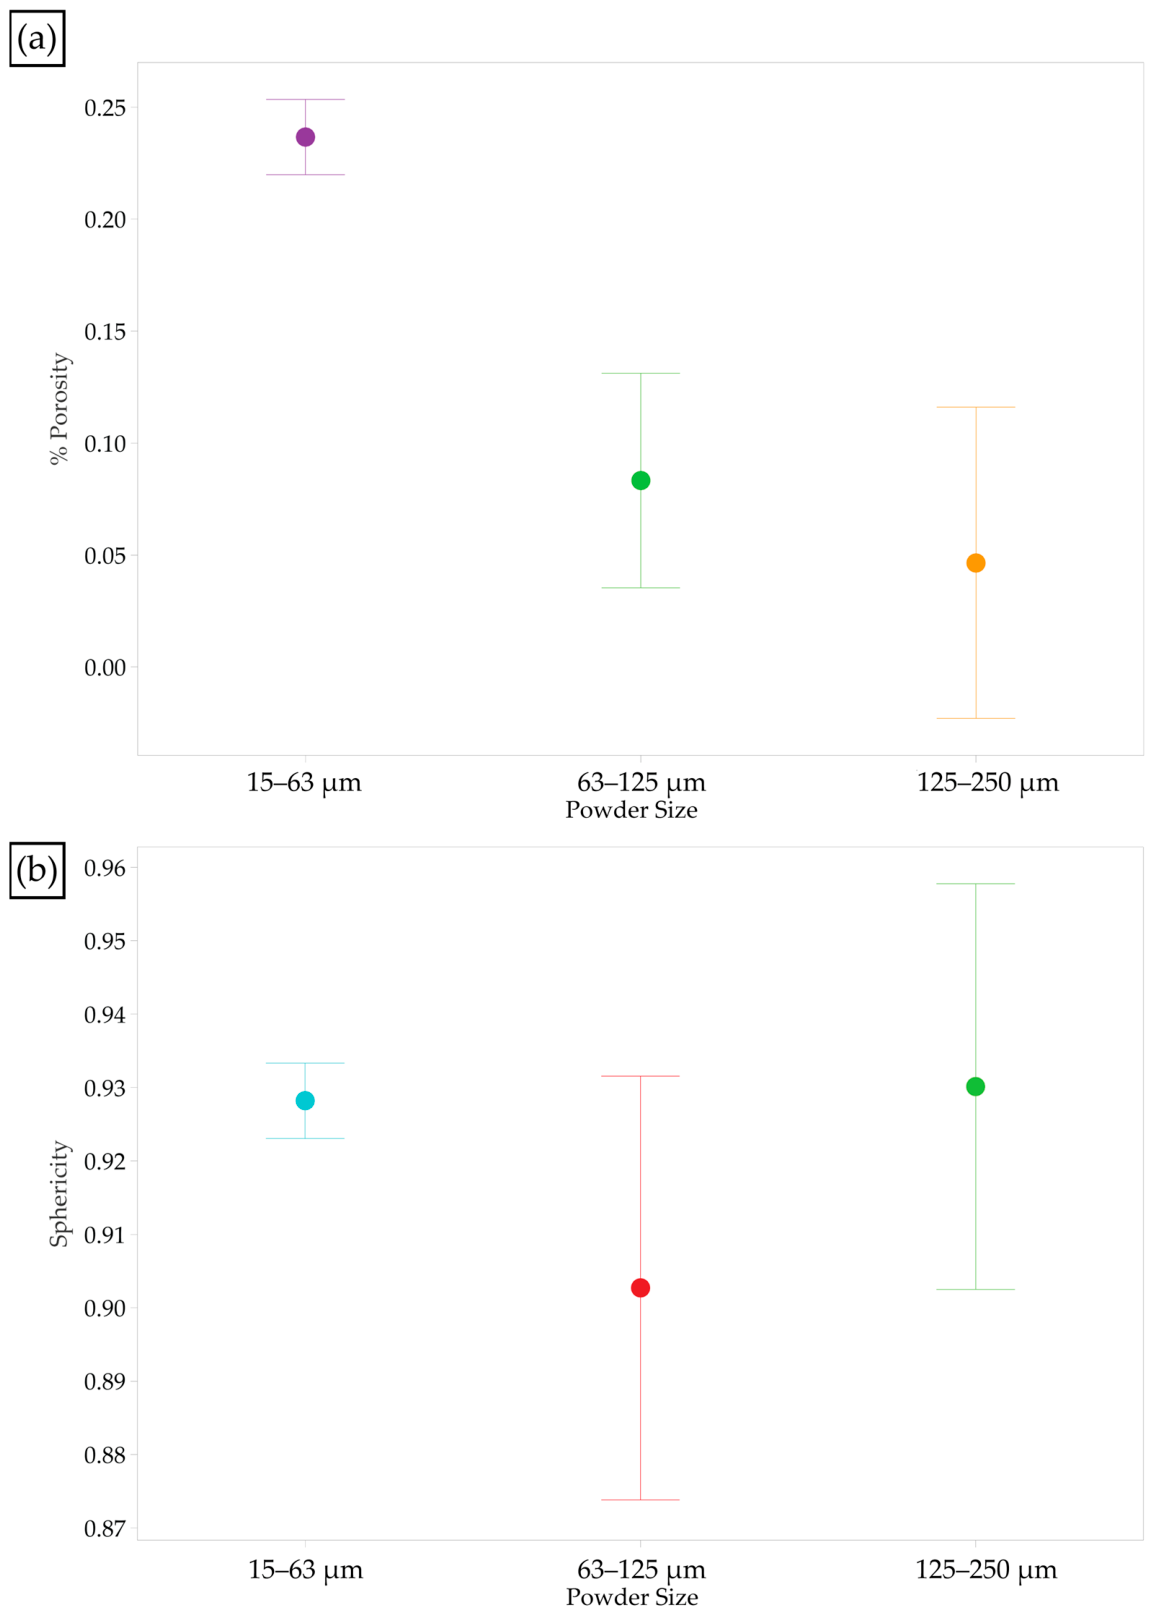
Table 3 represents the sphericity and % volumetric porosity (% porosity) across the sizes ranges obtained from Micro-CT scanning along with the SD and mass % yield for each range. The CT observations reveal that the powders are highly spherical, with mean sphericity for the 15–63 µm, 63–125 µm, and 125–250 µm size ranges observed at 0.93, 0.90, and 0.93, respectively. Minimal porosity is also observed between the three ranges, with mean % porosity of 0.24%, 0.08%, and 0.05% for the 15–63 µm, 63–125 µm, and 125–250 µm size ranges, respectively. It is also shown that as the SD grows larger the powder size reduces, which is likely driven by the measurement uncertainty associated with the micro-CT scan used (25 µm voxel size). For the operating conditions used (40 kHz), the powder yield is the highest in the 63–125 µm range (61.91%) and the lowest in the 125–250 µm range (17.70%), leaving the rest of the powder in the 15–63 µm range (20.39%). The data is indicative of an 82.30% yield suitable for PBF and P-DED, representing the processes capability for producing powder for AM.
An ANOVA model was generated based on the sphericity and % porosity as the response for a 95% confidence level (α = 0.05). A data set containing 617 points across the size ranges was used in the analysis. The ANOVA model indicates no statistically significant effect of powder size on the sphericity of the powder (p = 0.051 > 0.05) and reconciles with the low deviation in sphericity between size ranges shown in Table 3; however, a significant effect of powder size on % porosity is observed (p < 0.001). The interval plots generated from the ANOVA model depicting the significance levels for the size effects on sphericity and porosity are shown (Figure 8), followed by the micro-CT images (Figure 9).
Examination of the interval plots indicates that porosity within the 15–63 µm size range heavily drives the statistical significance of powder size on the porosity. This effect is likely caused by the limitations of the micro-CT scanner due to the 25 µm voxel size. Reconstruction errors stemming from fewer voxels could have produced inaccuracy within measuring particle porosity as the powder size decreases; however, no statistical significance exists between the powder size and sphericity. Based on the high sphericity and low porosity within the powders from the micro-CT analysis, the powders appear high-quality and sufficient for PBF and P-DED.

4. Conclusions

In this study, high-quality TiZrNbHfTa powder was created using an AMAZEMET ultrasonic atomization platform. The morphology, elemental composition, phase composition, and internal porosity were systematically characterized and analyzed. The results demonstrated a 20.30%, 61.91%, and 17.70% mass yield for the 15–63, 63–125 µm, and 125–250 µm powder sizes, indicating that 82.3% of powder created using this technique is of sufficient size for PBF and P-DED. The variation in mean at.% of the elements in the powder was most pronounced for Ti, attributed to the formation of Ti oxides as evidenced by the monoclinic Ti oxide phase detected by XRD; despite this, the powders were highly homogeneous with a BCC phase containing all expected elements. Micro-CT analysis confirmed that all size distributions were highly spherical, with values ranging from 0.93, 0.90, and 0.93 for the 15–63 µm, 63–125 µm, and 125–250 µm powder sizes, respectively. This technique also demonstrated low porosity values of 0.24%, 0.08%, and 0.24% for the 15–63 µm, 63–125 µm, and 125–250 µm powder sizes, respectively. Therefore, the results presented demonstrate that ultrasonic atomization is a feasible and effective technique for creating high-quality refractory-based high-entropy alloy powder for additive manufacturing.

Author Contributions

Conceptualization, B.S.D., S.N., N.S. and T.A.B.; methodology, B.S.D. and S.N.; validation, T.A.B.; formal analysis, B.S.D.; investigation, B.S.D., S.N., N.S., T.A.B. and J.D.G.; resources, T.A.B.; data curation, B.S.D.; writing—original draft preparation, B.S.D.; writing—review and editing, B.S.D. and T.A.B.; supervision, T.A.B.; funding acquisition, T.A.B. All authors have read and agreed to the published version of the manuscript.

Funding

The present work was funded by NASA R3 STMD/ARMD RFA-013: Development of Refractory High Entropy Alloys Structures Produced via Additive Manufacturing for Extreme Temperature NASA Applications (3200006440-25-033). NSF MRI Program Award #2216352; MRI: Acquisition of an Ultrasonic Atomization and Alloying Platform for Additive Manufacturing Research and Education. 2025 NASA Kentucky Space Grant Consortium (GF-25-054).

Data Availability Statement

The original contributions presented in this study are included in the article. Further inquiries can be directed to the corresponding author.

Acknowledgments

The authors would like to acknowledge technical assistance from Owen Mattingly and Rushi Bhakta from the Additive Manufacturing Institute of Science and Technology (AMIST) at the University of Louisville for their support in material handling and preparation. The authors would also like to acknowledge Michael Martin from the Micro/Nano Technology Center (MNTC) and Jacek Jasinski at the Conn Center for Renewable Energy Research at the University of Louisville for their support with instrument usage. Lastly, the authors would like to acknowledge Robert Quammen at the Advanced Science and Technology Commercialization Center (ASTeCC) for their generation of Micro-CT data.

Conflicts of Interest

The authors declare no conflicts of interest.

References

  1. Ye, Y.; Wang, Q.; Lu, J.; Liu, C.; Yang, Y. High-Entropy Alloy: Challenges and Prospects. Mater. Today 2016, 19, 349–362. [Google Scholar] [CrossRef] [Scilit]
  2. Troparevsky, M.C.; Morris, J.R.; Daene, M.; Wang, Y.; Lupini, A.R.; Stocks, G.M. Beyond Atomic Sizes and Hume-Rothery Rules: Understanding and Predicting High-Entropy Alloys. JOM 2015, 67, 2350–2363. [Google Scholar] [CrossRef] [Scilit]
  3. Senkov, O.N.; Wilks, G.; Miracle, D.; Chuang, C.; Liaw, P. Refractory High-Entropy Alloys. Intermetallics 2010, 18, 1758–1765. [Google Scholar] [CrossRef] [Scilit]
  4. Tsai, M.-H.; Yeh, J.-W. High-Entropy Alloys: A Critical Review. Mater. Res. Lett. 2014, 2, 107–123. [Google Scholar] [CrossRef] [Scilit]
  5. Miracle, D.B.; Senkov, O.N. A Critical Review of High Entropy Alloys and Related Concepts. Acta Mater. 2017, 122, 448–511. [Google Scholar] [CrossRef] [Scilit]
  6. Miracle, D.B.; Miller, J.D.; Senkov, O.N.; Woodward, C.; Uchic, M.D.; Tiley, J. Exploration and Development of High Entropy Alloys for Structural Applications. Entropy 2014, 16, 494–525. [Google Scholar] [CrossRef] [Scilit]
  7. Ashby, M.F. Materials Selection—The Basics. In Materials Selection in Mechanical Design; Butterworth-Heinemann: Oxford, UK, 2011; pp. 97–124. [Google Scholar]
  8. Kenel, C.; Casati, N.P.; Dunand, D.C. 3D Ink-Extrusion Additive Manufacturing of CoCrFeNi High-Entropy Alloy Micro-Lattices. Nat. Commun. 2019, 10, 904. [Google Scholar] [CrossRef] [Scilit] [PubMed]
  9. Tong, Z.; Ren, X.; Jiao, J.; Zhou, W.; Ren, Y.; Ye, Y.; Larson, E.A.; Gu, J. Laser Additive Manufacturing of FeCrCoMnNi High-Entropy Alloy: Effect of Heat Treatment on Microstructure, Residual Stress and Mechanical Property. J. Alloys Compd. 2019, 785, 1144–1159. [Google Scholar] [CrossRef] [Scilit]
  10. Arif, Z.U.; Khalid, M.Y.; ur Rehman, E. Laser-Aided Additive Manufacturing of High Entropy Alloys: Processes, Properties, and Emerging Applications. J. Manuf. Process. 2022, 78, 131–171. [Google Scholar] [CrossRef] [Scilit]
  11. Ron, T.; Shirizly, A.; Aghion, E. Additive Manufacturing Technologies of High Entropy Alloys (HEA): Review and Prospects. Materials 2023, 16, 2454. [Google Scholar] [CrossRef] [Scilit] [PubMed]
  12. Dass, A.; Moridi, A. State of the Art in Directed Energy Deposition: From Additive Manufacturing to Materials Design. Coatings 2019, 9, 418. [Google Scholar] [CrossRef] [Scilit]
  13. Ladani, L.; Sadeghilaridjani, M. Review of Powder Bed Fusion Additive Manufacturing for Metals. Metals 2021, 11, 1391. [Google Scholar] [CrossRef] [Scilit]
  14. Liu, C.; Dong, F.; Zhang, Y.; Yuan, X.; Wang, B.; Luo, L.; Su, Y.; Cheng, J.; Liaw, P.K. Morphology, Microstructure, and Mechanical Properties of TiZrTa0.7NbMo Refractory High-Entropy Alloy Spherical Powder Prepared by Ultrasonic Atomization. Intermetallics 2025, 187, 109019. [Google Scholar] [CrossRef] [Scilit]
  15. Yarlapati, A.; Aditya, Y.N.; Kumar, D.; Vikram, R.J.; Yadav, M.K.; Reddy, K.S.; Prashanth, K.G. Recent Advances in Additive Manufacturing of Refractory High Entropy Alloys (RHEAs): A Critical Review. J. Alloys Metall. Syst. 2024, 8, 100120. [Google Scholar] [CrossRef] [Scilit]
  16. Niraula, S.; Dodge, B.S.; Gillham, J.D.; Berfield, T.A. Interfacial Strength Testing of Laser Powder Bed Fusion Metal Samples Produced Using the Multi-Material Binning Method. J. Manuf. Mater. Process. 2025, 9, 327. [Google Scholar] [CrossRef] [Scilit]
  17. Olejarz, A.; Huo, W.Y.; Zieliński, M.; Diduszko, R.; Wyszkowska, E.; Kosińska, A.; Kalita, D.; Jóźwik, I.; Chmielewski, M.; Fang, F.; et al. Microstructure and Mechanical Properties of Mechanically-Alloyed CoCrFeNi High-Entropy Alloys Using Low Ball-to-Powder Ratio. J. Alloys Compd. 2023, 938, 168196. [Google Scholar] [CrossRef] [Scilit]
  18. Mo, Z.-J.; Hao, Z.-H.; Deng, J.-Z.; Shen, J.; Li, L.; Wu, J.-F.; Hu, F.-X.; Sun, J.-R.; Shen, B.-G. Observation of Giant Magnetocaloric Effect under Low Magnetic Field in Eu1−xBaxTiO3. J. Alloys Compd. 2017, 694, 235–240. [Google Scholar] [CrossRef] [Scilit]
  19. Rao, K.R.; Sinha, S.K. Effect of Sintering Temperature on Microstructural and Mechanical Properties of SPS Processed CoCrCuFeNi Based ODS High Entropy Alloy. Mater. Chem. Phys. 2020, 256, 123709. [Google Scholar] [CrossRef] [Scilit]
  20. Kovalev, D.Y.; Kochetov, N.; Chuev, I. Fabrication of High-Entropy Carbide (TiZrHfTaNb) C by High-Energy Ball Milling. Ceram. Int. 2021, 47, 32626–32633. [Google Scholar] [CrossRef] [Scilit]
  21. Yang, C.-C.; Chau, J.L.H.; Weng, C.-J.; Chen, C.-S.; Chou, Y.-H. Preparation of High-Entropy AlCoCrCuFeNiSi Alloy Powders by Gas Atomization Process. Mater. Chem. Phys. 2017, 202, 151–158. [Google Scholar] [CrossRef] [Scilit]
  22. Kassym, K.; Perveen, A. Atomization Processes of Metal Powders for 3D Printing. Mater. Today Proc. 2020, 26, 1727–1733. [Google Scholar] [CrossRef] [Scilit]
  23. Singh, D.; Koria, S.; Dube, R. Study of Free Fall Gas Atomisation of Liquid Metals to Produce Powder. Powder Metall. 2001, 44, 177–184. [Google Scholar] [CrossRef] [Scilit]
  24. Seki, Y.; Okamoto, S.; Takigawa, H.; Kawai, N. Effect of Atomization Variables on Powder Characteristics in the High-Pressured Water Atomization Process. Met. Powder Rep. 1990, 45, 38–40. [Google Scholar] [CrossRef] [Scilit]
  25. Zavdoveev, A.; Zrodowski, Ł.; Vedel, D.; Cortes, P.; Choma, T.; Ostrysz, M.; Stasiuk, O.; Baudin, T.; Klapatyuk, A.; Gaivoronskiy, A.; et al. Atomization of the Fe-Rich MnNiCoCr High-Entropy Alloy for Spherical Powder Production. Mater. Lett. 2024, 363, 136240. [Google Scholar] [CrossRef] [Scilit]
  26. Żrodowski, Ł.; Wróblewski, R.; Choma, T.; Morończyk, B.; Ostrysz, M.; Leonowicz, M.; Łacisz, W.; Błyskun, P.; Wróbel, J.S.; Cieślak, G.; et al. Novel Cold Crucible Ultrasonic Atomization Powder Production Method for 3D Printing. Materials 2021, 14, 2541. [Google Scholar] [CrossRef] [Scilit] [PubMed]
  27. Pohlman, R.; Heisler, K.; Cichos, M. Powdering Aluminium and Aluminium Alloys by Ultrasound. Ultrasonics 1974, 12, 11–15. [Google Scholar] [CrossRef] [Scilit]
  28. Kustron, P.; Korzeniowski, M.; Sajbura, A.; Piwowarczyk, T.; Kaczynski, P.; Sokolowski, P. Development of High-Power Ultrasonic System Dedicated to Metal Powder Atomization. Appl. Sci. 2023, 13, 8984. [Google Scholar] [CrossRef] [Scilit]
  29. Kudo, T.; Sekiguchi, K.; Sankoda, K.; Namiki, N.; Nii, S. Effect of Ultrasonic Frequency on Size Distributions of Nanosized Mist Generated by Ultrasonic Atomization. Ultrason. Sonochem. 2017, 37, 16–22. [Google Scholar] [CrossRef] [Scilit] [PubMed]
  30. Deepu, P.; Peng, C.; Moghaddam, S. Dynamics of Ultrasonic Atomization of Droplets. Exp. Therm. Fluid Sci. 2018, 92, 243–247. [Google Scholar] [CrossRef] [Scilit]
  31. Wisutmethangoon, S.; Plookphol, T.; Sungkhaphaitoon, P. Production of SAC305 Powder by Ultrasonic Atomization. Powder Technol. 2011, 209, 105–111. [Google Scholar] [CrossRef] [Scilit]
  32. Khan, S.A.; Sereshk, M.R.V.; Nelson, B.D. Comprehensive Analysis of FeMn Powder Fabricated Using Ultrasonic Atomization Technique. Powder Technol. 2025, 455, 120725. [Google Scholar] [CrossRef] [Scilit]
  33. Senkov, O.N.; Scott, J.M.; Senkova, S.V.; Meisenkothen, F.; Miracle, D.B.; Woodward, C.F. Microstructure and Elevated Temperature Properties of a Refractory TaNbHfZrTi Alloy. J. Mater. Sci. 2012, 47, 4062–4074. [Google Scholar] [CrossRef] [Scilit]
  34. Senkov, O.N.; Pilchak, A.L.; Semiatin, S.L. Effect of Cold Deformation and Annealing on the Microstructure and Tensile Properties of a HfNbTaTiZr Refractory High Entropy Alloy. Metall. Mater. Trans. A 2018, 49, 2876–2892. [Google Scholar] [CrossRef] [Scilit]
Figure 1. Depiction of the VAM system and technique employed for ingot casting. (a) Layout of VAM system used for developing ingots. (b) Casting strategy for homogenization of ingots. (c) Images during casting. (d) Raw material layout in the crucible as each layer is added.
Powders 05 00025 g001
Figure 2. Depiction of the UPA system and technique employed for powder development. (a) Layout of UPA system used for powder development. (b) General mechanics for ultrasonic atomization depicting the steps from droplet deposition to ejected particles.
Powders 05 00025 g002
Figure 3. EDS element mapping strategy for elemental composition characterization of the as-cast ingots, testing at 5 locations along the top and bottom of each sample.
Powders 05 00025 g003
Figure 4. Interval plots based on a 95% confidence level derived from EDS of the three ingots. (a) Interval plots for side × element interactions. (b) Interval plots for sample × element interactions. (c) Interval plots for point × element interactions. Colors correspond to each element.
Powders 05 00025 g004
Figure 5. Interval plot based on a 95% confidence level developed from EDS of the three powder size ranges. Colors correspond to each element.
Powders 05 00025 g005
Figure 6. EDS mapping across the three size ranges, 15–63 µm, 63–125 µm, and 125–250 µm along with SEM over the entire range, 15–250 µm.
Powders 05 00025 g006
Figure 7. XRD pattern for three arbitrary locations within the 15–250 µm powder sample. Colors correspond to each area scanned.
Powders 05 00025 g007
Figure 8. Interval plots based on a 95% confidence level derived from micro-CT of the three powder size ranges. (a) Interval plot for powder size range effect on % porosity. (b) Interval plot for powder size range effect on sphericity. Colors correspond to each size range.
Powders 05 00025 g008
Figure 9. Micro-CT scans across the size ranges of powder 15–63 µm, 63–125 µm, and 125–250 µm with the red dashes encapsulating higher magnification images.
Powders 05 00025 g009
Table 1. Identification of at.% for each sample and orientation.
SampleMean at.% TiMean at.% ZrMean at.% NbMean at.% HfMean at.% Ta
1-Bottom23.04 ± 1.8023.02 ± 3.5717.34 ± 1.5620.30 ± 2.2316.29 ± 1.19
1-Top18.87 ± 1.0223.29 ± 0.9115.64 ± 1.6024.03 ± 2.3418.17 ± 1.41
2-Bottom20.98 ± 0.7722.84 ± 0.7319.07 ± 1.0219.65 ± 0.6917.45 ± 0.62
2-Top18.02 ± 1.1023.12 ± 1.6515.92 ± 1.6326.59 ± 2.4616.20 ± 1.71
3-Bottom22.64 ± 3.97 23.70 ± 1.8217.78 ± 1.0420.22 ± 1.3815.66 ± 0.91
3-Top20.74 ± 2.1023.66 ± 1.2817.51 ± 0.6022.35 ± 0.9615.73 ± 0.90
Table 2. Identification of at.% for each size range of powder.
SizeMean at.% TiMean at.% ZrMean at.% NbMean at.% HfMean at.% Ta
15–63 μm24.60 ± 1.9422.18 ± 0.7015.29 ± 0.1323.61 ± 0.7214.33 ± 0.44
63–125 μm24.90 ± 0.3321.98 ± 0.5915.65 ± 0.2223.78 ± 0.2913.69 ± 0.63
125–250 μm26.07 ± 0.7221.97 ± 0.8315.02 ± 0.2423.65 ± 0.4113.30 ± 0.35
Table 3. Mean sphericity and % porosity for each size range of powder.
SizeMean SphericityMean % PorosityMass % Yield
15–63 µm0.93 ± 0.060.24 ± 0.2020.30
63–125 µm0.90 ± 0.100.08 ± 0.1661.91
125–250 µm0.93 ± 0.040.05 ± 0.0817.70
Disclaimer/Publisher’s Note: The statements, opinions and data contained in all publications are solely those of the individual author(s) and contributor(s) and not of MDPI and/or the editor(s). MDPI and/or the editor(s) disclaim responsibility for any injury to people or property resulting from any ideas, methods, instructions or products referred to in the content.