Article

Selective Separation of SiO2 and SnO2 Particles in the Submicron Range: Investigating Salt and Surfactant Adsorption Parameter

by
Claudia Heilmann
1,*,
Lisa Ditscherlein
1,
Martin Rudolph
2 and
Urs Alexander Peuker
1,*
1
Institute of Mechanical Process Engineering and Mineral Processing, TU Bergakademie Freiberg, 09599 Freiberg, Germany
2
Helmholtz-Zentrum Dresden-Rossendorf, Helmholtz Institute Freiberg for Ressource Technology, 09599 Freiberg, Germany
*
Authors to whom correspondence should be addressed.
Powders 2025, 4(3), 19; https://doi.org/10.3390/powders4030019
Submission received: 15 February 2025 / Revised: 15 April 2025 / Accepted: 30 April 2025 / Published: 3 July 2025

Abstract

The separation of particles smaller than 1 µm either by composition or by size is still a challenge. For the separation of SiO2 and SnO2, the creation of a selective separation feature and the specific adsorption of salts and surfactants were investigated. The adsorption of various salts, e.g., AlCl3, ZnCl2, MnCl2 and MgCl2 were therefore analyzed, and the necessary concentration for the charge reversal of the material was determined. It was noticed that the investigated materials differ in their isoelectric point (IEP) and therefore in their adsorption behavior because only ZnCl2 and MgCl2 are suitable for a charge reversal of both metal oxides. The phase transfer of the pure material at different pH values with ZnCl2 or MgCl2 and sodium dodecyl sulfate (SDS) revealed that the adsorption behavior of the particle has an influence on the phase transfer. As a result, the phase transfer of SiO2 is pH dependent, whereas the phase transfer of SnO2 operates over a wider pH range. This allowed the separation of SiO2 and SnO2 to be controlled by the salt and surfactant concentration as well as pH. The separation of SiO2 and SnO2 was investigated for various parameters such as salt and surfactant concentration, particle concentration and composition of the mixture. Also, pH 8, where a selective phase transfer for SiO2 occurs, and pH 6, where the greatest difference between the materials exists, were also investigated. By comparing the parameters, it was found that the combination of ZnCl2/SDS and MgCl2/SDS enables a selective separation of the materials. Furthermore, it was also found that the concentration of SDS has a significant effect on the separation, as the formation of a bilayer structure is important for the separation, and therefore, higher SDS concentrations are required at higher particle concentrations to increase the separation efficiency.

1. Introduction

To separate particles, various physical or chemical separation methods can be used [1]. The various separation methods address different properties, such as density [2], size [3,4,5], wetting properties [3] or magnetic properties [6]. The possibility of separating ultrafine or submicron particles is very limited, as the selectivity of many separation methods fails at these sizes [3,5,7]. For example, in separation processes where the density properties of the materials are addressed, the separation loses its selectivity at sizes below 30 µm to 10 µm [7], since drag effects become dominant compared to inertia effects. As the particle size decreases, the selectivity-generating forces become less effective compared to the contribution of the flow field of the surrounding medium and the particles follow the streamlines as a collective. This prevents any separation effects, e.g., by size, shape or composition. For this reason, several new approaches, which are able to overcome the problem, have recently been investigated to separate particles smaller than 10 µm; for example, the minimum of floatability is reached at a particle size in the lower micrometer range between 3 µm and 5 µm [3,5,8,9]. Nanoparticles can also be transferred from one phase to the other in a centrifugal field. However, it was noted that the sedimentation of the particles during centrifugation prevents the transfer to the organic phase [10]. For a liquid–liquid extraction, it is also possible to transfer particles in the nanoparticle range to the other phase [10,11,12,13,14]. In order to separate particles with this process, the particles would have to differ greatly in their wetting properties.
In flotation and liquid–liquid extraction, particle separation is bases on physical and chemical surface properties [1,15,16,17]. In both cases, only hydrophobic particles can attach to the gas bubble or oil droplet and thus be separated, while hydrophilic particles remain in the aqueous phase [1,18].
In order to hydrophobize particles, amphiphilic molecules, i.e., surfactants, are used to adsorb to the particle surface, which are known as collectors. As the surfactants do not adsorb to a specific surface [19,20], the activation of the particle surface is needed [21,22]. For example, various salts containing Ca2+, Mg2+ or Pb2+ ions are used as activators in the collector flotation of cassiterite [21,23,24,25,26]. A correlation was established between the formation of the hydrolyzed species and the floatability [27,28]. Unfortunately, a typical gangue material like quartz is also activated [21,24], which makes separation more difficult, as the particles should differ in their wettability [3,9]; therefore, the activation of the chosen particle surfaces needs to be investigated in detail.
Advantageous is that the salts differ in their ability to adsorb. Indifferent electrolytes like NaCl or KCl cannot adsorb on the particle surface and lead to a compression of the electrochemical double layer (EDL) as the concentration increases, whereas multivalent ions adsorb in the Stern layer close to the particle surface, and can even generate a charge reversal [29,30]. The higher the valence of the cation, the more effective the charge reversal effect [29,30,31,32]. When investigating the adsorption of various salts on different materials, it is found that the hydrolyzed salt ions can adsorb. But for the adsorption, only a pH window can be used [33]. The adsorption of ions on the surface can be quantified using the zeta potential ζ, as the ions adsorb in the Stern layer, which has an influence on the movement of particles in an electric field, and can be determined, for example, by using electrophoretic mobility µe [22,29,30,31]. It is also recognized that some materials differ in terms of adsorption. With SiO2, a charge reversal is only possible at pH values at which the hydrolyzed species was formed, while with SnO2 a charge reversal was possible over a larger pH value range. It was recognized that only the hydrolyzed species of the salt-cations can adsorb on materials such as SiO2, whereas other species, in addition to the hydrolyzed species, can adsorb on SnO2 [12]. This can be used to create a separating feature.
With SiO2, Weber et al. [22] have shown that AlCl3 at pH 4.1 and ZnCl2 at pH 8.2 can achieve a charge reversal of the particles. With AlCl3, a steady increase in electrophoretic mobility µe was recognized until a change in its sign occurred. Further addition showed an additional increase in µe, indicating that adsorption in the Stern layer was not yet complete. A different behavior was shown by ZnCl2, where a decrease in electrophoretic mobility µe was initially observed upon addition of the salt, indicating that a mobile ionic species was adsorbed in the Stern layer and that surface conductivity was also present in the Stern layer [22,34]. This was followed by an increase in the electrophoretic mobility µe until a change in sign occurred. AlCl3 and ZnCl2 required similar concentrations around 0.1 mM for the charge reversal of SiO2 [22]. Furthermore, charge reversal can also be achieved by surfactants [29,35] and polyelectrolytes [29] as well. In the case of surfactants, charge reversal is achieved by the formation of a bilayer, as the negative head group adsorbs to the particle surface (first layer) and faces outwards (second layer) [19].
Within the work of Weber et al. [22], they also showed that the adsorption of SDS can occur after a successful charge reversal with AlCl3, which was recognized by a further change in the sign of µe. The mobility of the particles determined by electrophoresis is related to the zeta potential for κa >> 1, via the following Helmholtz–Smoluchowski Equation (1) [34,36]:
µ e = ε 0 ε ζ η .
The electrophoretic mobility µe is related to the zeta potential via ε , the dielectric constant of the solution, ε 0 , the permittivity of vacuum, and η, the viscosity of the liquid.
Finally, in the work of Weber et al. [22], n-hexane was used to check whether the adsorption of SDS was sufficient to achieve a phase transfer of SiO2. AlCl3, ZnCl2 and CaCl2 were tested with the same amount of SDS. Phase transfer was possible in a pH range from 4 to 9.5 for AlCl3, with the highest amount being transferred at pH 4, and this decreased with increasing pH. With ZnCl2, a small amount of particles could always be transferred into the organic phase over the selected pH range. In comparison, all particles remained in the aqueous phase in the experiments with CaCl2, as no formation of the hydrolyzed species took place in the selected pH range. This shows that charge reversal is essential for the adsorption of SDS in order to achieve the phase transfer of the particles.
The transfer of particles into the interface and into the other phase depends on several parameters. On the one hand, the wettability, size and shape of the particles have an influence and, on the other hand, the hydrophobicity or hydrophilicity of the liquids and the interfacial tension between the liquids play a decisive role. This can be summarized in the following equation of free energy of detachment ∆dG [1,18]:
d G = π r 2 γ O W 1 ± c o s θ O W 2 .
The γOW stands for the interfacial tension of the liquids, r for the particle radius and θOW for the wettability of the particles. The contact angles reflect the wettability of the particles. If the contact angle is less than 90°, the particles are hydrophilic; if the contact angle is greater than 90°, the particles are hydrophobic [1,18].
Figure 1 shows that it is easier for smaller particles with the same wettability to enter the interface and they require less energy to pass into the other phase. Thus, as the particle radius increases, the probability of entering the other phase decreases because either the energy is not sufficient to enter the interface, or the particle is too stable in the interface. In addition, separation into the organic phase is more favorable for hydrophobic materials than for hydrophilic ones.
In order to achieve particle separation, the selectively adsorbed metal ion can be used to form a bridge between the negatively charged particle surface and the anionic surfactant [12], creating a separation feature [37], which is characteristic of the material composition of a particle. However, as soon as a charge reversal takes place selectively on only one material, the hetero-agglomeration of the materials, which occurs between differently charged materials, has to be taken into account, which has a negative effect on the separation result [33,38]. In the case of separation by extraction, a distinction can be made between positive separation, where the target product is transferred to the concentrate/extract, and negative separation, where the target product remains as a residue in the raffinate. The liquid–liquid extraction is used to find an approach to separate the tin source (SnO2) from the gangue material quartz (SiO2). The influence of different salts and the surfactant SDS on the charge reversal of the particles is investigated. Furthermore, the separation of the metal oxides is analyzed under different parameters to determine the selectivity and the limitations of this approach. In order to be able to apply the approach later in industry, the process could be transferred to a continuous process, such as in a separation column [39].

2. Materials and Methods

For the experiments, two metal oxides, SiO2 (SFP-20M and SFP-30M from Denka, Tokyo, Japan) and SnO2 (from Carl Roth, Karlsruhe, Germany, >99.5%), were selected. NaCl (>99.0%) was obtained from Carl Roth (Germany). ZnCl2 was purchased from Merck (Darmstadt, Germany, >99.0%), AlCl3·6H2O (99.9%), MgCl2 (>99.0%) and MnCl2·4H2O (99.9%) were obtained from Carl Roth, Germany. The salts were utilized for the charge reversal of both metal oxides and the anionic surfactant SDS obtained from Carl Roth (Germany) with a purity of >99.0% was used for the hydrophobization of the particles. n-Hexane (from Carl Roth, Germany, >99.0%) was selected as the oil phase for the liquid–liquid extraction experiments. The chemicals used in the experiments were utilized without further processing. Only SnO2 was washed with 1 mM NaCl solution and MilliQ water (PURELAB® Ultra, ELGA LabWater, Celle, Germany). All solutions were prepared with MilliQ water. For the experiments where the Zetasizer Nano ZS was used, the solutions were made with MilliQ water (MilliQ RefA+, Merck, Germany).

2.1. Particle Characterization

SiO2 SFP-20M and SnO2 were characterized by different methods. The following Figure 2 shows TEM images of the metal oxides. It becomes obvious that the particles shown fulfill the requirements of being smaller than 1 µm. However, it is also apparent that the particles differ in shape.

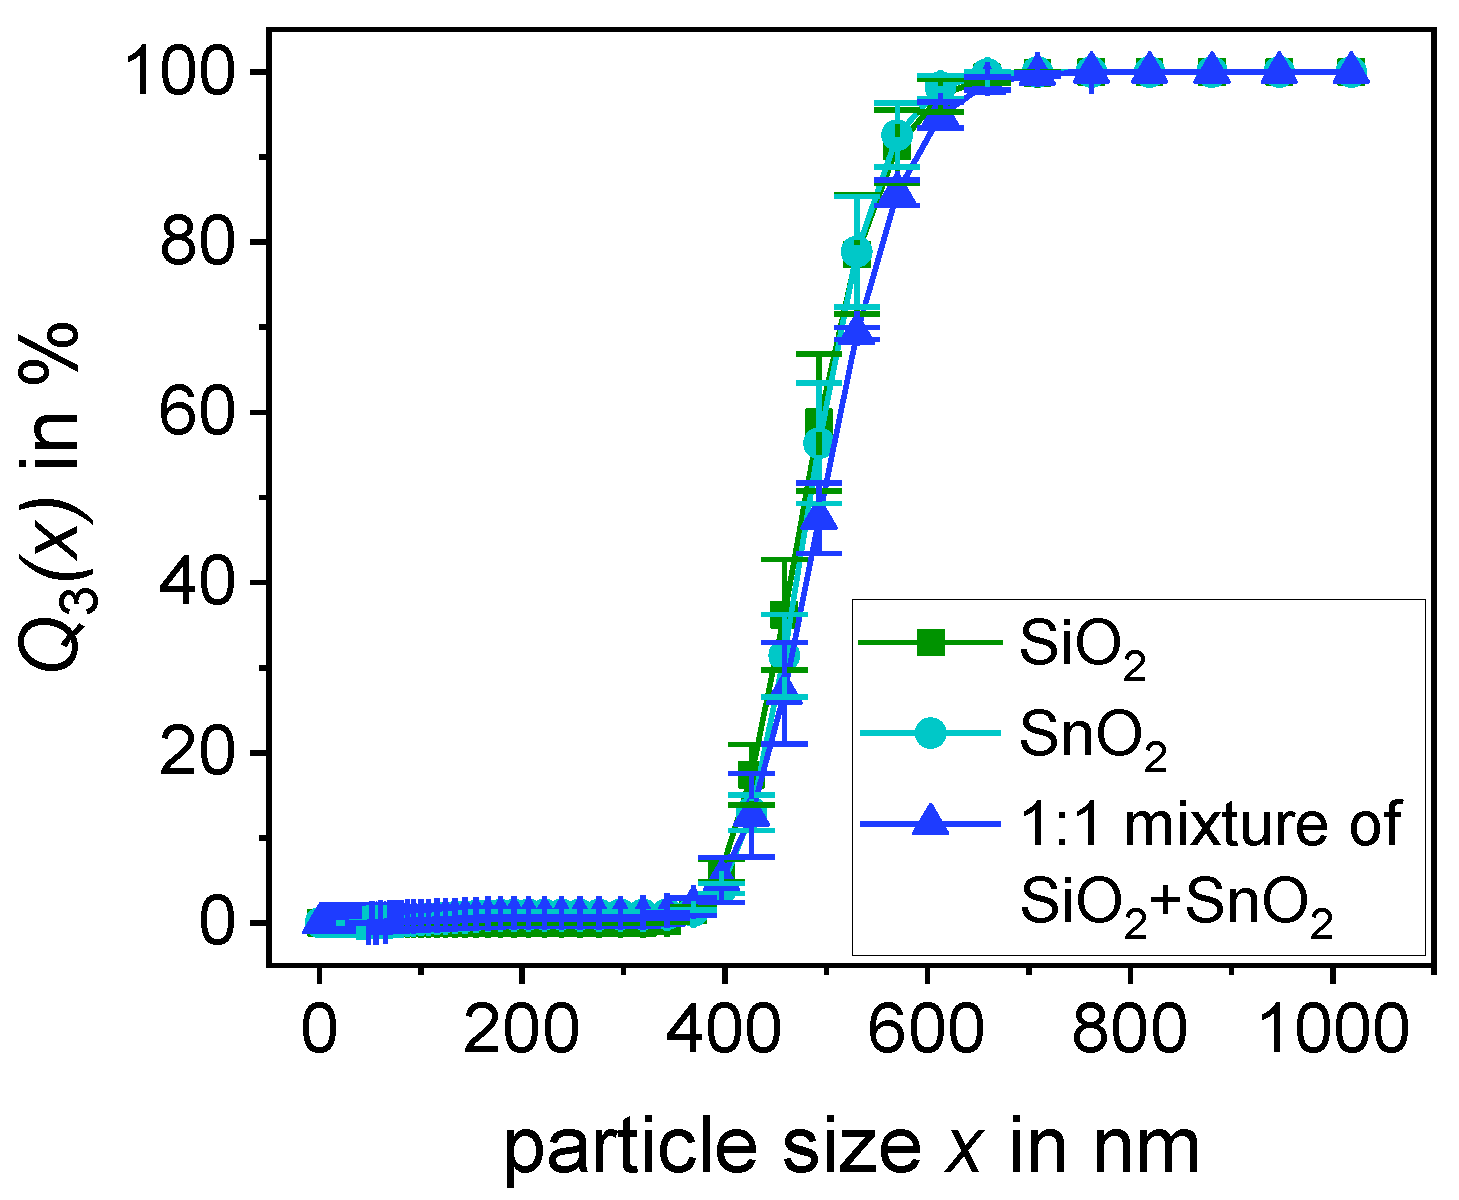
2.1.1. Particle Size Distribution

The particle size was determined in an aqueous solution using dynamic light scattering (DLS) using the Nanophox (Sympatec, Clausthal-Zellerfeld, Germany). TNPP with a mass concentration of 1 g/L was used to stabilize the particles. The particles were added to the TNPP solution and dispersed with the sonotrode (SONOPULS with type UW 2200, BANDELIN electronic GmbH & Co. KG, Berlin, Germany) for 2 min at 50%. A sample was then placed in a measuring cuvette and measured for 120 s. The particles were measured three times. The particle size distributions for the different metal oxides and the 1:1 mixture of SiO2, SFP-20M and SnO2 are summarized in Figure 3 below.
Figure 3 shows that the two metal oxides used, SiO2 SFP-20M and SnO2, do not differ significantly from each other. As a result, the particle size distribution of the 1:1 mixture of SiO2 and SnO2 does not differ from that of the pure materials. This can also be seen in the following Table 1 using the x10, x50 and x90 values.
As can be seen from Table 1, the 1:1 mixture of SnO2 and SiO2 is slightly coarser, which can be explained by the fact that the particles agglomerate faster than the pure materials due to the different charges. According to Weber et al. [22], the SiO2 SFP-30M used has a particle size between 0.1 and 2 µm with a mean diameter of 0.6 µm and is therefore coarser than the SiO2 SFP 20M, which was preferred.

2.1.2. Determination of the Specific Surface Area According to BET SBET

The specific surface area of the metal oxides was determined using Gemini VII (Micromeritics GmbH, Unterschleißheim, Germany) with the Gemini VII Version 5.00 software. Before starting the measurement, the samples were heated at 200 °C under vacuum. After heating, the mass of the sample was measured. The specific surface areas of three samples were determined in order to calculate an average and a standard deviation. For the mixture, equal amounts of SiO2 SFP-20M and SnO2 were weighed, mixed and then divided using a sample divider. The values obtained are summarized in Table 2 below.

2.1.3. Calculation of the Concentration Needed to Cover the Particles with the Different Ions and SDS

The size of the ions is important in order to calculate the quantity of ions required to completely cover the particles. Effective ion radii [40,41,42,43], ion radii in the crystal [44] and atomic radii [42] of the metals can be found in the literature. The method used to determine the ion radii, which was used for further calculations, is X-ray diffraction, in which an electron density distribution is obtained [43]. The minimum of the electron density distributions between the anions and cations under investigation is used as the limit for the calculation, for which the ionic radius of the anion or cation must also be known [42,43]. For the calculation of the ion radii, F- = 1.19 Å was used as a reference, so that the ion radii are related to this [43,45]. Please note that the radii used were determined with F- as a reference.
The ionic radius depends on the element, the charge and the coordination number (CN). The parameters important for the calculation, such CN, ion radius and the molar mass are summarized in the following Table 3 for the ions used. Since the metal ions in the water are differently coordinated, the corresponding ionic radii of the respective coordination numbers were used for the calculations.
The specific surface areas assumed for the metal ions were calculated using the ion radii in Table 3. The specific surface area according to BET SBET, which corresponds to Sm, was used as the basis for the calculated particle coverage. The equations for the calculation for the ions are shown below. First, the number of molecules for 1 g of metal oxide was calculated. This requires the area of the ions AIon.
M o l e c u l e s   p e r   g   m e t a l   o x i d e = S B E T A I o n
The molecules per g metal oxide are given in g−1.
A m o u n t   o f   I o n s = M I o n N A   ·   M o l e c u l e s   p e r   g   m e t a l   o x i d e ,
with NA = 6.022·1023 mol−1 as the Avogadro constant.
Table 4 summarizes the calculated amounts in mg required to cover 1 g of particles. The standard deviations result from the fact that the BET specific surface area was determined three times. The specific amounts were then calculated for each value to obtain a mean and a standard deviation.
By calculating the amount required to cover 1 g of particles entirely, it becomes clear that the BET of the materials has a major influence, and a higher quantity is always required for SiO2 than for SnO2. The mixture provides the approximate mean value of the required quantities of SiO2 and SnO2. Furthermore, the molar mass and the ionic radius have a major influence. Although Zn2+ and Mg2+ have a similar ionic radius but the molar mass of Zn2+ with 65.4 g/mol differs strongly from Mg2+ with 24.3 g/mol. This explains the large deviation in the required amounts, which is especially true for the molar mass of the SDS used rather than the actual adsorbing sulfate ion.

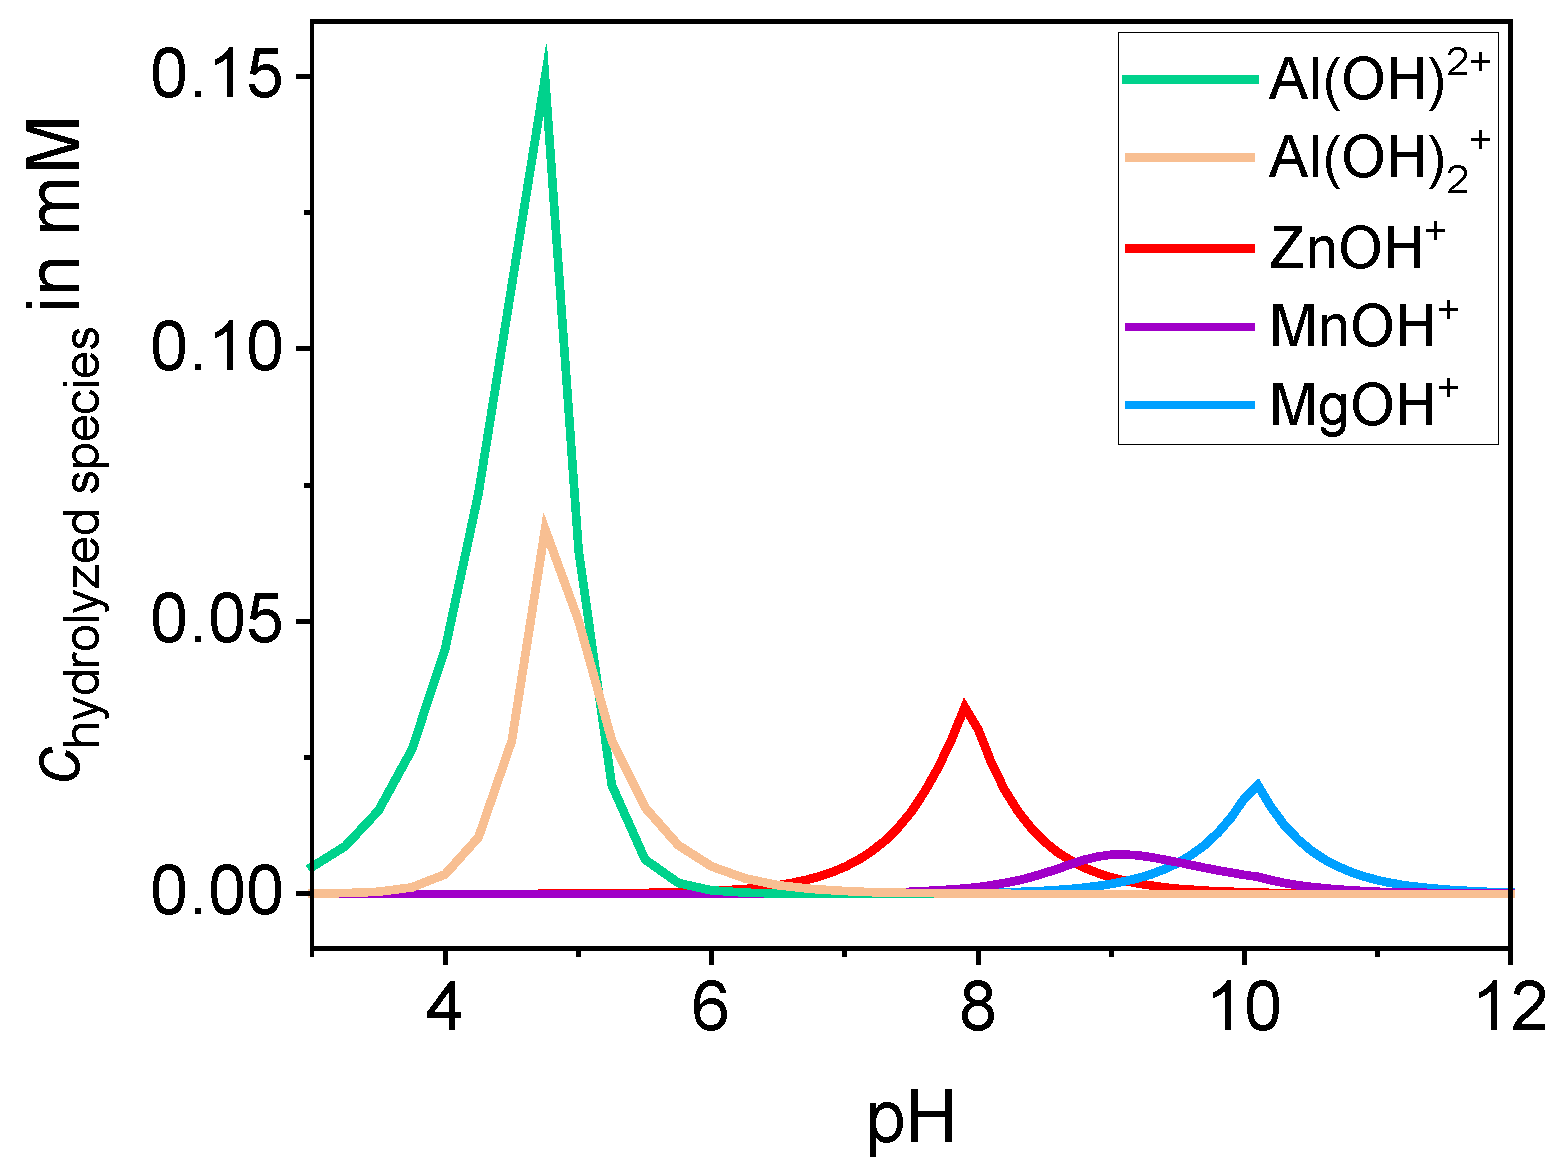
2.2. Formation of the Hydrolyzed Species

With the aid of the software ChemEQL V3.1 [46], different salts were investigated to determine the occurrence of the hydrolyzed species. For each salt, the formation of the hydrolyzed species differs with regard to pH value and concentration. A starting concentration of 0.5 mM was used for each salt. The formation of the main and positively charged hydrolyzed species for all investigated salts are shown in Figure 4.
The maximum concentration of the hydrolyzed species for Al3+ occurs between pH 4.1 and 4.5, for Zn2+ around pH 8, for Mn2+ the maximum is at pH 9 and for Mg2+ the maximum occurs at pH 10. This means that different salts are available at different pH values for a possible charge reversal of the target particle systems.

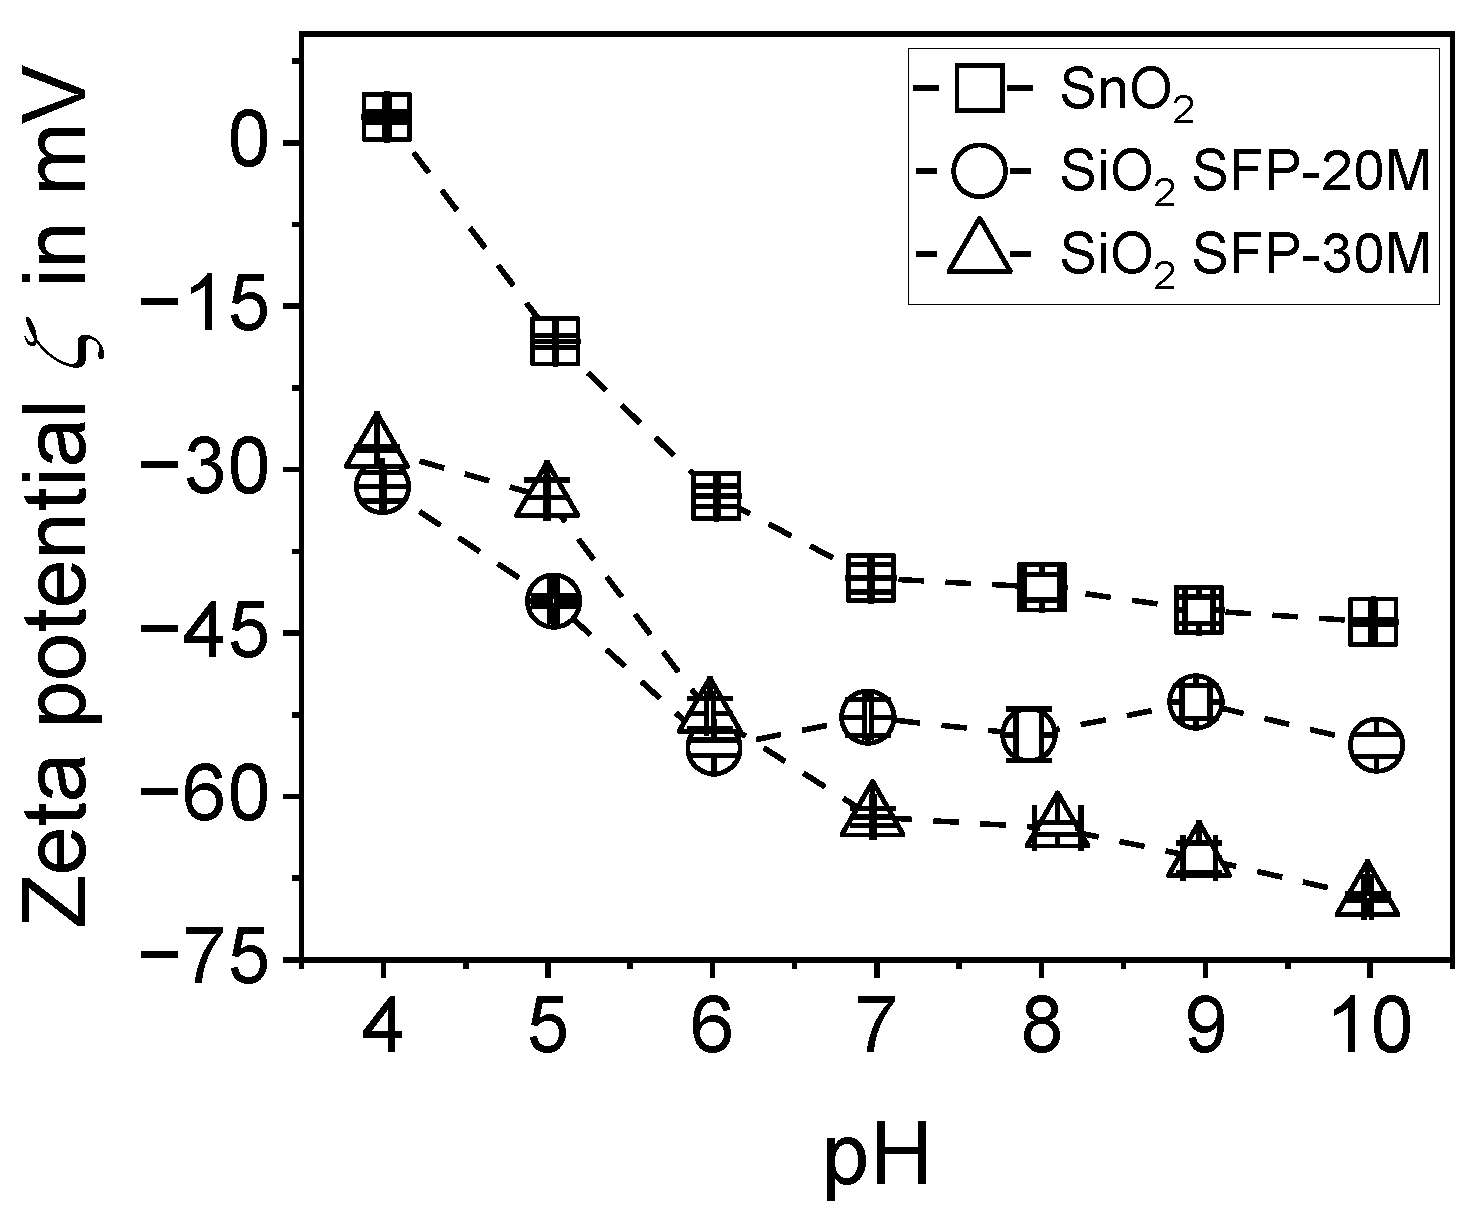
2.3. Determination of the Zeta Potential ζ via Electroacoustic Measurements

For the determination of the zeta-potential ζ, the AcoustoSizer II (Colloidal Dynamics LLC, Ponte Vedra Beach, FL, USA) is used. The metal oxide was added to a 150 mL 1 mM NaCl solution and dispersed with a sonotrode (SONOPULS with type UW 2200, BANDELIN electronic GmbH & Co. KG, Berlin, Germany). To ensure that the adsorption of the hydrolyzed metal cations can be investigated, the indifferent electrolyte NaCl is used as a background electrolyte. For this reason, the chlorides of the metal cations were used as salts. The suspension was then transferred to a storage vessel. The stirrer (MINISTAR 20 digital, IKA, Staufen, Germany) was used to prevent the sedimentation of the sample and mixing. The pump (MasterFlex™ L/S modular precision pumping systems, Cole-Parmer™, Vernon Hills, IL, USA) was used to transfer the sample to the ESA sensor.
Different amounts of salt solution were added to determine charge reversal. The acid HCl and the base NaOH were chosen to correspond to the NaCl. The acid and the base were used at a concentration of 0.1 M or 1 M to adjust the pH value. Three measurements were made for each salt concentration, and the average value was calculated. The zeta potential ζ according to Smoluchowski was used for the evaluation.

2.4. Determination of the Zeta Potential ζ via Electrophoresis Measurements

A 1 mmol/L (mM) NaCl solution was used as the background electrolyte. First, the particles were dispersed in the electrolyte for 2 min using a sonotrode (SONOPULS with type UW 2200, BANDELIN electronic GmbH & Co. KG, Berlin, Germany). The suspension was then transferred to a double-walled beaker and tempered to 25 °C while stirring with the ECO RE 415 thermostat (Lauda, Germany). The samples were then measured in folded capillary cells (DTS1070) at 25 °C in the Zetasizer Nano ZS (Malvern, Germany). The measurement was performed with 25–100 sub-runs and a drive voltage of 40 V. Each data point consists of 3 measurements, and an average and a standard deviation could be determined from these. The zeta potential according to Helmholtz–Smoluchowski was used for the evaluation. The pH values for the pH titrations were adjusted with 1 M or 0.1 M of NaOH or HCl and carried out in a range from pH 4 to pH 10. For the pH titrations with the salts, an initial concentration of salt was set and then the pH values were adjusted also with 1 M or 0.1 M of NaOH or HCl and carried out in a range from pH 4 to pH 10.
Figure 5 shows the pH titration of SiO2 SFP-20M, SFP-30M and SnO2. It shows that the isoelectric point of SnO2 is close to pH 4. The isoelectric point of SiO2 could not be determined as it was not within the measuring range. The isoelectric point of SiO2 is described in the literature at below pH 3 [47].

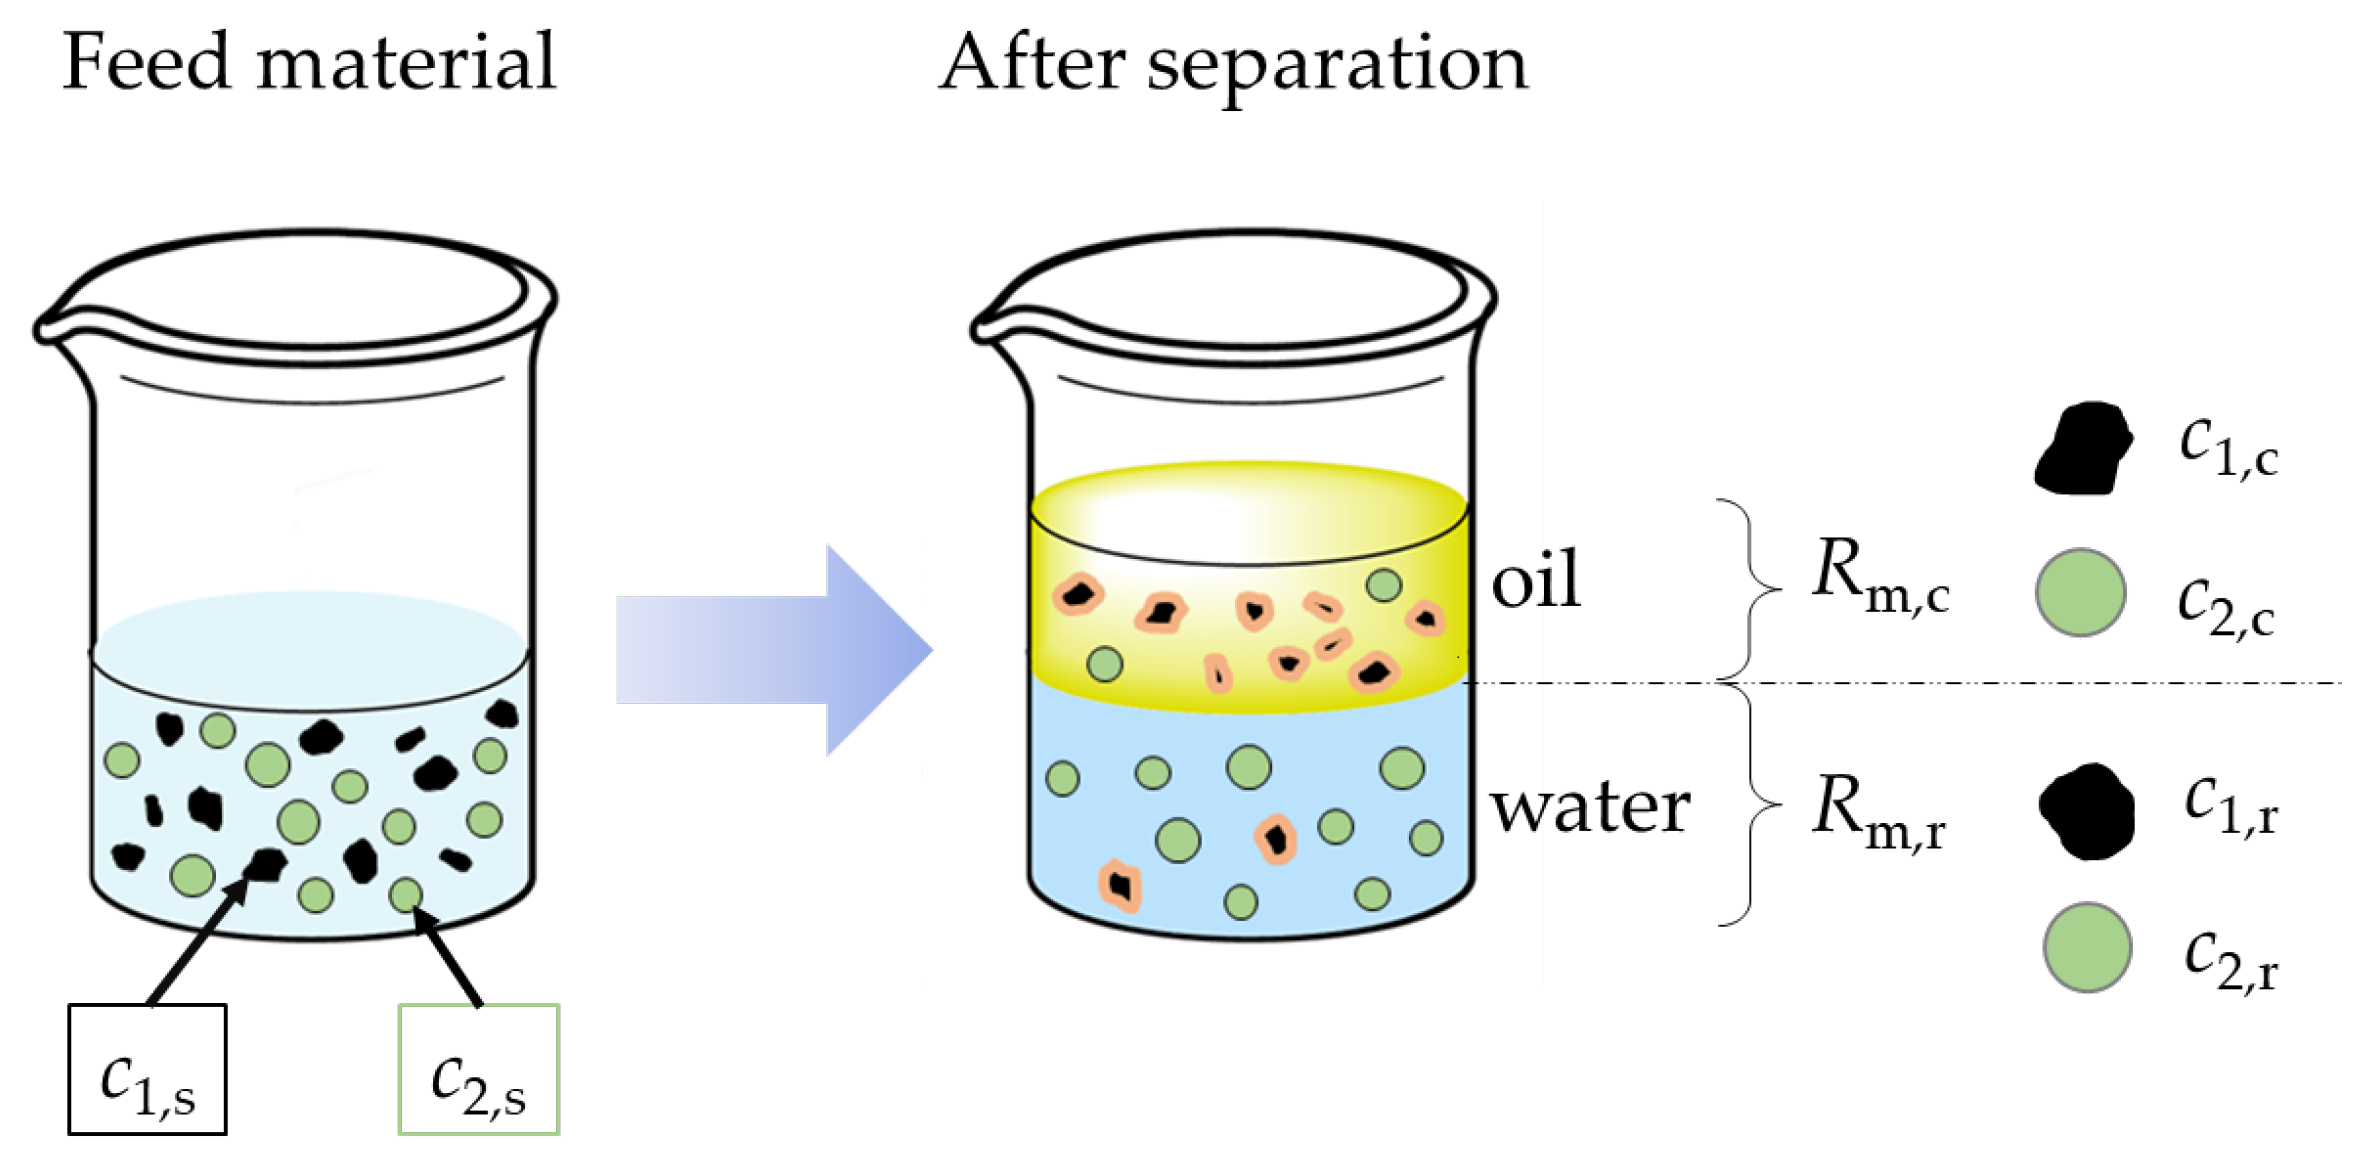
2.5. Liquid–Liquid Extraction and Separation of the Particles

The same experimental setup was used for both the liquid–liquid extraction and the separation of the particles using the liquid–liquid extraction. The liquid–liquid extraction for the pure materials is shown in Figure 6 and the separation is shown in Figure 7.
For this purpose, the particles were weighed according to the desired solids concentration of the pure materials or material mixtures, which range from 5 g/L to 20 g/L. After the addition of 150 mL MilliQ water as polar liquid, the particles were dispersed using an Ultra-Turrax from IKA (with dispersing unit S 25 N–25 F) at 6500 rpm for 5 min. While stirring the suspension, the specified amount of ZnCl2 or MgCl2 was added first, followed by SDS. The specific adsorption of the ions and thus the hydrophobization is represented by the orange contour. After the addition of all components, the pH value was adjusted with 0.1 M or 1 M HCl or NaOH. In the next step, 25 mL of non-polar liquid n-hexane for extraction was added and the phases were mixed with the Ultra-Turrax at 6500 rpm for 5 min. The difference in density between the aqueous and oil phases allows for separation in a separation funnel. The hydrophobic particles were separated with the n-hexane phase, while the hydrophilic particles remained in the aqueous phase. Due to the immiscibility and density differences between n-hexane and water, the phases and the particles in them can be separated at the interface between the phases. The mass recovery Rm was determined after drying and weighing the samples. The mass of particles that have passed into the organic phase is defined as mc (Index c for concentrate) and the mass of particles that remain in the aqueous phase is defined as mr (Index r for reject).
R m = m c m c + m r   · 100 % .
Based on previous experiments [12], the separation tests are carried out at pH 6 and pH 8. To determine the efficiency of the separation, it is important to know the composition of the particles that passed into the organic phase and the particles that remained in the aqueous phase. The grades of the individual oil phase (c1,c; c2,c) were determined using XRF. The composition of the particles remaining in the aqueous phase was calculated using the following equations, as the masses obtained were too low for XRF analysis. The mass of the metal oxide (MeO2) mMeO2,Oil/H2O in this case for SiO2 or SnO2, in the oil or aqueous phase, is calculated with the grade of the SiO2 or SnO2 cMeO2. mges,Oil describes the mass of particles that have passed into the organic phase and mges,H2O describes the mass of particles remaining in the aqueous phase. Since artificial mixtures were used, the total mass fraction of the metal oxides mMeO2,ges is known. Therefore, the remaining mass fraction in the aqueous phase mMeO2,H2O can be calculated with the determined mass fraction in the oil phase mMeO2,Oil.
m M e O 2 , O i l / H 2 O = c M e O 2 · m g e s , O i l / H 2 O ,
m M e O 2 , H 2 O = m M e O 2 , g e s m M e O 2 , O i l .
The main parameters of the evaluation are summarized in Figure 8. The grades c1,s and c2,s are the concentrations of SiO2, which obtained an index of 2 (Figure 7: green spherical particles) and SnO2 as the valuable material (Figure 7: black irregularly shaped particles), obtained an index of 1, in the supply (s). Because the mixture used is a 1:1 mixture of SiO2 and SnO2, c1,s and c2,s are 50% (m/m). Rm,c is equal to the received mass recovery of the organic phase (c—concentrate) and Rm,r is equal to the received mass recovery in the aqueous phase (r—reject) [48]. As the quantities of salt and surfactants added are negligible, the quantities are not taken into account when calculating the yield.
The following Equation (8) to Equation (9) were used for the evaluation to calculate the specific mass recoveries R1,c; R1,r; R2,c and R2,r for SnO2 (Index 1) and SiO2 (Index 2) for the reject (Index r) and the concentrate (Index c). Therefore, the concentrations (c; grades) of the materials are used in the following:
R 1 , c / r = R m , c / r c 1 , c / r c 1 , s ,
R 2 , c / r = R m , c / r 100 c 1 , c / r 100 c 1 , s .

2.6. Determination of the Material Content via XRF Measurements

For the XRF analysis, the dried samples were crushed with a porcelain mortar. The samples were then filled into sample tubes (diameter of 32 mm) sealed with a polypropylene film from analyticon instruments gmbh (Rosbach v. d. Höhe, Germany). The samples were analyzed using the handheld XRF device Niton XL5 plus (analyticon instruments gmbh, Germany). The samples were shaken after each measurement and each sample was measured five times and averaged to obtain a representative value. Since the Niton connect XRF software version 2.5.2.1589 only gives the elemental composition, the oxides were calculated using the correction factor f for Sn → SnO2 1.2695 and f for Si → SiO2 2.1393 [49]. In addition, the values were corrected using the linear equation of the calibration curve for SiO2 (y = 1.07x + 0.05) and SnO2 (y = 0.58x + 0.01) with a linear fit of R2 of 0.9969 for SnO2 and 0.9982 for SiO2. The y value represents the XRF measured metal oxide content in % (m/m) and the x value represents the theoretical content in % (m/m). The calculated x value is then used for evaluation. All values are normalized to 100% (m/m) since the compositions of the artificially prepared mixtures are known.

3. Results

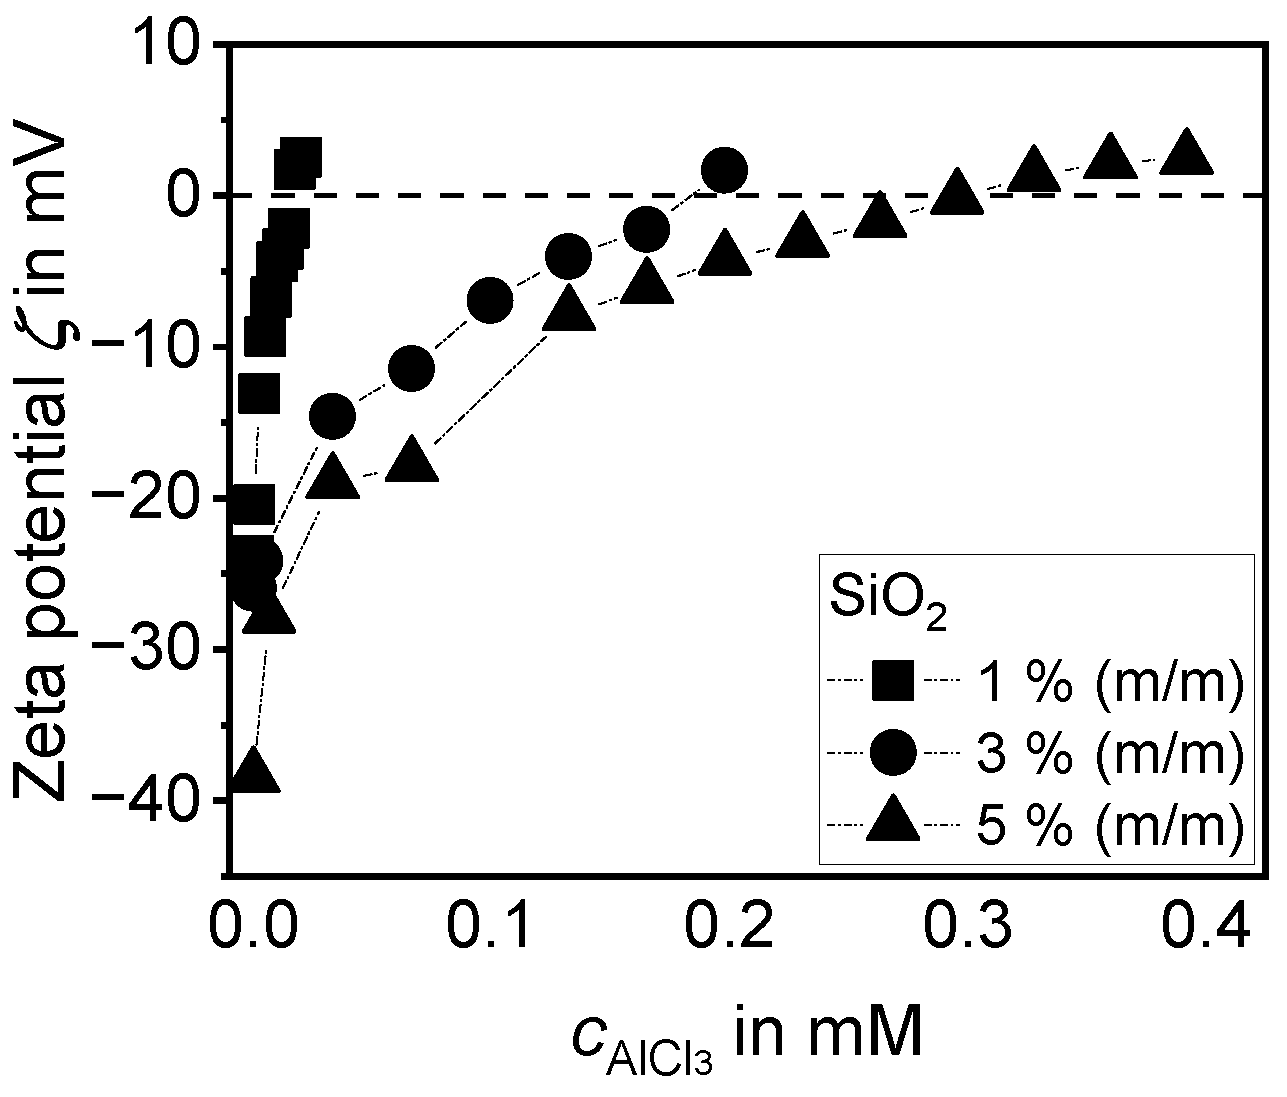
3.1. Investigations for the Charge Reversal of Particles

As shown in Figure 5, the particles are negatively charged over a wide pH range. The adsorption of ions of the selected salts changes the charge around the particle. This can be observed by the change in zeta potential as a function of ion concentration, which correlates with the occupancy of the particles. The adsorption of the salts should result in a positive sign of the zeta potential ζ. Various salts such as AlCl3, MgCl2, MnCl2 and ZnCl2 were studied for the charge reversal experiments, because they form hydrolyzed species at different pH values. For the charge reversal, pH 4 was selected for Al3+, pH 8.2 and later pH 8 for Zn2+, pH 9 for Mn2+ and pH 10 for Mg2+. This means that different salts are available at different pH values for a possible charge reversal of the target particle systems. Due to the IEP of SnO2 close to pH 4, only MgCl2, MnCl2 and ZnCl2 are suitable.
The zeta potential ζ is used to study the adsorption behavior of different salts. For the separation, only one of the materials achieves a charge reversal, while the other remains negatively charged. This can then be followed by the selective adsorption of the surfactant, in this case SDS. A second reverses of the sign of the zeta potential ζ occurs, so that it is negative. Because of this, selective hydrophobization can be achieved. This is important for creating a selective separation.

3.1.1. Investigations with the Aid of Electroacoustics

As described in Section 2.1, there are several salts that could be used for the charge reversal of the materials. First, the adsorption of AlCl3 on SiO2 was investigated at different mass concentrations of SiO2. A pH 4 according to Weber et al. [22] was selected, as this is where the hydrolyzed species can occur (Figure 4).
Figure 9 shows the dependence of the zeta potential on the addition of AlCl3 to a SiO2 SFP 30M suspension at pH 4. The zeta potential ζ initially increases rapidly when increasing of the concentration of the Al-ions. This is followed by a shallower rise, which indicates that the ions already adsorbed in the Stern layer slow down the adsorption, as the same charges interfere with each other. A charge reversal is possible for all three selected mass concentrations of SFP 30M, although the amounts of AlCl3 required are different, due to the different volume-related specific surface areas Sv. The amount of 0.11 mM was required for 1% (m/m), 0.18 mM for 3% (m/m), and 0.30 mM for 5% (m/m), however, there is no proportionality between Sv and cAlCl3.
As described in Section 2.1.2, the amount of SiO2 SPF 30M required to fully occupy the mass concentration of the particles can be calculated. This SBET for the material is 2.4 m2/g. Due to the larger ionic radii of the hydrolyzed species, a lower concentration of these ions is required to occupy the particles.
Table 5 shows the importance of knowing the ions in the solution. Unfortunately, the literature does not indicate if Al3+ can also be adsorbed or if only the two hydrolyzed species adsorb. However, the amount of Al3+ that is theoretically required for complete occupancy and is thus close to charge reversal is significantly higher than the concentration experimentally required for actual charge reversal. If the quantities of the hydrolyzed species are added together, 1% (m/m) is the approximate quantity required for charge reversal. The higher the particle concentration, the greater the difference between the theoretical and actual concentration required.
This indicates that the initial dispersion of the particles may not be sufficient and, in addition, that they are likely to agglomerate over the measurement time due to the decreasing potentials that correlate with the lower repulsion. The agglomeration increases with the increasing particle concentration.
Unfortunately, AlCl3 is not suitable for a charge reversal of SnO2 as the IEP (Figure 5), which is near pH 4, is too close to the pH of the hydrolyzed Al-species. Consequently, the SnO2 has no negative surface charges at this pH value and no adsorption of the hydrolyzed Al species would be possible. For this reason, other salts are investigated, as the salts need to form a hydrolyzed species above the IEP of the materials. Therefore, ZnCl2, MnCl2 and MgCl2 are considered.
Figure 10 shows the different charge reversal curves for SnO2 (left, empty symbols) and SiO2 (right, full symbols) for different salts for the respective pH values (Figure 4), which shows the charge reversal for SiO2 and SnO2 that only works for two of the three salts. The ChemEQL calculations also showed that the highest amount of hydrolyzed ions for ZnCl2 is produced at pH 8.2, and the formation of ZnOH2 also starts at this pH value, resulting in a precipitate.
The charge reversal of SiO2 is possible with ZnCl2 at pH 8.2 at 2.86 mM and with MgCl2 at pH 10 at 12.98 mM. Furthermore, for SnO2 at pH 8.2, a charge reversal can be achieved with 1.36 mM of ZnCl2 and at pH 10 with 0.79 mM of MgCl2. The curves are similar to the curves shown in Figure 9. It can be seen from this that SnO2 always requires lower quantities of salt than SiO2, which can be explained by the different IEPs shown in Figure 5. SiO2 has an IEP of pH < 3, which is known from the literature, while the IEP of SnO2 is close to pH 4. This results in a difference in the amount of salt required for the investigated pH values.
As described by Weber et al. [22] for SiO2 SFP 30M, all curves at SnO2 first pass through a minimum before the zeta potential increases. According to Delgado et al., this indicates the adsorption of a mobile species in the Stern layer and that surface conductivity is also present in the Stern layer [22,34]. Subsequently, the zeta potential increased rapidly with increasing ion concentration. This was followed by a shallower increase, indicating the charge already adsorbed in the Stern layer, which prevents adsorption because like charges interfere with each other. The presence of a mobile species in the Stern layer or a surface conductivity in the Stern layer could not be confirmed for SiO2 SFP 20M. A rapid increase in the zeta potential was observed for all salts, which later flattened. This indicates that ions are already adsorbed in the Stern layer and slow down the adsorption, as the same charges interfere with each other. A completely different behavior is shown in MnCl2. Initially, the hydrolyzed species adsorbs in the Stern layer, causing the zeta potential to rise. However, no charge reversal is achieved, because the MnCl2 oxidizes during the measurements, which could be seen from the brownish discoloration of the white suspension. The oxidized form reduces the amount of free MnCl2 and, therefore, the source of the hydrolyzed species and concentration also decreases. For this reason, no charge reversal is achieved, and the zeta potential starts to decrease after a while and thus shows a clear time dependency. Apparently, this phenomenon only occurs with oxides, because a charge reversal with MnCl2 at pH 9 was observed for CdS [39]. The oxidation of Mn2+ could not be prevented due to the use of metal oxides and non-degassed liquids [50]. Furthermore, it was not possible to work inertly due to the nature of the devices, i.e., oxygen was always present during the measurement. As the presence of oxidized Mn2+ on the particle surface hinders particle separation, this separation approach was rejected.
Table 6 summarizes the calculated quantity required to completely occupy the particles with ions as well as the concentrations required for the charge reversal. It is clear that a significantly lower salt concentration must be used than that theoretically calculated with the ionic radius of the salts, which is shown in Table 6. This can be explained by the agglomeration of the particles during the addition of the salts, as the value of the potential decreases, and thus the repulsion of the particles decreases. And theoretically, one would expect the theoretical concentration to be lower than the actual concentration required, since some ions are still in solution, while others are adsorbed on the particle surface.
For manganese, this was not calculated because the charge reversal did not work and in addition, there are six oxidation states with different coordination numbers, so there are too many variables for clear determination.
Since the influence of the precipitation of ZnCl2 is not known, the pH value of 8 was used for the electrophoretic measurements, which were published in Heilmann et al. [12].

3.1.2. Investigations with the Aid of Electrophoresis

Another method of determining the zeta potential ζ is electrophoresis. The difference between electrophoresis and electroacoustics is that significantly smaller quantities of particles can be used within the electrophoresis method. The influence of low particle concentrations should be investigated. These results have already been published in Weber et al. [22] and Heilmann et al. [12]. It was found that SnO2 and SiO2 differ significantly in terms of their adsorption properties. It was assumed that the charge reversal of the materials is only possible when the hydrolyzed species of the salts are formed, which occurs at pH 7–9 for Zn2+ and pH 9–11 for Mg2+, pH titrations for SnO2 and SiO2 with ZnCl2 (Figure 11, left) and with MgCl2 (Figure 11, right), which were performed and are shown below. Different initial concentrations of the salts were selected for this in order to achieve a charge reversal.
There is a clear difference between SiO2 and SnO2, particularly at pH values of 4 to 7. The reason for this is that if there are no hydrolyzed metal cations, there is no charge reversal for SiO2, whereas a charge reversal occurs for SnO2 in this pH range, because the SnO2 surface can adsorb non-hydrolyzed metal ions. This pH titration revealed that specific adsorption only occurs for SiO2 at pH 8 and pH 9, and this is mainly due to the better adsorption capacity of the hydrolyzed ZnOH+ species. For SnO2, a charge reversal also occurs at pH 8 and pH 9. The adsorption of non-hydrolyzed species explains why SnO2 at pH 8 requires significantly less ZnCl2 for a charge reversal than SiO2, as SnO2 adsorbs both hydrolyzed metal ions and non-hydrolyzed metal ions. At pH 10, Zn2+ precipitates as Zn(OH)2 and the value of the zeta potential decreases, which applies to both metal oxides.
This was also observed approximately for MgCl2 (Figure 11, right). A charge reversal could be obtained for SiO2 at a specific adsorption of the hydrolyzed MgOH+ species at pH 9 and pH 10, whereas for SnO2 a charge reversal was observed over a wider pH range due to the possibility to adsorb non-hydrolyzed species. The zeta potential of SnO2 only becomes negative at pH 8 and the concentration of the adsorbable species at this pH is insufficient to achieve charge reversal. The fact that SnO2 is well suited for the adsorption of metal cations has already been described in the literature [51]. In summary, it can be concluded that the surface of SiO2 is not suitable for the adsorption of non-hydrolyzed species compared to SnO2.

3.2. Liquid–Liquid Extraction of SiO2 and SnO2

In the adsorption experiments with electrophoresis, a further charge reversal is observed, originating from SDS on the particle surface, which already had a first charge reversal with the salt [12], allowing the hydrophobization of the particles and the quantification in the liquid–liquid extraction of the pure materials. It was assumed that similar curves would be obtained as with the pH titration in the salts, because only a recharged particle surface should allow the adsorption of the dodecyl sulfate ion (DS).
Figure 12 shows the mass recoveries Rm for the liquid–liquid extraction of SiO2 and SnO2 at different pH values. The results for ZnCl2 are shown on the left and for MgCl2 on the right. As expected, the highest yields are at pH 8 with 88.3 ± 3.4% for SiO2 and 99.0 ± 0.1% for SnO2. As already observed in the pH titration in the ZnCl2 solution, the adsorption of Zn2+ ions on the particle surface of SnO2 is also possible at pH 6. A high yield is obtained at pH 4, as the DS- ion can adsorb on the positively charged surface due to the IEP of SnO2 at approximately pH 4. In comparison, SiO2 shows a selective behavior, so that only low yields are obtained at the other pH values. The influence of the correct ZnCl2 dosage is shown by the data point at pH 8 for the selected ZnCl2 concentration of 0.1 mM, as only a concentration of 7.2 ± 1.0% was achieved for SiO2.
In the experiments with MgCl2 as a salt, the selectivity decreases, which is particularly evident with SiO2. This suggests that the adsorption of the hydrolyzed species is also possible at higher pH values. For SnO2, the liquid–liquid extraction experiments show a high yield over the entire pH range. In contrast to SnO2, SiO2 needs a significantly higher MgCl2 concentration. Because even if the MgCl2 concentration for SiO2 is used at pH 10, which was used for SnO2 (cMgCl2 = 0.25 mM), the quantity is not sufficient to achieve a charge reversal of the SiO2 particles and thus enable adsorption of SDS, because only a yield of 10.8 ± 2.9% is achieved. It was also noted that the SiO2 samples, which were mixed with a higher concentration of MgCl2 absorbed water after drying, indicate the formation of MgCl2·6H2O.
Different salt concentrations were used in the experiments in order to achieve a transfer of the particles and to demonstrate the influence of the salt concentration, the lower concentration for SiO2 was used at pH 8 for ZnCl2 and at pH 10 for MgCl2. As with the pH titration with the salts, the experiments also showed that the materials differ greatly in their adsorption behavior. This can be attributed to the ability of SnO2 to adsorb non-hydrolyzed species in addition to the hydrolyzed species. The fact that the materials used differ in their adsorption properties has the advantage that the separation can also be controlled via the pH value as well as via the amount of salt. pH 6 was chosen, as the differences in the yield and in the zeta potential were maximized at this pH value. In addition, pH 8 was also chosen to find out whether the separation can be controlled via the ZnCl2 concentration.

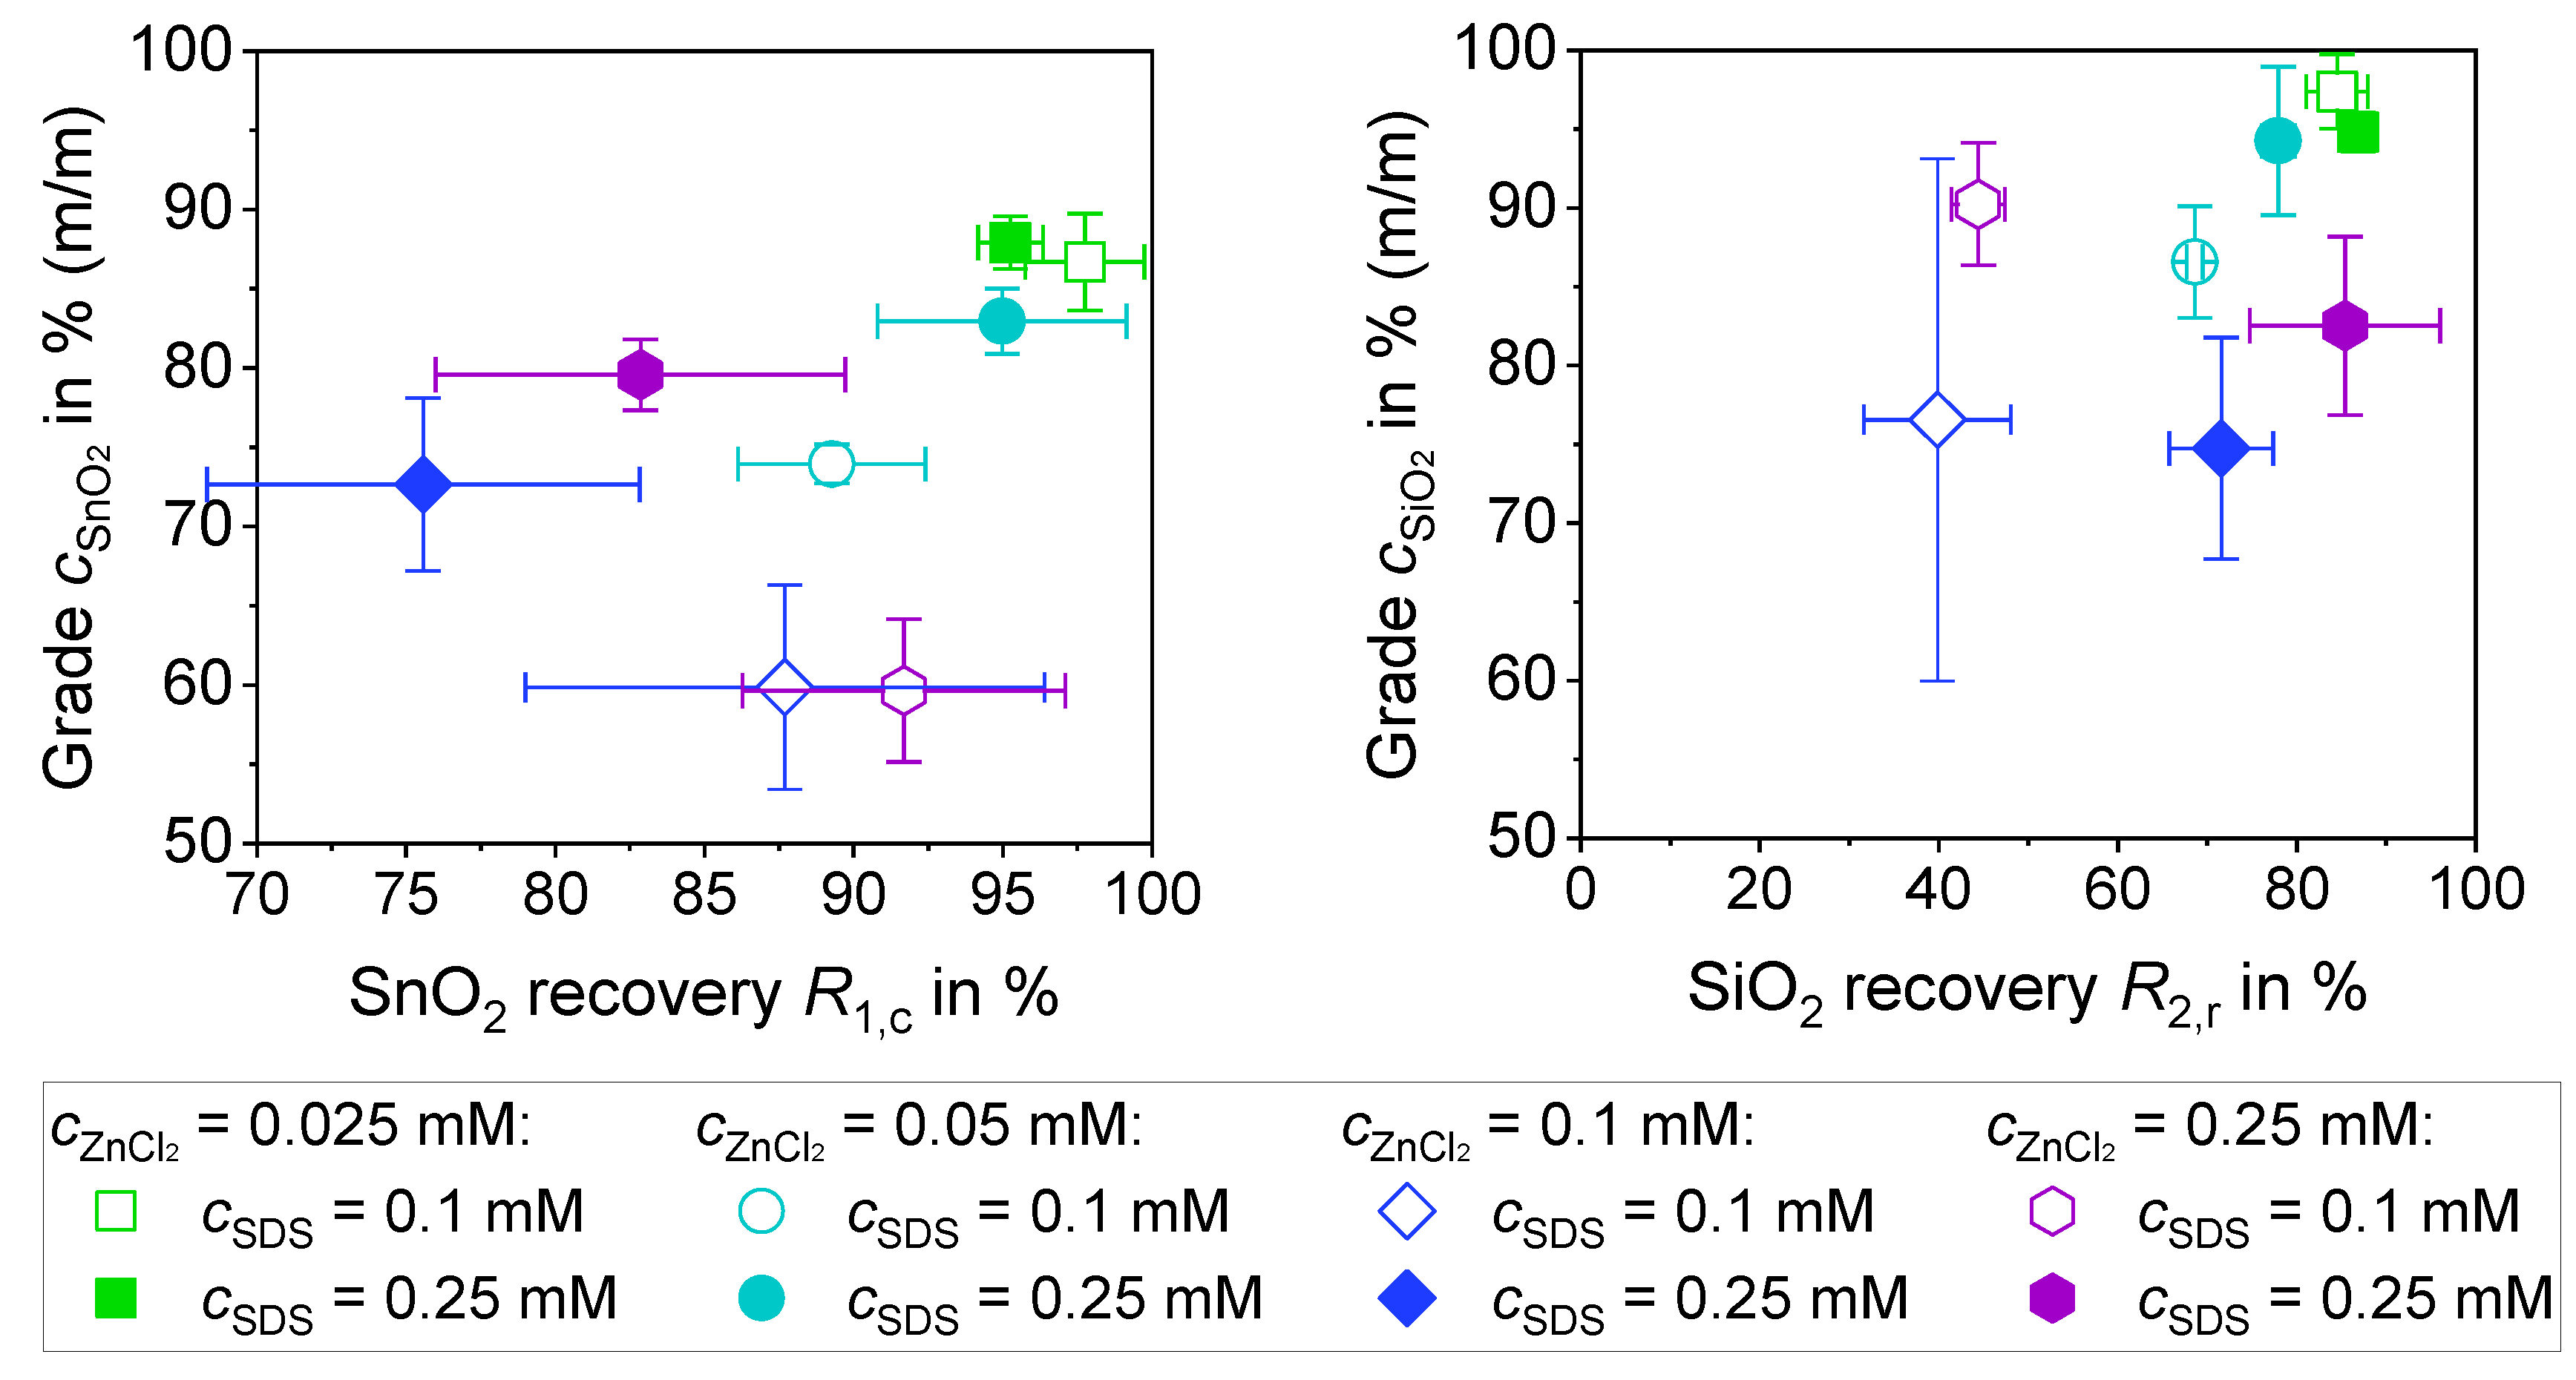
3.3. Separation of SiO2 and SnO2

The differences in the parameters were therefore used to generate a specific separation characteristic to separate the two materials. Two parameters are used to evaluate the separation, the purity of the phases (grade) and the mass recovery of the particles. For this reason, grade recovery curves are presented [48]. The specific recoveries were calculated with Equations (8) and (9). The grades were determined with the XRF for the oil phase and for the aqueous phase calculated with Equations (6) and (7). During separation, SnO2 should pass into the organic phase while SiO2 remains in the aqueous phase, as summarized in Figure 7. For this reason, the grades and recoveries for the organic phase are shown for SnO2 (left) and the grades and recoveries for SiO2 are shown for the aqueous phase (right).
In Table 7, the concentration for the material required to completely cover the particles is summarized. Two different surfactant concentrations are used for the separation, whereby 0.1 mM is just sufficient to occupy the particles and the other, cSDS = 0.25 mM, has an excess. Two SDS concentrations were chosen because how the particles enter the organic phase, whether the hydrophobicity is sufficient or whether the SDS still has a supporting effect, are unknown. In addition, it is not known whether the hydrophobic particles are sufficient to stabilize the emulsion droplets or whether SDS also has a supporting effect.
To ensure that the mass balance is correct, the values for the composition of the aqueous phase were calculated using Equations (6)–(9).

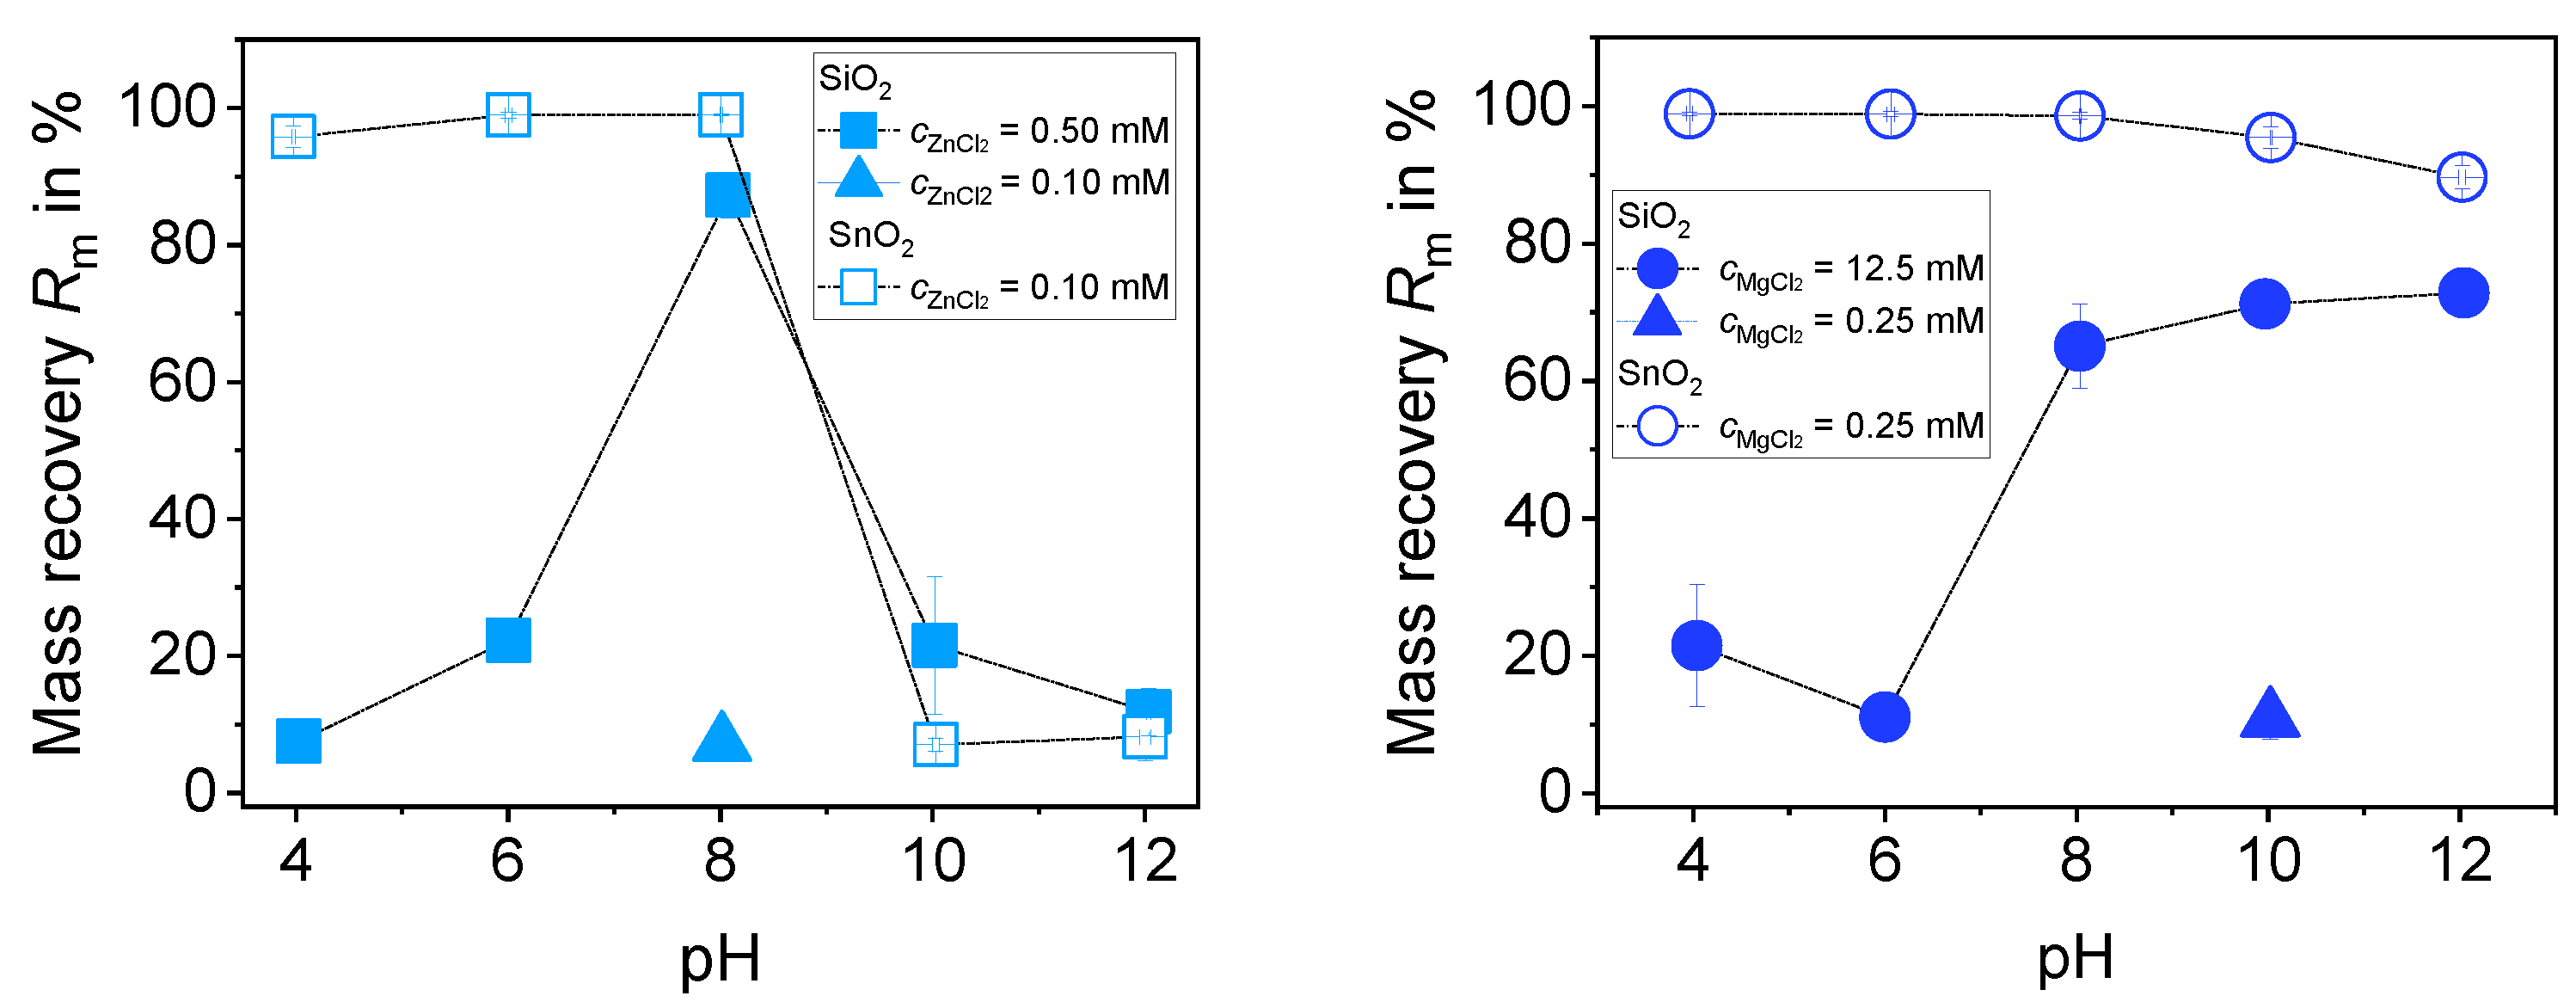
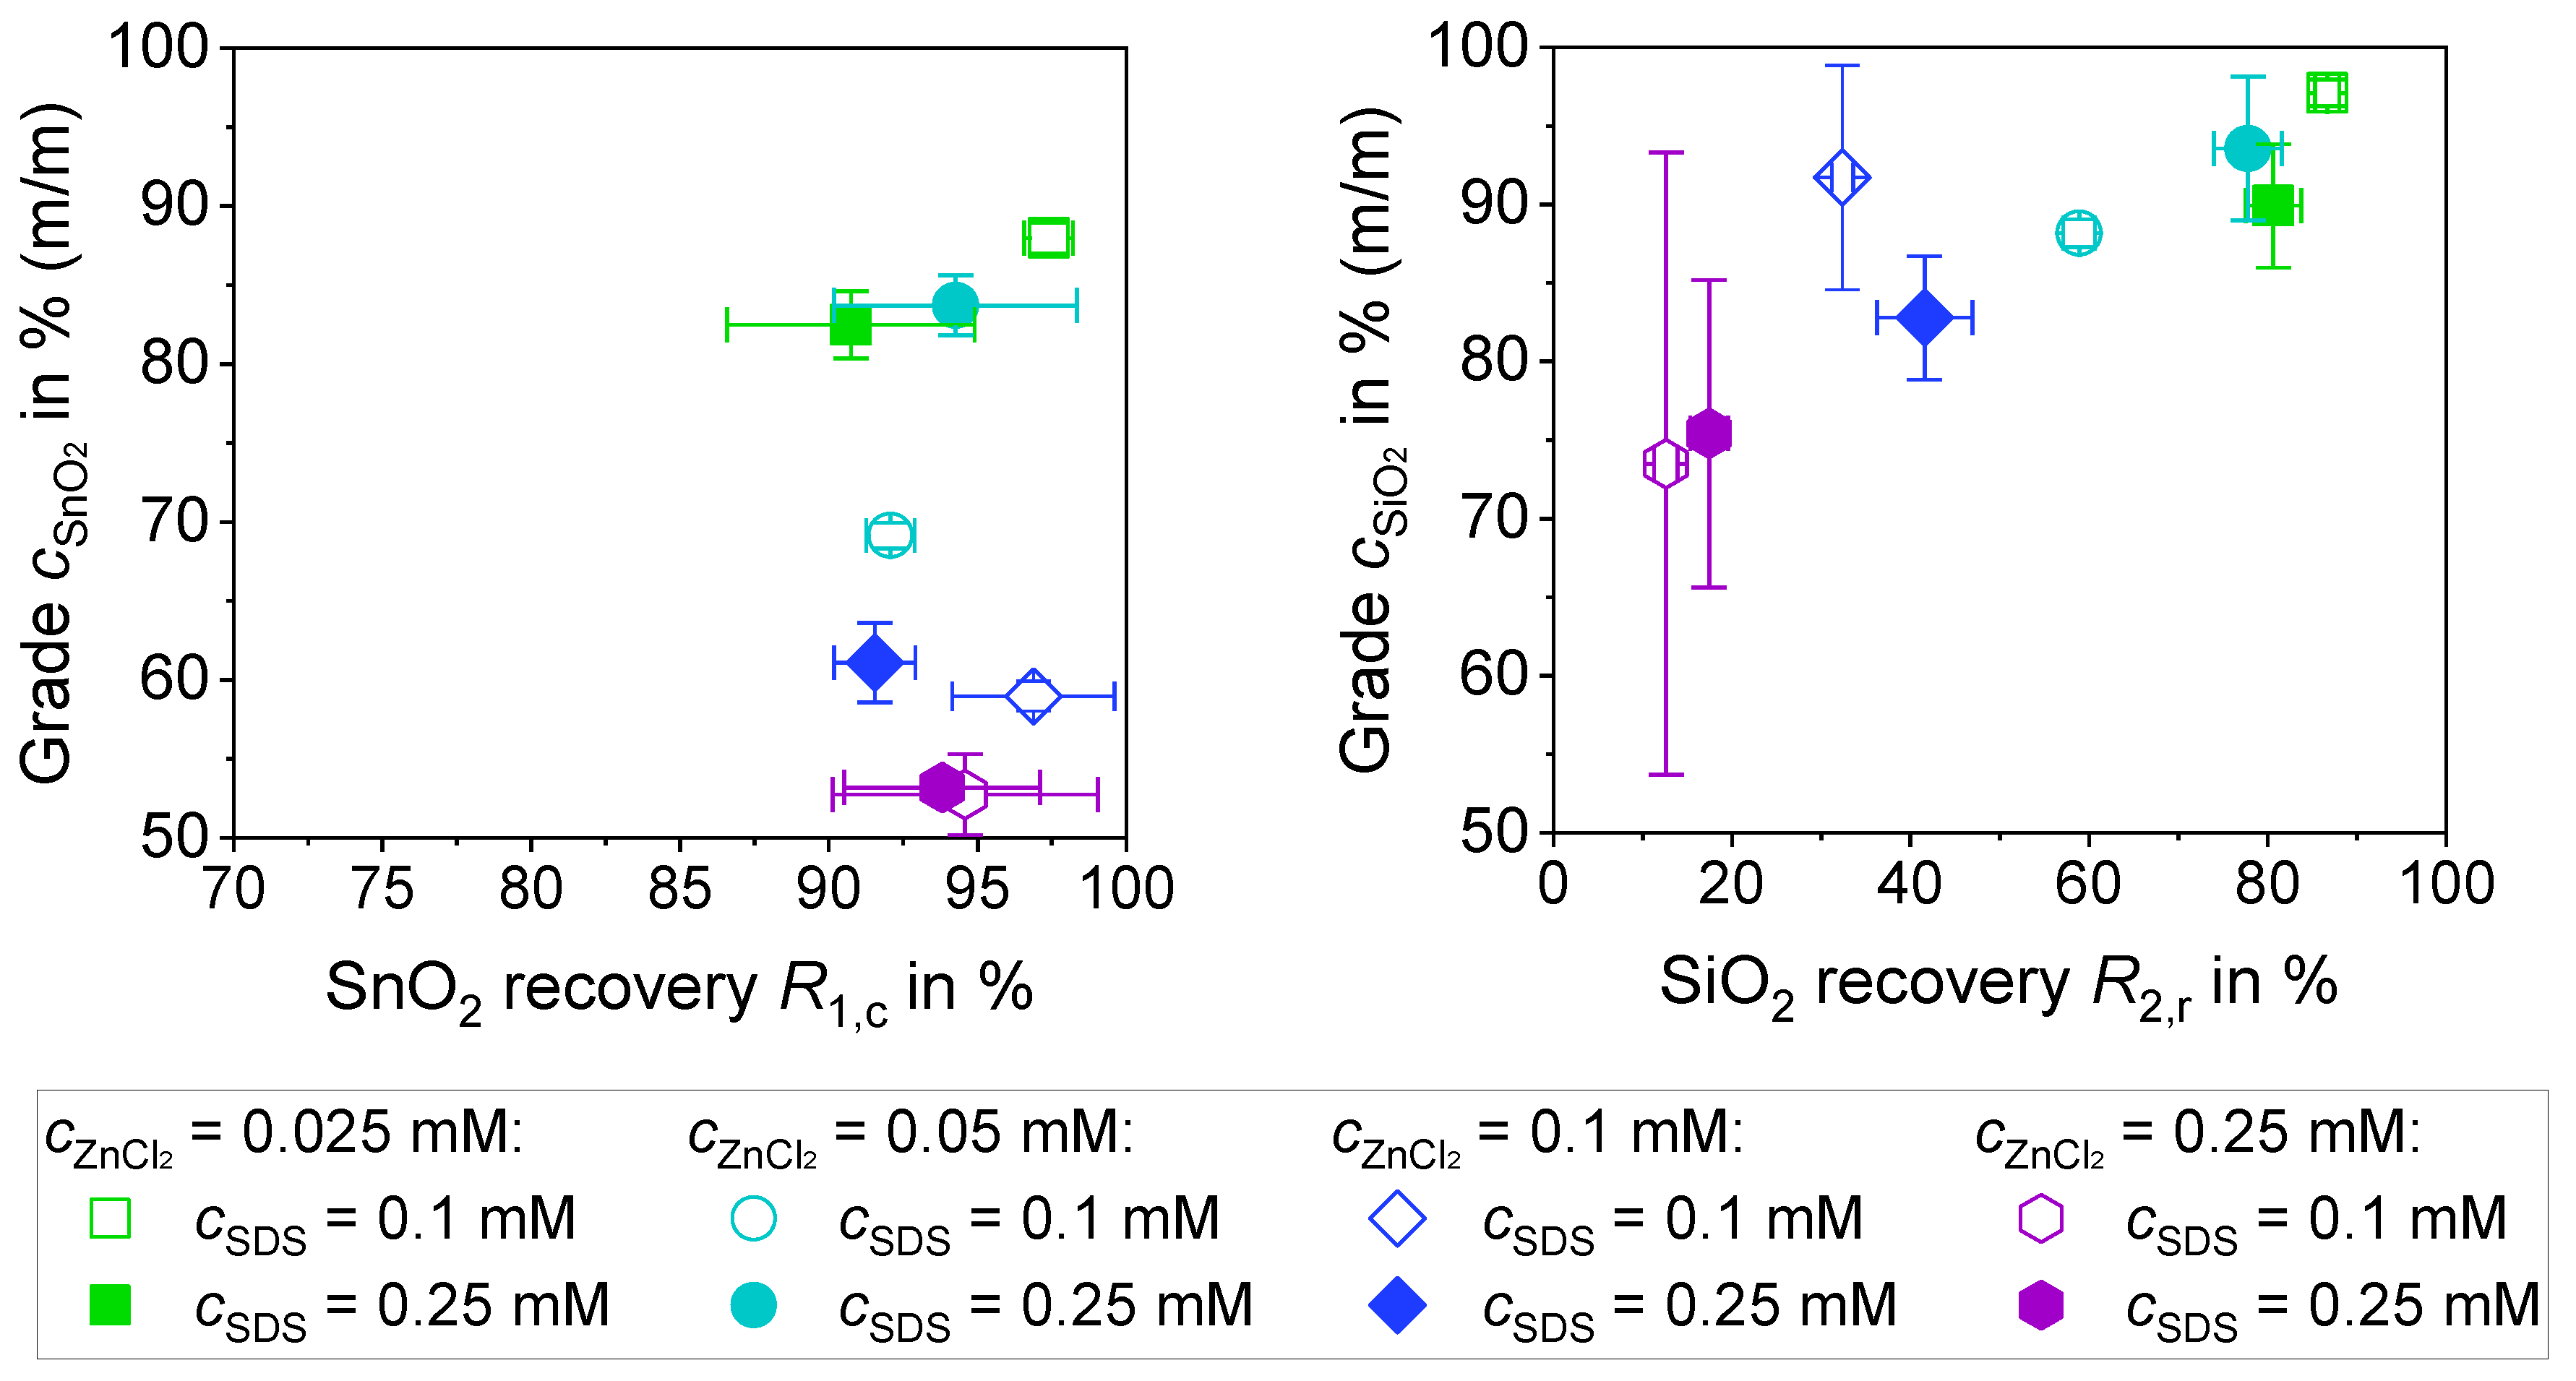
3.3.1. Separation of a 1:1 Mixture of SiO2 and SnO2 with ZnCl2 (0.5% (m/m))

Several parameters were analyzed for the separation of SiO2 and SnO2, varying the amount of salt and surfactant at pH 6 and pH 8. The results for pH 6 (Figure 13) and pH 8 (Figure 14) are shown below. Previous experiments (Figure 12) have shown that the largest deviation in the mass recovery Rm of the materials occurs at pH 6, as no charge reversal of SiO2 takes place at pH 6. pH 8 was chosen because a charge reversal of both materials takes place at this pH value, and it can therefore be checked whether the separation can be controlled via the concentration of ZnCl2 and SDS. The aim of the liquid–liquid extraction is that SnO2 should pass into the organic phase, while SiO2 should remain in the aqueous phase.
Figure 13 shows the grade-recovery diagrams for the separation of a 1:1 mixture of SiO2 and SnO2 with a solids content of 0.5% (m/m).
It can be seen in Figure 13, left, high recoveries of over 70% were achieved for SnO2 in the organic phase, with the grades varying significantly. For the two higher amounts of ZnCl2 in the system, higher amounts of SDS cause the recovery to decrease as the mass recovery decreases, but at the same time the grade increases. This can be seen when comparing the data points at cZnCl2 = 0.1 mM (blue dots) and 0.25 mM (violet dots) for both SDS concentrations. This is because the higher amount of SDS probably generates a surfactant bilayer around the SnO2 particles. The negative head group of the SDS molecule then faces outwards. Electrostatic repulsion occurs with the negatively charged SiO2 particles, preventing hetero-agglomeration, resulting in lower recovery but higher purity. At the lower SDS concentration, the quantity of particles passing into the organic phase increases with increasing ZnCl2 concentration. This means that a high recovery is always achieved. However, the grade decreases with the increasing mass recovery. Even with the lower SDS concentration of 0.1 mM, the two higher ZnCl2 concentrations cZnCl2 = 0.1 mM (blue dots) and 0.25 mM (violet dots) perform less, resulting in higher recovery but lower purity. The best results were achieved with cZnCl2 = 0.025 mM and cSDS = 0.1 mM and 0.25 mM, both in terms of recovery and grade of SnO2. The best results were obtained with a recovery of 95.3% and a grade of 87.9% (m/m) for 0.25 mM SDS and a recovery with 97.8% with a grade of 86.7% (m/m) for 0.1 mM SDS at pH 6 for the smallest ZnCl2 concentration of 0.025 mM. The aqueous phase primarily contains SiO2, with SiO2 grades over 74% (m/m). The results differ, particularly with regard to the recoveries. The only values that differ significantly are the values at cZnCl2 = 0.1 mM (blue dots), 0.25 mM (violet dots) and 0.1 mM SDS, as they achieve the lowest recovery around 38–40%. For the other parameters, the recoveries were above 68%. The lowest concentration of ZnCl2 0.025 mM gave the best purities of 84.5–86.9% (m/m) and recoveries of 94.8–97.4% for both SDS concentrations.
Experiments were also performed at pH 8 as shown in Figure 14. The adsorption of ZnOH+ takes place on both particle surfaces of SiO2 and SnO2 as well as Zn2+ for SnO2, which provides an additional challenge to the separation, and thus the transfer of SnO2 into the organic phase, while SiO2 remains in the aqueous phase. In addition, the precipitation of the zinc ions and SDS ions also occur at this pH value, which affects the separation [12]. It is found that the mass recovery increases with increasing the zinc chloride concentration.
Even at pH 8, SnO2 is transferred into the organic phase and the proportion of SiO2, which is also transferred into the organic phase, increases with the increasing ZnCl2 concentration, as can be seen from the decreasing grade of SnO2.
Due to the adsorption on both particle surfaces, the zinc chloride ion concentration is reduced. Since precipitation also removes zinc ions and SDS from the solution, it does not seem possible to achieve a bilayer of SDS ions. The absence of repulsion leads to the hetero-agglomeration of the particles. For this reason, the purity decreases with increasing zinc chloride concentration. As the SnO2 recovery is always above 90%, the results are very different in terms of purity. It is noticeable that the higher the zinc chloride concentration, the lower the purity of the organic phase. As with pH 6, it can be seen that the lowest zinc chloride concentration achieves the best separation results. The SiO2 recovery depends significantly on the selected parameters. Similarly, to the organic phase, the purity of the aqueous phase decreases with increasing zinc chloride concentration. However, it is also obvious that the best separation is obtained at the lowest zinc chloride concentration. At pH 8, the best results were obtained with 0.025 mM ZnCl2 and 0.1 mM SDS with a recovery of 97.4% and a grade of 88.0% (m/m) for the oil phase and a recovery of 86.7% and a grade of 97.1% (m/m) for the aqueous phase.
In summary, the most promising results were obtained at pH 6. Furthermore, the higher amount of surfactant was also beneficial for the separation of the materials. As shown in Table 7, a higher amount of ZnCl2 of 0.125 mM for 0.375 g is required to cover the amount of SnO2. However, it appears that agglomerates form and adhere to the emulsion droplets, so it is assumed that a monolayer of particles does not form. Therefore, at both pH 6 and pH 8, the lowest ZnCl2 concentration results in the best separation results.

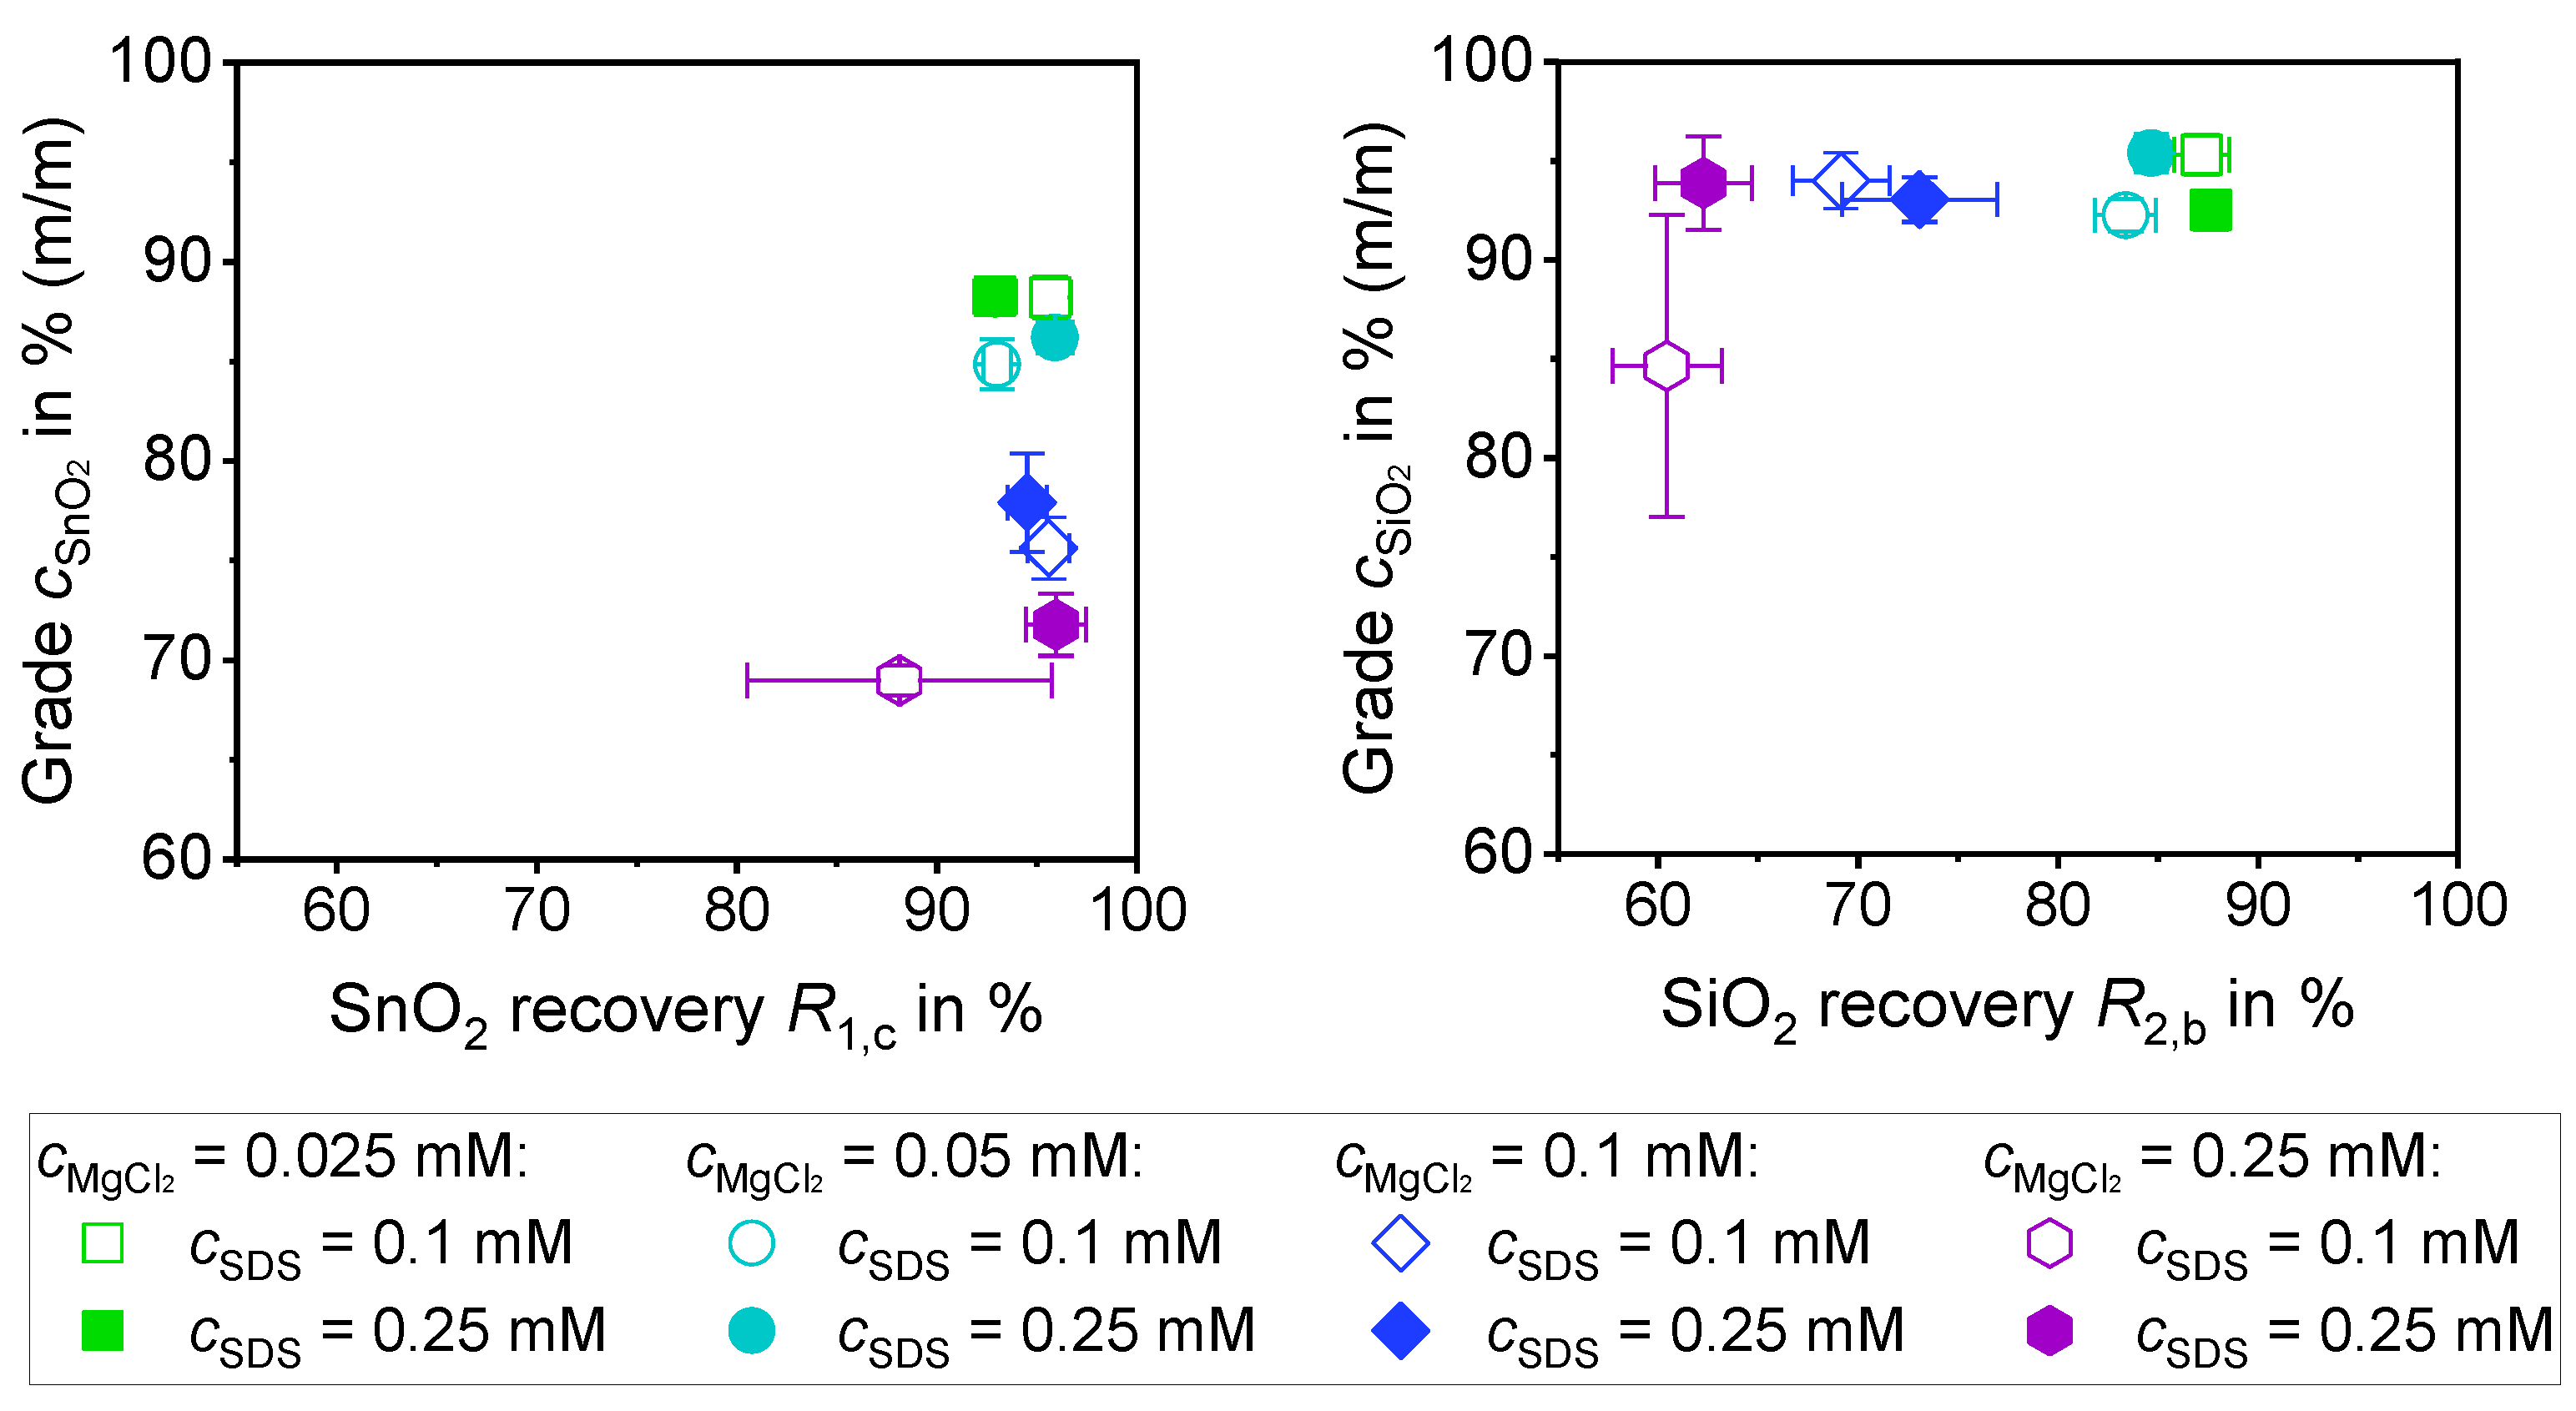
3.3.2. Separation of a 1:1 Mixture of SiO2 and SnO2 with MgCl2 (0.5% (m/m))

Table 7 shows that the amount of MgCl2 required to occupy the particles is significantly less than that for ZnCl2. This is due to the different molar masses, as the ionic radii differ only slightly.
The results for the separation of a 1:1 mixture of SiO2 and SnO2 with different MgCl2 concentrations at pH 6 are shown in Figure 15. The aim was to compare the efficiency of ZnCl2 and MgCl2 in terms of their selectivity. For this reason, the experiments were performed at pH 6, as at this pH value Mg2+ is only selectively adsorbed by SnO2 and only low mass recoveries were obtained for SiO2 during the phase transfer of the pure materials, as shown in Figure 12. The experiments show that SiO2 and SnO2 can be separated just as well as in the experiments with ZnCl2 and similar trends can also be observed, which are explained in more detail below. Looking at the diagram of the results for the transfer to the organic phase (left) and the diagram of the results for the particles remaining in the aqueous phase (right), it can be seen that SnO2 is transferred to the organic phase. In the organic phase, the amount of SiO2 that passes over varies, as can be seen from the SnO2 content.
The selectivity decreases with larger quantities of MgCl2, as the mass recovery also increases. However, compared to the experiments with ZnCl2 at pH 6, the mass recovery does not decrease during the experiments with the higher SDS concentration. It is therefore assumed that no SDS bilayer is formed, which would allow the repulsion of SiO2 and SnO2, although SDS is present in excess (Table 7). The hydrophobization of SiO2 due to charge reversal with MgCl2 and subsequent adsorption of SDS is excluded, as this was only possible for small quantities during the phase transfer of pure SiO2, as can be seen in Figure 12. Similarly, to pH 8 with ZnCl2, the purity decreases with the increasing MgCl2 concentration for both SDS concentrations. However, the recovery of SnO2 in the organic phase remains the same. A trend that became apparent was that the results with the higher SDS concentrations showed quantitatively slightly higher recoveries and slightly higher purities. The best results for the particles passing into the organic phase were obtained with the parameters 0.025 mM MgCl2 for 0.1 mM SDS. Looking at the results for the aqueous phase, the trend that emerged for the organic phase becomes more apparent. Although high SiO2 grades of over 85% (m/m) were achieved in the aqueous phase, the results differ in terms of recovery. As the salt content increases, the recovery of SiO2 decreases as more particles are transferred to the organic phase. The difference between the SDS concentrations for the respective MgCl2 concentration is striking, as the results for the higher SDS concentration always show a higher recovery, except for 0.25 mM MgCl2 where the recoveries are similar. The best purity and recoveries were achieved with the parameters 0.025 mM MgCl2 for 0.1 mM and 0.25 mM SDS.
Compared to ZnCl2, a lower concentration of MgCl2 is theoretically required to cover the SnO2 particles. It is therefore also assumed that agglomerates attach to the emulsion droplets and that the lowest concentration of MgCl2 is sufficient to achieve the best separation.

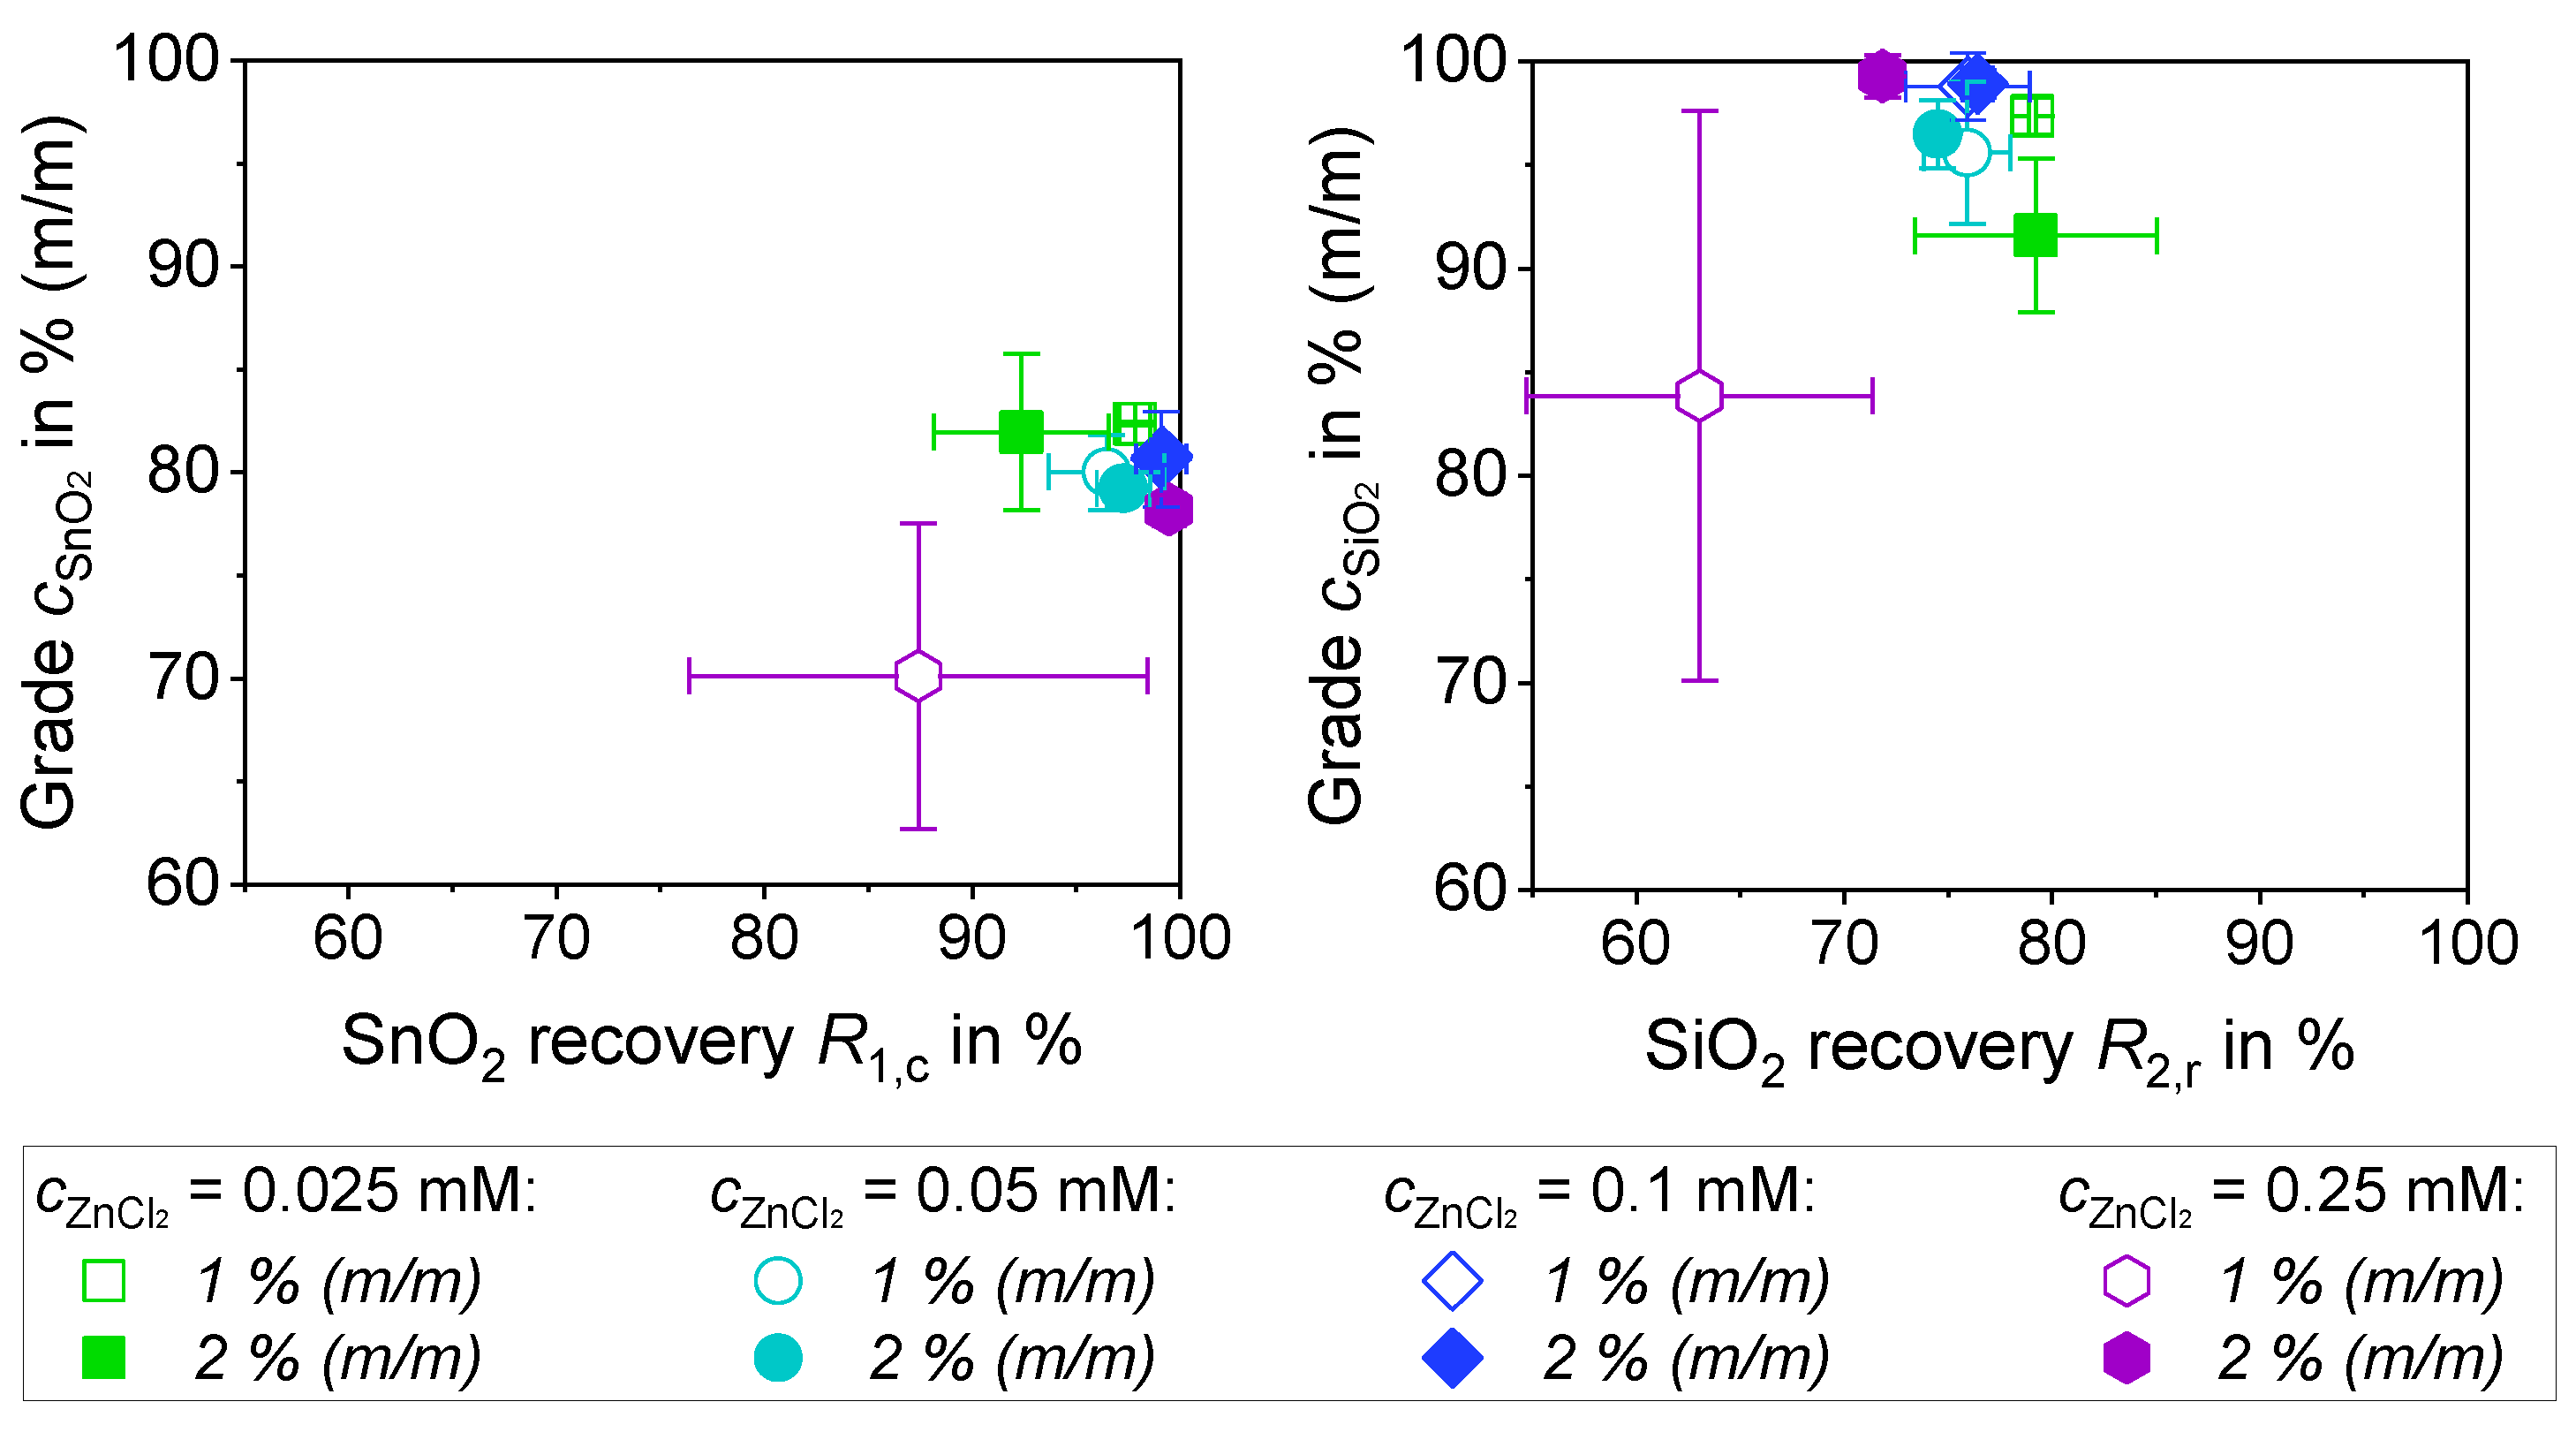
3.3.3. Separation of a 1:1 Mixture of SiO2 and SnO2 with ZnCl2 (1% (m/m) and 2% (m/m))

The selectivity is checked by increasing the particle concentration. As seen in the previous experiments, the concentration of salt and SDS is important for the occupancy of the particles and therefore crucial for selectivity. Furthermore, the particle concentration could not be increased, as this would require a change in the setup, as the particles remaining in the aqueous phase would block the separation funnel. It would then no longer be possible to separate the phases. In addition, the organic phase eventually becomes saturated with particles so that no more particles can transfer.
Table 8 summarizes the quantities of ions required to occupy the particles at different particle concentrations. It is obvious that lower concentrations of ZnCl2 are used than those required for the theoretical coverage of the particles. However, the theoretical coverage of the particles was calculated for a 1:1 mixture of SiO2 and SnO2, but the aim is to obtain only 50% SnO2 in the mixture in the organic phase.
Comparing the calculated values for particle coverage and the actual concentration used, it is also noticeable that a low concentration of 0.025 mM to 0.25 mM ZnCl2 was used. This means that there are too few ions in the solution to transfer all the particles of the 1:1 mixture of SiO2 and SnO2 into the organic phase. The same applies to the SDS concentration. However, only 0.25 mM is used, so there is a theoretical limitation as well, since not all particles can be hydrophobized.
Figure 16 shows the results for different salt concentrations for 0.25 mM SDS at pH 6 for higher particle concentrations, which should be compared with the results for a particle concentration of 0.5% (m/m) (Figure 13). The valuable product SnO2, which has passed into the organic phase, is shown on the left and the grade of SiO2, which has remained in the aqueous phase, is shown on the right.
The recovery of the particles that have passed into the organic phase remains high, above 80%. This means that in this experiment, SnO2 was primarily transferred to the organic phase and the amount of SiO2 varied. Depending on the salt concentration, more or less SiO2 is transferred to the organic phase, which is why the grade of SnO2 in the oil phase decreases and the recovery of SiO2 in the aqueous phase decreases. However, the purity decreases with increasing solid concentration for the ZnCl2 concentration of cZnCl2 = 0.025 mM. Compared to the results for the particles transferred to the organic phase at 0.5% (m/m), the grade of SnO2 decreased from 97% to max. 83% with the same recovery for the best parameter of 0.025 mM ZnCl2. This means that this concentration is no longer optimal for the process, as more SiO2 is transferred to the organic phase. A similar grade but a better recovery R1,c of 100% was achieved for the ZnCl2 concentration of 0.25 mM, which now gives the best separation result regarding the recovery. Theoretically, it was assumed that only SnO2 would be transferred to the organic phase due to the lower mass recovery, as the aim was to adjust the salt and SDS concentration to preferentially hydrophobize only one particle system. Unfortunately, the amount of SDS could not suppress the hetero-agglomeration because the SDS concentration was too low, and the absence of the double layer means that no repulsion is possible, so low purity occurs.
A higher concentration of SDS could help to increase purity. Apart from the result with 0.25 mM ZnCl2 for 1% (m/m), the other parameters gave very high recoveries of over 99%. The purity is between 75% (m/m) and 80% (m/m).
For the aqueous phase, SiO2 recoveries between 70% and 80% were obtained. Except for the one value of 0.25 mM and 1%(m/m). As in the previous experiments, a very pure aqueous phase is obtained, since the recovery of SnO2 in the organic phase is still high, the grade of SiO2 in the aqueous phase is almost high and thus above 90% (m/m).
The fact that a transfer into the organic phase is possible at this low salt concentration and SDS concentration for the particles is due to the agglomeration of the particles. This is because less ions are required for charge reversal and hydrophobization. However, this would also mean that SnO2 particles with different charges or with a low potential may be present and therefore agglomerate under these conditions.

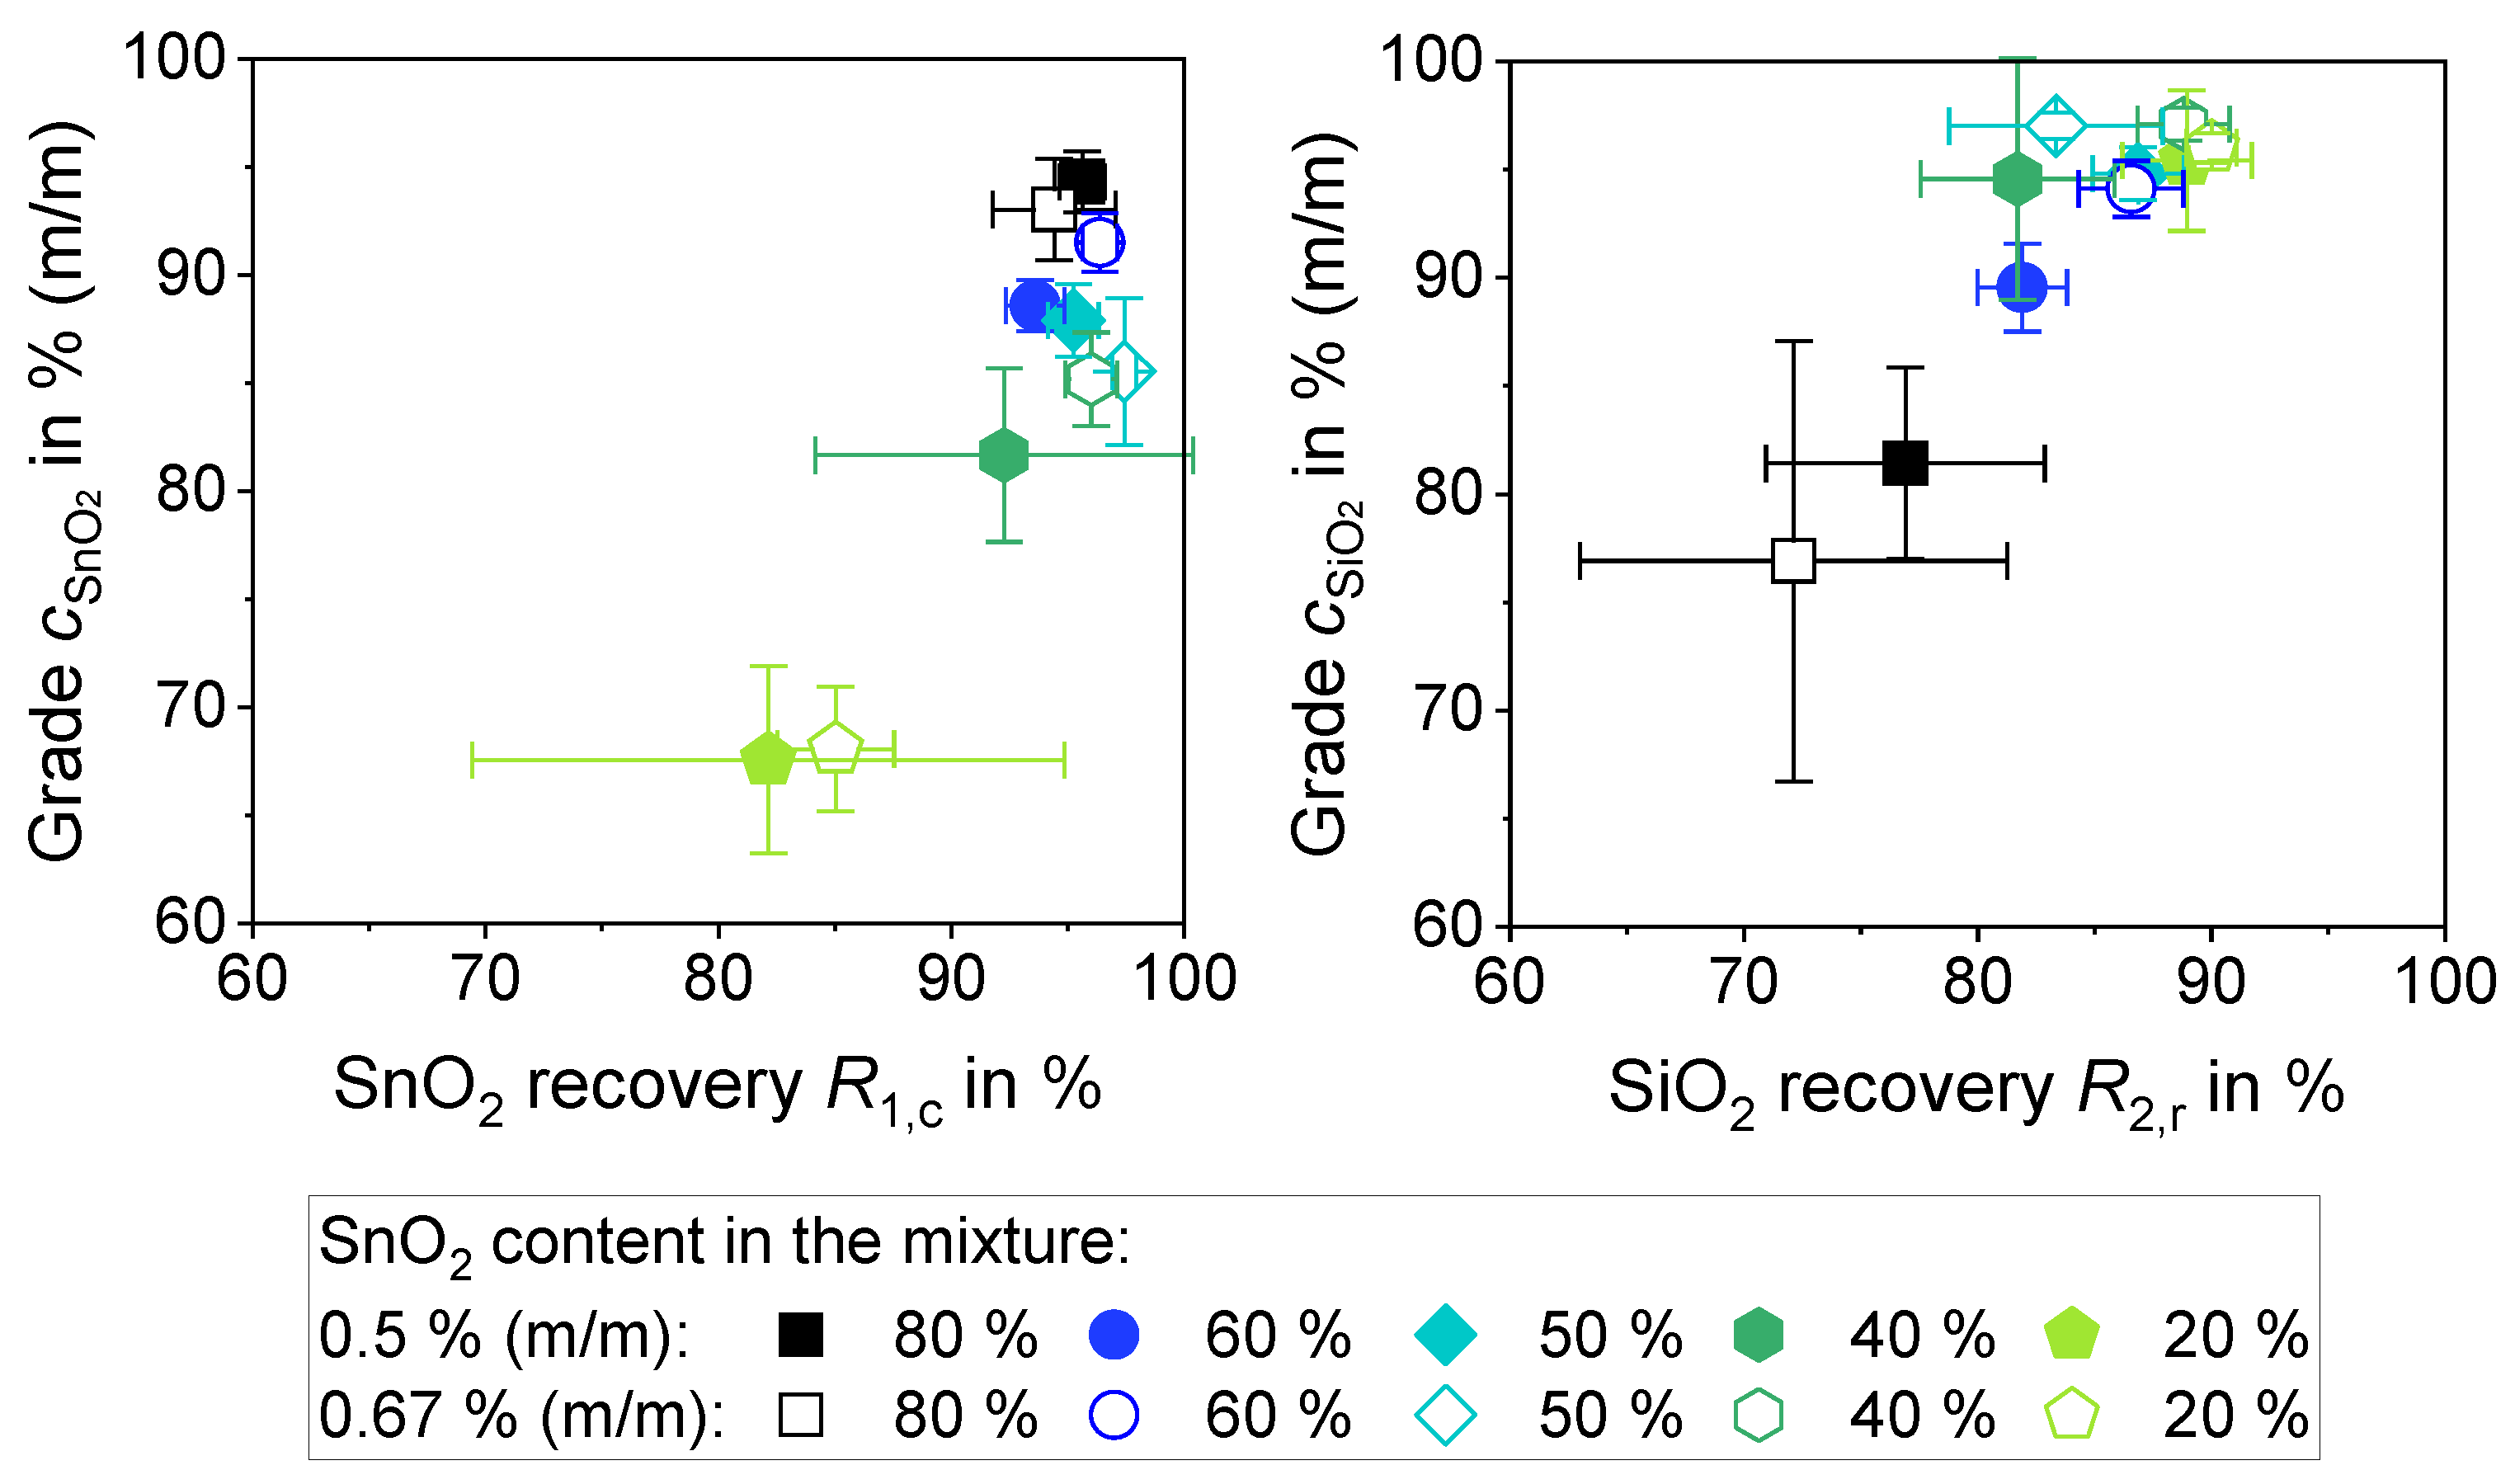
3.3.4. Separation of Varied Mixing Ratios

The specific surface areas were only determined for pure substances and the 1:1 mixture of SiO2 and SnO2. For the values summarized in Table 9, the specific surface areas were calculated based on the determined values. Due to the higher specific surface area of SiO2, the required quantities of ions and SDS increase with increasing SiO2 content.
Furthermore, different mixture compositions were investigated for two different particle concentrations. For this study, the salt and surfactant concentrations were used, because they obtained the best results for the previously studied 1:1 mixture of SiO2 and SnO2 with 0.5% (m/m), which is also shown in Figure 17. For the separation cZnCl2 = 0.025 mM and cSDS = 0.25 mM were used at pH 6.
Figure 17 shows the results for the particles that have transferred to the organic phase on the left and the results for the particles remaining in the aqueous phase on the right. Since the valuable SnO2 should be transferred to the organic phase, the left diagram is related to the grade and recovery of SnO2. SiO2 should remain in the aqueous phase, so the right diagram is based on the grade and recovery of SiO2. It can be seen from both diagrams that SnO2 is primarily transferred to the organic phase, as a high SnO2 content was determined for the organic phase. A high SiO2 content was also calculated for the aqueous phase for some data points, in particular for the mixtures with a higher SiO2 content. The results for the transfer to the organic phase show that the mixtures with a higher SnO2 content gave the better results, with a recovery of around 95% at a grade of 95% (m/m). With respect to the different mass concentrations, there are only minor deviations in terms of purity and recovery. The higher the SiO2 content, the more the recovery and grade of the organic phase decrease. In conclusion, the less SnO2 is present in the mixture, the higher is the SiO2 content in the organic phase. Theoretically, due to the low zinc chloride concentration, only the SnO2 should be addressed for a charge reversal. However, it appears that due to the different charges of SiO2 and SnO2 and the low potential difference at pH 6, agglomeration of SiO2 and SnO2 occurs, so that SiO2 can also be transferred into the organic phase.
Only SDS is always present in sufficient quantities due to the concentration of 0.25 mM used, because the mixtures theoretically require only 0.11 to 0.16 mM SDS. For the mixture with the 80% SnO2 content, the required SDS concentration is 0.11 mM. For this reason, bilayer formation is more pronounced in this mixture, resulting in stronger repulsion and thus better purity, as shown by the black dots in the left diagram. This means that the purification of mixtures with a high SiO2 content is possible as well, but it will require a multi-stage separation to achieve the final grade. In this case, the ZnCl2 concentration has to be adjusted for the higher SiO2 content and thus reduced, as there is less SnO2 on which the Zn species can adsorb. The situation is different for the particles remaining in the aqueous phase. The tests with the various mixtures have shown that there are only slight differences between the mixtures with a SiO2 content of 50% or more in terms of purity and recovery. The purity is above 94% (m/m) and the recovery is above 80%. The 1:1 mixture and the 1:4 mixtures for the lower mass concentration achieve the best results in terms of purity, and the 1:4 mixture for the lower mass concentration gives the best results in terms of recovery. The worst results were obtained for the mixture with the highest SnO2 content, as significantly more SnO2 remained in the aqueous phases with a recovery of 76.9% of and a grade of 81.4% (m/m) for the low mass concentration and with a recovery of 72.1% of and a grade of 76.9% (m/m) for the higher mass concentration.

4. Discussion

In order to separate the particles via liquid–liquid extraction, it is important to create a selective separation feature, where the wettability of the particles plays a crucial role. Due to the particle size distributions, shown in Figure 3, a size effect between the materials can be excluded, as they do not differ greatly from each other. As both metal oxides are negatively charged in aqueous solutions over a wide pH range, because the IEP of SiO2 is below pH 3 and the IEP of SnO2 is around pH 4, a hydrophobization of SiO2 and SnO2 by selective adsorption of a surfactant is not possible, as they do not adsorb on a specific surface. In order to create a selective separation property, positively charged hydrolyzed metal ions were used to adsorb onto the particle surface and form a bridge between the negatively charged particle surface and the negatively charged surfactant (SDS). The adsorption is recognized as a change in the sign of the zeta potential ζ and is referred to as charge reversal.
With the help of the specific surface area according to BET, the concentrations required to completely cover the particle surfaces and the particle surfaces in the mixtures could be calculated. Since SiO2 SFP 20M has the highest SBET of 10.05 ± 0.01 m2/g, it requires more ions or SDS to be completely covered compared to SnO2, which has an SBET of 6.70 ± 0.06 m2/g.
In the experiments with AlCl3, it was shown, at various mass concentrations, that there is a correlation between the particle concentration and the concentration of AlCl3 required for charge reversal. This indicates that the particles agglomerate during the measurement, which is probably due to the low potential when approaching the IEP. ZnCl2 and MgCl2 are suitable for the charge reversal of both materials, although the metal oxides differ in their adsorption behavior. SiO2 requires a higher salt concentration than SnO2 for the charge reversal due to the different IEPs. In addition, SiO2 is selectively charged at a few pH values, while for SnO2, a charge reversal is achieved over a wide pH range. The evidences from the previous experiments with the zeta potential could be confirmed with the liquid–liquid extraction experiments. SiO2 shows selective behavior as a transfer into the organic phase is possible with ZnCl2 at pH 8 and MgCl2 at pH 8 to 10 with SDS. While SnO2 particles transfer to the organic phase with ZnCl2 at pH 4-pH 8 and with MgCl2 at pH 4 to 10. In addition, the concentrations used for SnO2 are not sufficient for SiO2 to achieve a charge reversal of the particles, so hydrophobization with SDS was not possible. The experiments once again clearly showed how important the charge reversal of the particles is for the adsorption of SDS and thus for the hydrophobization of the particles.
For a selective separation, as a valuable substance, SnO2 should be transferred to the organic phase, while SiO2 remains in the aqueous phase. Due to different salt and surfactant concentrations, it was found that SnO2 is transferred into the organic phase, so that enrichment occurs and that the amount of SiO2 that is transferred depends on the pH-value, and the salt and surfactant concentration. The mass recovery in the oil phase at both pH values increased with the increasing ZnCl2 concentration. Exclusively, at pH 6, no increase in mass recovery was observed at the higher SDS concentration. This can be explained by the adsorption of the SDS molecules, which have a bilayer structure at higher concentrations. [19,52]. This is also confirmed by the fact that significantly more SDS was used at 0.25 mM than is theoretically required to form a monolayer (see Table 7). For separation, the bilayer structure of the SDS molecule is necessary to prevent the hetero-agglomeration of the materials. This is due to the repulsive effect of the negative head group of the DS molecule and the negatively charged SiO2. At pH 8, no bilayer is formed by SDS. This is due to the fact that SDS can form a precipitate with the higher valent ions and thus the SDS and any excess Zn-ions are removed from the system [53]. The best results for pH 6 were obtained at the lowest ZnCl2 concentration of 0.025 mM for the SDS concentrations of 0.1 mM and 0.25 mM. At pH 8, the best results were obtained at the lowest ZnCl2 concentration of 0.025 mM with the lowest SDS concentration. As with ZnCl2 separation, SnO2 is mainly transferred to the organic phase during separation with MgCl2, and the quantities of SiO2 that are transferred vary. The SiO2 content in the organic phase increases with the increasing MgCl2 concentration. Furthermore, the bilayer structure of DS does not appear to be formed, as the values of the mass recovery do not change between the SDS concentrations. It is probably possible to separate the particles because the difference in concentration for the charge reversal of the particles is so far apart in both the electroacoustic and electrophoretic measurements. With the increasing mass concentration of the mixture, the selectivity decreases because more SiO2 is transferred to the organic phase, as the SnO2 grade in the organic phase decreases compared to the results of 0.5% (m/m). The ZnCl2 concentration is probably still sufficient to achieve a charge reversal of the SnO2, otherwise a higher grade of SnO2 would have been obtained in the aqueous phase. Table 8 shows that the concentration of ions is theoretically too low at the different concentrations to achieve coverage of the particles. The fact that the ZnCl2 is still sufficient to achieve a charge reversal of SnO2 shows that it not only adsorbs the hydrolyzed species Zn(OH)+, but also that Zn2+ can be adsorbed on SnO2. Therefore, it is likely that the particles agglomerate at this concentration. Despite the agglomeration, the hydrophobicity seems to be sufficient to transfer the agglomerates into the organic phase. In addition, the amount of SDS is no longer sufficient to form a bilayer and, therefore, there is no negative charge that could have a repulsive effect on the negatively charged SiO2 and thus prevent hetero-agglomeration. It would be useful to increase the SDS concentration in order to prevent hetero-agglomeration, so that higher purities can be achieved again. Furthermore, the selectivity was investigated with different mixture compositions. Due to the different BET surface areas, the lowest SDS concentration of 0.11 mM is required for the mixture with a 80% SnO2 content. For this reason, the formation of the bilayer is more distinctive in this mixture, which leads to stronger repulsion, and thus, to better purity. For this reason, within the various mixtures, the higher the SnO2 content in the initial mixture, the better the separation result, with respect to the organic phase. The more SiO2 is added to the initial mixture, the more the selectivity of the separation process decreases, as the amount of SnO2 is too low for the adsorption of the ions, thus favoring the transfer of the SiO2 particles into the organic phase. In summary, it can be said that the separation of SiO2 and SnO2 is possible, and the separation performance depends on many parameters. If the separation method is to be applied to real cassiterite, the impurities contained therein must be taken into account, as these can have a considerable influence on the separation performance. In contrast to established methods such as flotation, it was shown that it is possible to separate SiO2 and SnO2 submicron particles. For industrial application, various parameters would have to be investigated further, and the batch tests transferred to a continuous separation column. It would then be necessary to check whether a higher level of force, for example, using a stirrer, is required for the particles to adhere to the emulsion droplets. The reversibility of the batch experiments would also have to be investigated, so that the organic phase can be used in the cycle. Furthermore, the method can also be used for the separation of other metal oxide mixtures. For this, as with SiO2 and SnO2, it is necessary to find suitable salts.

5. Conclusions

The experiments showed that the adsorption of various salts leads to a charge reversal of the particles. By adding SDS as an anionic surfactant, selective pH hydrophobization can be achieved [12]. As SnO2 and SiO2 differ in their adsorption behavior, a separation feature is formed where SnO2 is hydrophobized and can pass into the organic phase, while SiO2 remains in the aqueous phase. The separation at pH 6 works significantly better at higher ZnCl2 concentrations than at pH 8, especially in comparison to the results for the higher SDS concentrations. Significant differences are also observed at higher ZnCl2 and the SDS concentration of 0.25 mM. This is due to the formation of a bilayer of DS- at pH 6, which prevents hetero-agglomeration of the materials. Due to the precipitation of Zn-ions and SDS at pH 8, the formation of a DS- bilayer cannot take place. The selective hydrophobization of SnO2 allows the separation of the materials. The purity of the particles passing into the organic phase is strongly dependent on the mass concentration used, the salt and surfactant concentration and the chosen pH. Although the parameters for 0.025 mM ZnCl2 or MgCl2 and 0.1 mM and 0.25 mM SDS for pH 6 and for ZnCl2 also at pH 8 achieved a very good separation for 0.5% (m/m), the selectivity was reduced when the mass concentration was increased. Differences in the separation with MgCl2 and ZnCl2 at pH 6 occurred only at higher salt concentrations. The batch tests in the separating funnel cannot be transferred 1:1 to industrial processes, as these run continuously. For this reason, it would be advisable to first transfer them to a separation column [39] and carry out parameter studies here. It is then necessary to check whether the particles stick to the emulsion droplets or whether a higher energy input is required. However, it is clearly shown that the separation of a SiO2 and SnO2 mixtures is possible. This means that this method can also be transferred to the separation of other metal oxide mixtures in the submicron range, as long as the IEP of the materials differs.

Author Contributions

C.H.: Writing—original draft preparation, methodology, investigation. L.D.: Supervision, writing—review and editing. M.R.: Supervision, writing—review and editing. U.A.P.: Supervision, funding acquisition, project administration, writing—review and editing. All authors have read and agreed to the published version of the manuscript.

Funding

The project (Project-Number: 382122817, GZ: PE 1160/26-2) in which the work was performed is funded by the German Research Foundation (DFG). The project was part of the SPP2045 “MehrDimPart”.

Institutional Review Board Statement

Not applicable.

Informed Consent Statement

Not applicable.

Data Availability Statement

Data from the measurements can be requested from the corresponding authors.

Acknowledgments

The authors would like to thank Burkhart von Klitzing for providing the particles from Denka. Yvonne Volkmar is thanked for her experimental assistance with the measurements of the zeta potential with the Zetasizer Nano ZS and for the BET measurements. Annett Kästner is thanked for the particles size distributions and density measurements. The authors would like to thank Mina Asadijozani for her help with the XRF measurements and sample preparation. Peggy Knospe is thanked for the TEM images of the particles.

Conflicts of Interest

The authors declare no conflicts of interest.

References

  1. Nguyen, A.; Schulze, H.J. Colloidal Science of Flotation, 1st ed.; Taylor & Francis Group: London, UK, 2004. [Google Scholar]
  2. Zhang, L.; Khoso, S.A.; Tian, M.; Sun, W. Cassiterite recovery from a sulfide ore flotation tailing by combined gravity and flotation separations. Physicochem. Probl. Miner. Process. 2021, 57, 206–215. [Google Scholar] [CrossRef]
  3. De, F.; Gontijo, C.; Fornasiero, D.; Ralston, J. The Limits of Fine and Coarse Particle Flotation. Can. J. Chem. Eng. 2007, 85, 739–747. [Google Scholar]
  4. Gaudin, A.M.; Malozemoff, P. Recovery by Flotation of Mineral Particles of Colloidal Size. J. Phys. Chem. 1933, 37, 597–607. [Google Scholar] [CrossRef]
  5. Gaudin, A.M.; Schuhmann, R., Jr.; Schlechten, A.W. Flotation Kinetics. II. The Effect of Size on the Behavior of Galena Particles. J. Phys. Chem. 1942, 46, 902–910. [Google Scholar] [CrossRef]
  6. Rhein, F.; Zhai, O.; Schmid, E.; Nirschl, H. Multidimensional Separation by Magnetic Seeded Filtration: Experimental Studies. Powders 2023, 2, 37. [Google Scholar] [CrossRef]
  7. Schubert, H. Aufbereitung Fester Stoffe Band II: Sortierprozesse, 4th ed.; Deutscher Verlag für Grundstoffindustrie: Stuttgart, Germany, 1996. [Google Scholar]
  8. Englert, A.H.; Rodrigues, R.T.; Rubio, J. Dissolved air flotation (DAF) of fine quartz particles using an amine as collector. Int. J. Miner. Process. 2009, 90, 27–34. [Google Scholar] [CrossRef]
  9. Crawford, R.; Ralston, J. The influence of particle size and contact angle in mineral flotation. Int. J. Miner. Process. 1988, 23, 1–24. [Google Scholar] [CrossRef]
  10. Machunsky, S.; Grimm, P.; Schmid, H.-J.; Peuker, U.A. Liquid–liquid phase transfer of magnetite nanoparticles. Colloids Surf. A Physicochem. Eng. Asp. 2009, 348, 186–190. [Google Scholar] [CrossRef]
  11. Yao, H.; Momozawa, O.; Hamatani, T.; Kimura, K. Stepwise Size-Selective Extraction of Carboxylate-Modified Gold Nanoparticles from an Aqueous Suspension into Toluene with Tetraoctylammonium Cations. Chem. Mater. 2001, 13, 4692–4697. [Google Scholar] [CrossRef]
  12. Heilmann, C.; Ditscherlein, L.; Peuker, U.A. Influence of Hydrolyzed Metal Ions and Surfactants on the Phase Transfer of Al2O3, SiO2, and SnO2. Langmuir 2024, 40, 2543–2550. [Google Scholar] [CrossRef]
  13. Machunsky, S.; Peuker, U.A. Liquid-Liquid Interfacial Transport of Nanoparticles. Phys. Sep. Sci. Eng. 2007, 2007, 034832. [Google Scholar] [CrossRef]
  14. Erler, J.V.; Machunsky, S.; Franke, S.; Grimm, P.; Schmid, H.-J.; Peuker, U.A. Process Development of a Liquid-Liquid Phase Transfer of Colloidal Particles for Production of High-Quality Organosols. In Colloid Process Engineering; Kind, M., Peukert, W., Rehage, H., Schuchmann, H.P., Eds.; Springer International Publishing: Cham, Switzerland, 2015; pp. 371–398. [Google Scholar]
  15. Leistner, T.; Embrechts, M.; Leißner, T.; Chehreh Chelgani, S.; Osbahr, I.; Möckel, R.; Peuker, U.A.; Rudolph, M. A study of the reprocessing of fine and ultrafine cassiterite from gravity tailing residues by using various flotation techniques. Miner. Eng. 2016, 96–97, 94–98. [Google Scholar] [CrossRef]
  16. Zhou, Y.C.; Tong, X.; Wang, X.; Deng, Z.B.; Xie, X.; Xie, F. Beneficiation of Ultrafine Cassiterite from a Tin Tailings by Flotation. Adv. Mater. Res. 2013, 616–618, 643–648. [Google Scholar] [CrossRef]
  17. Lan, Z.Y.; Zhou, Y.C.; Tong, X. Recovery of Fine Cassiterite from Tin Tailings Slime by Froth Flotation. Adv. Mater. Res. 2013, 634–638, 3478–3483. [Google Scholar] [CrossRef]
  18. Leistner, T.; Türk, M.; Weber, A.; Weber, C.; Peuker, U.A. Selective Separation Using Fluid-Liquid Interfaces. Mater. Sci. Forum 2019, 959, 113–124. [Google Scholar] [CrossRef]
  19. Fuerstenau, D.W.; Pradip. Zeta potentials in the flotation of oxide and silicate minerals. Adv. Colloid Interface Sci. 2005, 114–115, 9–26. [Google Scholar] [CrossRef]
  20. Fuerstenau, D.W.; Colic, M. Self-association and reverse hemimicelle formation at solid-water interfaces in dilute surfactant solutions. Colloids Surf. A Physicochem. Eng. Asp. 1999, 146, 33–47. [Google Scholar] [CrossRef]
  21. Feng, Q.; Wen, S.; Zhao, W.; Chen, Y. Effect of calcium ions on adsorption of sodium oleate onto cassiterite and quartz surfaces and implications for their flotation separation. Sep. Purif. Technol. 2018, 200, 300–306. [Google Scholar] [CrossRef]
  22. Weber, C.; Peuker, U.A. On the Role of Hydrolyzable Metal Cations in the Adsorption of Anionic Surfactants on Negatively Charged Surfaces. Front. Mater. 2020, 7, 40. [Google Scholar] [CrossRef]
  23. Tian, M.; Khoso, S.A.; Wang, L.; Sun, W.; Zhang, C.; Hu, Y. Selective separation behavior and its molecular mechanism of cassiterite from quartz using cupferron as a novel flotation collector with a lower dosage of Pb2+ ions. Appl. Surf. Sci. 2019, 486, 228–238. [Google Scholar] [CrossRef]
  24. Feng, Q.; Wen, S.; Zhao, W.; Chen, H. Interaction mechanism of magnesium ions with cassiterite and quartz surfaces and its response to flotation separation. Sep. Purif. Technol. 2018, 206, 239–246. [Google Scholar] [CrossRef]
  25. Kusaka, E.; Nakahiro, Y.; Wakamatsu, T. The role of zeta potentials of oil droplets and quartz particles during collectorless liquid-liquid extraction. Int. J. Miner. Process. 1994, 41, 257–269. [Google Scholar] [CrossRef]
  26. Kusaka, E.; Kamata, Y.; Fukunaka, Y.; Nakahiro, Y. The role of hydrolyzed metal cations in the liquid-liquid extraction of ultrafine silica with dodecyl sulfate. Miner. Eng. 1997, 10, 155–162. [Google Scholar] [CrossRef]
  27. Fuerstenau, M.C.; Rice, D.A.; Somasundaran, P.; Fuerstenau, D.W. Metal Ion Hydrolysis and Surface Charge in Beryl Flotation. Trans IMM 1964, 73, 381. [Google Scholar]
  28. Ruan, Y.; Zhang, Z.; Luo, H.; Xiao, C.; Zhou, F.; Chi, R. Effects of Metal Ions on the Flotation of Apatite, Dolomite and Quartz. Minerals 2018, 8, 141. [Google Scholar] [CrossRef]
  29. De Vos, W.M.; Lindhoud, S. Overcharging and charge inversion: Finding the correct explanation(s). Adv. Colloid Interface Sci. 2019, 274, 102040. [Google Scholar] [CrossRef]
  30. Lyklema, J. Overcharging, charge reversal: Chemistry or physics? Colloids Surf. A Physicochem. Eng. Asp. 2006, 291, 3–12. [Google Scholar] [CrossRef]
  31. Jiménez, M.L.; Delgado, Á.V.; Lyklema, J. Hydrolysis versus Ion Correlation Models in Electrokinetic Charge Inversion: Establishing Application Ranges. Langmuir 2012, 28, 6786–6793. [Google Scholar] [CrossRef]
  32. Wernersson, E.; Kjellander, R.; Lyklema, J. Charge Inversion and Ion−Ion Correlation Effects at the Mercury/Aqueous MgSO4 Interface: Toward the Solution of a Long-Standing Issue. J. Phys. Chem. C 2010, 114, 1849–1866. [Google Scholar] [CrossRef]
  33. Matijević, E.; Couch, J.P.; Kerker, M. Detection Of Metal Ion Hydrolysis By Coagulation. IV. Zinc. J. Phys. Chem. 1962, 66, 111–114. [Google Scholar] [CrossRef]
  34. Delgado, A.V.; González-Caballero, F.; Hunter, R.J.; Koopal, L.K.; Lyklema, J. Measurement and interpretation of electrokinetic phenomena. J. Colloid Interface Sci. 2007, 309, 194–224. [Google Scholar] [CrossRef] [PubMed]
  35. Binks, B.P.; Rodrigues, J.A. Influence of surfactant structure on the double inversion of emulsions in the presence of nanoparticles. Colloids Surf. A Physicochem. Eng. Asp. 2009, 345, 195–201. [Google Scholar] [CrossRef]
  36. Lyklema, H. Fundamentals of Interface and Colloid Science, Solid-liquid interfaces, 1st ed.; Academic Press: London, UK, 1995; Volume 2. [Google Scholar]
  37. Somasundaran, P.; Healy, T.W.; Fuerstenau, D.W. Surfactant Adsorption at the Solid-Liquid Interface-Dependence of Mechanism on Chain Length. J. Phys. Chem. 1964, 68, 3562–3566. [Google Scholar] [CrossRef]
  38. Heilmann, C.; Ditscherlein, L.; Asadijozani, M.; Rudolph, M.; Peuker, U.A. Separation of submicron SiO2 and SnO2 particles via liquid-liquid extraction using ZnCl2 and SDS. Sep. Purif. Technol. 2025, 366, 132758. [Google Scholar] [CrossRef]
  39. Leistner, T.; Müller, M.; Erler, J.V.; Rudolph, M.; Peuker, U.A. Selektive Trennung sehr feiner Partikelsysteme mittels Flüssig/Flüssig-Flotation. Chem. Ing. Tech. 2014, 86, 831–839. [Google Scholar] [CrossRef]
  40. Israelachvili, J.N. Intermolecular and Surface Forces, 3rd ed.Academic Press: London, UK, 2011. [Google Scholar]
  41. Atkins, P.W.; de Paula, J. Kurzlehrbuch Physikalische Chemie, 4th ed.; Wiley-VCH: Weinheim, Germany, 2008. [Google Scholar]
  42. Atkins, P.W.; de Paula, J.; Keeler, J. Atkins’ Physical Chemistry, 11th ed.; Oxford University Press: Oxford, UK, 2018. [Google Scholar]
  43. Wiberg, N. Lehrbuch der Anorganischen Chemie; De Gruyter: Berlin, Germany, 2008. [Google Scholar]
  44. Lide, D.R. CRC Handbook of Chemistry and Physics, 86th ed.; CRC Press: Boca Raton, FL, USA, 2005. [Google Scholar]
  45. Shannon, R. Revised effective ionic radii and systematic studies of interatomic distances in halides and chalcogenides. Acta Crystallogr. Sect. A 1976, 32, 751–767. [Google Scholar] [CrossRef]
  46. Müller, B.; ChemEQL—A Software for the Calculation of Chemical Equilibria. 2024, from the Department Surface Waters—Research and Management. Available online: https://www.eawag.ch/en/department/surf/projects/chemeql/ (accessed on 28 May 2025).
  47. Kosmulski, M. Isoelectric points and points of zero charge of metal (hydr)oxides: 50 years after Parks’ review. Adv. Colloid Interface Sci. 2016, 238, 1–61. [Google Scholar] [CrossRef]
  48. Peuker, U.A.; Leißner, T. Solid–Solid Separation. In Ullmann’s Encyclopedia of Industrial Chemistry; Wiley-VCH GmbH: Weinheim, Germany, 2023; pp. 1–20. [Google Scholar]
  49. Küster, F.W.; Thiel, A. Ruland, Rechentafeln für die Chemische Analytik, 104th ed.; De Gruyter: Berlin, Germany, 1993. [Google Scholar]
  50. Davies, S.H.R.; Morgan, J.J. Manganese (II) oxidation kinetics on metal oxide surfaces. J. Colloid Interface Sci. 1989, 129, 63–77. [Google Scholar] [CrossRef]
  51. Kumar, K.Y.; Raj, T.N.V.; Archana, S.; Prasad, S.B.B.; Olivera, S.; Muralidhara, H.B. SnO2 nanoparticles as effective adsorbents for the removal of cadmium and lead from aqueous solution: Adsorption mechanism and kinetic studies. J. Water Process Eng. 2016, 13, 44–52. [Google Scholar] [CrossRef]
  52. Jańczuk, B.; Bruque, J.M.; González-Martín, M.L.; del Pozo, J.M. The surface free energy of fluorite in presence of sodium dodecyl sulfate. Powder Technol. 1994, 80, 127–131. [Google Scholar] [CrossRef]
  53. Talens-Alesson, F.I. Behaviour of SDS micelles bound to mixtures of divalent and trivalent cations during ultrafiltration. Colloids Surf. A Physicochem. Eng. Asp. 2007, 299, 169–179. [Google Scholar] [CrossRef]
Figure 1. Particle in the interface of two immiscible liquids (left), and the dependence of the free energy of detachment ∆dG as a function of the particle radius r at different contact angles θOW (right) according to [1,18].
Powders 04 00019 g001
Figure 2. TEM pictures of SiO2 SFP-20M (left) and SnO2 (right).
Powders 04 00019 g002
Figure 3. Particle size distribution Q3(x) for SiO2 SFP-20M, SnO2 and the 1:1 mixture of SiO2 SFP-20M and SnO2. The data points show the average of three values and the bars represent the calculated standard deviation.
Powders 04 00019 g003
Figure 4. The concentration of the hydrolyzed species of different metal ions, the hydrolyzed species Al3+ (green and yellow), the hydrolyzed species of Zn2+ (red), hydrolyzed species of Mn2+ (violet) and the hydrolyzed species of Mg2+ (blue), for a 0.5 mM salt solution calculated with ChemEQL [46].
Powders 04 00019 g004
Figure 5. pH titration of SiO2 SFP-20M, SiO2 SFP-30M and SnO2 in 1 mM NaCl solution to determine the isoelectric point. The data points show the average of three values and the bars represent the calculated standard deviation.
Powders 04 00019 g005
Figure 6. Schematic representation of liquid–liquid extraction using SiO2 as an example.
Powders 04 00019 g006
Figure 7. Schematic representation of separation of SiO2 (green) and SnO2 (black) using liquid–liquid extraction.
Powders 04 00019 g007
Figure 8. Parameters for the evaluation of the separation, whereby the green spherical particles represent SiO2 and black irregular shaped particles SnO2.
Powders 04 00019 g008
Figure 9. Zeta potential ζ of SiO2 SFP 30M as a function of the AlCl3 concentration for different mass concentrations of SiO2 at pH 4 measured with electroacoustic measurements. The data points show the average of three values and the bars represent the calculated standard deviation.
Powders 04 00019 g009
Figure 10. Zeta potential ζ of SnO2 (left) and SiO2 SFP 20M (right) as a function of the salt concentration for different pH-values with 5% (m/m). The data points show the average of three values and the bars represent the calculated standard deviation.
Powders 04 00019 g010
Figure 11. pH titration with ZnCl2 for SiO2 with c Z n C l 2 = 0.79 mM and for SnO2 with c Z n C l 2 = 0.30 mM (left) with MgCl2 for SiO2 with c M g C l 2 = 12.3 mmol/L and for SnO2 with c M g C l 2 = 0.40 mM (right). Curves with µe are already published in Heilmann et al. [12]. The data points show the average of three values and the bars represent the calculated standard deviation.
Powders 04 00019 g011
Figure 12. Mass recovery Rm of liquid–liquid extraction of SiO2 and SnO2 with the aid of ZnCl2 and SDS (for SiO2 cZnCl2 = 0.5 mM & cZnCl2 = 0.1 mM and for SnO2 cZnCl2 = 0.1 mM, each with cSDS = 0.25 mM) (left) and with the aid of MgCl2 and SDS (for SiO2 cMgCl2 = 12.5 mM & cMgCl2 = 0.25 mM and for SnO2 cMgCl2 = 0.25 M, each with cSDS = 0.25 mM) (right). As this was already published in Heilmann et al. [12], only the values for SiO2 with the lower salt concentration were added. The data points show the average of three values and the bars represent the calculated standard deviation.
Powders 04 00019 g012
Figure 13. Grade-recovery diagrams from the liquid–liquid extraction experiments for the separation of the 1:1 mixture of SiO2 and SnO2 (0.5% (m/m)) for different ZnCl2 and SDS concentrations at pH 6; left: results for the particles transferred to the oil phase, right: results for particles remaining in the aqueous phase. Data were already published in Heilmann et al. [38]. The data points show the average of three values and the bars represent the calculated standard deviation.
Powders 04 00019 g013
Figure 14. Grade-recovery diagrams from the liquid–liquid extraction experiments for the separation of the 1:1 mixture of SiO2 and SnO2 (0.5% (m/m)) for different salt and surfactant concentration at pH 8; left: results for the particles transferred to the oil phase, right: results for particles remained in the aqueous phase. Data were already published in Heilmann et al. [38]. The data points show the average of three values and the bars represent the calculated standard deviation.
Powders 04 00019 g014
Figure 15. Grade-recovery diagrams from the liquid–liquid extraction experiments for the separation of the 1:1 mixture of SiO2 and SnO2 (0.5% (m/m)) for different MgCl2 and SDS concentration at pH 6; left: results for the particles transferred to the oil phase, right: results for particles remained in the aqueous phase. The data points show the average of three values and the bars represent the calculated standard deviation.
Powders 04 00019 g015
Figure 16. Grade-recovery diagrams from the liquid–liquid extraction experiments for the separation of the 1:1 mixture of SiO2 and SnO2 for 1% (m/m) and 2% (m/m) and different salt concentrations with 0.25 mM SDS at pH 6; left: results for the particles transferred to the oil phase, right: results for particles remained in the aqueous phase. The data points show the average of three values and the bars represent the calculated standard deviation.
Powders 04 00019 g016
Figure 17. Grade-recovery diagrams from the liquid–liquid extraction experiments for the separation of different compositions of SiO2 and SnO2 mixtures for cZnCl2 = 0.025 mM and cSDS = 0.25 mM at pH 6; left: results for the particles transferred to the oil phase, right: results for particles remained in the aqueous phase. The data points show the average of three values and the bars represent the calculated standard deviation.
Powders 04 00019 g017
Table 1. Summary of x10, x50 and x90 values for SiO2 SFP-20M, SnO2 and the 1:1 mixture of SiO2 SFP-20M + SnO2.
SiO2SnO21:1 Mixture of SiO2 + SnO2
x10 in nm407.8 ± 5.2417.6 ± 6.2416.9 ± 14.4
x50 in nm480.4 ± 11.0485.1 ± 9.2496.4 ± 5.9
x90 in nm565.4 ± 20.5561.8 ± 15.3589.7 ± 7.0
Table 2. Summary of the specific surface areas according to BET for the values for SiO2 SFP-20M, SnO2 and the 1:1 mixture of SiO2 SFP-20M + SnO2.
MaterialSBET in m2/g
SiO2 10.05 ± 0.01
SnO26.70 ± 0.06
1:1 mixture of SiO2 + SnO28.27 ± 0.08
Table 3. Summary of the important parameters, coordination number (CN), ion radius rIon in Å and the molar mass M in g/mol.
IonsCNrIon in ÅM in g/mol
Al3+6 [42]~0.54 [42,44,45]27.0
Mg2+6 [42]0.72 [41,42,44]24.3
Zn2+6 [45]0.74 [44,45]65.4
OH-2 [45]1.32 [44,45]17.0
Table 4. Calculated quantities required for complete covering of 1 g particles.
Calculated Quantities Required for the Complete Covering of 1 g Particles for:
IonsCoverage of SiO2 in mgCoverage of SnO2 in mgCoverage of 1:1 Mixture of SiO2 + SnO2 in mg
Al3+49.2 ± 0.132.8 ± 0.340.5 ± 0.4
Mg2+24.9 ± 0.016.6 ± 0.220.5 ± 0.2
Zn2+63.5 ± 0.142.3 ± 0.452.2 ± 0.5
SDS9.6 ± 0.06.4 ± 0.17.9 ± 0.1
Table 5. Amounts of Al3+ and its hydrolyzed species required for the occupancy of different mass concentrations of SiO2 SFP 30M.
SpeciesrIon in Å Requirement for the Individual Ions in mM for:
1% (m/m)3% (m/m)5% (m/m)
Al3+0.540.491.462.43
Al(OH)2+1.860.070.200.33
Al(OH)2+3.180.030.100.16
Experiment AlCl3 0.110.180.30
Table 6. Amounts of Zn2+ and Mg2+ with their hydrolyzed species required for the occupancy of 5% (m/m) SiO2 SFP 20M and SnO2.
SpeciesrIon in ÅRequired Concentration for the Individual Ions in mM for:
SnO2 5% (m/m)SiO2 5% (m/m)
Zn2+0.7416.3424.53
Zn(OH)+2.062.663.99
Experiment ZnCl2 1.362.86
Mg2+0.729.18 13.7
Mg(OH)+2.041.942.92
Experiment
MgCl2
0.7912.98
Table 7. Amounts of Zn2+ and Mg2+ with their hydrolyzed species required and SDS for the occupancy of 0.75 g SiO2 SFP 20M, SnO2 and 1:1 mixture of SiO2 + SnO2 related to the molar mass of the chlorides.
SpeciesRequired Concentration for the Individual Ions in mM for:
SnO2SiO21:1 Mixture of SiO2 + SnO2
Zn2+1.552.331.92
Zn(OH)+0.250.380.31
Mg2+0.871.311.08
Mg(OH)+0.180.280.23
SDS0.110.170.14
Table 8. Amounts of Zn2+ with their hydrolyzed species and SDS required for the occupancy of a 1:1 mixture of SiO2 + SnO2 for 1% (m/m) and 2% (m/m)).
SpeciesRequired Concentration for the Individual Ions for a 1:1 Mixture of SiO2 + SnO2 in mM for:
1% (m/m)2% (m/m)
Zn2+3.837.67
Zn(OH)+0.621.25
SDS0.270.55
Table 9. Amounts of Zn2+ and the hydrolyzed species required and SDS for the occupancy of mixtures with different SnO2 content for 0.5% (m/m).
SpeciesRequired Concentration for the Individual Ions for Different SiO2 + SnO2 Mixtures in mM for:
80% SnO2
+ 20% SiO2
60% SnO2
+ 40% SiO2
50% SnO2
+ 50% SiO2
40% SnO2
+ 60% SiO2
20% SnO2
+ 80% SiO2
Zn2+1.711.861.912.022.17
Zn(OH)+0.280.300.310.330.35
SDS0.120.130.140.140.16
Disclaimer/Publisher’s Note: The statements, opinions and data contained in all publications are solely those of the individual author(s) and contributor(s) and not of MDPI and/or the editor(s). MDPI and/or the editor(s) disclaim responsibility for any injury to people or property resulting from any ideas, methods, instructions or products referred to in the content.

