3.1. Formation Process of Drying Patterns
The gravitational Péclet number
PeG, a dimensionless number indicating the relative importance of sedimentation or flotation compared to diffusion for particles in water, is expressed as follows:
where
d is the particle diameter, Δ
ρ is the density difference between the particle and water,
g is the gravitational acceleration,
kB is the Boltzmann constant, and
T is the absolute temperature. For example, in the case of poly(methyl methacrylate) (PMMA) particles with a diameter of 5 μm and a specific gravity of 1.2, the gravitational Péclet number in water is approximately 100. Sedimented PMMA particles are captured by the capillary flow and transported toward the contact line, resulting in the formation of a clear ring pattern upon the drying of the sessile droplet. The drying process of a droplet of the hollow particle aqueous dispersion (
ϕ = 0.01) was observed from above (
Figure 1). Immediately after deposition, the entire droplet appeared to be turbid, except for a slightly transparent region near the droplet edge where the thickness was small (
Figure 1a). After 5 min, a turbid region appeared slightly inside the droplet periphery, forming a blurred boundary (
Figure 1b). A part of this boundary is indicated by a red dotted line in the upper part of the image. After 23 min (
Figure 1c), the boundary became more distinct, and it slightly moved outward, indicating an expansion of the turbid central region. Between 70 min (
Figure 1f) and 160 min (
Figure 1g), the turbid central region evolved into a single floating cluster (FC) that gradually moved. This behavior was reminiscent of an iceberg drifting on the sea. Drying was completed in approximately 200 min (
Figure 1h), and just before complete drying, several fine grooves appeared within the turbid central region, likely caused by rapid volumetric shrinkage at the final stage of drying. Of particular interest was the very narrow width of the ring formed near the droplet edge; the formation of this ring-like pattern was almost completed in the very early stage of drying. There was almost no significant increase in ring width over time, which is markedly different from the typical drying patterns observed in sessile droplets of general colloidal dispersions.
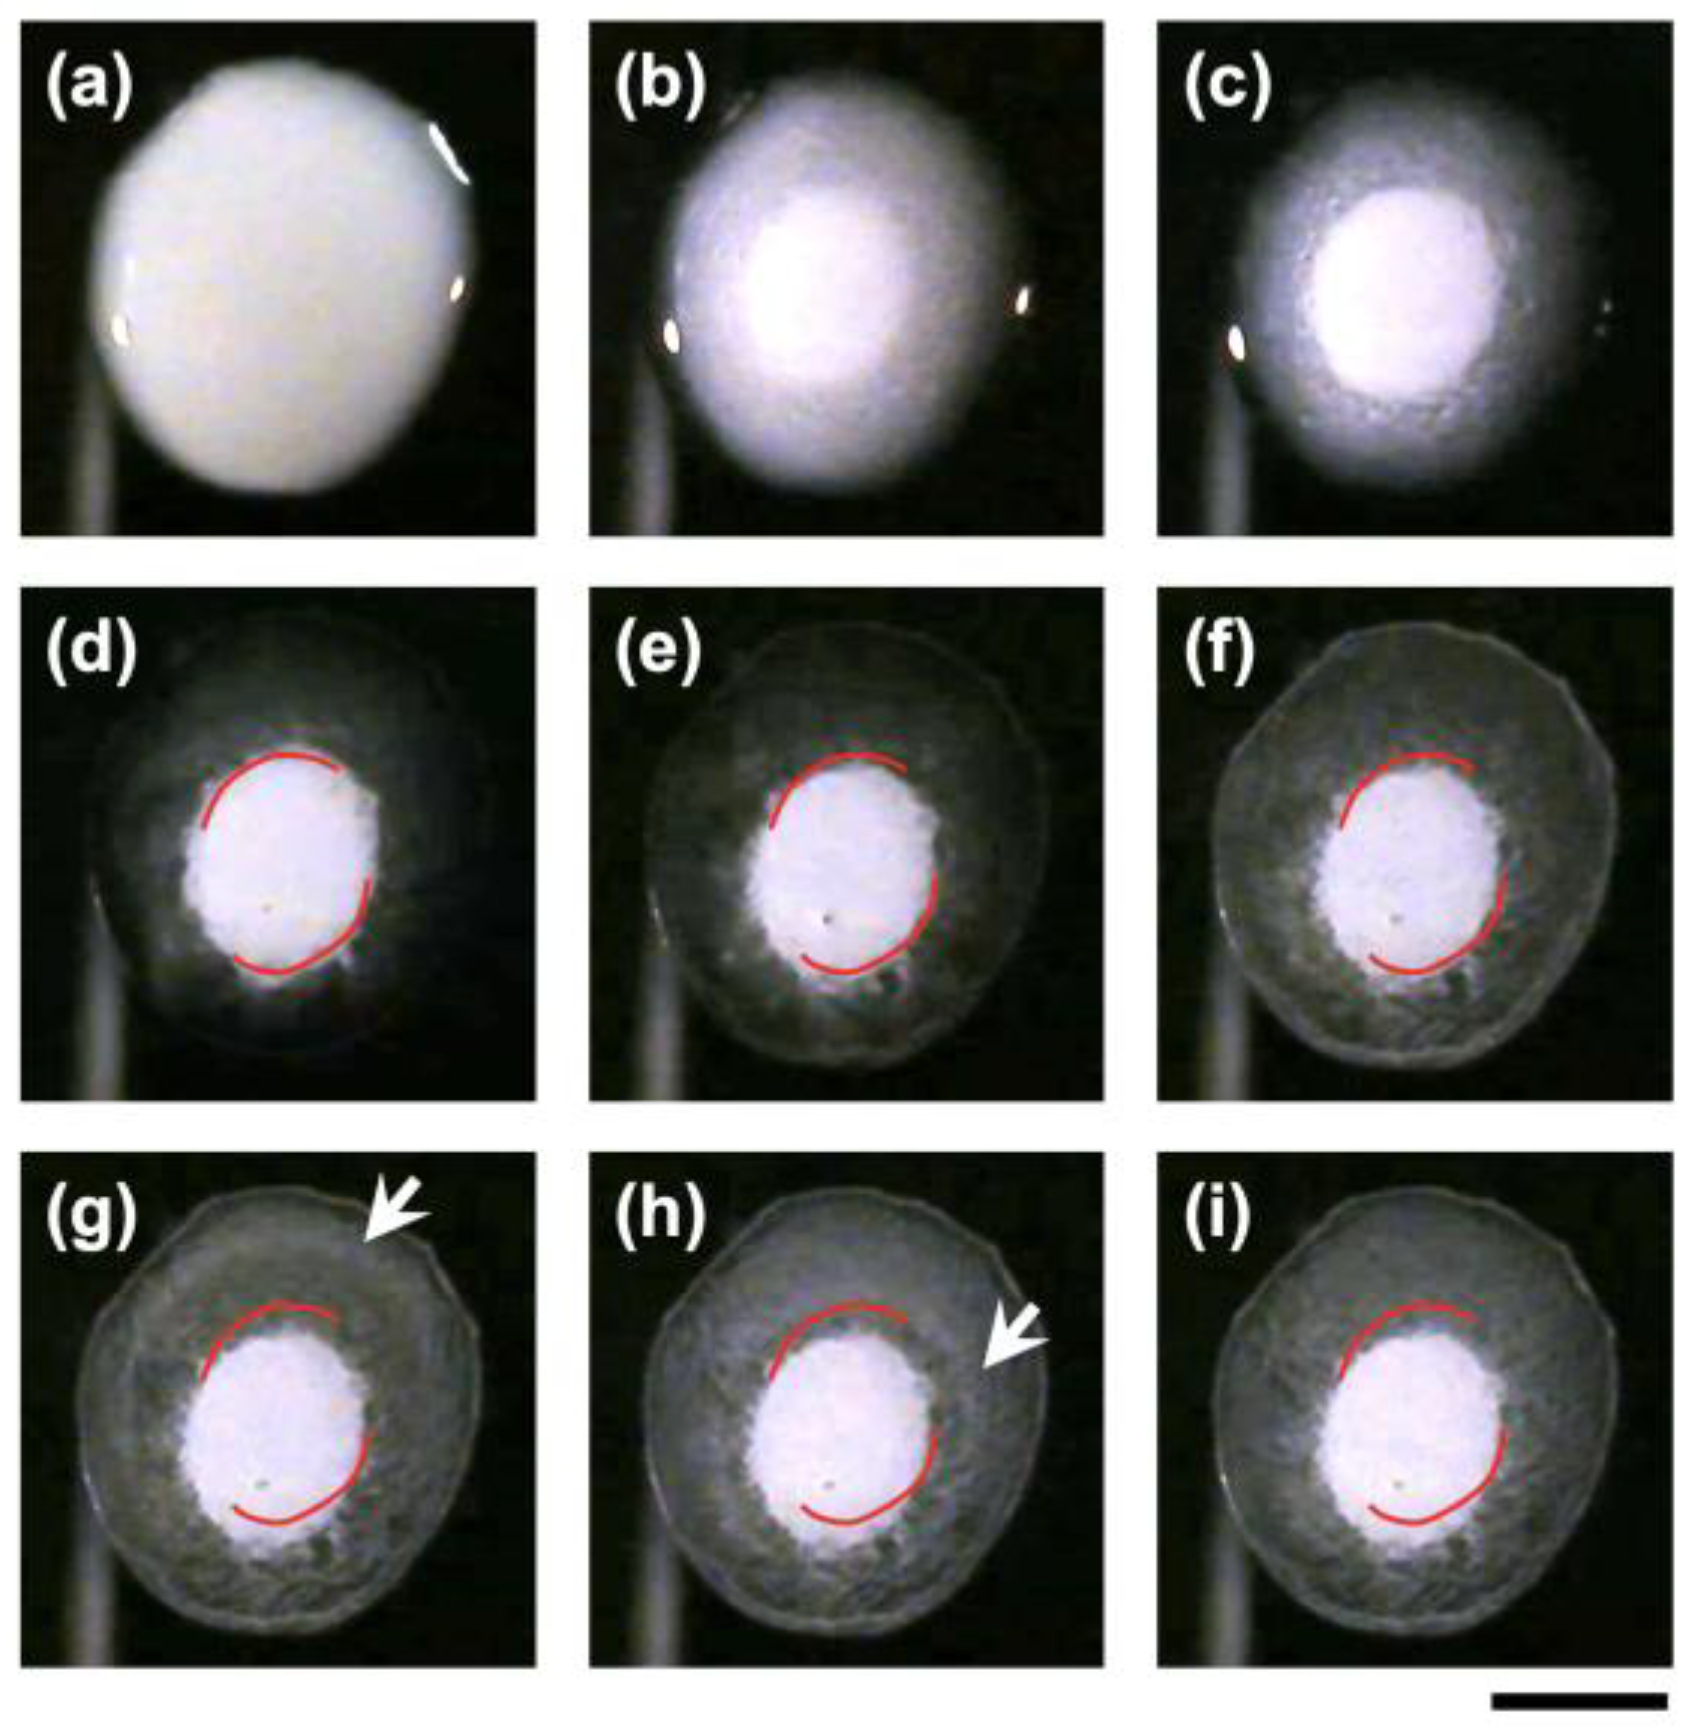
Next, the drying process of a droplet with a lower particle volume fraction (
ϕ = 0.003) was observed (
Figure 2). Immediately after deposition (
Figure 2a), the appearance was similar to that of the droplet with
ϕ = 0.01 shown in
Figure 1. After 23 min (
Figure 2b), a more distinct turbid floating cluster (FC) appeared at the center. By 67 min (
Figure 2c), the outline of the FC became clearer, and the surrounding area became even more transparent. Compared to the appearance at 23 min, the diameter of the FC had slightly increased. After 220 min (
Figure 2d), the overall pattern reached a steady state. In the later stages of drying (
Figure 2e), irregular fluctuations in the position of the FC were observed. This behavior is considered to be due to slight inhomogeneities in the evaporation rate, generating forces that pushed the FC in one direction. At 262 min (
Figure 2f), turbidity began to appear around the FC, indicating that the film was entering the final stage of drying. At this point, a ring-shaped pattern rapidly appeared. Shortly thereafter, circular white rings were observed propagating from the film edge toward the center (arrows in
Figure 2g,h). By 273 min (
Figure 2i), the final drying pattern was completed.
It is evident that the upward movement of hollow particles due to buoyancy plays a primary role in the formation of the drying pattern. Capillary flow is a well-known mechanism that transports particles toward the contact line, leading to the so-called “coffee-ring effect.” However, in the present system, particles move upward due to buoyancy, effectively avoiding the radial capillary flow near the droplet bottom, which normally transports sedimenting particles to the contact line. As a result, although a ring-like deposition was observed, it remained extremely narrow and barely noticeable. Marangoni flow, which is driven by surface tension gradients at the liquid–air interface of the droplet, typically consists of flow along the droplet surface and an accompanying bulk circulation. Under deionized conditions, such a flow is relatively weak, but it may become stronger with increasing [NaCl]. Nevertheless, as discussed later, no significant changes in the drying pattern attributable to Marangoni flow were observed within the [NaCl] range of 10−4 to 10−2 mol/L. Therefore, under the present experimental conditions, the effect of Marangoni flow is considered to be limited.
3.3. Buoyancy of Hollow Particles in Water
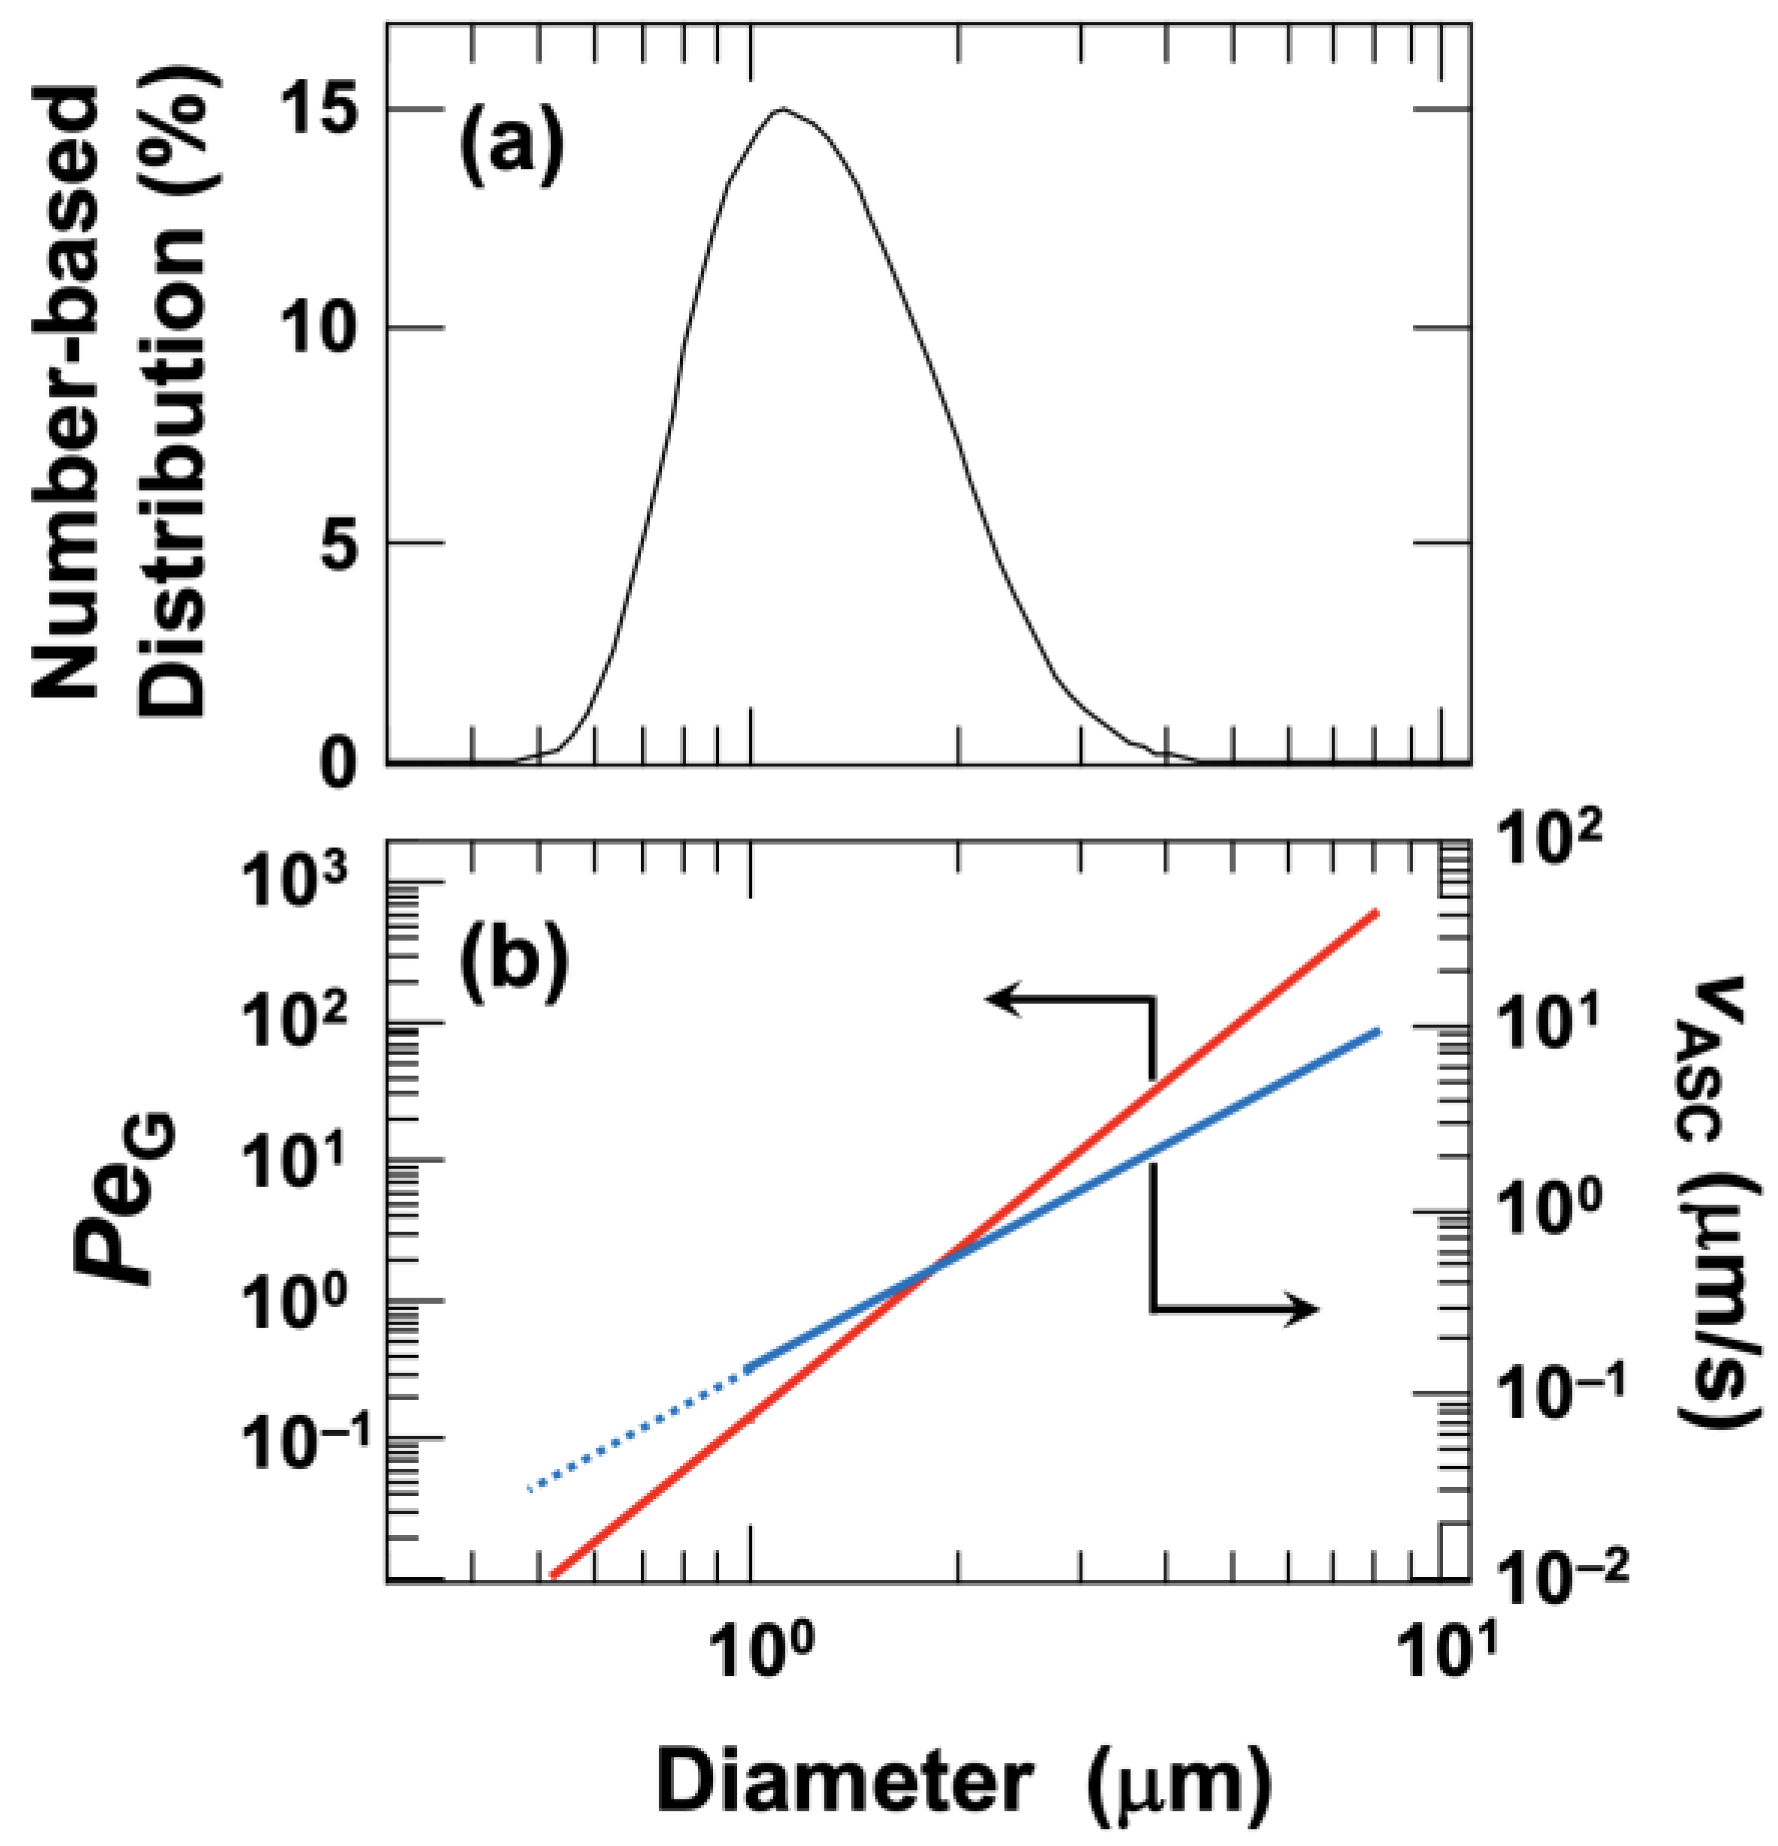
The effect of particle diameter on the buoyancy-driven ascent velocity, assuming that the gravitational Péclet number and the Stokes approximation are valid, is shown in
Figure 3b. For hollow particles with a number-averaged diameter of
dz = 1.4 μm, the gravitational Péclet number was approximately 0.55. This indicates a regime where the effects of gravity and diffusion are comparable, although the influence of diffusion is relatively small. The gravitational Péclet number ranged from 0.009 (for
d = 0.5 μm) to 590 (for
d = 8.0 μm). Because the Péclet number is large for particles with a diameter of 8.0 μm, the effect of diffusion can be neglected for such particles. According to the DLS measurements, particles with diameters of 1.3 µm or less account for approximately 20% of the total volume, while those smaller than 1.0 µm account for less than 10%. Therefore, for the group of particles larger than the average diameter—which constitutes about 80% of the total volume—buoyancy is the dominant factor. These results suggest that for most particles, buoyancy is dominant over diffusion during the drying process of the droplet.
The particle Reynolds number (
Rep), which indicates the relative importance of inertial and viscous forces acting on a particle in a fluid, is given by the following equation:
where
ρw is the density of water,
v is the sedimentation or buoyancy velocity of the particle, and
η is the viscosity of water (0.00089 Pa·s at 25 °C). According to our previous study [
31], the average buoyancy velocity of hollow particles in water was found to be 0.28 μm/s. Under these conditions, for a particle with
dz = 1.4 μm,
Rep was extremely small, calculated as 4.4 × 10
−7. This confirms that the buoyancy-driven ascent velocity of hollow particles of this size can be accurately described by the Stokes approximation. When the Stokes approximation is valid, the buoyancy-driven ascent velocity (
vASC) of a hollow particle is expressed as:
Assuming that the density of all hollow particles is 0.77 g/cm
3 regardless of particle size, the buoyancy velocities in water ranged from 0.28 μm/s (for
dz =1.4 μm) to 9.0 μm/s (for
d = 8.0 μm), as shown in
Figure 3b.
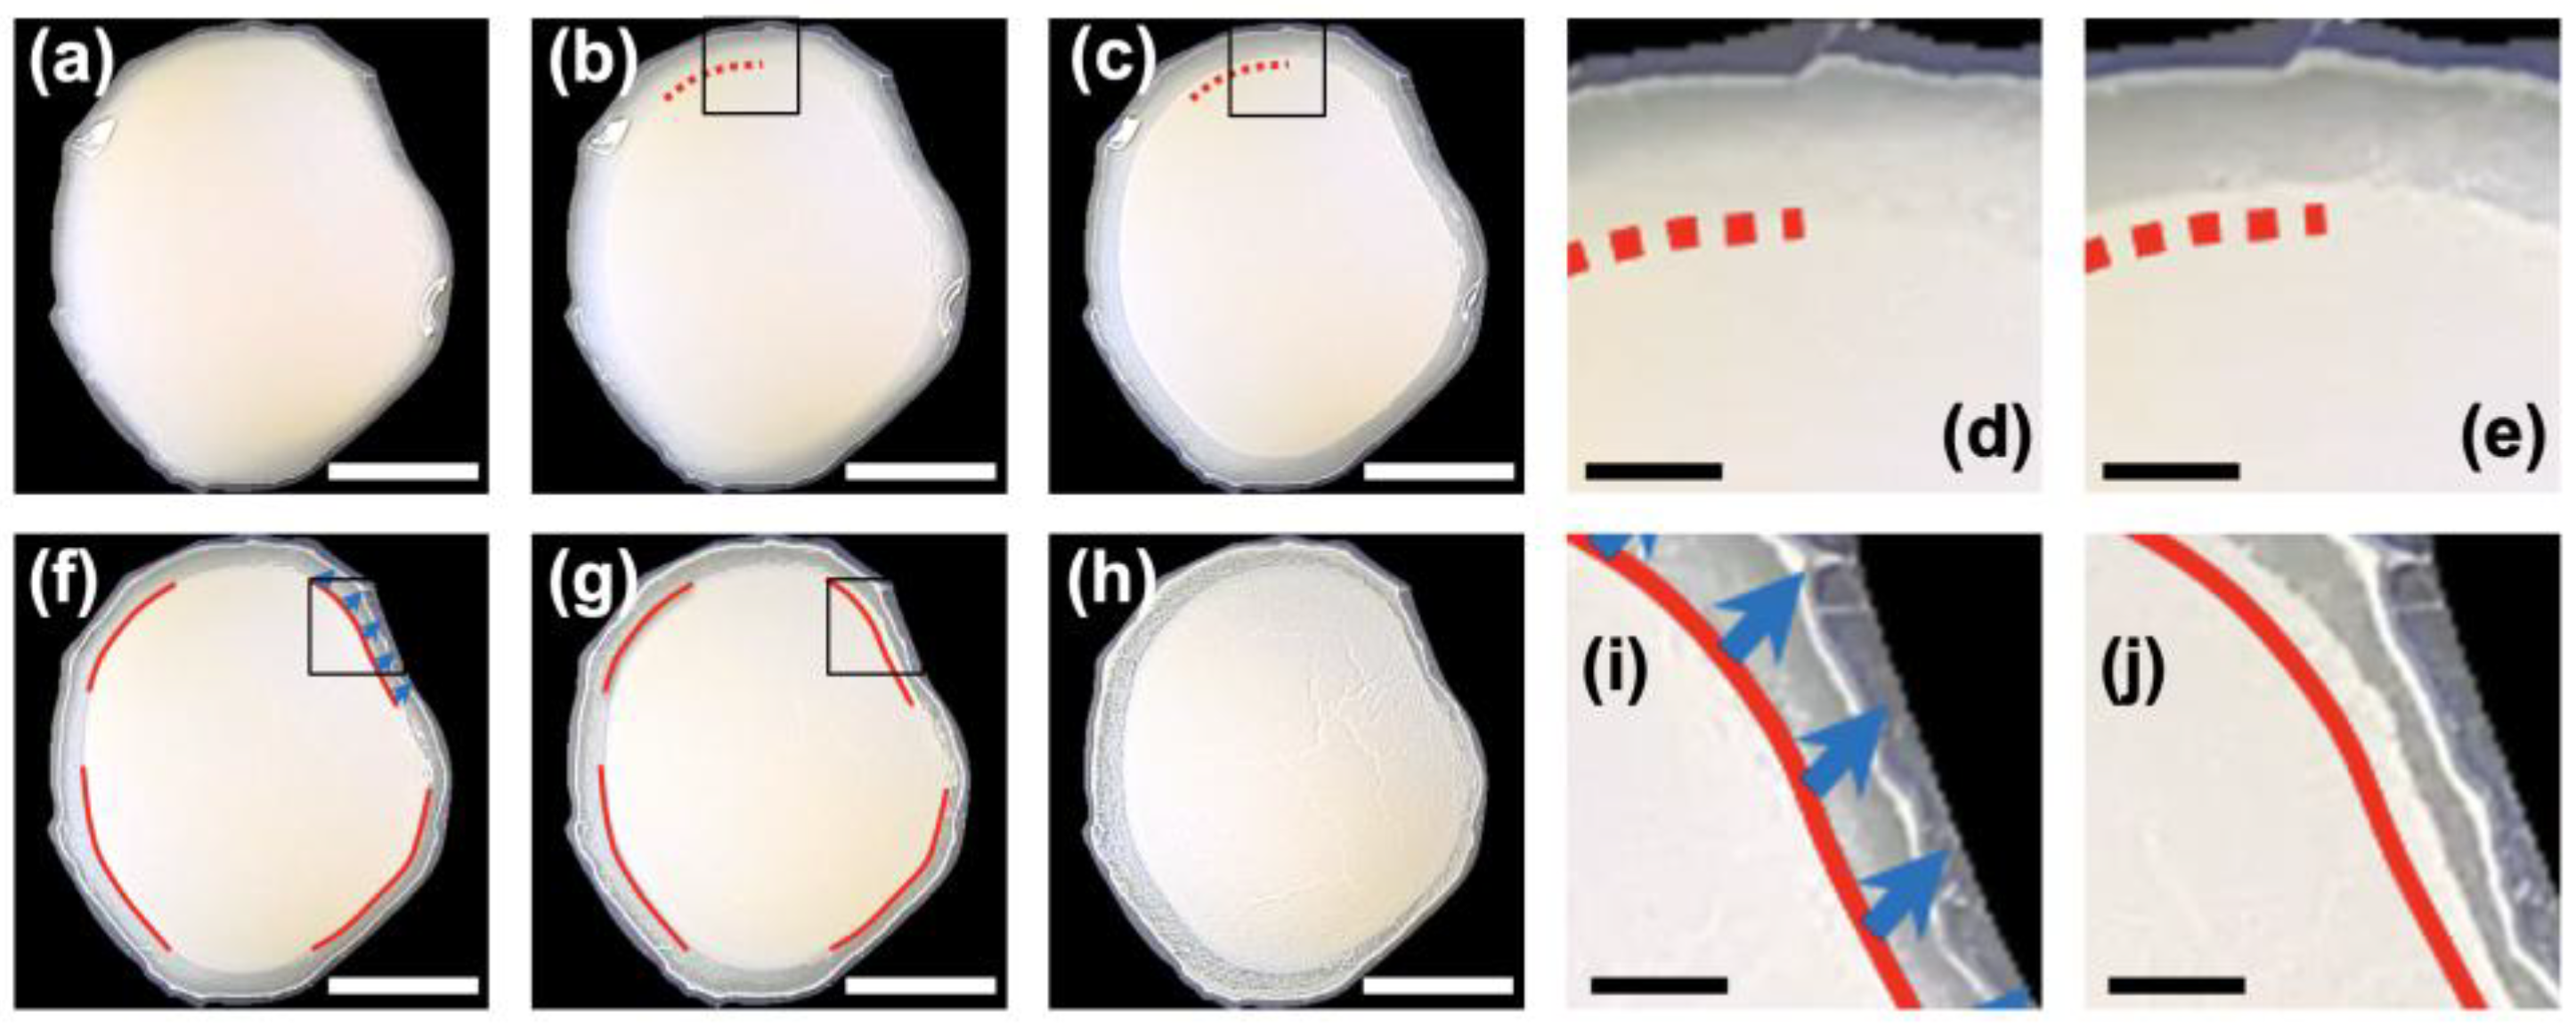
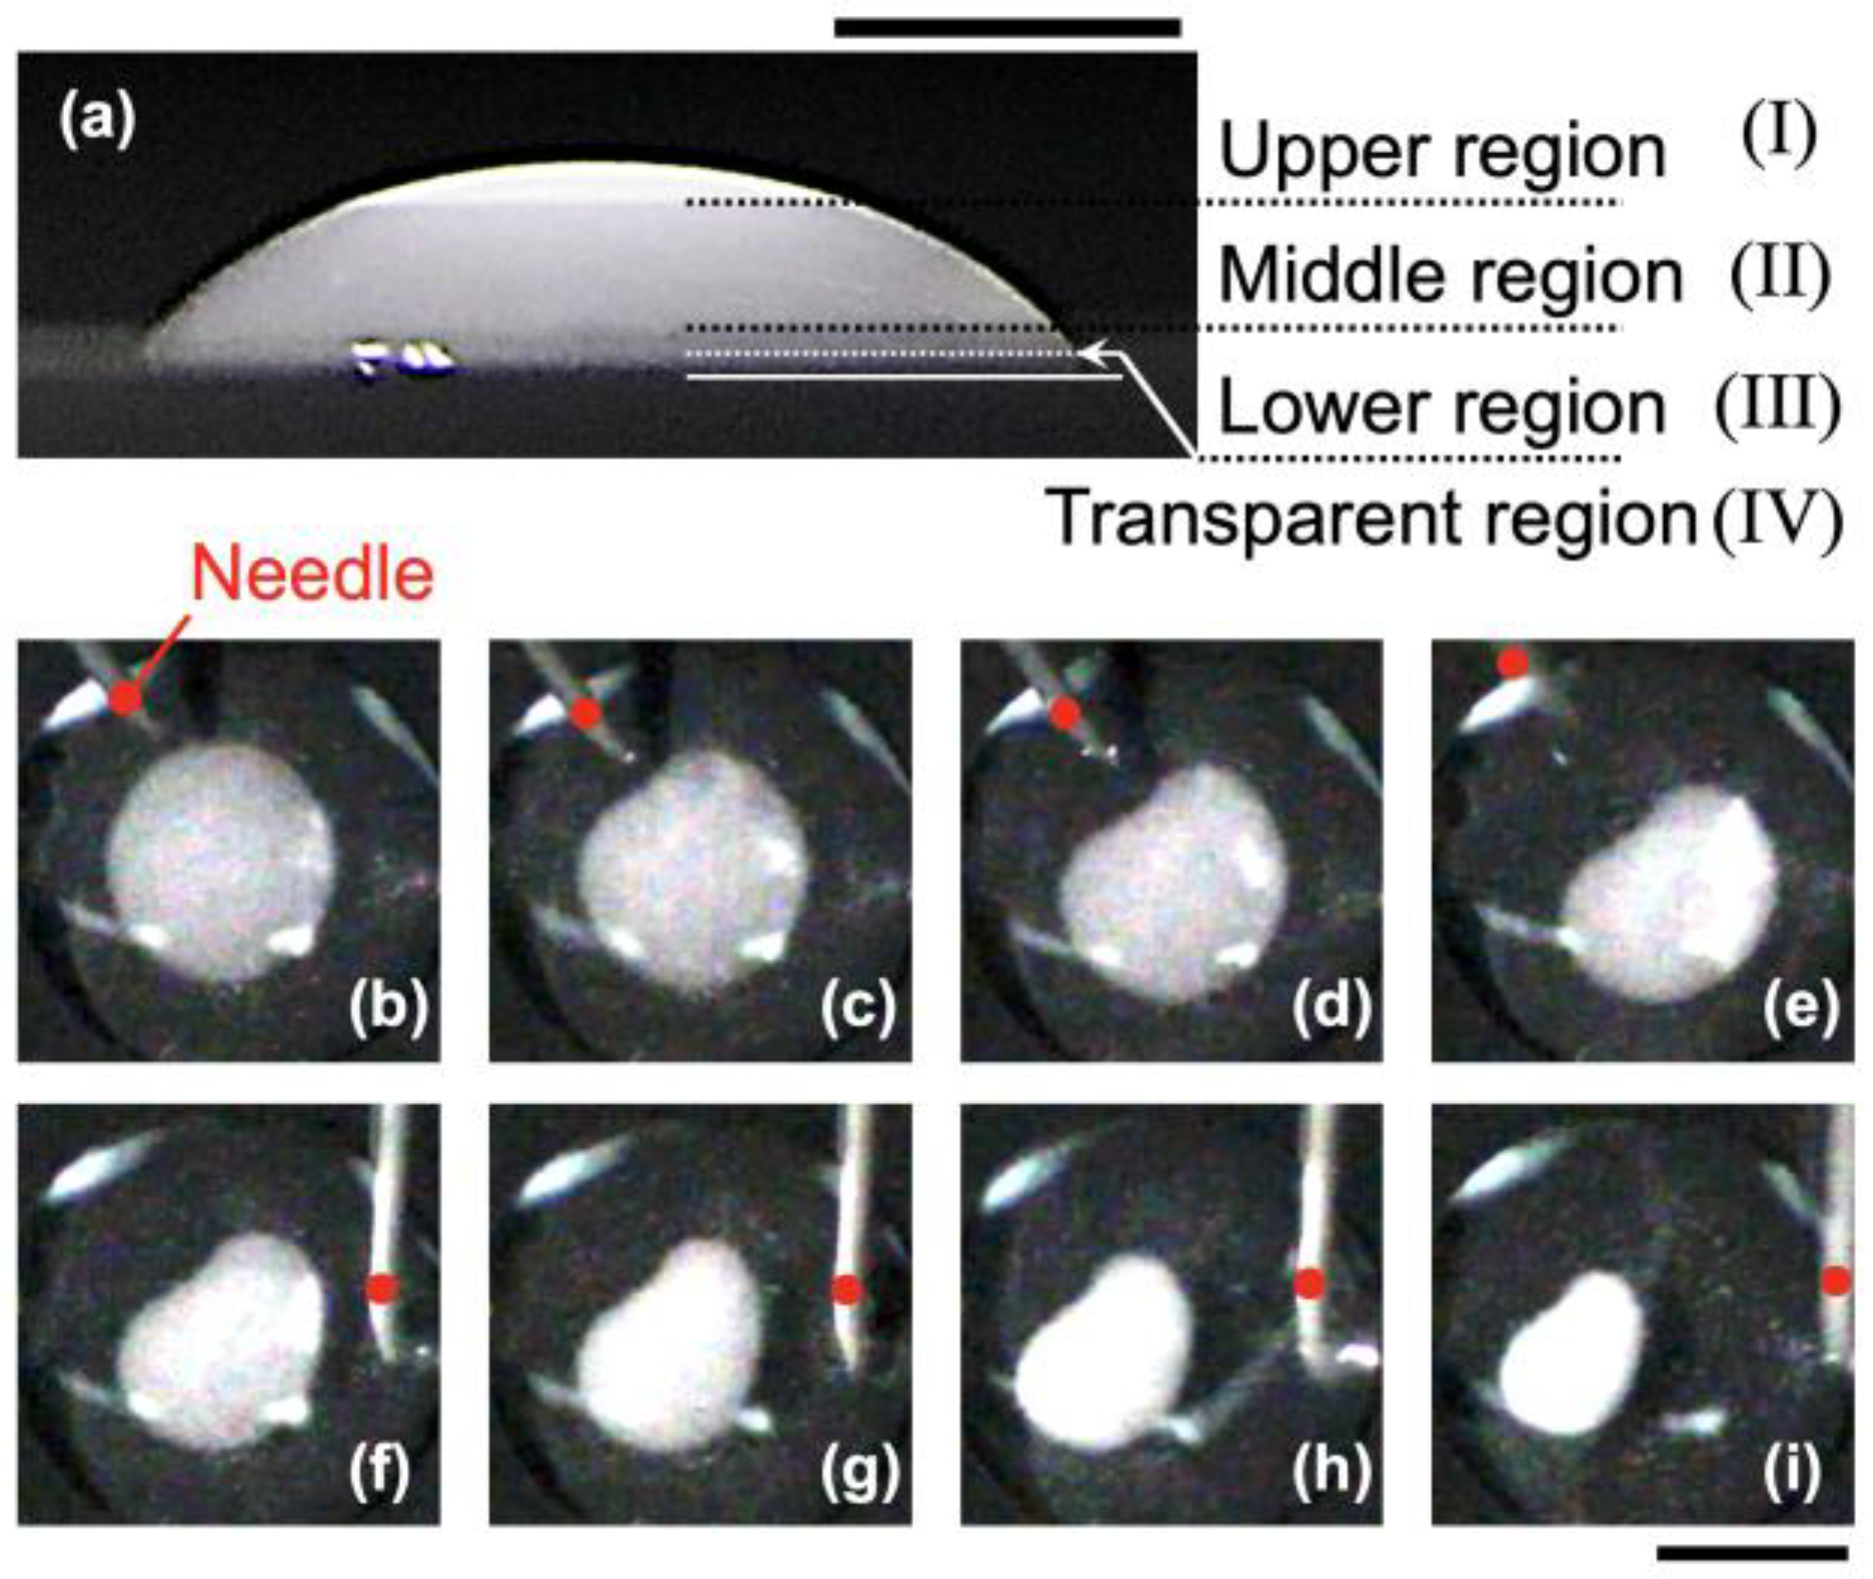
An example of a droplet observed from the horizontal direction 15 min after deposition is shown in
Figure 4a. The maximum height of the droplet (at the center) was 3.2 mm. The concentration distribution of hollow particles within the droplet was divided into four distinct regions: the upper region (I), middle region (II), lower region (III), and transparent region (IV). These four regions were separated along horizontal planes. The upper region (I) exhibited the highest degree of turbidity and was located at heights
H > ∼2.6 mm from the bottom. The middle region (II) had a lower degree of turbidity and spanned approximately 0.5 mm <
H < 2.6 mm. These regions correspond to the previously described floating cluster (FC). The lower region (III) exhibited even less turbidity and occupied heights
H < ∼0.5 mm. Below this, there was a relatively transparent region (IV).
The buoyancy-driven ascent velocity of the largest hollow particles with a diameter of 8.0 μm present in the droplet, assuming the Stokes approximation, was calculated to be 9.0 μm/s. This corresponds to a buoyant ascent distance of 8.1 mm over 15 min. This suggests that in region (I), larger hollow particles with diameters around 8.0 μm are densely packed. The fact that regions (I) and (II) are separated by a relatively distinct horizontal plane implies that the surface of the droplet, at least in region (I), is covered by a densely packed layer of hollow particles due to buoyant ascent. Furthermore, the hollow particles that have floated up to the droplet surface appear to continue migrating along the surface to higher positions. The changes in drying patterns observed from above (
Figure 1 and
Figure 2) can be explained by the buoyant motion of these particles. Regions (II) and (III) are separated by a less distinct boundary. The buoyancy-driven ascent velocity of hollow particles with a z-average diameter
dz = 1.4 μm is 0.28 μm/s, resulting in a buoyant ascent distance of 0.25 mm over 15 min. This distance roughly corresponds to the boundary between the lower region (III) and the transparent region (IV). Therefore, the ambiguous boundary between regions (III) and (IV) is likely the transition between region (III), which contains a relatively higher proportion of smaller particles including those around the average size, and region (IV), where diffusion becomes dominant and very small particles prevail. Since the gravitational Péclet number for hollow particles with
dz = 1.4 μm is approximately 0.55, the presence of smaller particles influenced by diffusion likely contributes to the formation of the indistinct boundary between regions (III) and (IV). As will be discussed later, after drying, region (III) observed from above forms a fractal-like pattern, consisting of low-density, dendritic or mesh-like clusters. This observation suggests two possibilities for region (III): (A) a thin layer of fractal clusters with low particle number density formed at the droplet surface, or (B) flocculated structures dispersed in water that organize into fractal patterns upon the completion of drying. Overall, these results indicate that for most hollow particles used in this study, buoyancy predominates over diffusion during the drying process, as discussed earlier.
The central floating cluster (FC) was directly stimulated at the droplet surface using a needle (
Figure 4b–i). First, the needle was gently brought close to the droplet surface from the upper left direction in
Figure 4b and made contact with the surface. Immediately after contact (
Figure 4c), the originally circular FC deformed. The deformation occurred very rapidly, reaching the state shown in
Figure 4e within less than one second after contact. Subsequently, the needle was gently brought close again, this time from the right side of the image. In this case, the needle touched the droplet surface at a location slightly away from the FC (
Figure 4g). As a result, the area of the FC abruptly contracted. This change also occurred rapidly, with the FC reaching the state shown in
Figure 4i within approximately 0.5 s after stimulation. The sudden reduction in area suggests that some hollow particles were forced beneath the FC and partially submerged into the water due to the physical vibration of the droplet surface caused by the needle. As the particle number density increases, the particles themselves can act as electrolytes, effectively raising the local ionic strength in the densely packed region. This may have led to the formation of a three-dimensional network. In other words, buoyancy not only transports particles vertically but also contributes to particle–particle interactions and network formation near the liquid–air interface during evaporation. The deformation behavior of the floating cluster (FC) upon external stimulation suggests that the FC is not merely a loosely aggregated cluster, but rather a flexible and elastic network structure. Furthermore, it indicates that the FC is likely formed through direct physical contact between hollow particles, rather than by interfacial adsorption.
3.4. Effects of ϕ and [NaCl] on Drying Patterns
The effects of particle volume fraction
ϕ and added salt concentration [NaCl] on the drying patterns of droplets after complete evaporation were investigated (
Figure 5). The drying patterns observed from above were generally established during the relatively early stage after droplet deposition and remained largely unchanged until complete drying. The overall appearance of the dried films was markedly different from that typically observed for colloidal dispersions containing particles denser than the dispersion medium. Focusing first on the effect of
ϕ, at the lowest volume fraction (
ϕ = 0.001), a coffee-eye pattern was formed due to the accumulation of hollow particles in the central region, while only a very faint and narrow ring appeared at the periphery. As
ϕ increased, the area occupied by hollow particles in the central region expanded, and at the highest
ϕ (0.1), the entire droplet was filled with hollow particles, and the peripheral ring disappeared. Interestingly, the width of the observed ring pattern was almost independent of both particle volume fraction and added salt concentration, remaining nearly constant at approximately 0.2 mm. No cracks were observed in the dried films under any of the tested conditions, suggesting the flexibility of the films formed by the hollow particles.
When correlating the concentration regions (I)–(IV) observed during droplet drying (
Figure 4a) with the drying patterns observed from above after complete evaporation, the relationships can be organized as follows:
Upper region (I) corresponds to the central part or the entire film, spreading circularly with a high particle number density, forming the coffee-eye structure (Id).
Middle region (II) surrounds region (Id) in a circular manner, exhibiting a lower particle number density, but upon completely drying, it integrates with (Id) to form an expanded coffee-eye structure (IId).
Lower region (III) surrounds region (IId) and corresponds to a fractal-like structure (IIId) characterized by an even lower particle number density.
Transparent region (IV) corresponds to a region comprising part of (IIId) along with the droplet edge area, which shows a high particle number density (IVd).
In typical drying patterns of sessile droplets, a central turbid bump-shaped structure (often referred to as a coffee-eye) is observed only under rather limited conditions, such as when the
ϕ is very high [
16,
30], when the droplet is in a gel state and convection is suppressed [
34], or in the case of pendant (hanging) droplets [
35,
36,
37]. In particular, for sessile droplets of hollow particle aqueous dispersions, the formation of a coffee-eye structure even at low
ϕ and in the sol state is a remarkable feature. Notably, in pendant droplets, particles are strongly influenced by gravity and form a concentrated deposition structure at the center [
38], which is often referred to as a “coffee-eye.” The drying patterns of hollow particle aqueous dispersions closely resemble these coffee-eye structures, suggesting that the underlying pattern formation mechanisms may be similar. Regarding the mechanisms of coffee-eye formation, both particle-interface adsorption-based mechanisms [
36] and non-adsorption-based mechanisms [
37] have been reported. In the case of hollow particles, considering that the formed coffee-eye structure readily moves during the drying process (
Figure 1 and
Figure 2) and that it exhibits rapid deformation (contraction) when stimulated with a needle, it appears that the particles are not adsorbed at the interface. Instead, they seem to accumulate at the center purely due to the large buoyancy forces acting on them.
All sessile droplets were dried under the constant contact radius (CCR) mode [
1]. In this mode, the droplets remained pinned on the substrate while the contact angle gradually decreased and the volume reduced over time. Investigation of the mass change during drying (
Figure 6) revealed that the rate of mass loss was constant for each droplet, strongly supporting that drying proceeded according to the CCR mode [
14]. When the added salt concentration was [NaCl] = 0.01 mol/L, the drying rate was faster compared to that under deionized conditions. Previous studies have reported that the addition of trace amounts of surfactants can induce Marangoni flow [
39], and that the enhancement of Marangoni flow can increase the drying rate [
5]. Therefore, at [NaCl] = 0.01 mol/L, the acceleration of the drying rate is considered to result from the induction of solutal Marangoni flow caused by concentration gradients along the droplet–air interface. In contrast, at [NaCl] = 0.1 mol/L, the drying rate decreased. At this salt concentration, except for the case with the smallest particle volume fraction (
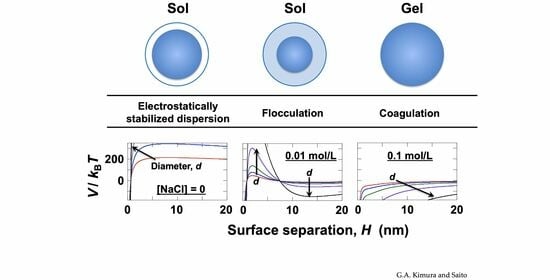
ϕ = 0.001), the floating cluster (FC) expanded throughout the entire droplet and formed the final drying pattern (
Figure 5e,j,o,t). This observation suggests that the reduction in electrostatic repulsion led to the aggregation of hollow particles, forming a three-dimensional network and resulting in the gelation of the droplet. As will be discussed later, the results of the DLVO potential curve analysis strongly support this interpretation. In gelled droplets, convection during drying is suppressed, making the decrease in drying rate a reasonable consequence.
The corresponding cross-sectional profiles (
Figure 7a–d) were consistent with the patterns observed from above and were very convincing. In the deionized condition (
Figure 7a–d), the characteristic feature of the cross-sectional profiles was the monotonic expansion of the “coffee-eye” region with increasing
ϕ. While a “coffee-ring” was formed, its width remained very narrow, as previously described. The maximum height of the coffee-ring was approximately 100 μm, regardless of the
ϕ or [NaCl] conditions. In addition, for
ϕ = 0.01 (
Figure 7e–h), the characteristic feature of the cross-sectional profiles was the existence of a minimum in the extent of the “coffee-eye” region as the salt concentration increased. Since the coffee-eye appeared to be circular when observed from above, its spread was evaluated as the radius
Robs based on
Figure 5 (
Figure 8). Comparing
Robs with the cross-sectional profiles revealed that the coffee-eye boundary could be visually recognized when the film thickness was greater than approximately 40 μm. When the thickness was less than 40 μm, it became considerably difficult to visually detect the presence of particles.
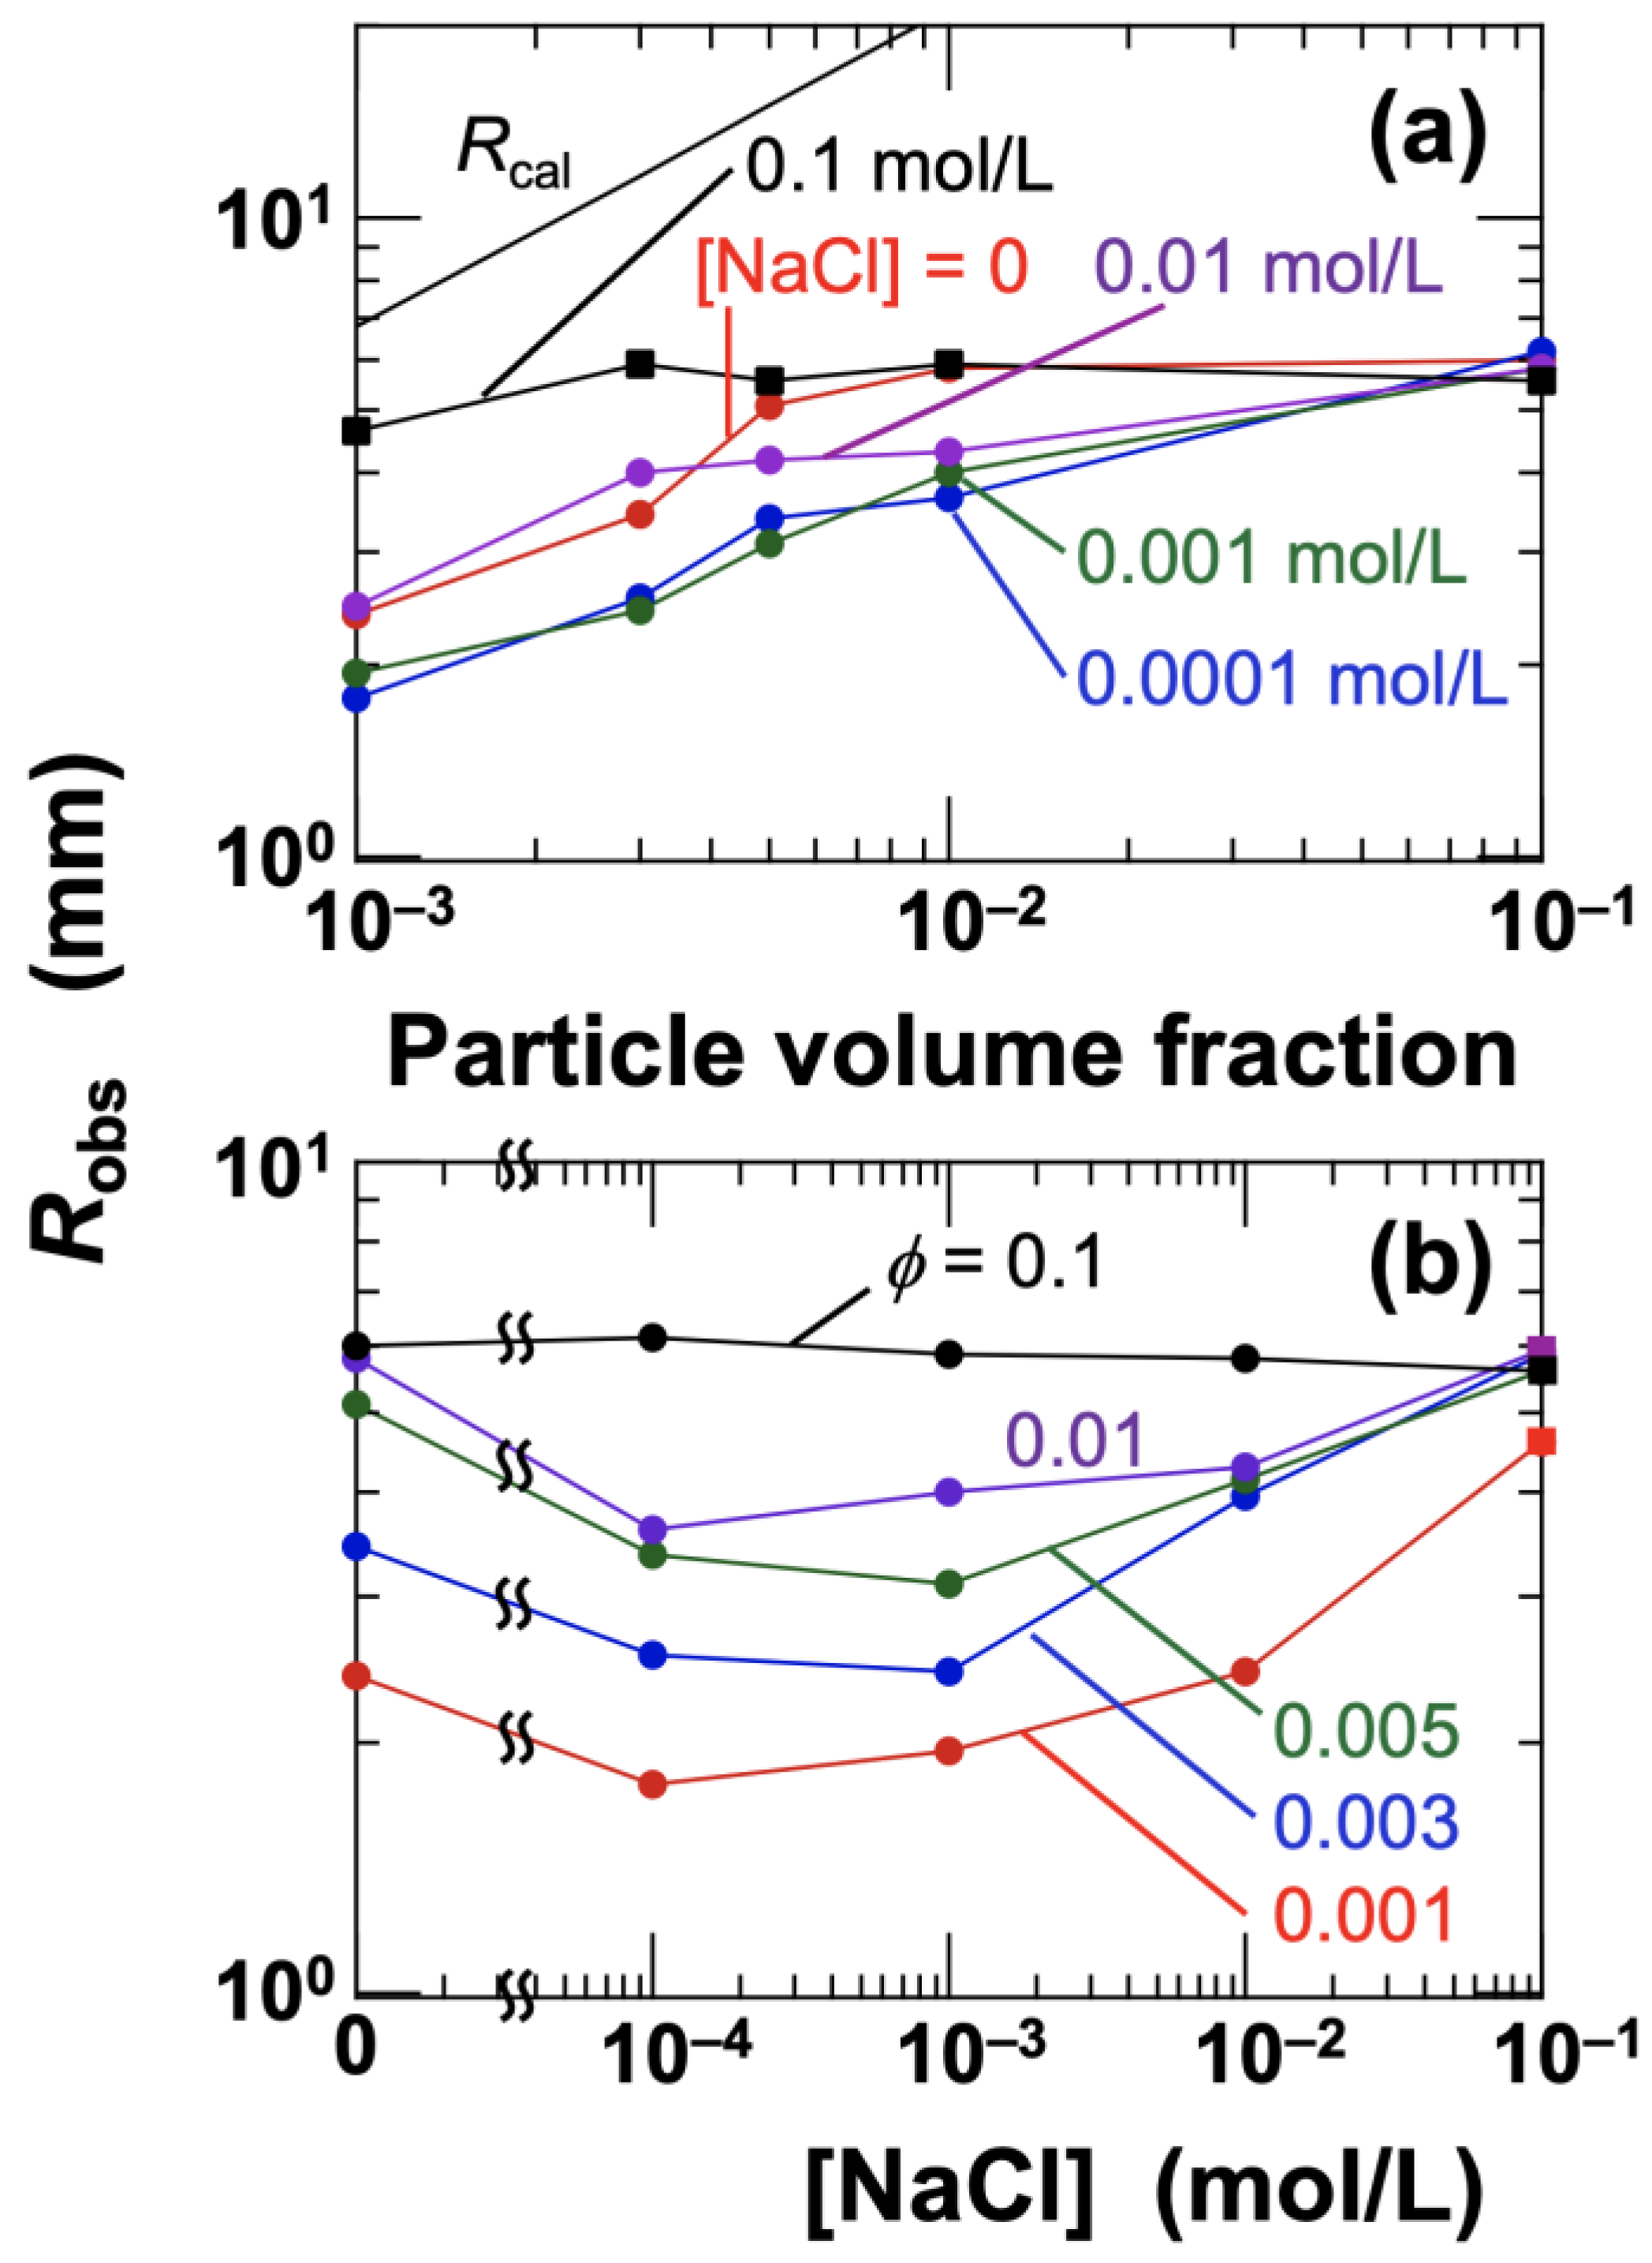
The radius
R of the entire dried film area remained relatively unchanged with variations in
ϕ and NaCl concentration, staying within the range of approximately 10–13 mm. The measured radius
Robs of regions I
d and II
d increased monotonically with increasing
ϕ, regardless of the salt concentration (
Figure 8a). This can be interpreted as an expansion of the central cluster due to the increase in particle number. When no salt was added, the cluster extended broadly across the droplet; however, at [NaCl] = 0.0001 mol/L,
Robs markedly decreased. With further increases in salt concentration,
Robs began to increase again, showing a clear minimum (
Figure 8b). At the highest salt concentration, [NaCl] = 0.1 mol/L, a pattern was observed where the turbid area expanded throughout the entire droplet, regardless of
ϕ, except for the smallest volume fraction (
ϕ = 0.001). In the case of
ϕ = 0.001, the number density of hollow particles was too low to induce gelation throughout the droplet. Thus, during the early stages of drying, the droplet remained in a sol state with individually dispersed aggregates, similar to the behavior seen at lower salt concentrations, where aggregates floated and tended to gather toward the center. Indeed, the drying pattern at
ϕ = 0.001 showed a centrally gathered structure similar to those at lower salt concentrations, but the clusters were notably irregular in shape rather than forming neat circles. Additionally, scattered NaCl crystals were observed near the droplet edge. As hollow particles floated during droplet drying, the edge region became increasingly enriched with NaCl solution. Efstratiou et al. (2020) [
40] reported that in sessile droplets of NaCl aqueous solutions, crystal rings aligned with spacing were formed around the droplet perimeter during drying. NaCl crystals were also clearly present within region I
d. For
ϕ = 0.001, the crystals were larger, and as
ϕ increased to 0.003 and 0.005, the crystal size decreased. This observation suggests that NaCl crystallization occurred with the hollow particle surfaces serving as nucleation sites.
When hollow particles float up to the droplet surface during the drying process, they subsequently migrate toward the apex of the droplet due to buoyancy. As a result, the hollow particles eventually accumulate at the center of the dried film. Assuming that the hollow particles assemble horizontally in a circular pattern under close-packed conditions, the following arrangement can be considered: for example, in the case of seven particles, one particle is located at the center and six particles surround it. In this case, the radius
Rcal of the circular area occupied by the hollow particles, observed from above, can be expressed as
Rcal = 3
r, where
r is the particle radius. Similarly, for a total of 19 particles,
Rcal = 5
r, and for 37 particles,
Rcal = 7
r. If the central particle is defined as the zeroth generation (
G = 0), then the above examples correspond to the first generation (
G = 1), the second generation (
G = 2), and the third generation (
G = 3), respectively. The total number of particles
N and the calculated radius
Rcal of the circular region can be expressed as follows, assuming a monolayer horizontal arrangement of hollow particles:
Using the average radius of the hollow particles,
r = 0.7 × 10
−6 m, the total number of particles
N, the generation
G, and the calculated radius
Rcal for each
ϕ are summarized in
Table 1.
The difference between
Rcal and
Robs (
Figure 8a) is clearly attributable to the fact that the actual clusters are not monolayer structures near the droplet surface but rather multilayered structures. During the early stages of drying, it is reasonable to assume that particles floating up to the droplet surface remain near the surface while gradually migrating toward the apex, leading to the formation of stacked structures as more particles ascend from below. An interesting observation is the existence of a minimum in
Robs with increasing salt concentration. Although the exact reason remains unclear at present, it is possible that the flocculation of smaller particles induced by the addition of electrolytes, or an increase in the influence of Marangoni convection, may be involved. In the case of droplets composed of ultrapure water, the influence of Marangoni flow is reported to be relatively weak [
41].
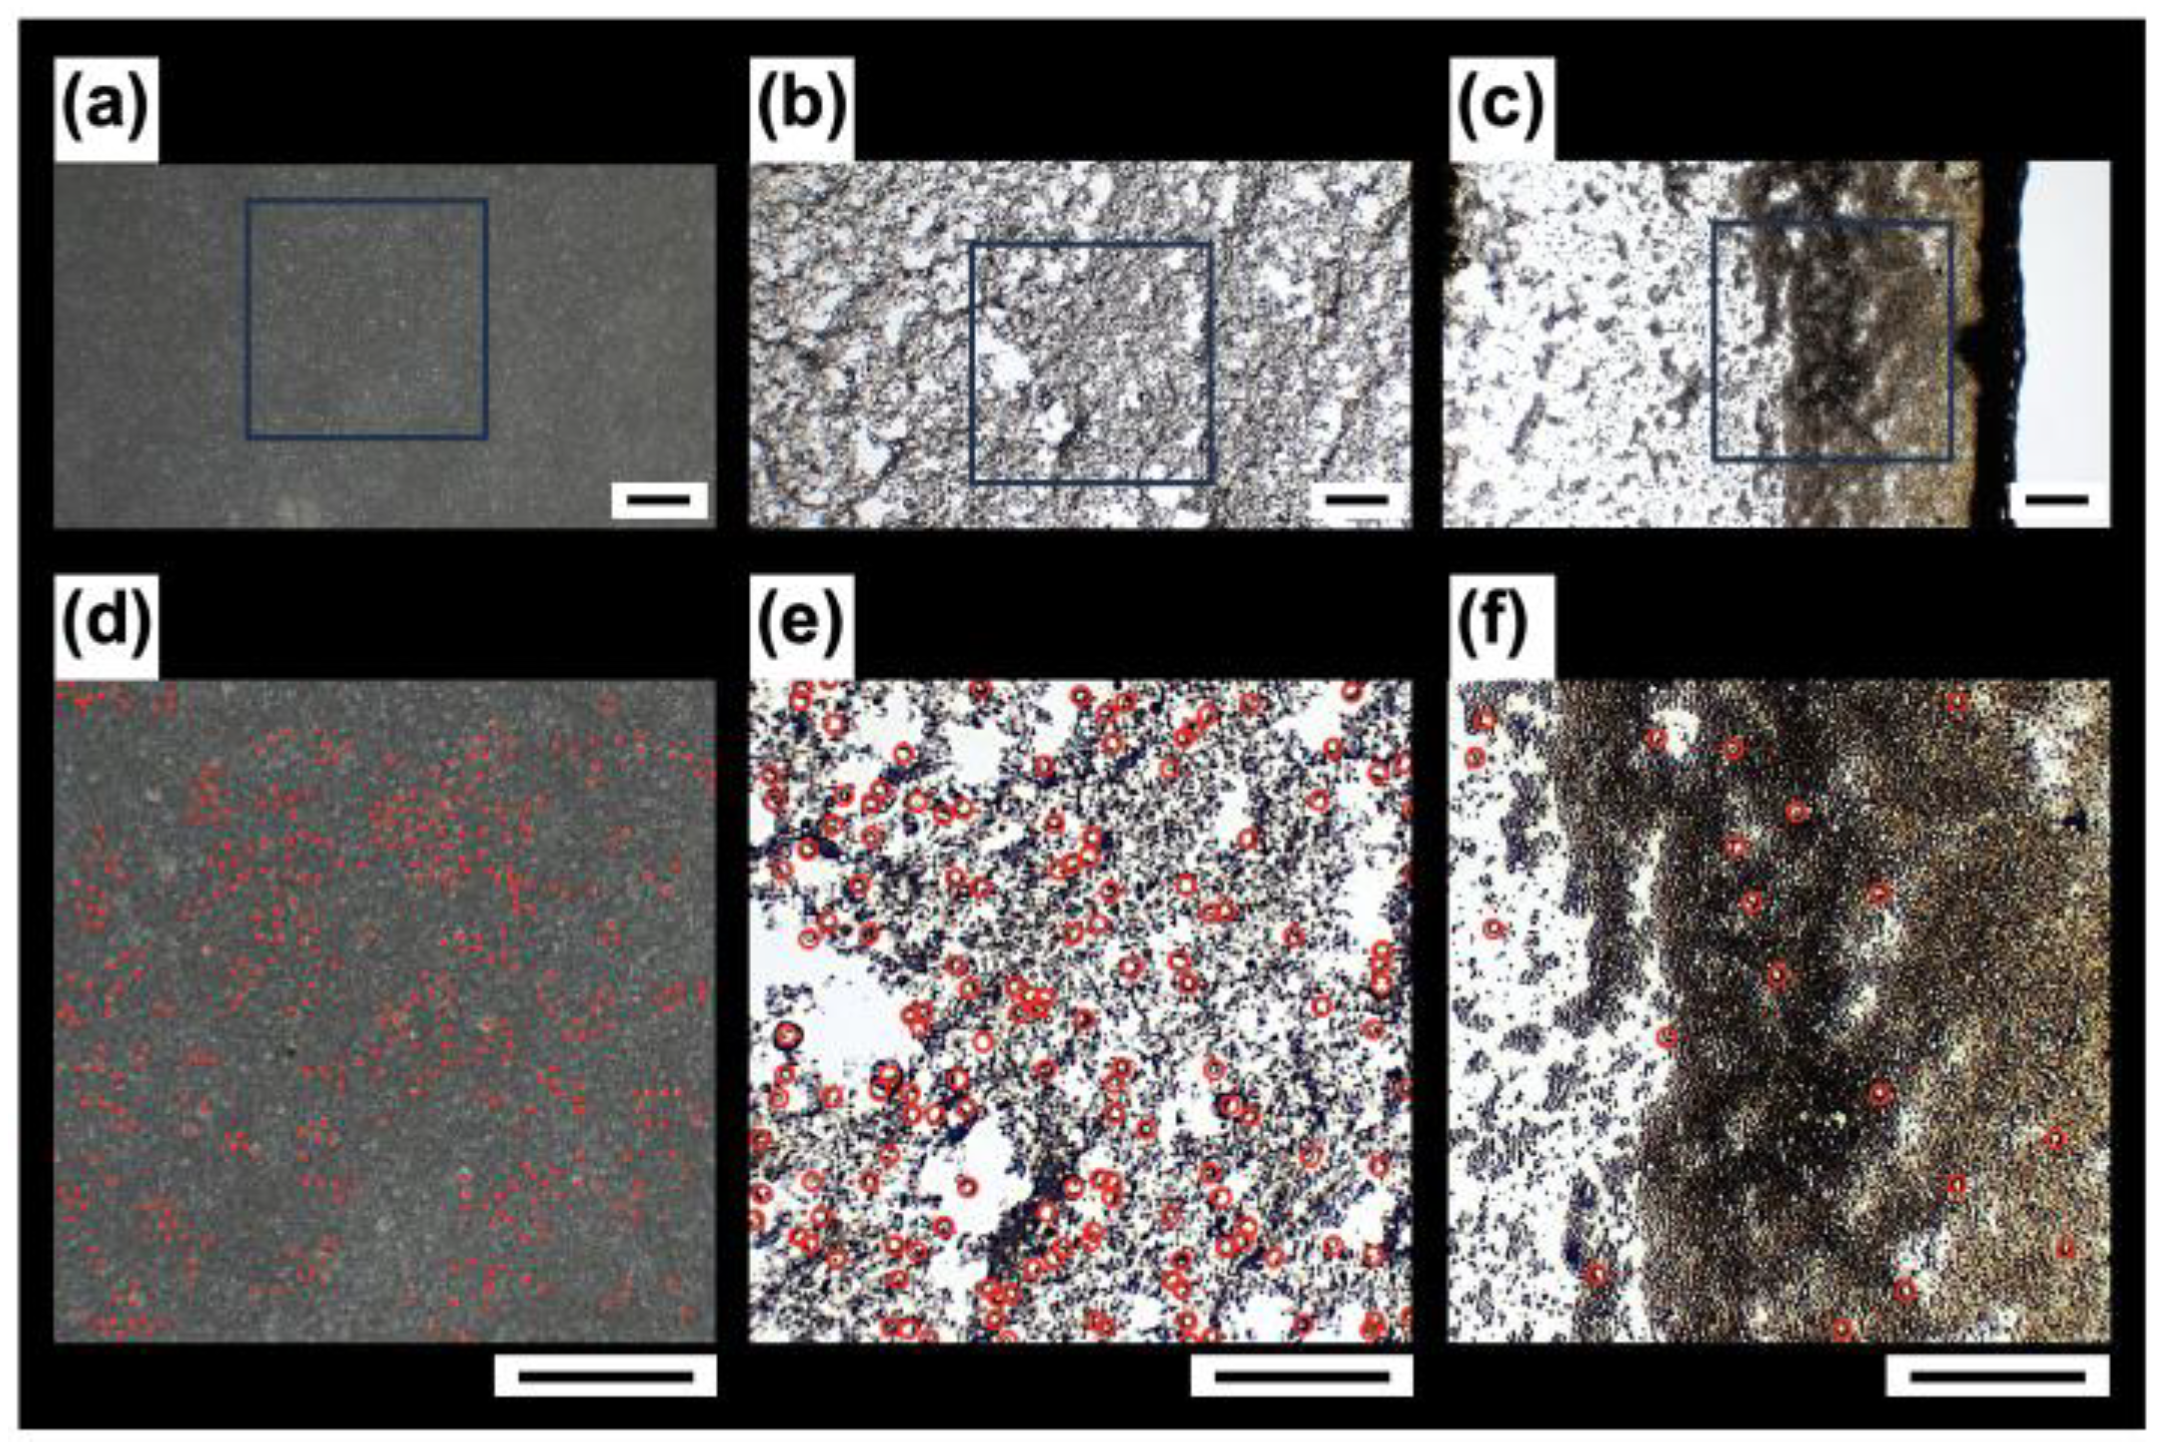
To observe the distribution of hollow particles forming the drying pattern, we enlarged three regions from
Figure 5g: the central region A, the outer region B, and the edge region C. In a part of region A (
Figure 9a), the particles were visually identified, and a red closed circle with a diameter of 3.0 μm was placed at the center of each identified particle. It should be noted that closed circles were placed only on the particles that could be visually confirmed. The spacing between these red circles corresponds to the case where large particles with diameters of approximately 8.0 μm are densely packed, indicating that many large particles were present in this area. Next, in a part of region B (
Figure 9b), all particles with diameters greater than 5.0 μm were marked with a red open circle with a diameter of 10 μm. Compared to region A, the proportion of large particles was clearly reduced. Similarly, in a part of region C (
Figure 9c), large particles were marked with red open circles, revealing that very few large particles were present. The observation that most of the large particles are concentrated in the center and that their number decreases with distance from the center is highly reasonable, considering that larger particles have higher buoyancy-driven ascent velocities. Additionally, although a small portion of the smaller hollow particles was transported to the periphery to form a ring, the majority of the smaller particles avoided capillary flow and floated upward.
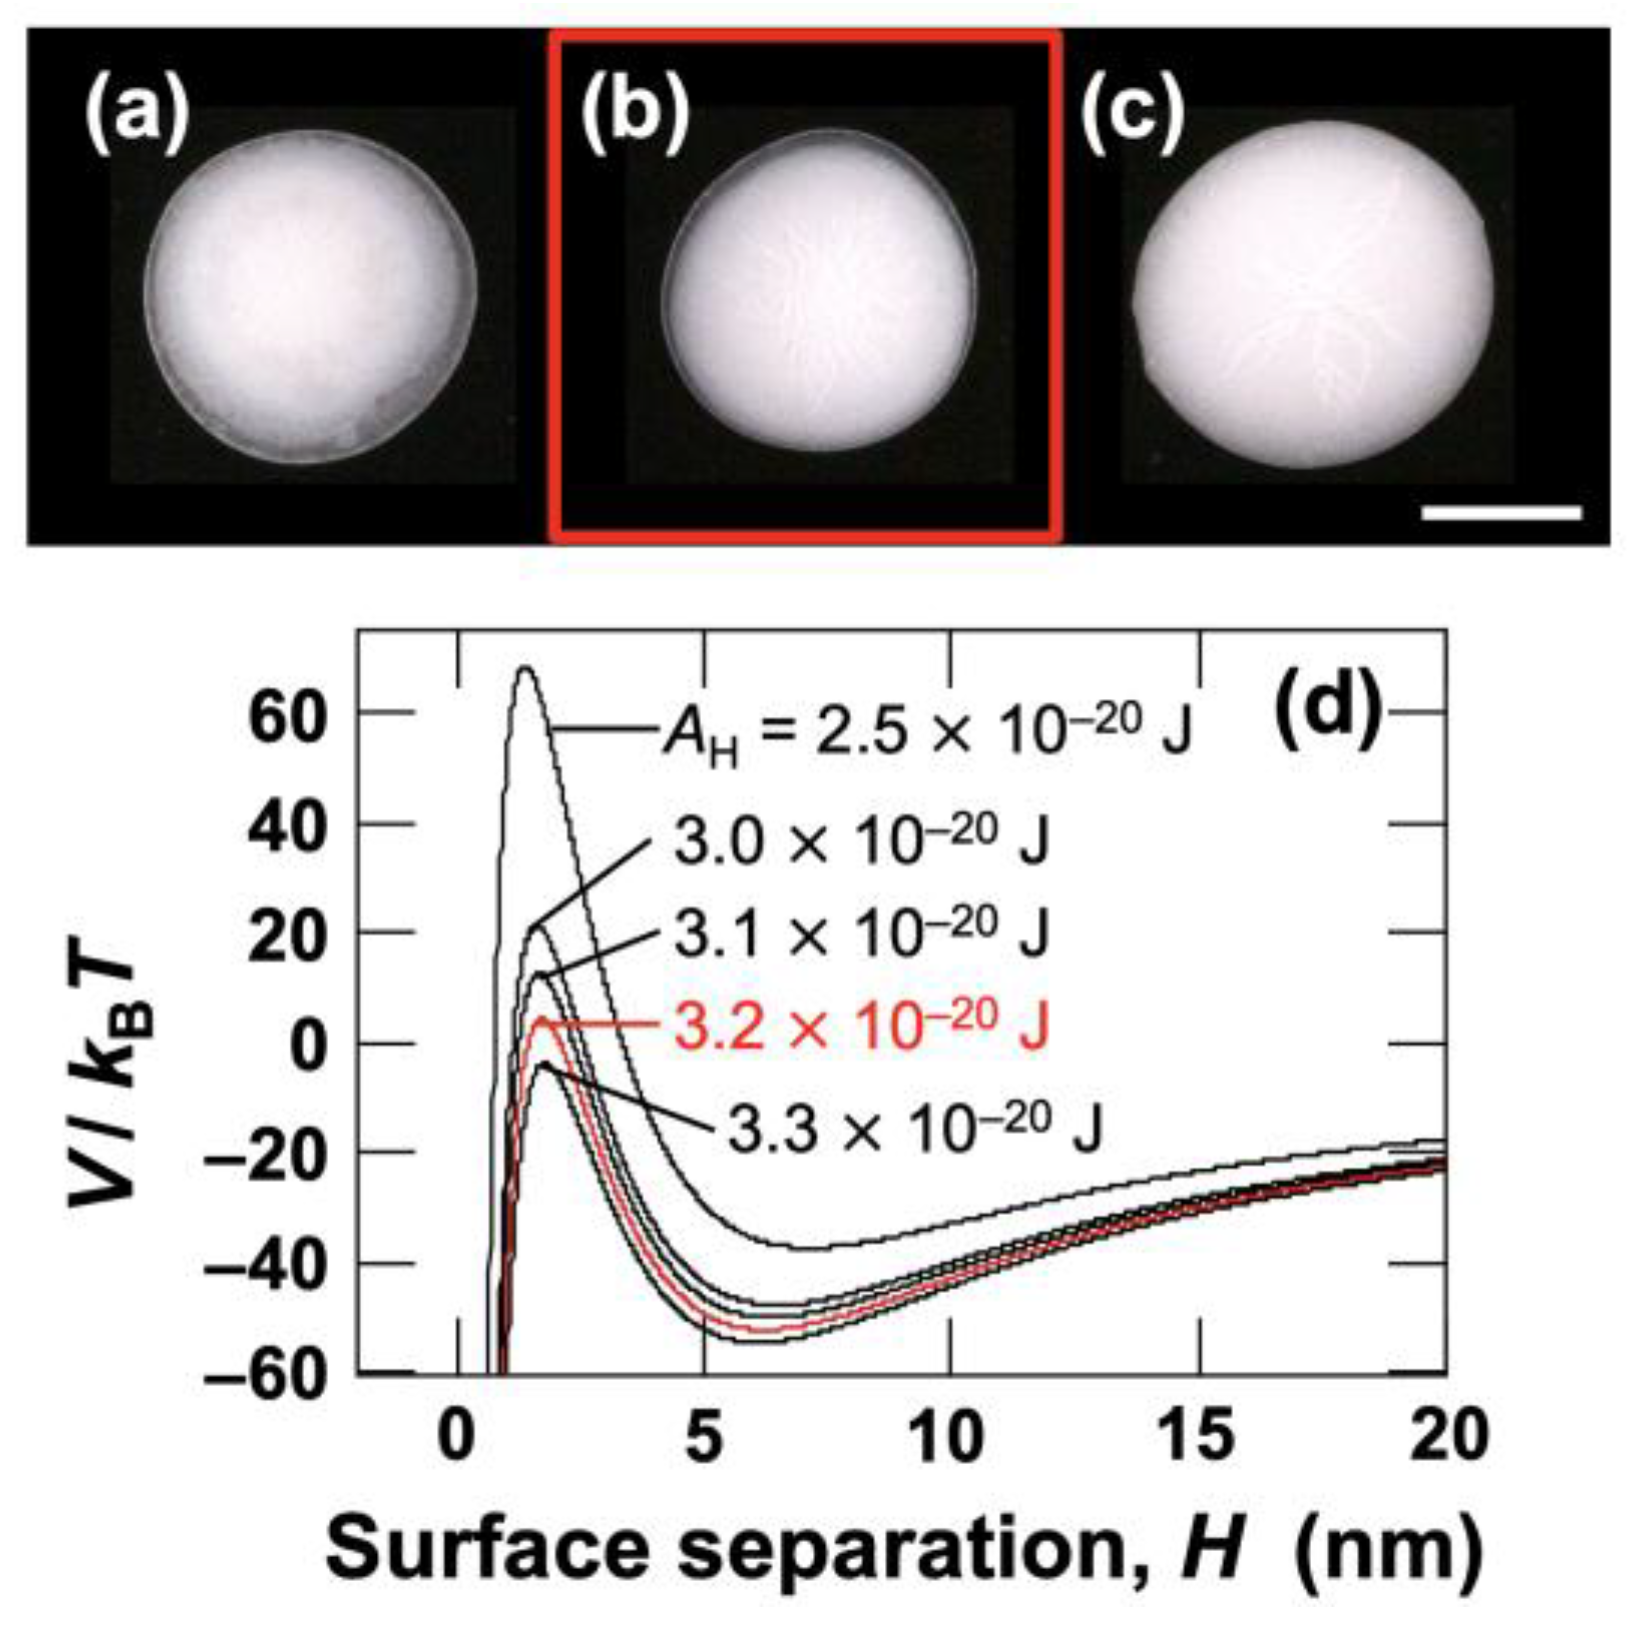
3.5. Hamaker Constant AH of Hollow Particles in Water
The fact that the drying patterns exhibit abrupt changes in the range of 0.01–0.1 mol/L clearly indicates the aggregation of hollow particles. More specifically, at [NaCl] = 0.03 mol/L and higher, almost the entire dried film became turbid (see
Figure 10a–c).
In water, hollow particles are covered by an electric double layer, and at lower salt concentrations, strong electrostatic repulsion acts between particles. Generally, the aggregation behavior of particles in water is discussed based on the DLVO (Derjaguin–Landau–Verwey–Overbeek) theory [
42,
43].
Here, the symbols represent the following parameters:
V is the total potential energy,
VR is the electrostatic potential energy,
VA is the van der Waals attractive potential energy,
ε is the dielectric constant of water,
ψ0 is the surface potential of the particle,
LD is the thickness of the electric double layer,
H is the inter-particle distance, and
AH is the Hamaker constant. The formula for
VR is applicable when
d ≫
LD [
44]. Assuming only 1:1-type electrolytes are present in the aqueous medium,
LD can be determined by the following equation [
45]:
where
κ is the Debye–Hückel parameter,
e is the elementary charge,
c is the electrolyte concentration, and
NA is Avogadro’s number. At 25 °C, the Debye length
LD as a function of electrolyte concentration
c (mol/L) can be approximated as follows:
Assuming that
c = 1.0 × 10
−5 mol/L,
LD is calculated as 96 nm. The value of
c was estimated from the electrical conductivity of the ultrapure water used [
46]. Regarding hollow particles, the Hamaker constant
AH is unknown. To determine
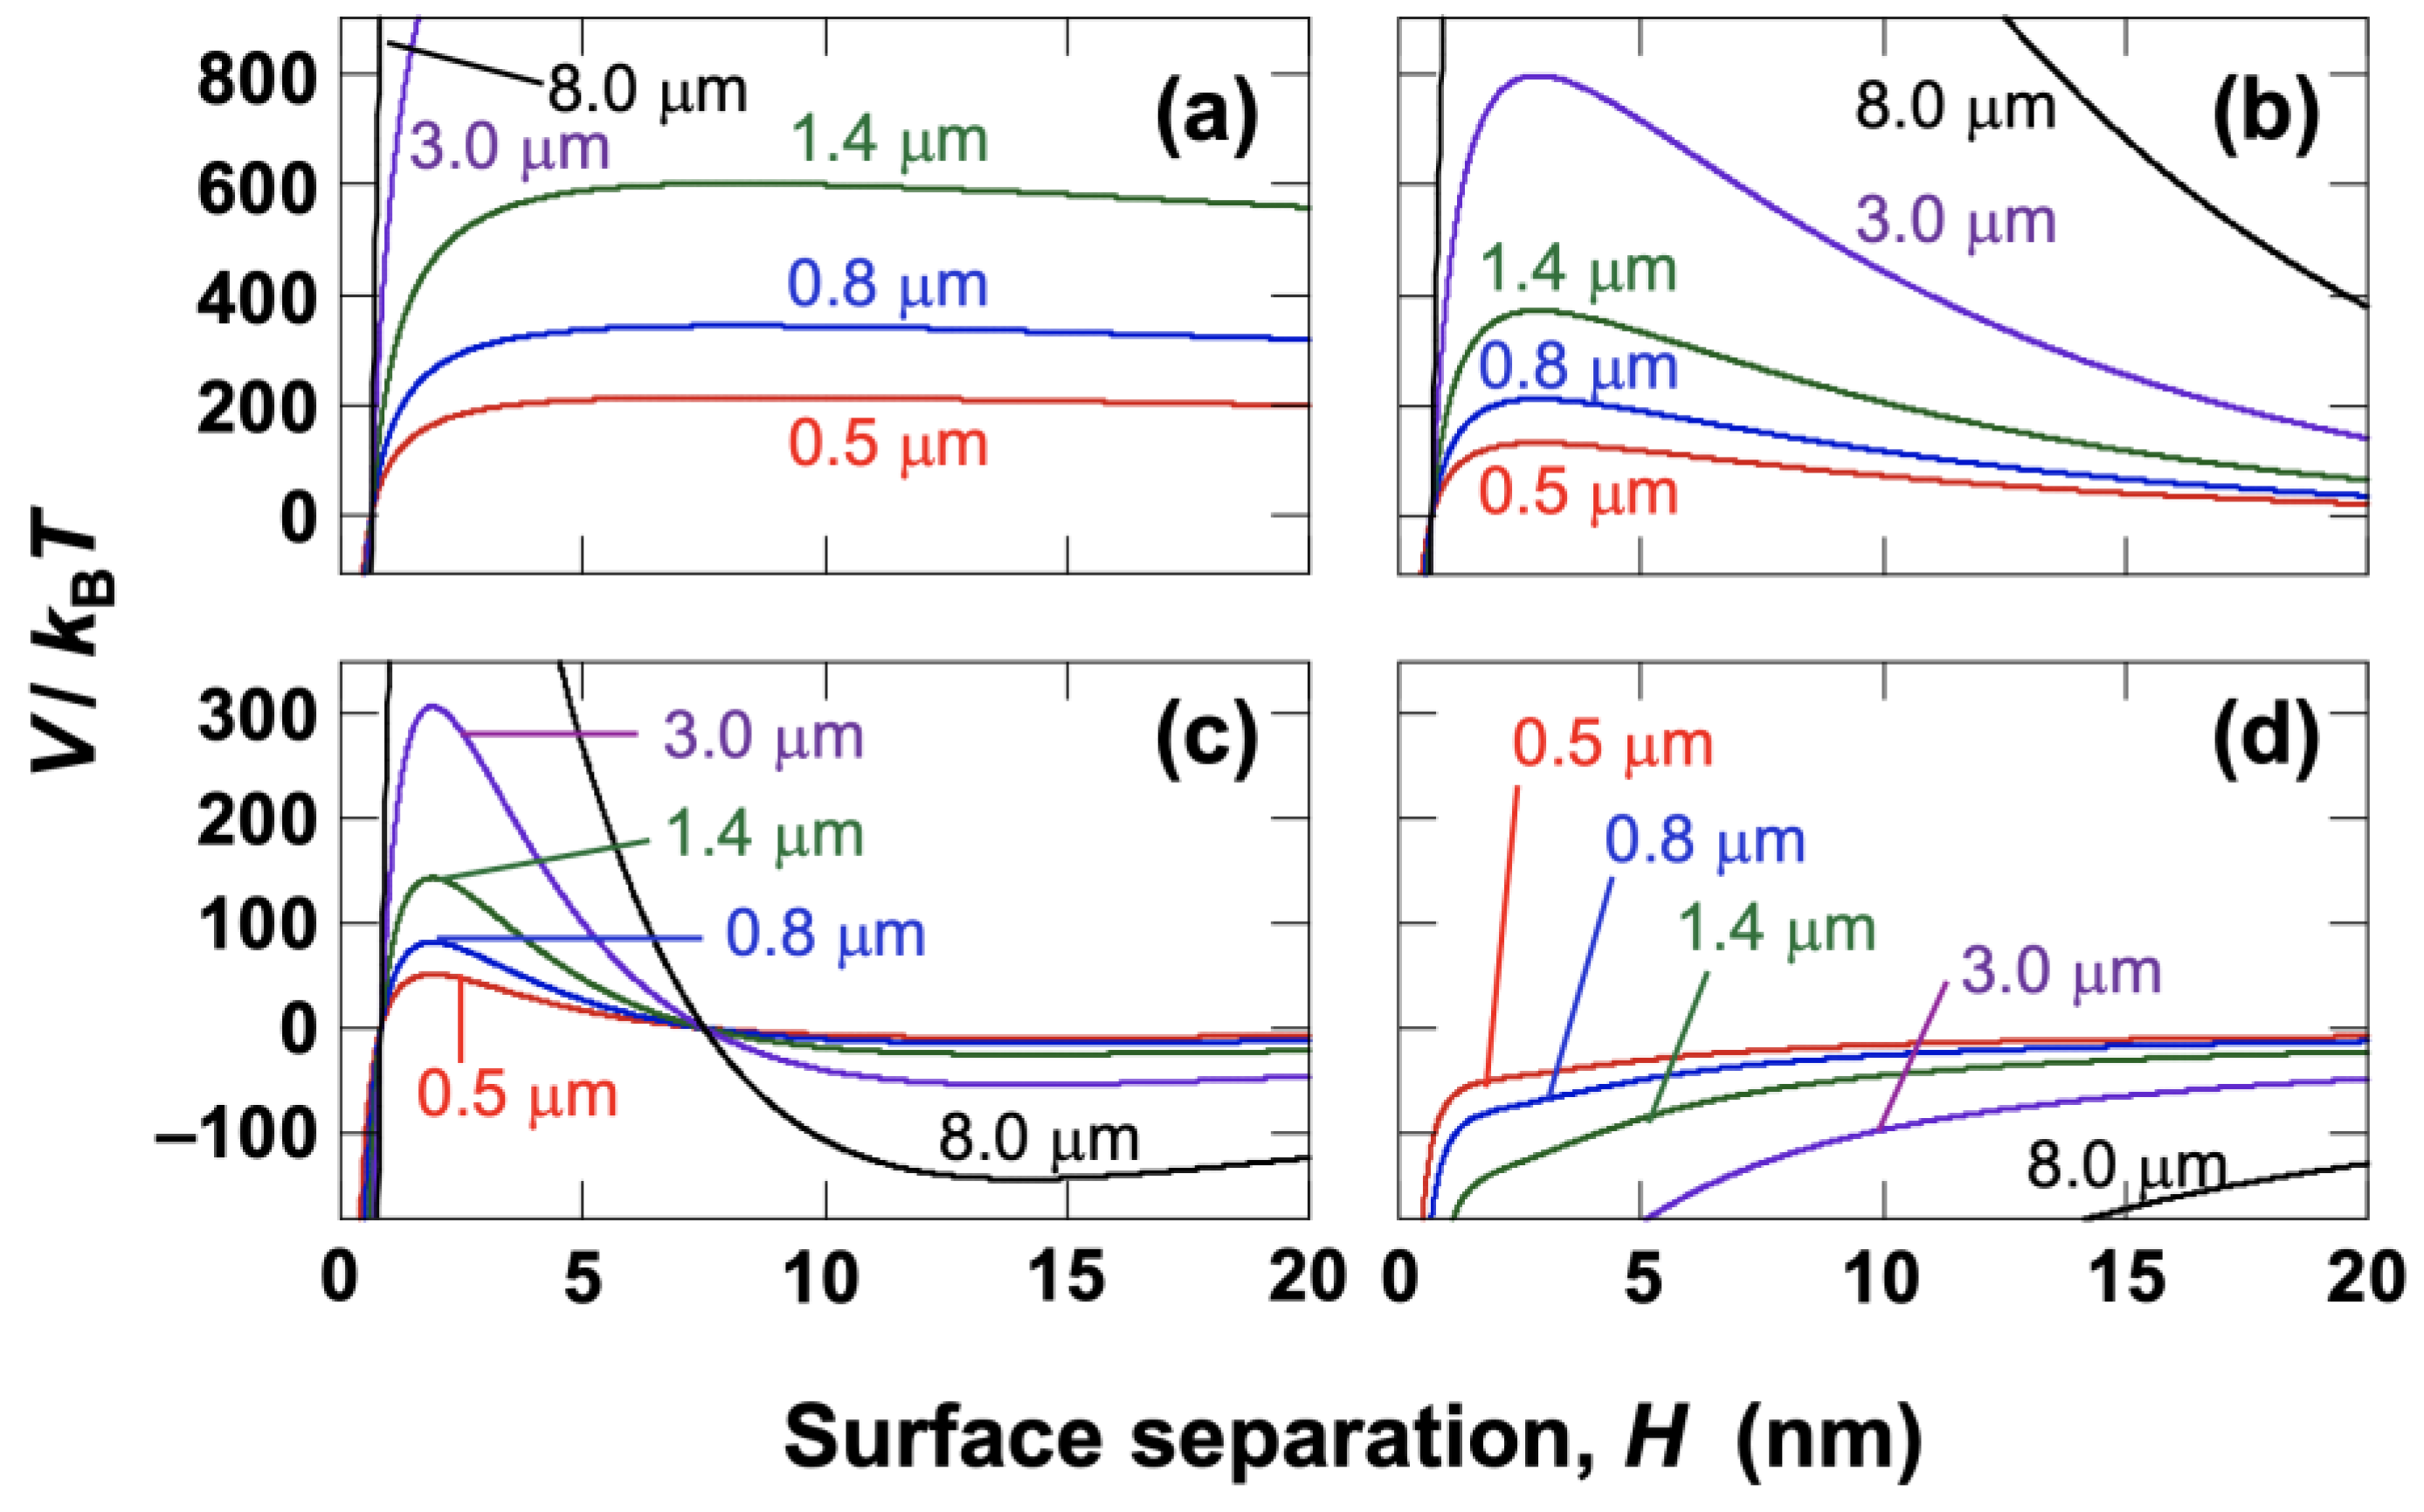
AH, a DLVO potential curve was constructed for [NaCl] = 0.03 mol/L (
Figure 10d). Generally, when the barrier height
V/
kB of the potential curve exceeds 25, particle aggregation upon close approach does not occur [
47]. Here, by setting the condition where
V/
kB reaches zero, the Hamaker constant for the hollow particles was determined to be
AH = 3.2 × 10
−20 J.


