Abstract
The drying process of microcrystalline cellulose and adipic acid particles in a cylindrical fluidized bed was investigated using the Gaussian spectral technique to monitor fluid–dynamic regime transitions associated with surface moisture loss. Pressure fluctuation signals were recorded and analyzed to assess hydrodynamic behavior. Excess moisture significantly alters the bubbling characteristics of the bed, leading to instability in the fluidization regime. The results demonstrated that the Gaussian spectral technique effectively captured these hydrodynamic changes, particularly at the critical moisture content threshold, when compared with the drying rate curves of the materials. For microcrystalline cellulose and adipic acid particles, it is reasonable to conclude that a mean central frequency above 5.75–6.0 Hz and a standard deviation exceeding 3.7–3.8 Hz correspond to a bubbling regime, indicating that the critical drying point has been reached. This approach provides a non-intrusive and sensitive method for identifying transitions in the drying process, offering a valuable tool for real-time monitoring and control. The ability to track fluidization regime changes with high precision reinforces the potential of this technique for optimizing drying operations in the pharmaceutical, food, and chemical industries.
1. Introduction
Drying solids in a fluidized bed is an operation that is often used in many industries because of the advantageous features assigned to the particles, such as uniform temperature distribution and high heat and mass transfer rates. The moisture content of the particles is one of the most relevant variables that affect the stability of the fluidization regime. It represents a parameter of paramount importance in monitoring product quality in terms of conservation of properties such as density, hardness, friability, disintegration time, compression strength, and barrier protection against attack by microorganisms [1,2,3,4]. Monitoring moisture content in real-time is extremely important to reduce energy consumption, friction losses, and over-drying. However, evaluating the real-time behavior of this variable is not easy. It has been performed using various techniques such as spectroscopy [5,6,7], electrical capacitance tomography [8,9,10,11], and acoustic emission signals [12,13,14,15,16]. The main disadvantages of the techniques are the high monetary cost and the dependence on high speed for data acquisition and subsequent processing, except for acoustic techniques, which are low cost but are very sensitive to interference from external noise. The need for calibration and dependence on the nature of the product limits the application of these techniques with reliability in the industry.
Moisture content of particles is one of the variables that have the most significant influence on the stability of the fluidization regime. Partial or total bed defluidization can occur in these processes, reducing the efficiency of the operation due to the appearance of regions with no activity or agglomeration of particles [2]. Pressure fluctuation signals have been used to evaluate the hydrodynamic behavior of fluidization, which is closely related to moisture content because excess moisture content affects the characteristics of a bubbling bed. According to [2,17], the use of pressure fluctuation signal measurement for real-time monitoring of fluidization quality is simple to implement, moderately easy to interpret data, has a high temporal resolution, is low cost, and is widely applicable in industrial beds. For these reasons, analyzing pressure fluctuation signals adds to extensive scientific work applied to fluidized beds.
The pressure fluctuation signals can be processed in time, frequency, time-frequency, and chaos domain [18,19,20,21,22]. These processing forms are universally accepted in the literature. They have been employed to evaluate the quality of the fluidization regime in coating [23,24], granulation [25,26], and drying processes [27,28,29,30,31,32,33]. Chaplin et al. [26] monitored the fluid dynamics of the granulation process in a fluidized bed by applying the EARS technique (Early Agglomeration Recognition System) based on the pressure fluctuation signals on the bed and the chaos theory. In this technique, the attractors are built based on pressure fluctuation signals. Applying the S-statistics measures the deviations concerning a reference attractor, in which the information on the ideal fluid–dynamic state of the process is incorporated. The S-statistics parameter could monitor the drying process by varying the pressure transducer’s position, the solids’ mass, and the drying air’s temperature. Chaplin et al. [28] observed that two well-defined states of the fluidization regime could be identified using S-statistics: a moist fluidized bed, present in the initial stages of the drying process, and a dry fluidized bed, where the bubbling regime occurs. The authors showed that the analysis of the dominant frequency and the standard deviation of the pressure fluctuation signal could not efficiently track the fluid–dynamic transitions.
Vervloet et al. [33] employed pressure transducers, passive acoustic emissions, and vibration measurements to monitor the drying process of a granule pharmaceutical whose composition was lactose monohydrate, microcrystalline cellulose, hydroxypropyl methylcellulose, croscarmellose, and distilled water. The authors analyzed both techniques regarding time, frequency, and chaos. The authors showed that only pressure transducer measurements and its processing in the chaos domain were able to reliably track the fluid–dynamic regime transitions during the drying process. Acoustic emissions and vibration measurements were not reproducible to track the drying process.
De Martín et al. [25] compared the frequency analysis of the power spectrum, the narrow-band standard deviation method, and the attractor comparison method to monitor drying and granulation processes in a fluidized bed to infer the evolution of the moisture content and the size of particles in both processes. In the drying process, the authors observed that the dominant frequency of the spectrum could be used to monitor the moisture content in the solid, although cautiously. The standard deviation method monitored the drying process, presenting different levels depending on the quantity of moisture removed from the solid. The filtered standard deviation increased and then became constant, indicating the final drying stage, varying the superficial air velocity and the position of the pressure sensor in the column. The authors showed that the attractor comparison method does not demonstrate the fluidization regime transitions in the drying process.
Zhang et al. [9] evaluated the hydrodynamic behavior of a fluidized bed based on electronic capacitance tomography and pressure signals from the bed, analyzing the pressure measurements with the aid of the wavelet transformation to study the wetting and drying behavior of gas–solid fluidization. The experiments demonstrated that the frequency domain exhibits complex behavior during the drying and wetting phases. Hence, the electrical capacitance, in conjunction with measuring the pressure signals, effectively monitored the bed regimes. This approach allowed a more comprehensive understanding of fluid dynamics than traditional single-point measurement tools, which generally cannot capture the complexity of multiphase flows.
Soares et al. [34] highlighted the practical implications of using temperature and pressure drop measurements to improve agricultural seed particles’ fluidized bed drying process with high surface moisture content. Changes in the temperature and pressure drop profiles were observed during the different drying stages, notably the transition from the constant to the decreasing rate period. The authors analyzed the pressure measurements in the frequency domain using the Fast Fourier Transform (FFT). The results indicated that the pressure drop measurements’ standard deviation correlates with the solids’ moisture content, suggesting that these measurements can serve as reliable indicators to monitor the drying process, leading to improved operational efficiency and product quality in industrial applications.
The present study provides a novel approach to monitoring the drying process of microcrystalline cellulose and adipic acid particles in a fluidized bed by employing a Gaussian spectral analysis of pressure fluctuation signals. While this technique has been successfully used to characterize fluidization regimes in coating processes, its application to drying monitoring represents an advancement in the field. The study demonstrates that key spectral parameters, such as the mean central frequency, the standard deviation of the pressure spectral distribution, and the fluidization factor, are sensitive indicators of moisture content variations in the bed. As moisture was removed, these parameters effectively capture the transition from stable to unstable fluidization regimes caused by liquid bridge formation. Furthermore, the strong correlation between drying kinetics and spectral monitoring parameters highlights the potential of Gaussian spectral analysis as a real-time tool for detecting critical regime transitions during drying. This work expands the applicability of spectral analysis techniques. It provides a valuable method for improving process control and optimization in industrial drying operations.
2. Materials and Methods
2.1. Materials
The materials used in this work are microcrystalline cellulose (Blanver, MC-500, Taboão da Serra, Brazil) and adipic acid (Rhodia Brasil, Santo André, Brazil). The particle diameter and apparent density of these solid particles are shown in Table 1. Both materials are classified as B particles, according to Geldart classification [35], and exhibit bubbling fluidization characteristics when dry.

Table 1.
Properties of the material.
2.2. Experimental System
The experiments were performed in a conventional fluidization column built in acrylic Plexiglas with an inner diameter of 0.143 m and height of 0.70 m. The air distributor plate was constructed of perforated stainless steel with 1.62 mm thick holes of 1 mm in diameter, divided into a triangular arrangement with a spacing of 8.5 mm. Figure 1 shows the experimental apparatus.
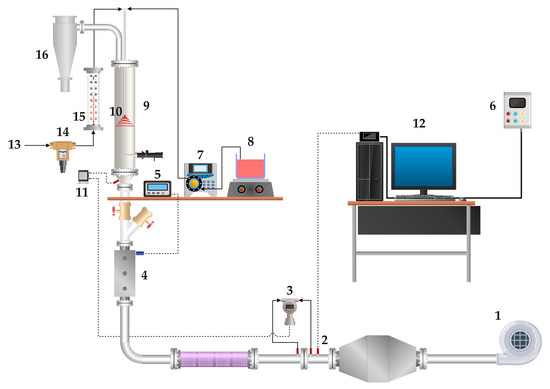
Figure 1.
Experimental apparatus: 1—blower; 2—pressure transducer; 3—differential pressure transducer; 4—air heating systems; 5—temperature controller; 6—frequency inverter; 7—peristaltic pump; 8—reservoir for atomized liquid; 9—fluidization column; 10—spraying nozzle; 11—differential pressure transducer; 12—data acquisition system; 13—compressed air line; 14—pressure regulating valve; 15—rotameter; 16—cyclone.
The air blower of 3 kW, used to promote the fluidization of the particles, was connected to a frequency inverter (Danfoss VLT, 2800, Nordborg, Denmark). The airflow was determined by an orifice plate of 0.01 m internal diameter. The air temperature in the plenum chamber was maintained at the set-point desired by electric heaters, controlled by a PID controller (Novus, N1100, São Paulo, Brazil).
The pressure drop across the orifice plate and its up-wind pressure were measured by a differential pressure transmitter (Smar, LD301, range: 0.12 to 5.00 kPa, São Paulo, Brazil) and a pressure transmitter (Cole Parmer, 07356-01, range: 0 a 211 kPa, Vernon Hills, IL, USA), respectively. A differential pressure transmitter obtained the bed pressure in the plenum (Cole Parmer, 68014-18, range: 0 to 6.2 kPa, response time of 250 ms). The data acquisition system consisted of a PCI 6024 E (National Instrument, Austin, TX, USA). The sampling frequency used was 400 Hz with 2048 data points. This sampling frequency was chosen to avoid the aliasing phenomenon. In fluidized beds, the maximum frequency of the signal is usually less than 10 Hz. All pressure data were acquired and processed using LabView 7.1TM software.
A peristaltic pump (Cole Parmer, 7518-00, Masterflex L/S) was used to transport water to the double fluid nozzle atomizer (Spraying Systems, SU12A, São Bernardo do Campo, Brazil), which was located at 0.15 m above the fixed bed height. The suspension was sprayed on the bed, and the atomization pressure was provided by a 1.1 kW compressor (Schulz, CSA 7.8/25, Joinville, Brazil) and controlled by a pressure regulator maintained at 103 kPa.
2.3. Gaussian Spectral Analysis Methodology
Analyzing the pressure fluctuation signals using the Fourier Transform is known as spectral analysis, where the pressure signal in the time domain is transformed into the frequency domain. This analysis can detect fluidization regime transitions through spectral amplitude and frequency changes.
The development of control strategies based on spectral analysis is complex because the spectral amplitudes and frequency content of the spectra change randomly, and in bubbling fluidized beds, the spectrum sometimes does not display dominant frequencies. Parise et al. [36] demonstrated that adjusting the pressure spectrum to an exponential function, similar to a standard Gaussian distribution given by Equation (1), allows for a more efficient evaluation of fluidization regime transitions in a bubbling fluidized bed.
where A is the constant of the exponential Gaussian function; fk is the signal frequency (Hz); fm is the Gaussian mean frequency (Hz); and σ is the standard deviation of the pressure spectral distribution (PSD).
By applying the natural logarithm to Equation (1), followed by the least squares method, as given by Equation (2), monitoring parameters can be obtained. These parameters are sensitive to changes in fluidization regimes and form the basis of this method. The cost function is minimized, where Ae(f) is the measured amplitude of the pressure spectrum, and G(f) is the Gaussian spectral distribution model.
The steps for implementing the methodology are given below.
Initially, 2048 (211) pressure data points are collected in the plenum chamber at a sampling rate of 400 Hz. The pressure signal collected in the bed is filtered by a digital filter (IRR—infinite impulse response—Butterworth type) and then normalized. A Fast Fourier Transform algorithm (FFT) is then applied to the normalized pressure signal, producing a pressure spectrum. After this procedure, the fitting given by Equation (2) is performed.
Silva [37] developed a fluidization factor (σp/(Fp/Abed)) and identified the fluid–dynamic changes in the moisturizing and coating processes of microcrystalline cellulose in a fluidized bed. This parameter was defined as being the relation between the standard deviation of pressure fluctuation (σp [Pa]) and the weight of the particles (Fp [N]) divided by the cross-section area of the bed (Abed [m2]). The fluidization factor was analyzed during drying tests. For each fitted spectral distribution, a standard deviation and mean frequency were calculated from the nonlinear Gaussian fitting. To enhance the visualization of dynamic behavior during drying, a moving average filter of 3 consecutive points was applied to both parameters. This smoothing procedure improved the clarity in detecting bed defluidization trends over time.
2.4. Drying Experiments
Initially, the wetting process was carried out by atomizing distilled water onto the bed, followed by the drying of the particles. For both materials, the wetting process started with a bubbling fluidization regime and stopped when defluidization began. The parameters obtained by applying the Gaussian spectral analysis were monitored during the wetting and drying of the particles. However, only the monitoring of the drying stage was presented. Microcrystalline cellulose and adipic acid were submitted to wetting and drying tests in different operating conditions since the physic-chemical characteristics of both materials are very different. Table 2 shows the operating conditions used in the wetting and drying processes. The mass of solids was defined based on studies developed by Parise et al. [36]. These authors observed that the relation between the static height (H) and diameter of the bed (D) should be less than 1.75 to more efficiently identify the defluidization phenomenon for particles such as microcrystalline cellulose and sand. For both materials used in the present work, the relation H/D was fixed at 1.0.

Table 2.
Operational conditions of the wetting and drying processes.
When the defluidization conditions shown in Table 2 were obtained, the drying process was started and performed until the processes reached a bubbling regime again. Samples (≈2.0 g) were withdrawn through a collection port located on the column wall, positioned at the center of the fluidized bed, ensuring representative material collection. The moisture content (Xwb) on a wet basis was determined by the weight difference in the samples before and after drying in the oven for 24 h at 105 °C. Each wetting and drying cycle was repeated twice for both materials. However, only one representative data set was included in this study, as the results were reproducible and consistent across repetitions. At each sampling point during drying, a single representative sample was collected for moisture analysis. Due to the intense mixing in the bubbling fluidization regime, one sample was considered sufficient to describe the system’s behavior.
3. Results and Discussion
The application of Gaussian spectral analysis to monitor the drying of solids in a fluidized bed was performed in this work. The Gaussian mean frequency parameters extracted from the pressure spectral distribution were exploited to assess the quality of fluidization regimes, which were divided into the bubbling regime, defluidization region, and fixed bed.
The materials used for the drying study in this paper, microcrystalline cellulose and adipic acid, were selected due to the difficulty of fluidization because of the surface moisture content, which causes adhesion forces between the particles and produces a fluidization regime of poor quality. The wetting process of the materials was conducted in a fluidized bed to obtain defluidization conditions. No air bubbles, channeling, and expansion of the bed height were observed. Visual observations of the bed and the comparison with the drying curve showed the appearance of bubbles by removing surface moisture content for both materials. The drying curves and drying rate clearly show two distinct periods of drying: the constant rate period, where surface moisture content is predominant (linear drying curve and constant drying rate), and the falling rate period, where drying is controlled due to the internal structure of the material (nonlinear drying curve). The transition between the periods occurs when the moisture content was about 9.0 and 1.15% (wet basis) to microcrystalline cellulose and adipic acid, respectively. The values obtained for the critical moisture content are very similar to those reported by Parise [38] and Moris and Rocha [39], who performed drying experiments of microcrystalline cellulose (conventional fluidized bed) and adipic acid (fluidized bed with vibration).
The Gaussian spectral analysis processed the pressure fluctuation signals obtained during the drying tests, and the parameters extracted from the methodology (mean central frequency and standard deviation of the spectral distribution) were compared with drying and drying rate curves. The fluidizing factor is related to the standard deviation of the pressure fluctuation signal. It was also evaluated during the drying tests. The dominant frequency of the spectral distribution was only assessed for adipic acid because the pressure spectrum for the microcrystalline cellulose does not always exhibit a detectable dominant frequency. Parise [38] showed no significant changes occurring in the dominant frequency during the drying of microcrystalline cellulose. The parameter was not able to evaluate the fluid dynamic transitions.
Figure 2, Figure 3 and Figure 4 show the evolution of the parameters from the pressure fluctuation signal and the moisture content during drying of microcrystalline cellulose. The development of the mean central frequency (MCF) clearly shows a rising trend at about 56 min (moisture content in 11%), as can be seen in Figure 2. The frequency between 5.7 and 6.0 Hz indicates a partial defluidization condition, with the formation of stagnant zones and no air bubbles. The 6.0 to 7.0 Hz frequency region is characterized as a stable bubbling fluidization. These results are consistent with those reported by Parise et al. [36] and Silva et al. [23], where the quality of the fluidization regime depends on the frequency content of the pressure spectral distribution. The increasing trend in the mean central frequency reflects a greater bubbling intensity. The standard deviation of the spectral distribution, shown in Figure 3, also identified the fluid dynamic changes in the drying process. It can be seen in Figure 3 that the parameter exhibits a range that goes from 3.5 to 3.7 Hz to a bubbling fluidization regime. In the defluidization region, this parameter is out of this range, and values above 3.7 Hz indicate the loss of hydrodynamic stability.
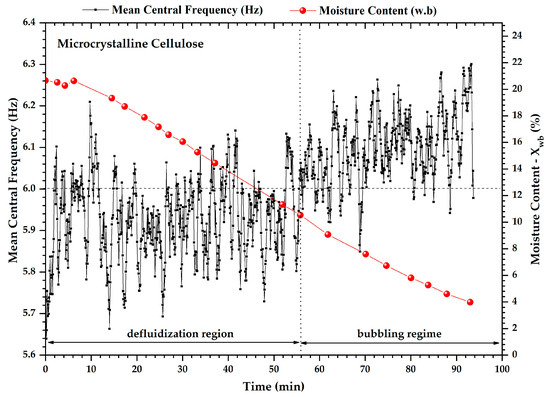
Figure 2.
Evolution of the mean central frequency and moisture content during the drying process of MCC500. The vertical dashed line represents the demarcations of the experimentally observed regime transitions.
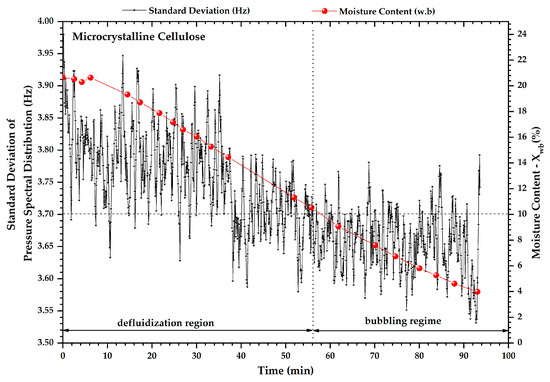
Figure 3.
Evolution of the standard deviation of pressure spectral distribution and moisture content during the drying process of MCC500. The vertical dashed line represents the demarcations of the experimentally observed regime transitions.
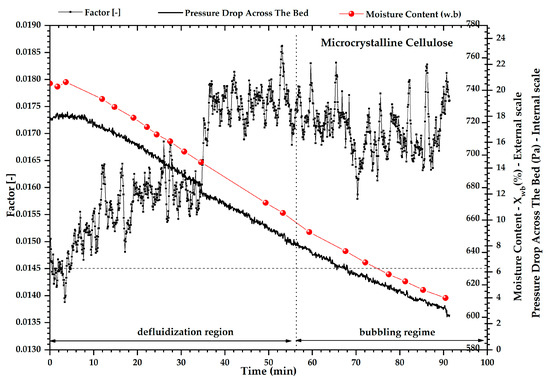
Figure 4.
Evolution of the fluidization factor, pressure drop across the bed and moisture content during the drying process of MCC500. The vertical dashed line represents the demarcations of the experimentally observed regime transitions.
Figure 4 displays the development of the fluidization factor (σp/(Fp/Abed)). For values below 0.0164, this parameter characterizes the unstable fluidization region. Concerning the spectral distribution’s mean central frequency and standard deviation, the fluidization factor starts an early trend change around 40 min of drying (moisture content 14%), with values above 0.0164. Visual observations showed the start of movement of the bed and the first appearance of air bubbles. These results are consistent because the increase in the standard deviation of the pressure fluctuation signal is related to the appearance of bubbles when the bed is drier, as reported by Wormsbecker et al. [31,32]. The comparison of the results obtained from the pressure fluctuation signals and the drying curve showed the ability to identify the transitions of fluidization regimes during drying, which was confirmed by visual observation. It is interesting to note that the monitoring parameters remained at well-defined levels with the progress of drying, showing differences in the fluidization quality.
To assess the fluidization regime transition during drying more efficiently, we plotted the drying rate curve (dXwb/dt) to describe the relationship between the profiles developed by the pressure fluctuation analysis and the removal rate of moisture content from the solid. These comparisons for microcrystalline cellulose are shown in Figure 5 and Figure 6. It was observed that a long period existed in which the drying rate was constant. The considerable surface moisture caused partial defluidization during the first 56 min of drying.
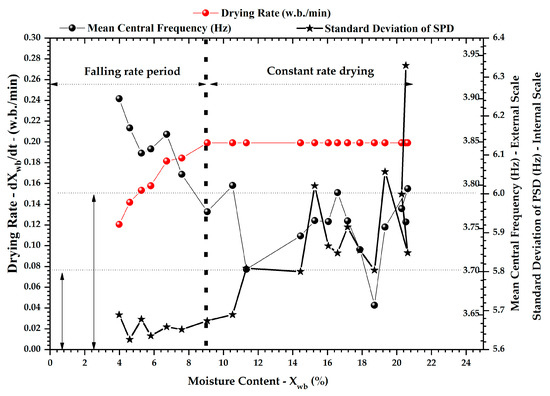
Figure 5.
Development of the drying rate curve, the mean central frequency and the standard deviation of PSD for MCC500.
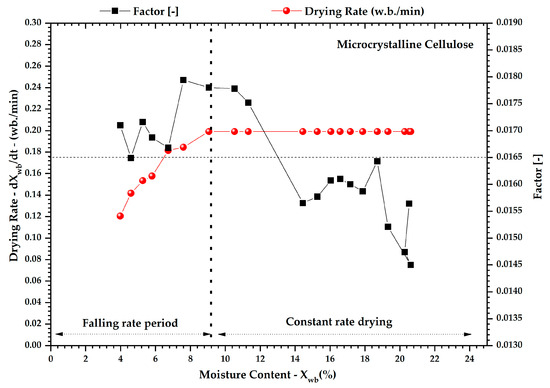
Figure 6.
Development of the drying rate curve and the fluidization factor for the MCC500.
The surface moisture promotes the adhesion of the particles through the bridging liquid, preventing vigorous fluidization of the material. The period of constant drying rate will continue until the moisture content of 9.0% (wet basis) is reached, which is the critical point of drying, where the rate begins to decrease.
Looking at the mean central frequency and drying rate curve, one can see the predominance of the frequency data below 6.0 Hz, featuring a bed in defluidization conditions and leading to the information that the drying period is rate constant. The transition period, from the rate constant to the falling rate period, is seen by the increase in frequency above 6.0 Hz, where it is known that a bubbling fluidization regime to the microcrystalline cellulose is obtained only at frequencies above 6.0 Hz, as Figure 5 (line plus square). The standard deviation of the spectral distribution (Figure 5—line plus star) clearly shows the fluid–dynamic regime transitions in the region of the critical point. The value for this parameter is 3.7 Hz, which separates the two drying periods. The fluidization factor identifies the fluidization regime transition as an early warning due to the onset of movement of the bed close to the region of the critical point drying, as is seen in Figure 6.
The Gaussian spectral analysis was also applied to identify the fluid–dynamic changes that occur during the drying of adipic acid to show that the analysis applies to other materials with different physicochemical characteristics but presents fluidization problems due to surface moisture content and, when dry, displays a bubbling fluidization behavior. The drying behavior of adipic acid in conventional fluidized beds shows a short period of constant drying rate and a longer falling rate period, where the moisture content is below 0.75% (wet basis). Moris and Rocha [39] observed similar behavior for drying adipic acid in a vibrofluidized bed.
Figure 7, Figure 8 and Figure 9 show the evolution of the moisture content and monitoring parameters of pressure fluctuation signals. When adipic acid was dried, the dominant frequency (DF) of the spectral distribution was measured because this parameter could be detected more clearly than when microcrystalline cellulose was dried, where the dominant frequency was not easily observed. Figure 7 shows that the dominant frequency and mean central frequency followed the same upward trend during the drying process, reflecting the increase in the bubbling intensity until both stabilized at different levels (MCF > 5.75 Hz; DF > 3.0 Hz). The standard deviation of the spectral distribution also followed the fluid–dynamic changes in the drying. Moris and Rocha [39] applied spectral analysis to monitor the drying of adipic acid in a vibrofluidized bed. Interestingly, the bubbling regime, the dominant frequency band obtained with the vibration of the bed (DF = 3.0 to 4.3 Hz), was similar to the conventional fluidized bed (DF = 3.0 to 5.0 Hz), indicating similar conditions in the fluidization regime.
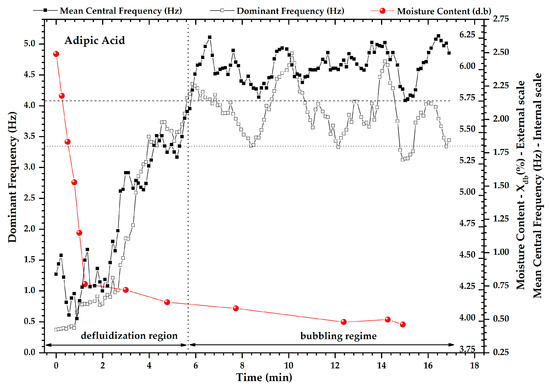
Figure 7.
Evolution of the mean central frequency, dominant frequency and moisture content during the drying process of adipic acid. The vertical dashed line represents the demarcations of the experimentally observed regime transitions.
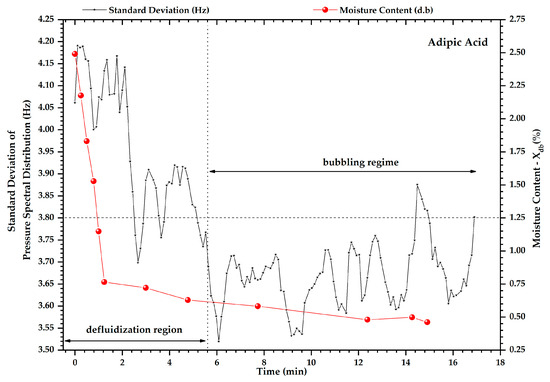
Figure 8.
Evolution of the standard deviation of PSD and moisture content during the drying process of adipic acid. The vertical dashed line represents the demarcations of the experimentally observed regime transitions.
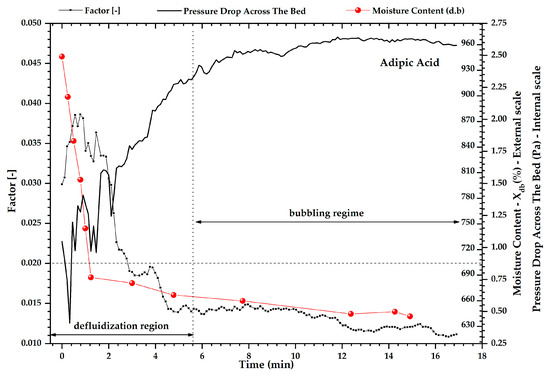
Figure 9.
Evolution of the fluidization factor, pressure drop across the bed and moisture content during the drying process of adipic acid. The vertical dashed line represents the demarcations of the experimentally observed regime transitions.
For the standard deviation of the spectral distribution, it was noted that values below 3.8 Hz inform a bubbling fluidization dynamic, which occurs when adipic acid loses its surficial moisture content, as shown in Figure 8. The fluidization factor exhibited a different behavior in drying adipic acid as shown in Figure 9. The reduction in this parameter with the progress of the drying can be explained by the increase in the bed height when the moisture content is high. Since the wetting and drying processes were conducted on the same equipment, one could observe the bed expansion during wetting and height reduction during drying. Karimi et al. [27] also reported a similar phenomenon while drying rice particles, monitoring the standard deviation of the pressure fluctuation signal. The onset of channeling can be confirmed by low-pressure drop values across the bed at the initial drying stage, as shown in Figure 9. In drying the microcrystalline cellulose, the wetting did not reduce the pressure drop, i.e., the channeling was not observed (Figure 4). The standard deviation of the pressure fluctuation signals increased during the drying, showing the appearance of the bubbles, as it was followed by Wormsbecker et al. [31,32].
The comparison between the monitoring parameters and drying rate curve (dXwb/dt) for the adipic acid was carried out and it is shown in Figure 10 and Figure 11.
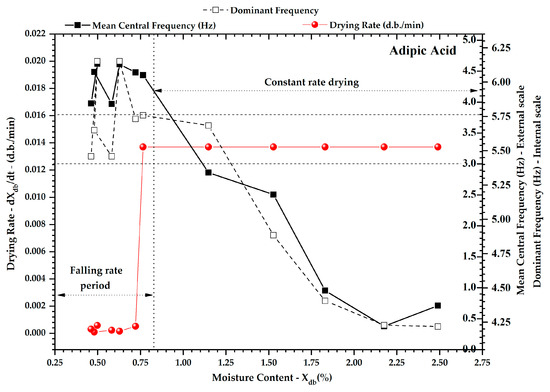
Figure 10.
Development of the drying rate curve, mean central frequency, and dominant frequency for the adipic acid.
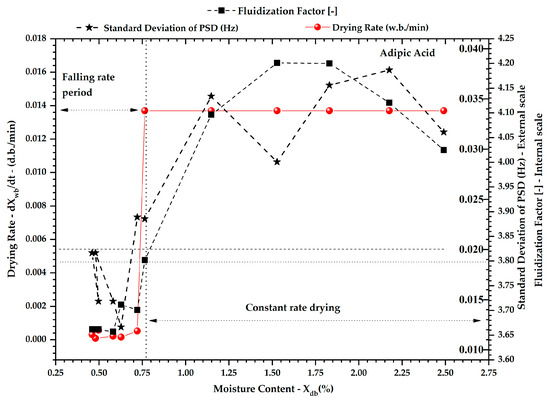
Figure 11.
Development of the drying rate curve, fluidization factor, and the standard deviation of pressure spectral distribution for the adipic acid.
The parameters change significantly depending on the drying period. These results show that fluid–dynamic transitions are closely related to critical moisture content. Dominant frequency and mean central frequency remained above 3.0 Hz and 5.75 Hz, respectively, identifying the bubbling fluidization regime when the region of the critical point drying was monitored, as seen in Figure 10. The standard deviation of the PSD (Figure 11—line plus square) and the fluidizing factor (Figure 11—line plus star) also accompanied the fluidization regime changes near the critical point drying.
4. Conclusions
Applying the Gaussian spectral distribution technique in monitoring the drying process of microcrystalline cellulose and adipic acid effectively quantified fluid–dynamic regime transitions, particularly near the critical moisture content. The analysis of pressure fluctuation signals revealed that the spectral distribution’s mean central frequency, dominant spectral frequency, and standard deviation are susceptible to moisture loss. Two distinct fluid–dynamic states were identified: a moist regime, characterized by instabilities due to liquid bridge formation, and a stable regime after reaching the critical moisture threshold when compared with the drying rate curves of the materials. These findings confirm the potential of this technique as a robust, non-intrusive method for real-time process monitoring.
Furthermore, this study paves the way for implementing advanced on-line control strategies in drying operations. By integrating the Gaussian spectral analysis with automatic control systems, it is possible to dynamically adjust superficial air velocity or drying air temperature, optimizing the process for increased efficiency. Similarly to other non-intrusive monitoring techniques based on pressure signals and electrical capacitance tomography [9,40], the proposed method provides accurate detection of drying regime transitions. Such control could accelerate drying rates while preventing particle breakage in the final stages, ensuring improved product quality and process stability. This represents a significant advancement in fluidized bed drying technology, offering a valuable tool for the pharmaceutical, chemical, and food industries.
Author Contributions
Conceptualization, O.P.T. and C.A.M.d.S. (Carlos Alexandre Moreira da Silva); formal analysis, J.J.B., O.P.T., and C.A.M.d.S. (Carlos Alexandre Moreira da Silva); investigation, J.J.B. and C.A.M.d.S. (Carlos Alexandre Moreira da Silva); methodology, J.J.B., O.P.T., and C.A.M.d.S. (Carlos Alexandre Moreira da Silva); resources, C.A.M.d.S. (Carlos Alexandre Moreira da Silva) and C.A.M.d.S. (Carlos Adriano Moreira da Silva); writing—original draft, M.B.B., K.A., O.P.T., and C.A.M.d.S. (Carlos Alexandre Moreira da Silva); writing—review and editing, M.B.B., C.A.M.d.S. (Carlos Alexandre Moreira da Silva), K.A., and C.A.M.d.S. (Carlos Adriano Moreira da Silva). All authors have read and agreed to the published version of the manuscript.
Funding
This research received no external funding.
Data Availability Statement
The data supporting reported results can be accessed via email for the corresponding author (alexandre.carlos@unifesp.br).
Conflicts of Interest
José Junior Butzge was employed by the company CP Kelco. The remaining authors declare that the research was conducted in the absence of any commercial or financial relationships that could be construed as a potential conflict of interest.
References
- Aghbashlo, M.; Sotudeh-Gharebagh, R.; Zarghami, R.; Mujumdar, A.S.; Mostoufi, N. Measurement Techniques to Monitor and Control Fluidization Quality in Fluidized Bed Dryers: A Review. Dry. Technol. 2014, 32, 1005–1051. [Google Scholar] [CrossRef]
- da Silva, C.A.M.d.; Butzge, J.J.; Nitz, M.; Taranto, O.P. Monitoring and Control of Coating and Granulation Processes in Fluidized Beds—A Review. Adv. Powder Technol. 2014, 25, 195–210. [Google Scholar] [CrossRef]
- Ghijs, M.; Peeters, M.; Van Hauwermeiren, D.; Vigh, T.; Stauffer, F.; Nopens, I.; De Beer, T. Analysis of the Influence of Process and Formulation Properties on the Drying Behavior of Pharmaceutical Granules in a Semi-Continuous Fluid Bed Drying System. Powders 2023, 2, 232–258. [Google Scholar] [CrossRef]
- Ma, Z.G.; Xu, Y.; Tu, Q.; Wang, H.; Ocone, R. Experimental Investigation of Wet Particle Flow Characteristics in a Pseudo Two-Dimensional Fluidized Bed. Powder Technol. 2024, 438, 119599. [Google Scholar] [CrossRef]
- Zhong, L.; Gao, L.; Li, L.; Nie, L.; Zhang, H.; Sun, Z.; Huang, R.; Zhou, Z.; Yin, W.; Wang, H.; et al. Implementation of Dynamic and Static Moisture Control in Fluidized Bed Granulation. AAPS PharmSciTech 2022, 23, 174. [Google Scholar] [CrossRef]
- Aoki, H.; Hattori, Y.; Sasaki, T.; Otsuka, M. Comparative Study on the Real-Time Monitoring of a Fluid Bed Drying Process of Extruded Granules Using Near-Infrared Spectroscopy and Audible Acoustic Emission. Int. J. Pharm. 2022, 619, 121689. [Google Scholar] [CrossRef]
- Peng, C.; Zhong, L.; Gao, L.; Li, L.; Nie, L.; Wu, A.; Huang, R.; Tian, W.; Yin, W.; Wang, H.; et al. Implementation of Near-Infrared Spectroscopy and Convolutional Neural Networks for Predicting Particle Size Distribution in Fluidized Bed Granulation. Int. J. Pharm. 2024, 655, 124001. [Google Scholar] [CrossRef]
- Chaplin, G.; Pugsley, T. Application of Electrical Capacitance Tomography to the Fluidized Bed Drying of Pharmaceutical Granule. Chem. Eng. Sci. 2005, 60, 7022–7033. [Google Scholar] [CrossRef]
- Zhang, J.L.; Mao, M.X.; Ye, J.M.; Wang, H.G.; Yang, W.Q. Investigation of Wetting and Drying Process in a Gas-Solid Fluidized Bed by Electrical Capacitance Tomography and Pressure Measurement. Powder Technol. 2016, 301, 1148–1158. [Google Scholar] [CrossRef]
- Lin, Y.; Yang, W.; Wu, Z.; Wang, H. Monitoring of High-Moisture Content Particle Drying in a Fluidized Bed by Microwave and Capacitance Tomographic Sensors. Dry. Technol. 2020, 40, 1153–1167. [Google Scholar] [CrossRef]
- Wang, H.; Yang, W. Application of Electrical Capacitance Tomography in Circulating Fluidised Beds—A Review. Appl. Therm. Eng. 2020, 176, 115311. [Google Scholar] [CrossRef]
- Liu, Z.; Wang, H.; Sun, S.; Xu, L.; Yang, W. Investigation of Wetting and Drying Process in a Spout-Fluid Bed Using Acoustic Sensor and Electrical Capacitance Tomography. Chem. Eng. Sci. 2023, 281, 119160. [Google Scholar] [CrossRef]
- Carter, A.; Briens, L. Inline Acoustic Monitoring to Determine Fluidized Bed Performance during Pharmaceutical Coating. Int. J. Pharm. 2018, 549, 293–298. [Google Scholar] [CrossRef]
- Jani, F.; Houshmand Moayed, S.; Adhamdoust, S.R.; Sepahi, A.; Afzali, S.K. Monitoring the Fluidized Bed Reactor for Polyethylene Polymerization Based on Fiber Optic Acoustic Emission Sensor. Can. J. Chem. Eng. 2022, 101, 3409–3419. [Google Scholar] [CrossRef]
- Hossein, F.; Materazzi, M.; Lettieri, P.; Angeli, P. Application of Acoustic Techniques to Fluid-Particle Systems—A Review. Chem. Eng. Res. Des. 2021, 176, 180–193. [Google Scholar] [CrossRef]
- Metzner, W.V.; Dacanal, G.C. Monitoring Agitation Intensity in Fluidized Beds Containing Inert Particles via Acoustic Emissions and Neural Networks. Processes 2024, 12, 2691. [Google Scholar] [CrossRef]
- Sun, J.; Yan, Y. Non-Intrusive Measurement and Hydrodynamics Characterization of Gas–Solid Fluidized Beds: A Review. Meas. Sci. Technol. 2016, 27, 112001. [Google Scholar] [CrossRef]
- Johnsson, F.; Zijerveld, R.C.; Schouten, J.C.; Van Den Bleek, C.M.; Leckner, B. Characterization of Fluidization Regimes by Time-Series Analysis of Pressure Fluctuations. Int. J. Multiph. Flow 2000, 26, 663–715. [Google Scholar] [CrossRef]
- Van Ommen, J.R.; Sasic, S.; Van Der Schaaf, J.; Gheorghiu, S.; Johnsson, F.; Coppens, M.-O. Time-Series Analysis of Pressure Fluctuations in Gas–Solid Fluidized Beds—A Review. Int. J. Multiph. Flow 2011, 37, 403–428. [Google Scholar] [CrossRef]
- Bae, K.; Lim, J.H.; Kim, J.-H.; Lee, D.-H.; Han, J.-H.; Park, S.-H.; Lee, D.H. Bubble Characteristics by Pressure Fluctuation Analysis in Gas-Solid Bubbling Fluidized Beds with or without Internal. Korean J. Chem. Eng. 2017, 34, 566–573. [Google Scholar] [CrossRef]
- Ma, Z.; Ma, H.; Qian, W.; Zhang, H.; Sun, Q.; Ying, W. Bubble Behaviors in a Dense Gas-Solids Fluidized Bed: Analysis of Pressure Fluctuation. Chem. Eng. Technol. 2022, 45, 1675–1682. [Google Scholar] [CrossRef]
- Yan, C.; Yuan, Y.; Wei, X.; Zhu, J. Micro-Flow Structure at Regime Transition from Bubbling to Turbulent Fluidization in a Fluidized Bed. Particuology 2024, 89, 117–130. [Google Scholar] [CrossRef]
- Silva, C.A.M.; Parise, M.R.; Silva, F.V.; Taranto, O.P. Control of Fluidized Bed Coating Particles Using Gaussian Spectral Pressure Distribution. Powder Technol. 2011, 212, 445–458. [Google Scholar] [CrossRef]
- Parise, M.R.; Silva, C.A.M.; Ramazini, M.J.; Taranto, O.P. Identification of Defluidization in Fluidized Bed Coating Using the Gaussian Spectral Pressure Distribution. Powder Technol. 2011, 206, 149–153. [Google Scholar] [CrossRef]
- de Martín, L.; van den Dries, K.; van Ommen, J.R. Comparison of Three Different Methodologies of Pressure Signal Processing to Monitor Fluidized-Bed Dryers/Granulators. Chem. Eng. J. 2011, 1, 487–499. [Google Scholar] [CrossRef]
- Chaplin, G.; Pugsley, T.; Winters, C. Monitoring the Fluidized Bed Granulation Process Based on S-Statistic Analysis of a Pressure Time Series. AAPS PharmSciTech 2005, 6, 29. [Google Scholar] [CrossRef] [PubMed]
- Karimi, F.; Sotudeh-Gharebagh, R.; Zarghami, R.; Mostoufi, N. Monitoring the Moisture Content of Solids in Fluidized Bed Dryers by Analysis of Pressure Fluctuations. Drying Technol. 2011, 29, 1697–1704. [Google Scholar] [CrossRef]
- Chaplin, G.; Pugsley, T.; Winters, C. Application of Chaos Analysis to Pressure Fluctuation Data from a Fluidized Bed Dryer Containing Pharmaceutical Granule. Powder Technol. 2004, 142, 110–120. [Google Scholar] [CrossRef]
- Pugsley, T.; Chaplin, G.; Khanna, P. Application of Advanced Measurement Techniques to Conical Lab-Scale Fluidized Bed Dryers Containing Pharmaceutical Granule. Trans. IChemE Part C Food Bioprod. Process. 2007, 85, 273–283. [Google Scholar] [CrossRef]
- Moris, V.A.S.; Rocha, S.C.S. Spectral Analysis of Pressure Drop Fluctuation in Vibrofluidized Bed Drying. In Proceedings of the 8th World Congress of Chemical Engineering—4th International Drying Conference, Montreal, QC, Canada, 22–25 August 2009; Volume B, pp. 932–940. [Google Scholar]
- Wormsbecker, M.; Van Ommen, J.R.; Nijenhuis, J.; Tanfara, H.; Pugsley, T. The Influence of Vessel Geometry on Fluidized Bed Dryer Hydrodynamics. Powder Technol. 2009, 194, 115–125. [Google Scholar] [CrossRef]
- Wormsbecker, M.; Pugsley, T.; Tanfara, H. Interpretation of the Hydrodynamic Behavior in a Conical Fluidized Bed Dryer. Chem. Eng. Sci. 2009, 64, 1739–1746. [Google Scholar] [CrossRef]
- Vervloet, D.; Nijenhuis, J.; Van Ommen, J.R. Monitoring a Lab-Scale Fluidized Bed Dryer: A Comparison between Pressure Transducers, Passive Acoustic Emissions, and Vibration Measurements. Powder Technol. 2010, 197, 36–48. [Google Scholar] [CrossRef]
- Soares, G.S.; Tuchtenhagen, S.N.; De Almeida Pinto, L.A.; Felipe, C.A.S. Monitoring of the Fluidized Bed Particle Drying Process by Temperature and Pressure Drop Measurements. Drying Technol. 2022, 40, 1935–1947. [Google Scholar] [CrossRef]
- Geldart, D. Gas Fluidization Technology; John Wiley & Sons: New York, NY, USA, 1986. [Google Scholar]
- Parise, M.R.; Kurka, P.R.G.; Taranto, O.P. The Gaussian Spectral Pressure Distribution Applied to a Fluidized Bed. Chem. Eng. Process. 2009, 48, 120–125. [Google Scholar] [CrossRef]
- Silva, C.A.M. Application of the Gaussian Spectral Analysis Methodology to Monitor and Control the Defluidization in the Particles Coating Process. Master’s Dissertation, School of Chemical Engineering, University of Campinas, Campinas, Brazil, 2009. [Google Scholar]
- Parise, M.R. Application of the Normal Spectral Distribution in a Gas-Solid Fluidized Bed. Ph.D. Thesis, School of Chemical Engineering, University of Campinas, Campinas, Brazil, 2007. [Google Scholar]
- Moris, V.A.S.; Rocha, S.C.S. Vibrofluidized Bed Drying of Adipic Acid. Drying Technol. 2006, 24, 303–313. [Google Scholar] [CrossRef]
- Gómez-Hernández, J.; Soria-Verdugo, A.; Briongos, J.V.; Santana, D. Multiresolution Analysis of a Drying Process in a Rotating-Distributor Fluidized Bed. Drying Technol. 2016, 34, 119–131. [Google Scholar] [CrossRef]
Disclaimer/Publisher’s Note: The statements, opinions and data contained in all publications are solely those of the individual author(s) and contributor(s) and not of MDPI and/or the editor(s). MDPI and/or the editor(s) disclaim responsibility for any injury to people or property resulting from any ideas, methods, instructions or products referred to in the content. |
© 2025 by the authors. Licensee MDPI, Basel, Switzerland. This article is an open access article distributed under the terms and conditions of the Creative Commons Attribution (CC BY) license (https://creativecommons.org/licenses/by/4.0/).