
Classification of Metallic Powder Morphology Using Traditional and Automated Static Image Analysis: A Comparative Study

 , ,
, ,
Abstract
1. Introduction
2. Materials and Methods
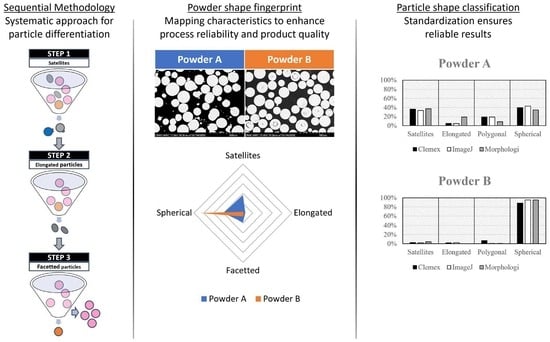
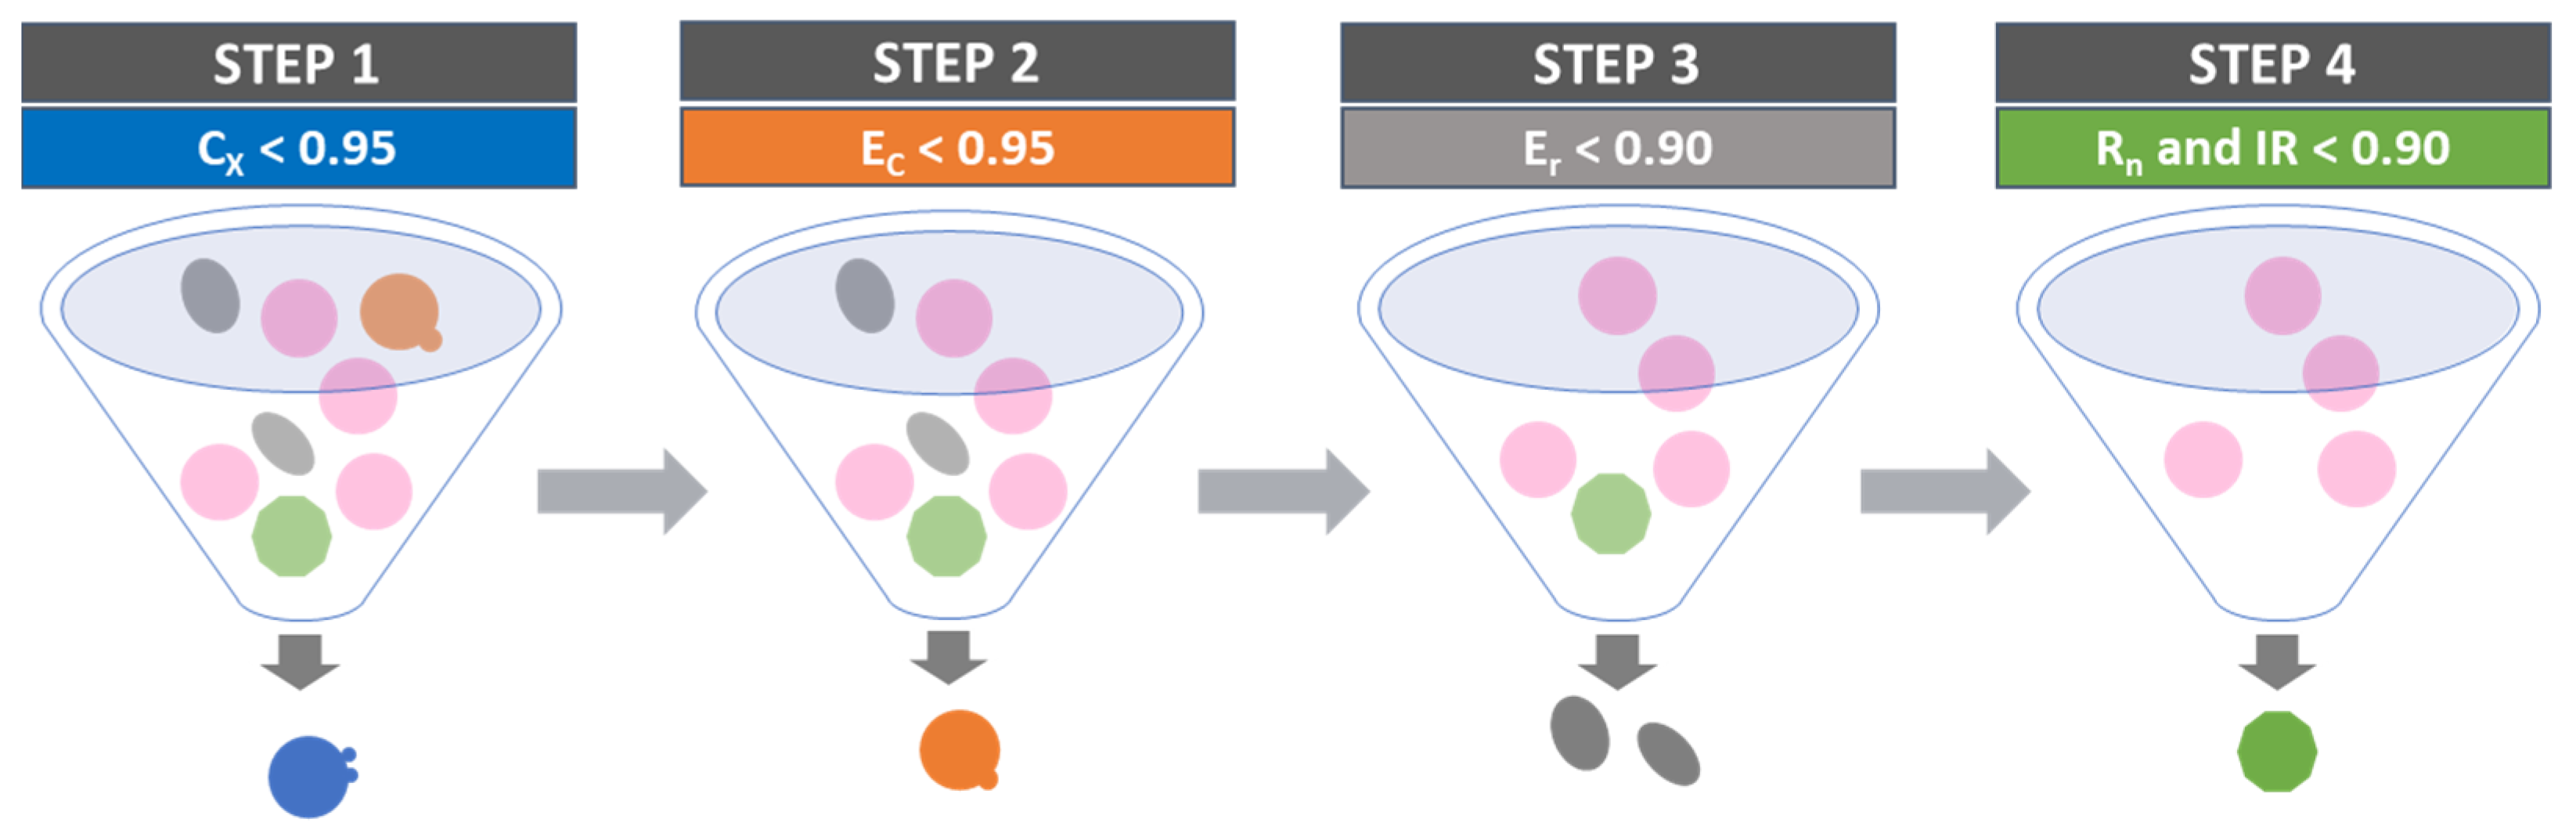
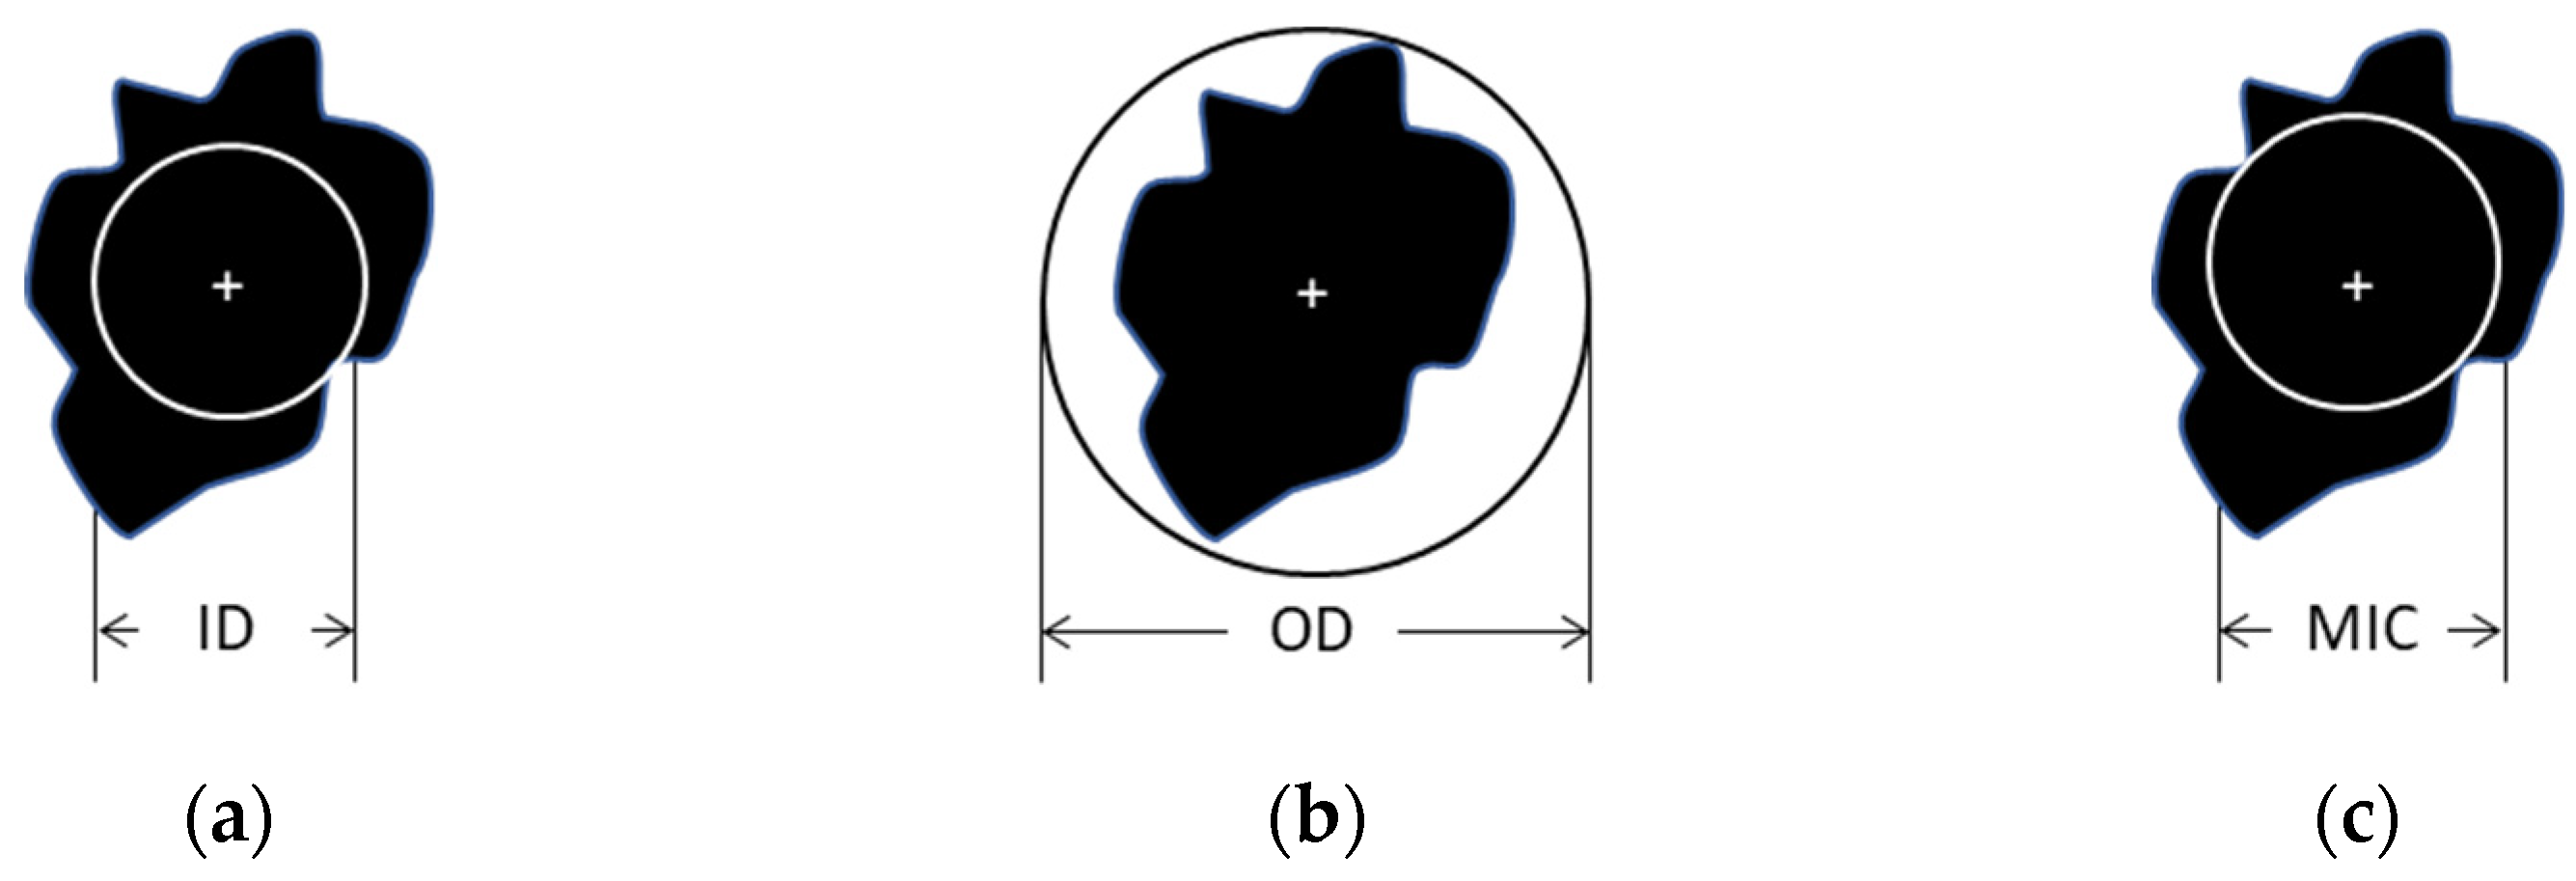
2.1. Shape Descriptors and Sequential Methodology
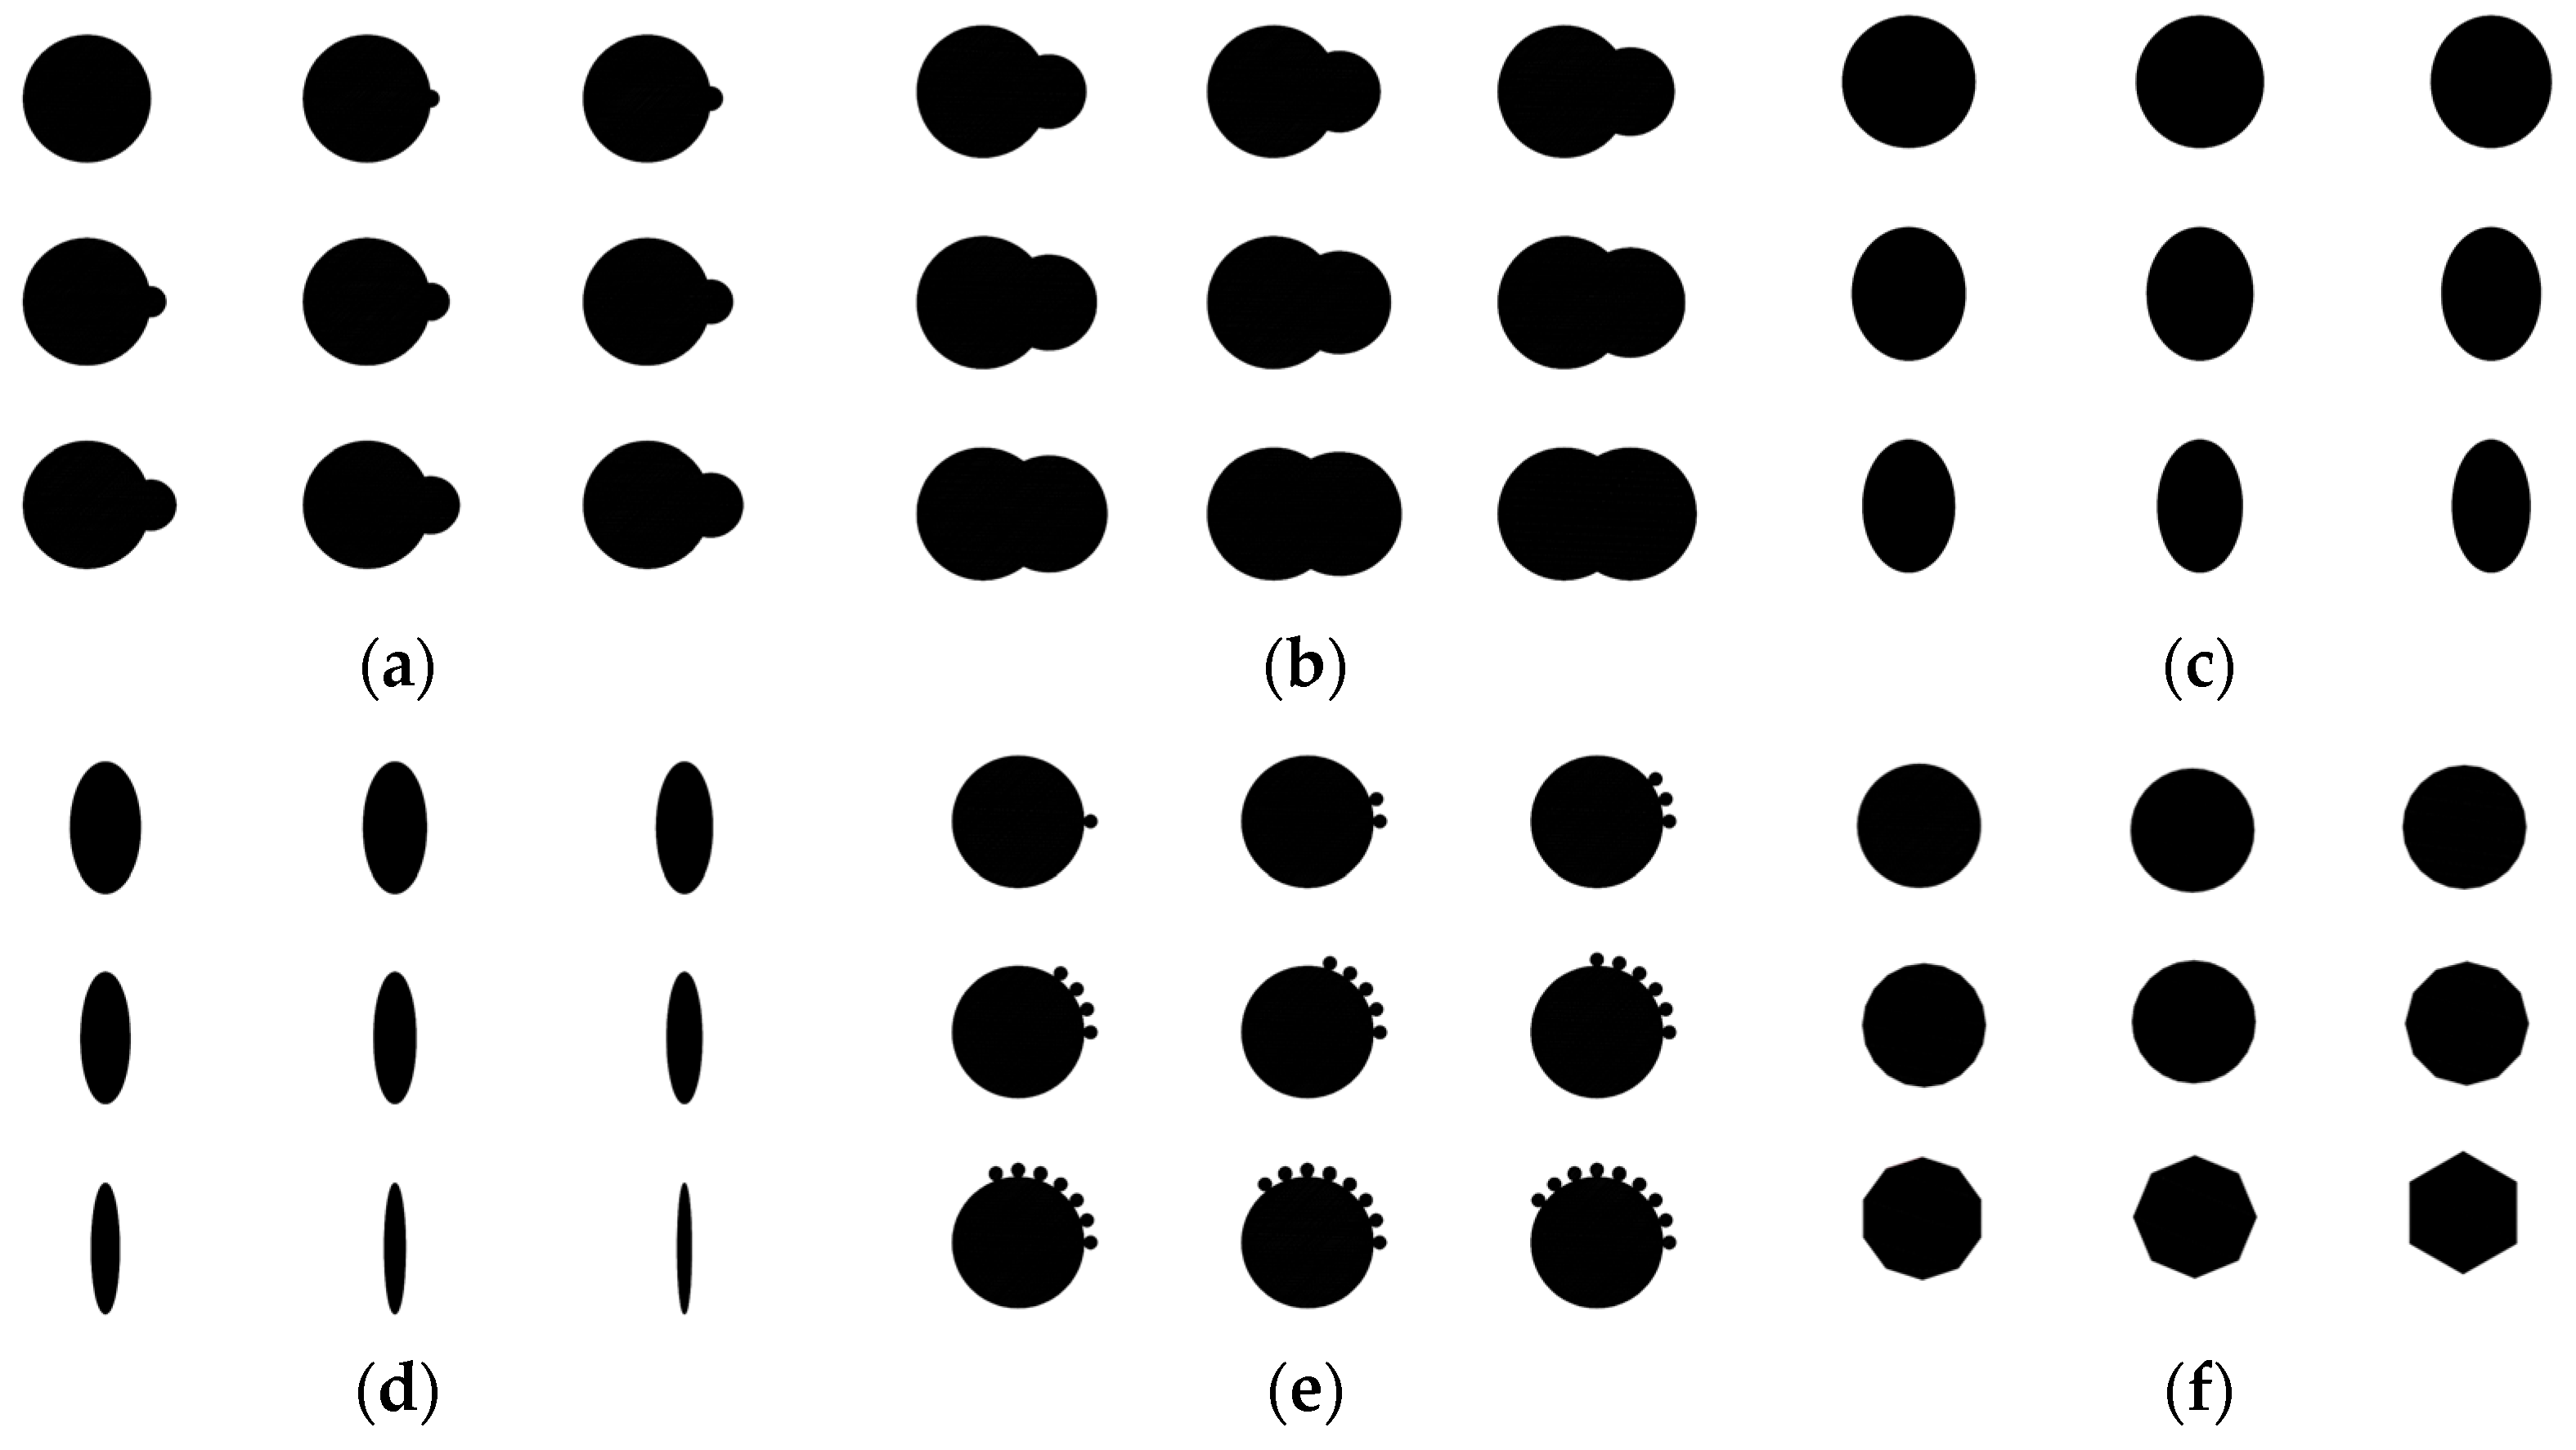
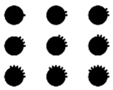
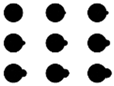
2.2. Schematized Particles
2.3. Measurements
3. Results
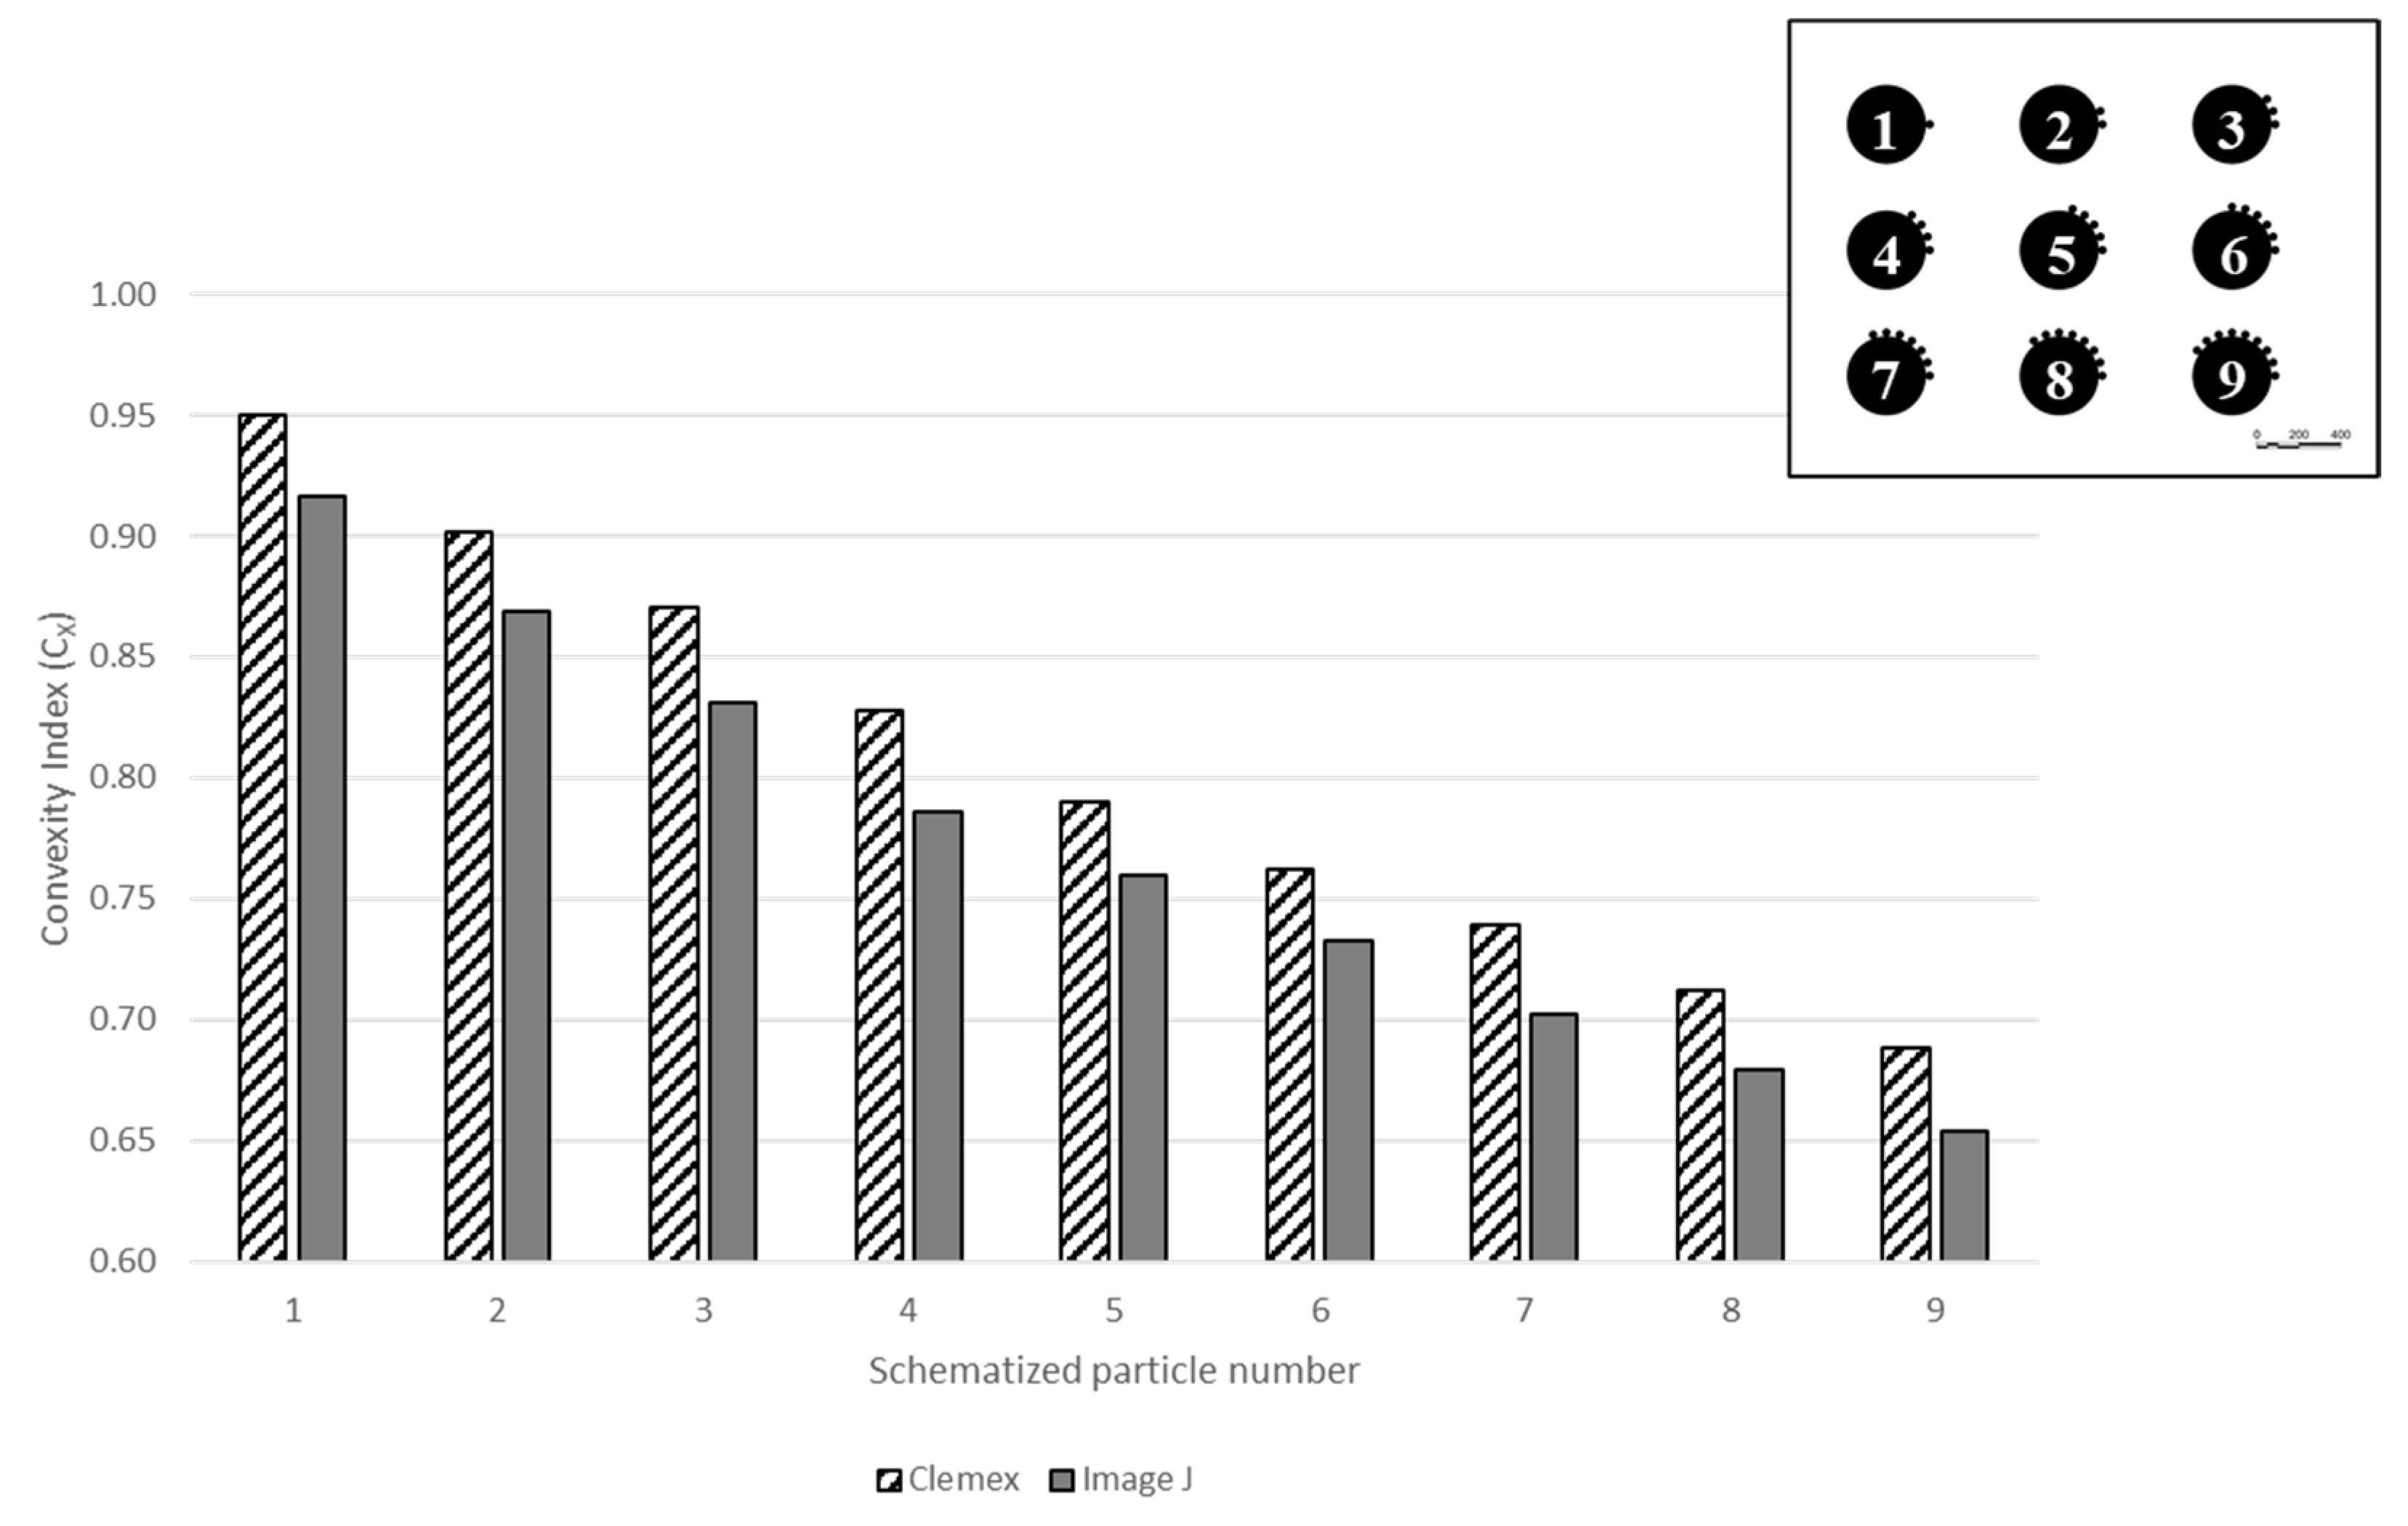
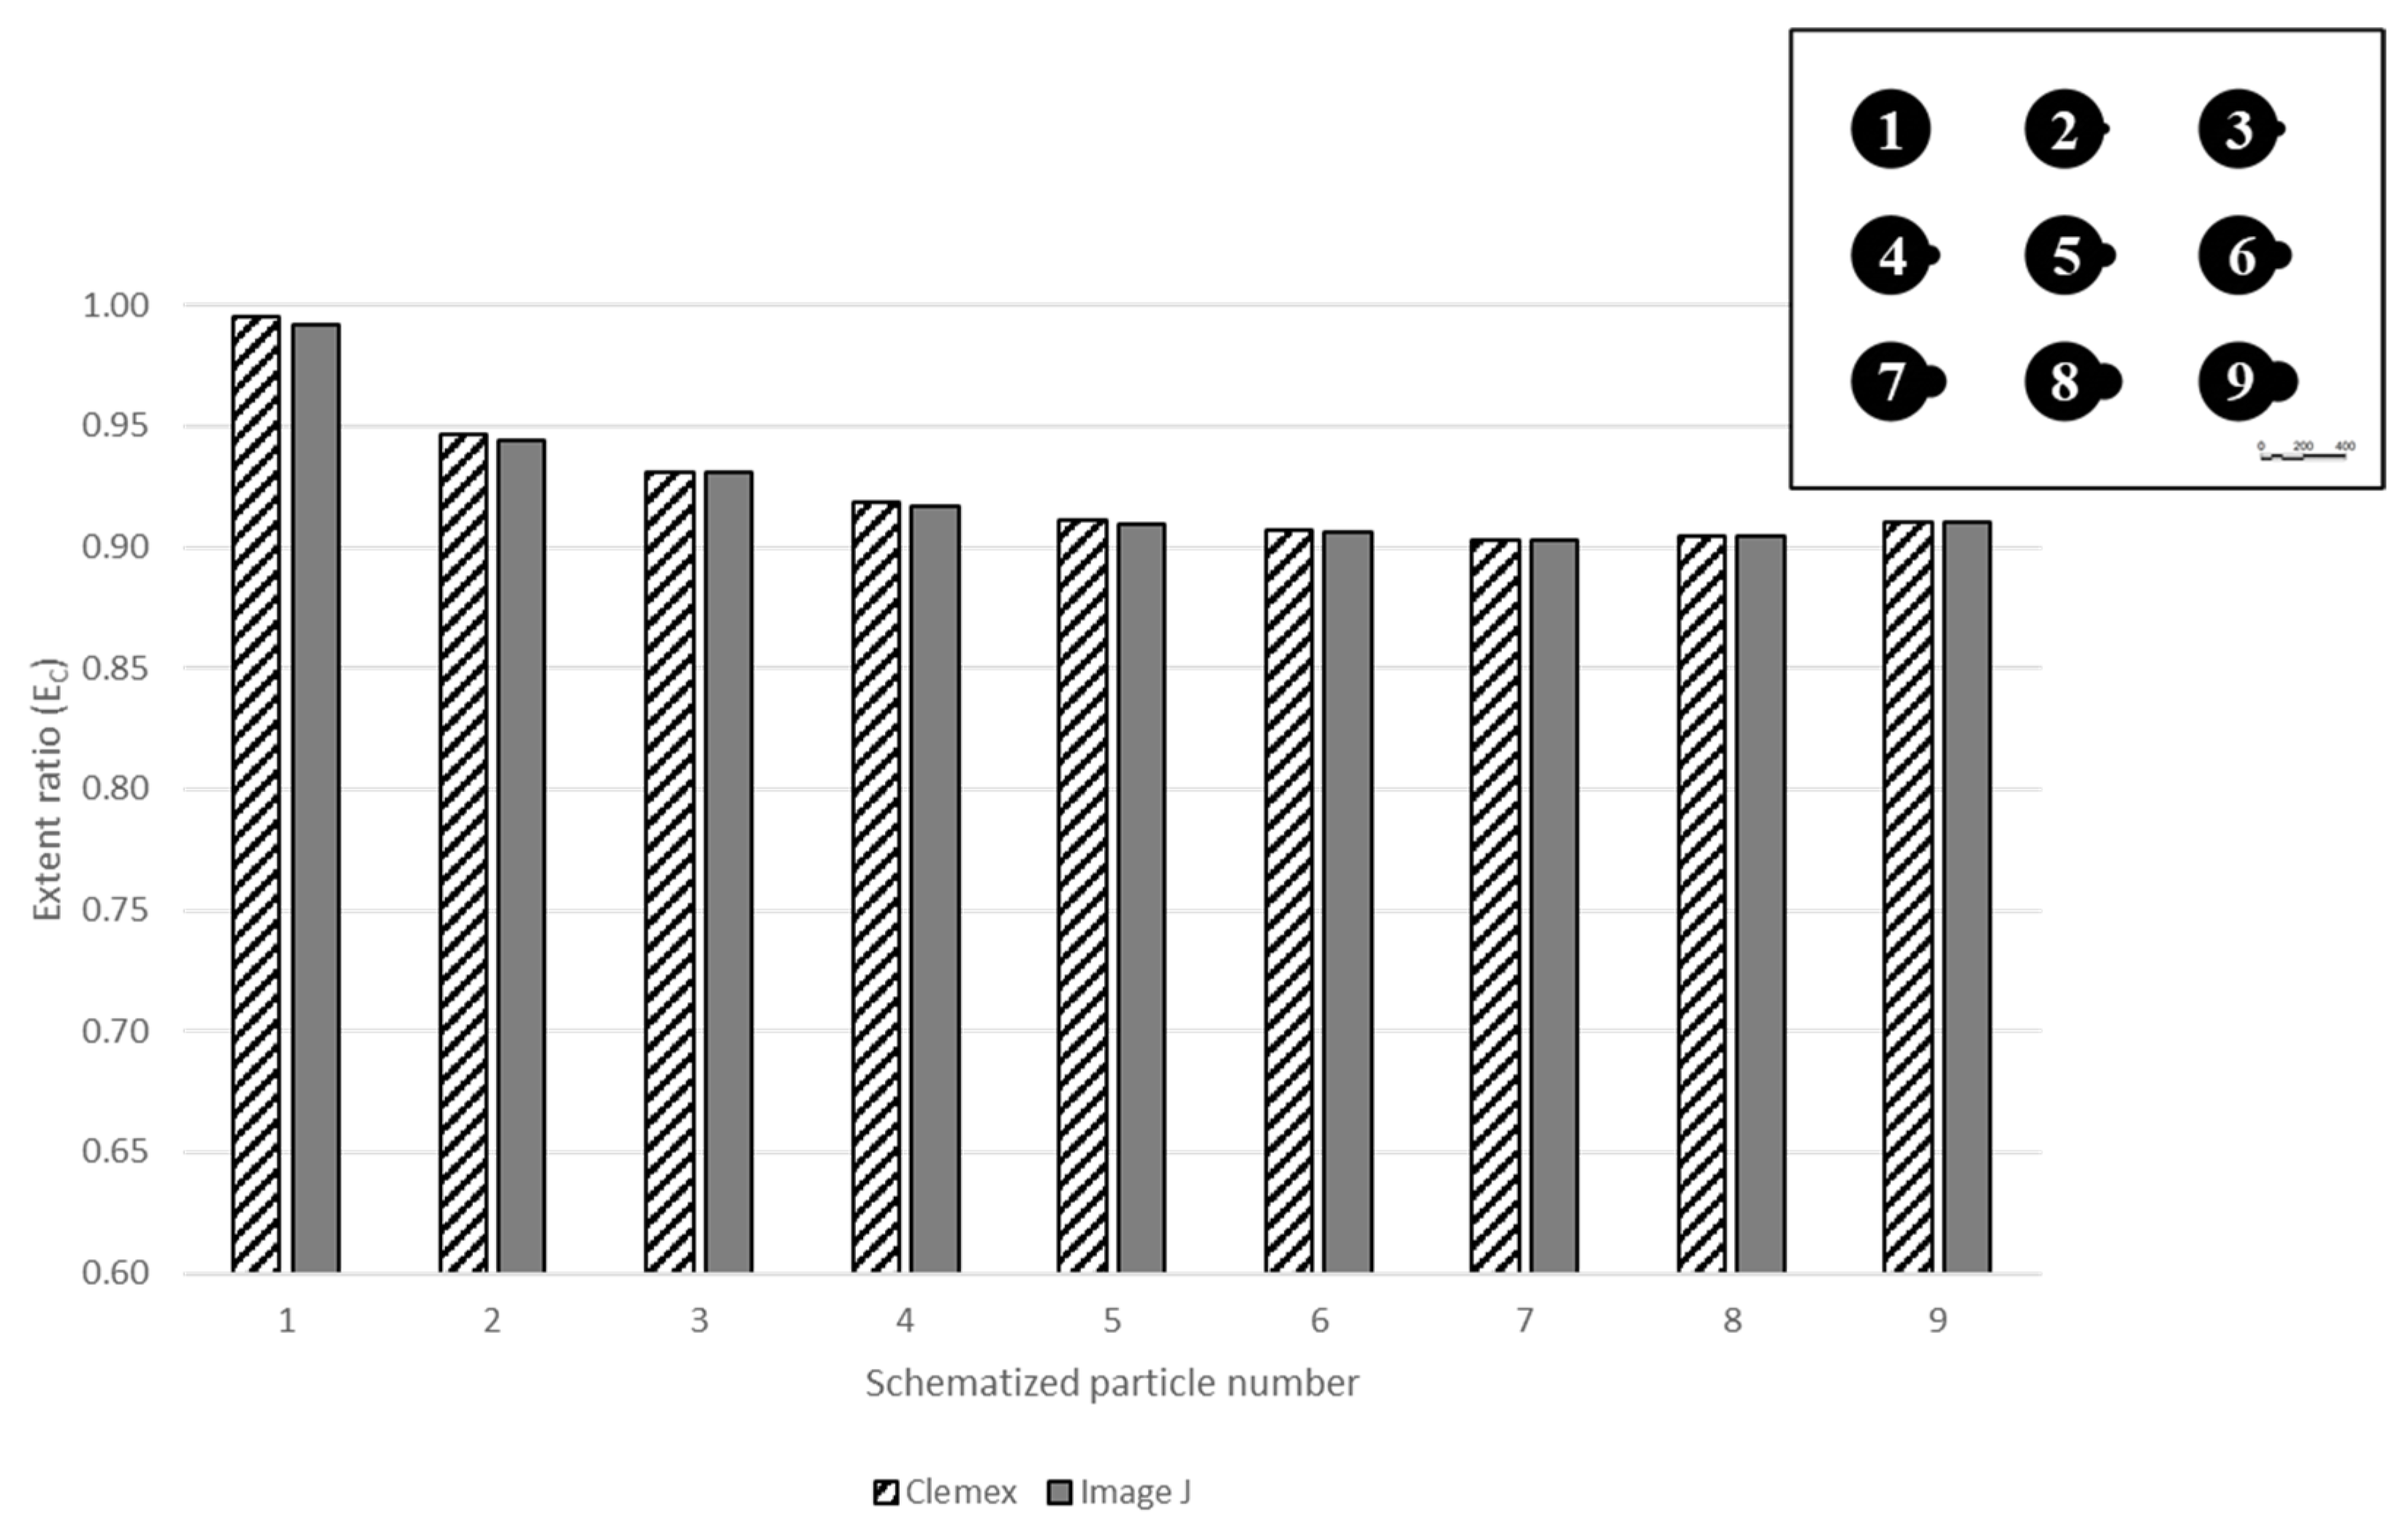
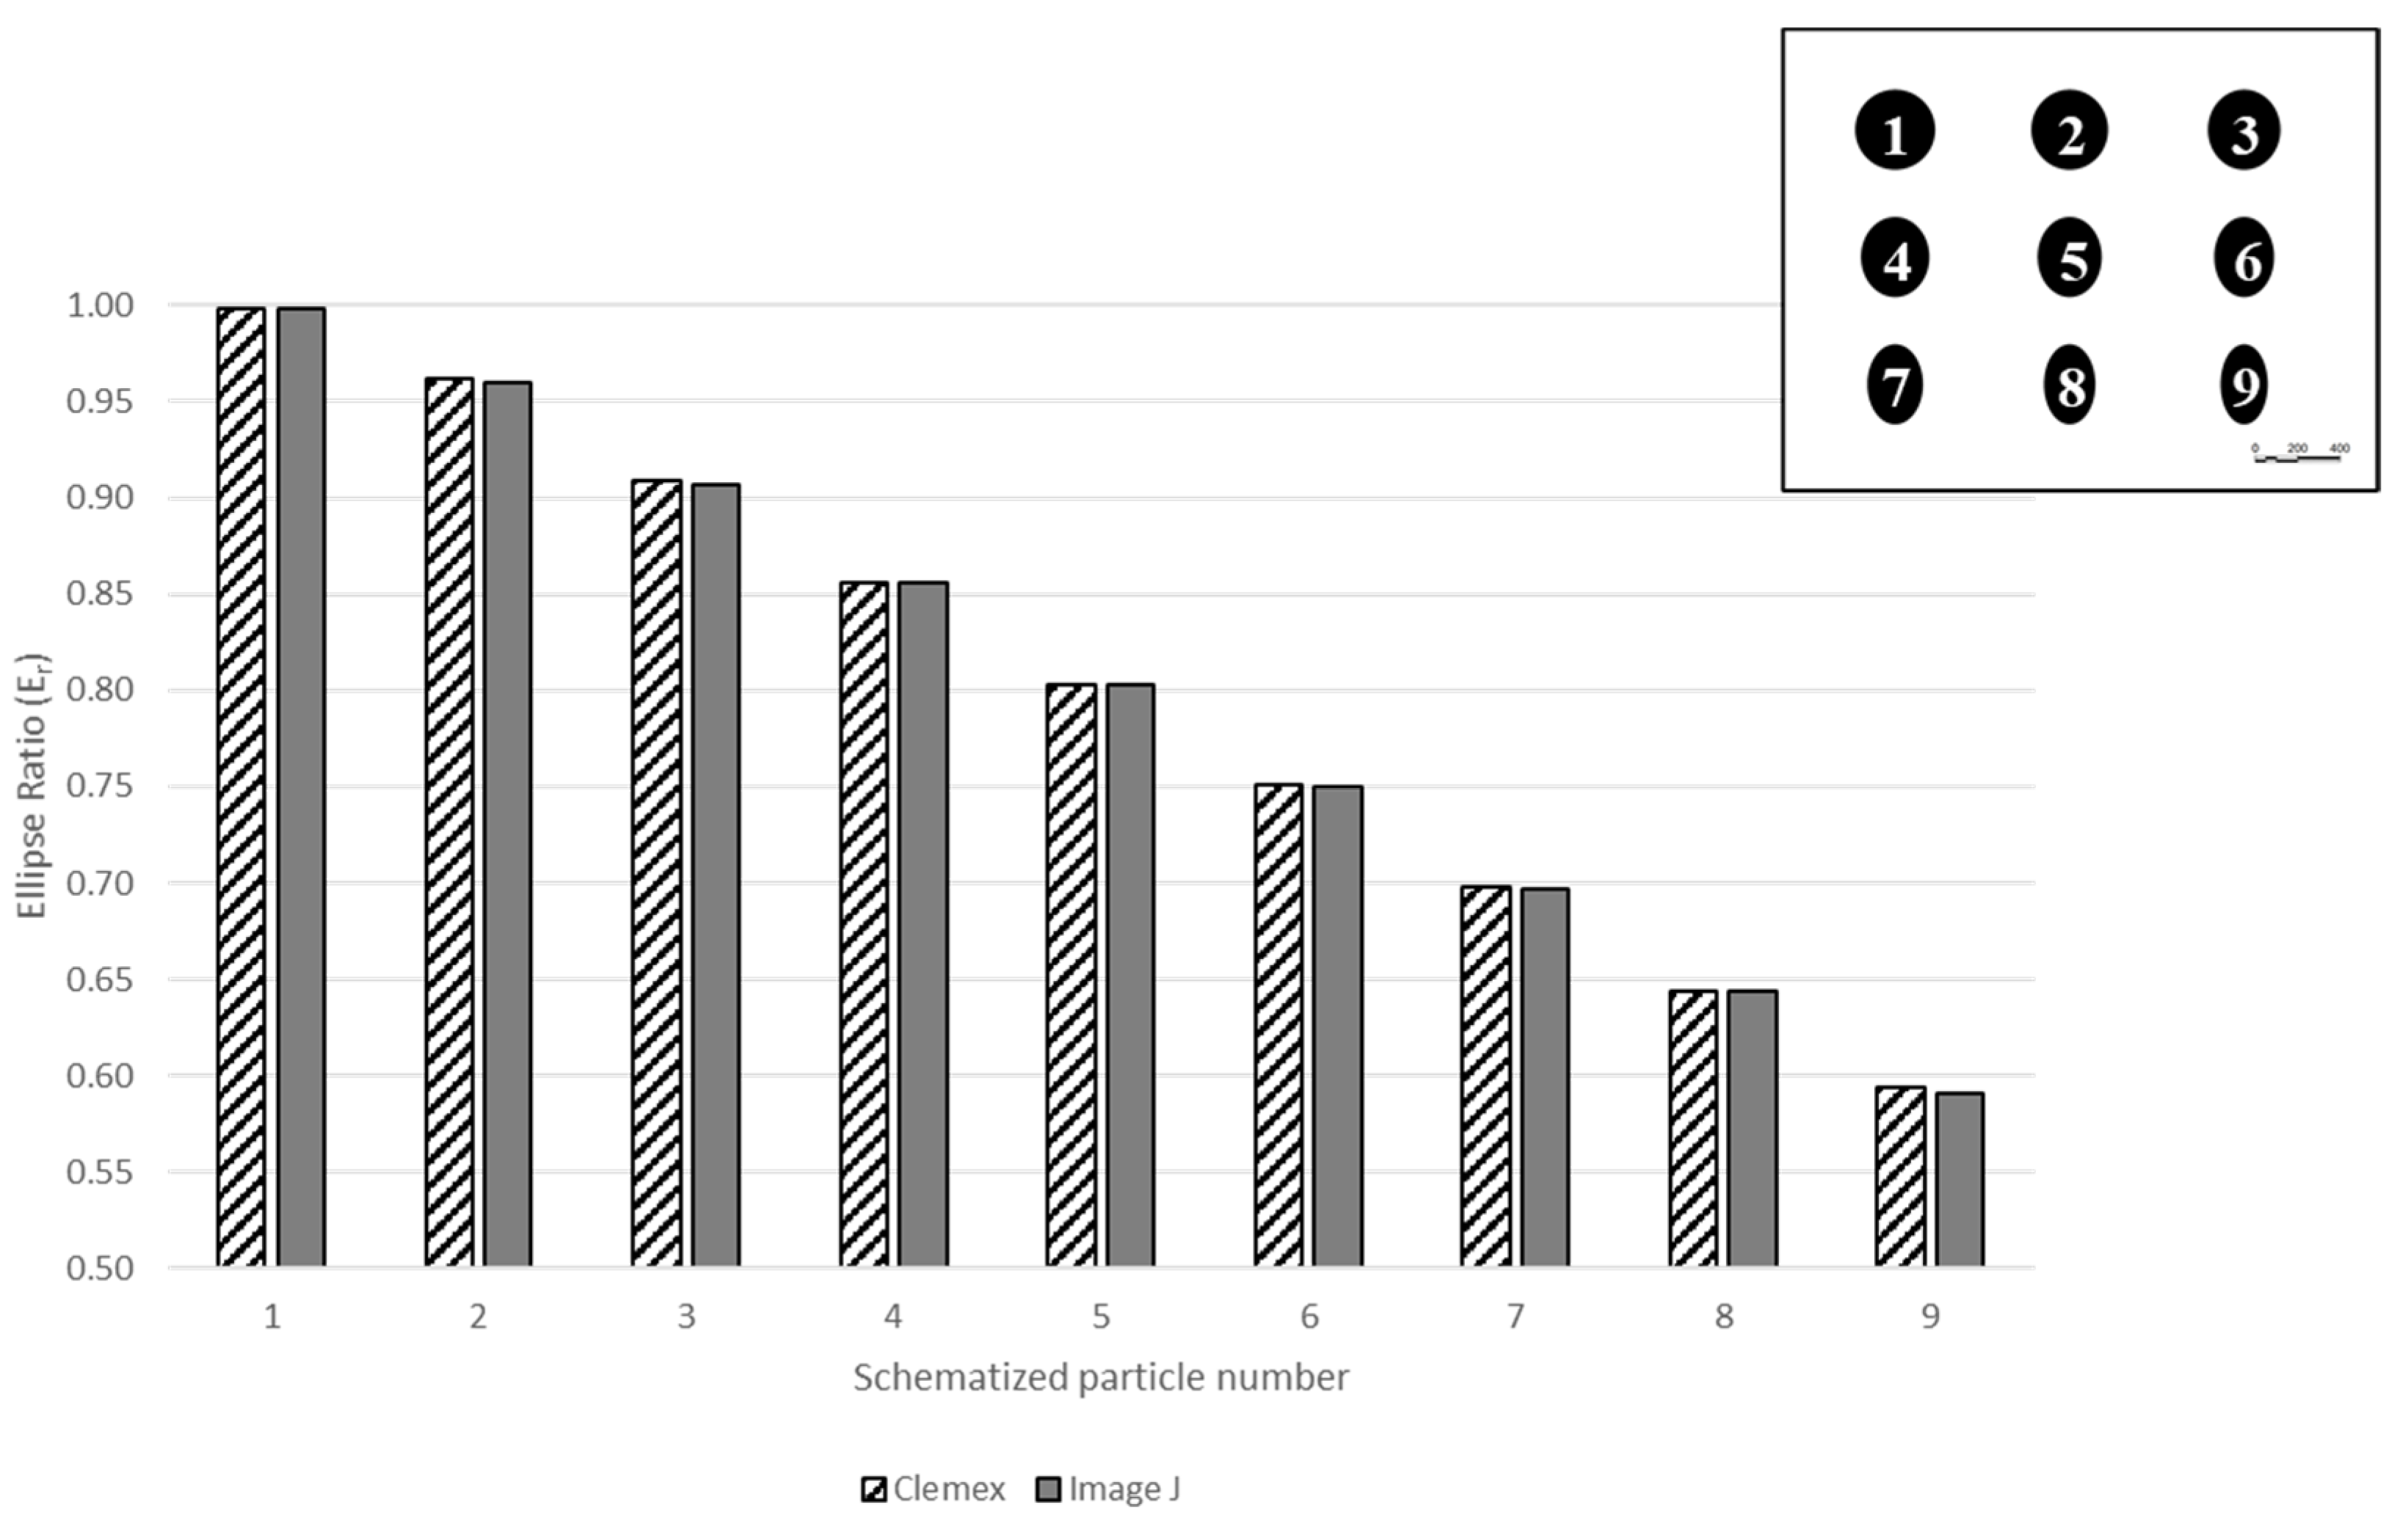
3.1. Image Analysis of Schematized Particles
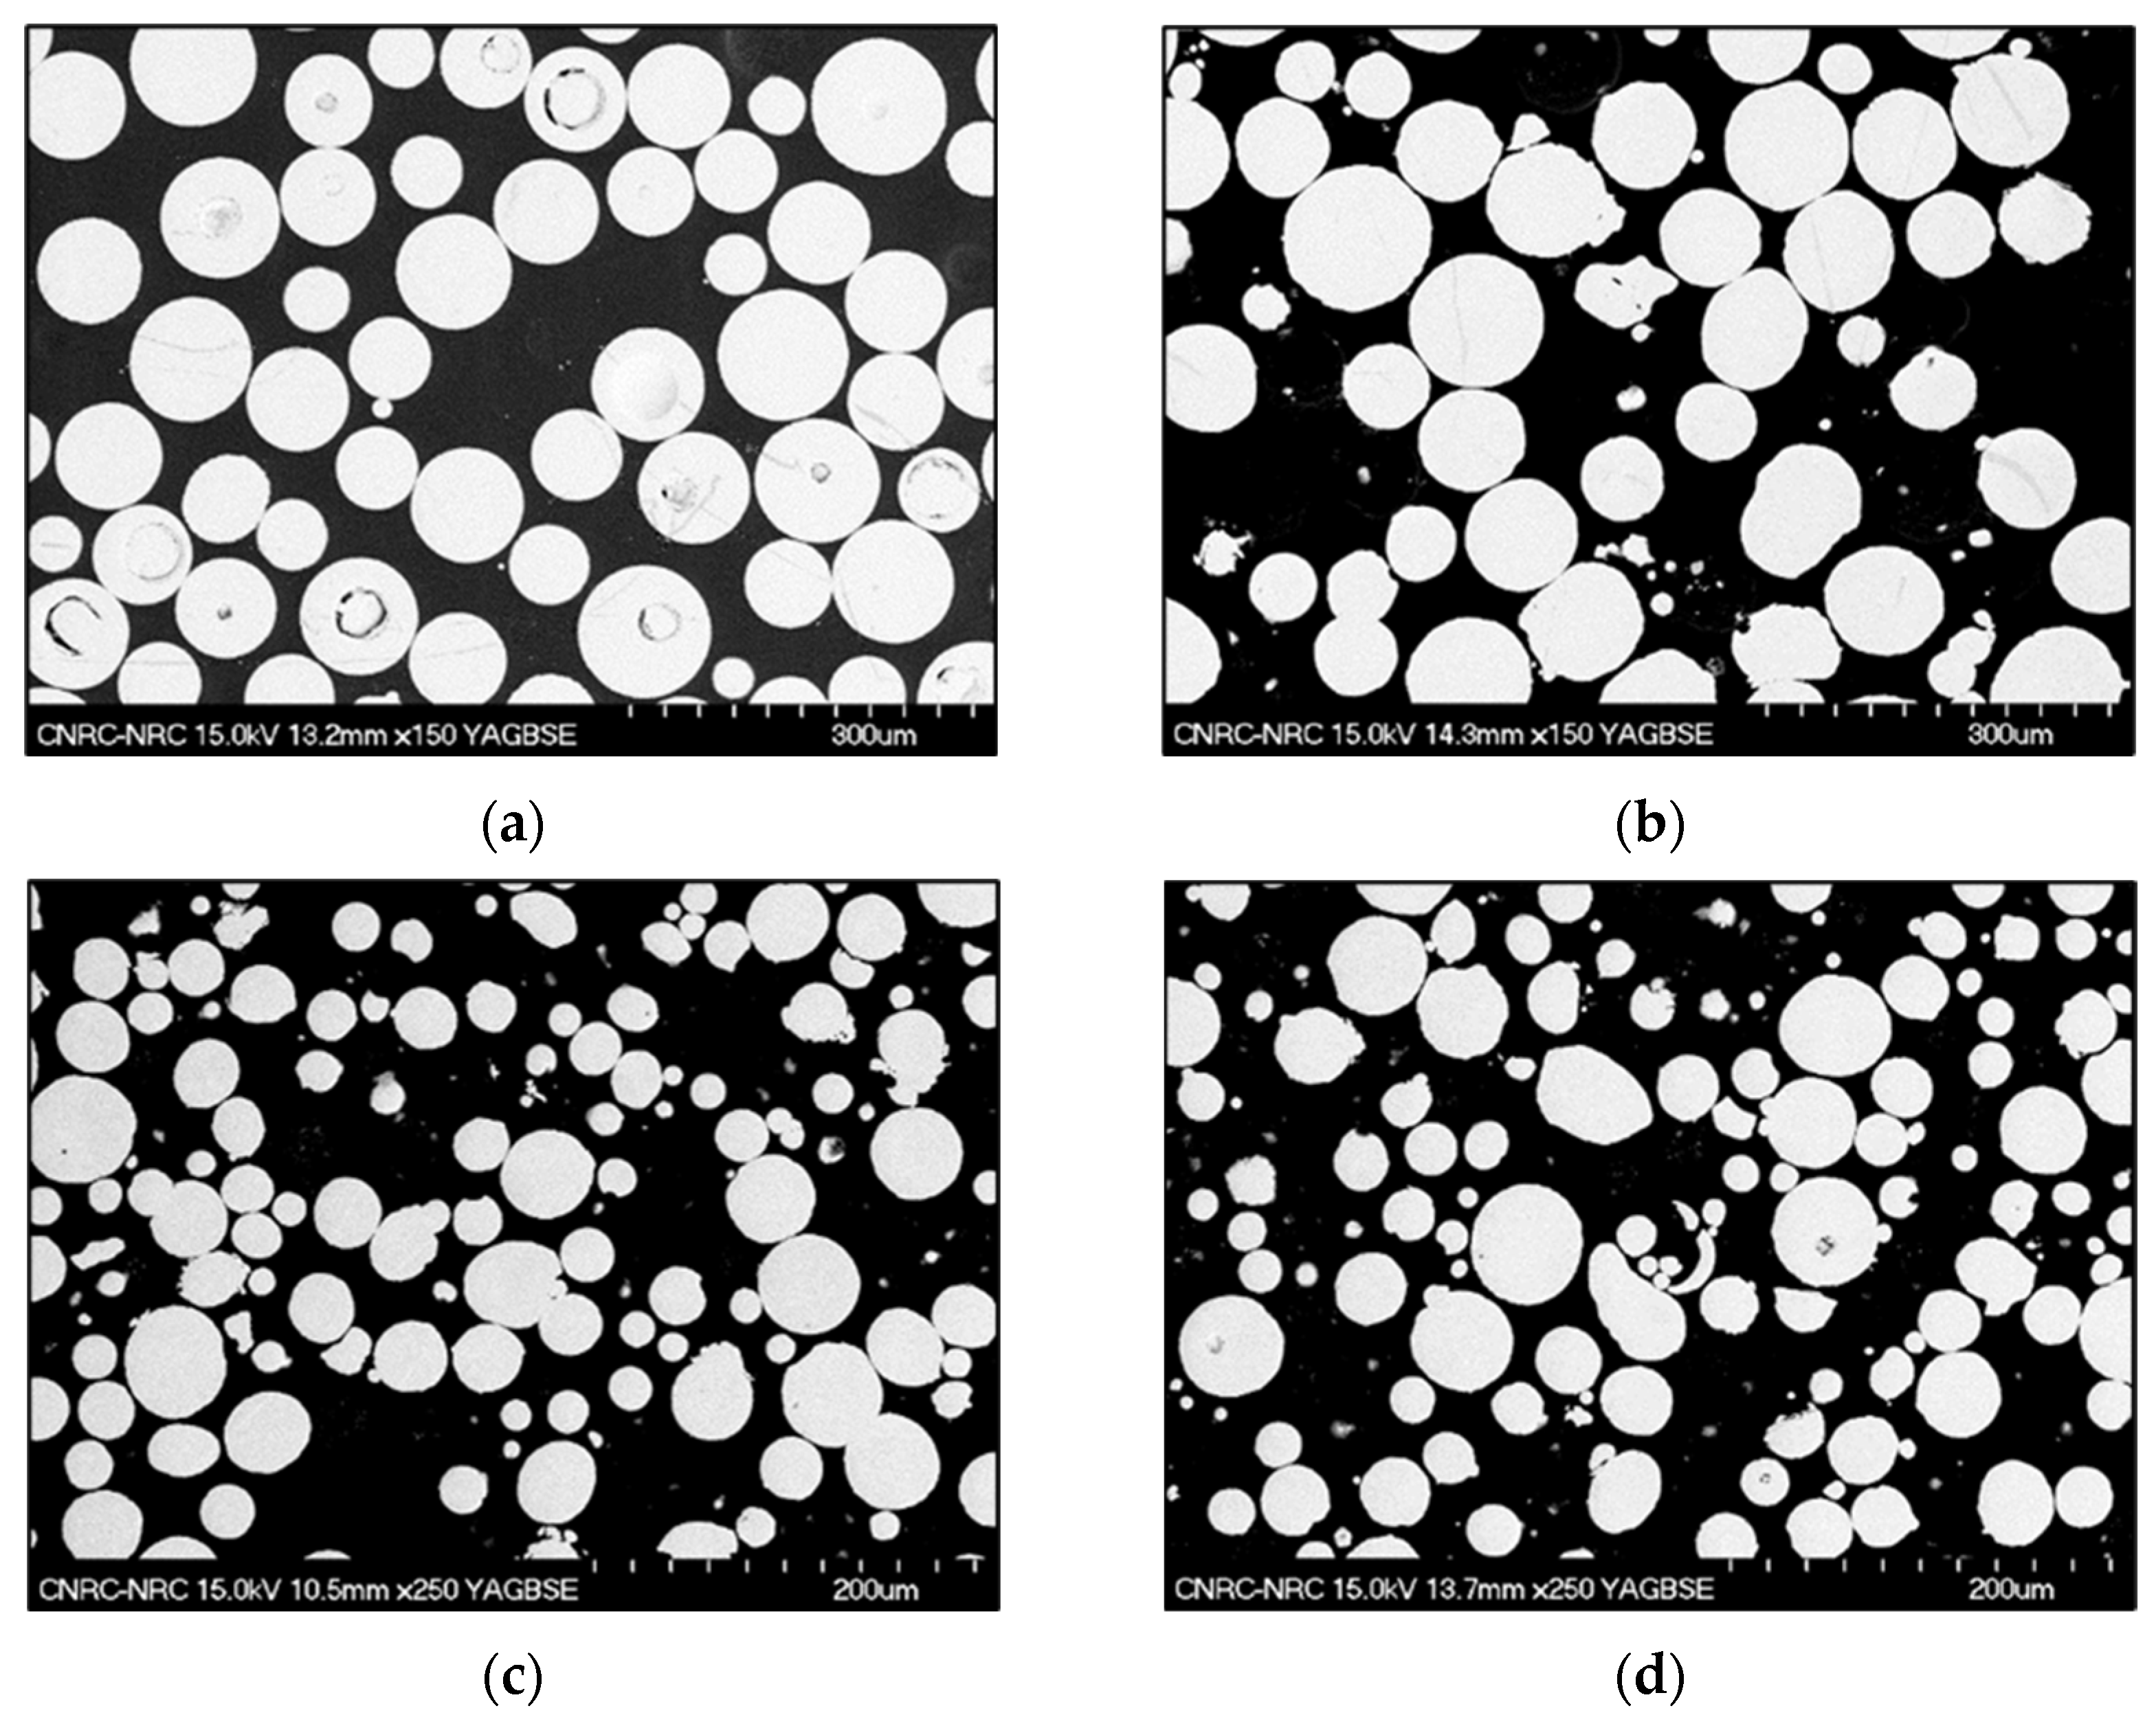
3.2. Image Analysis of Metallic Powder Samples
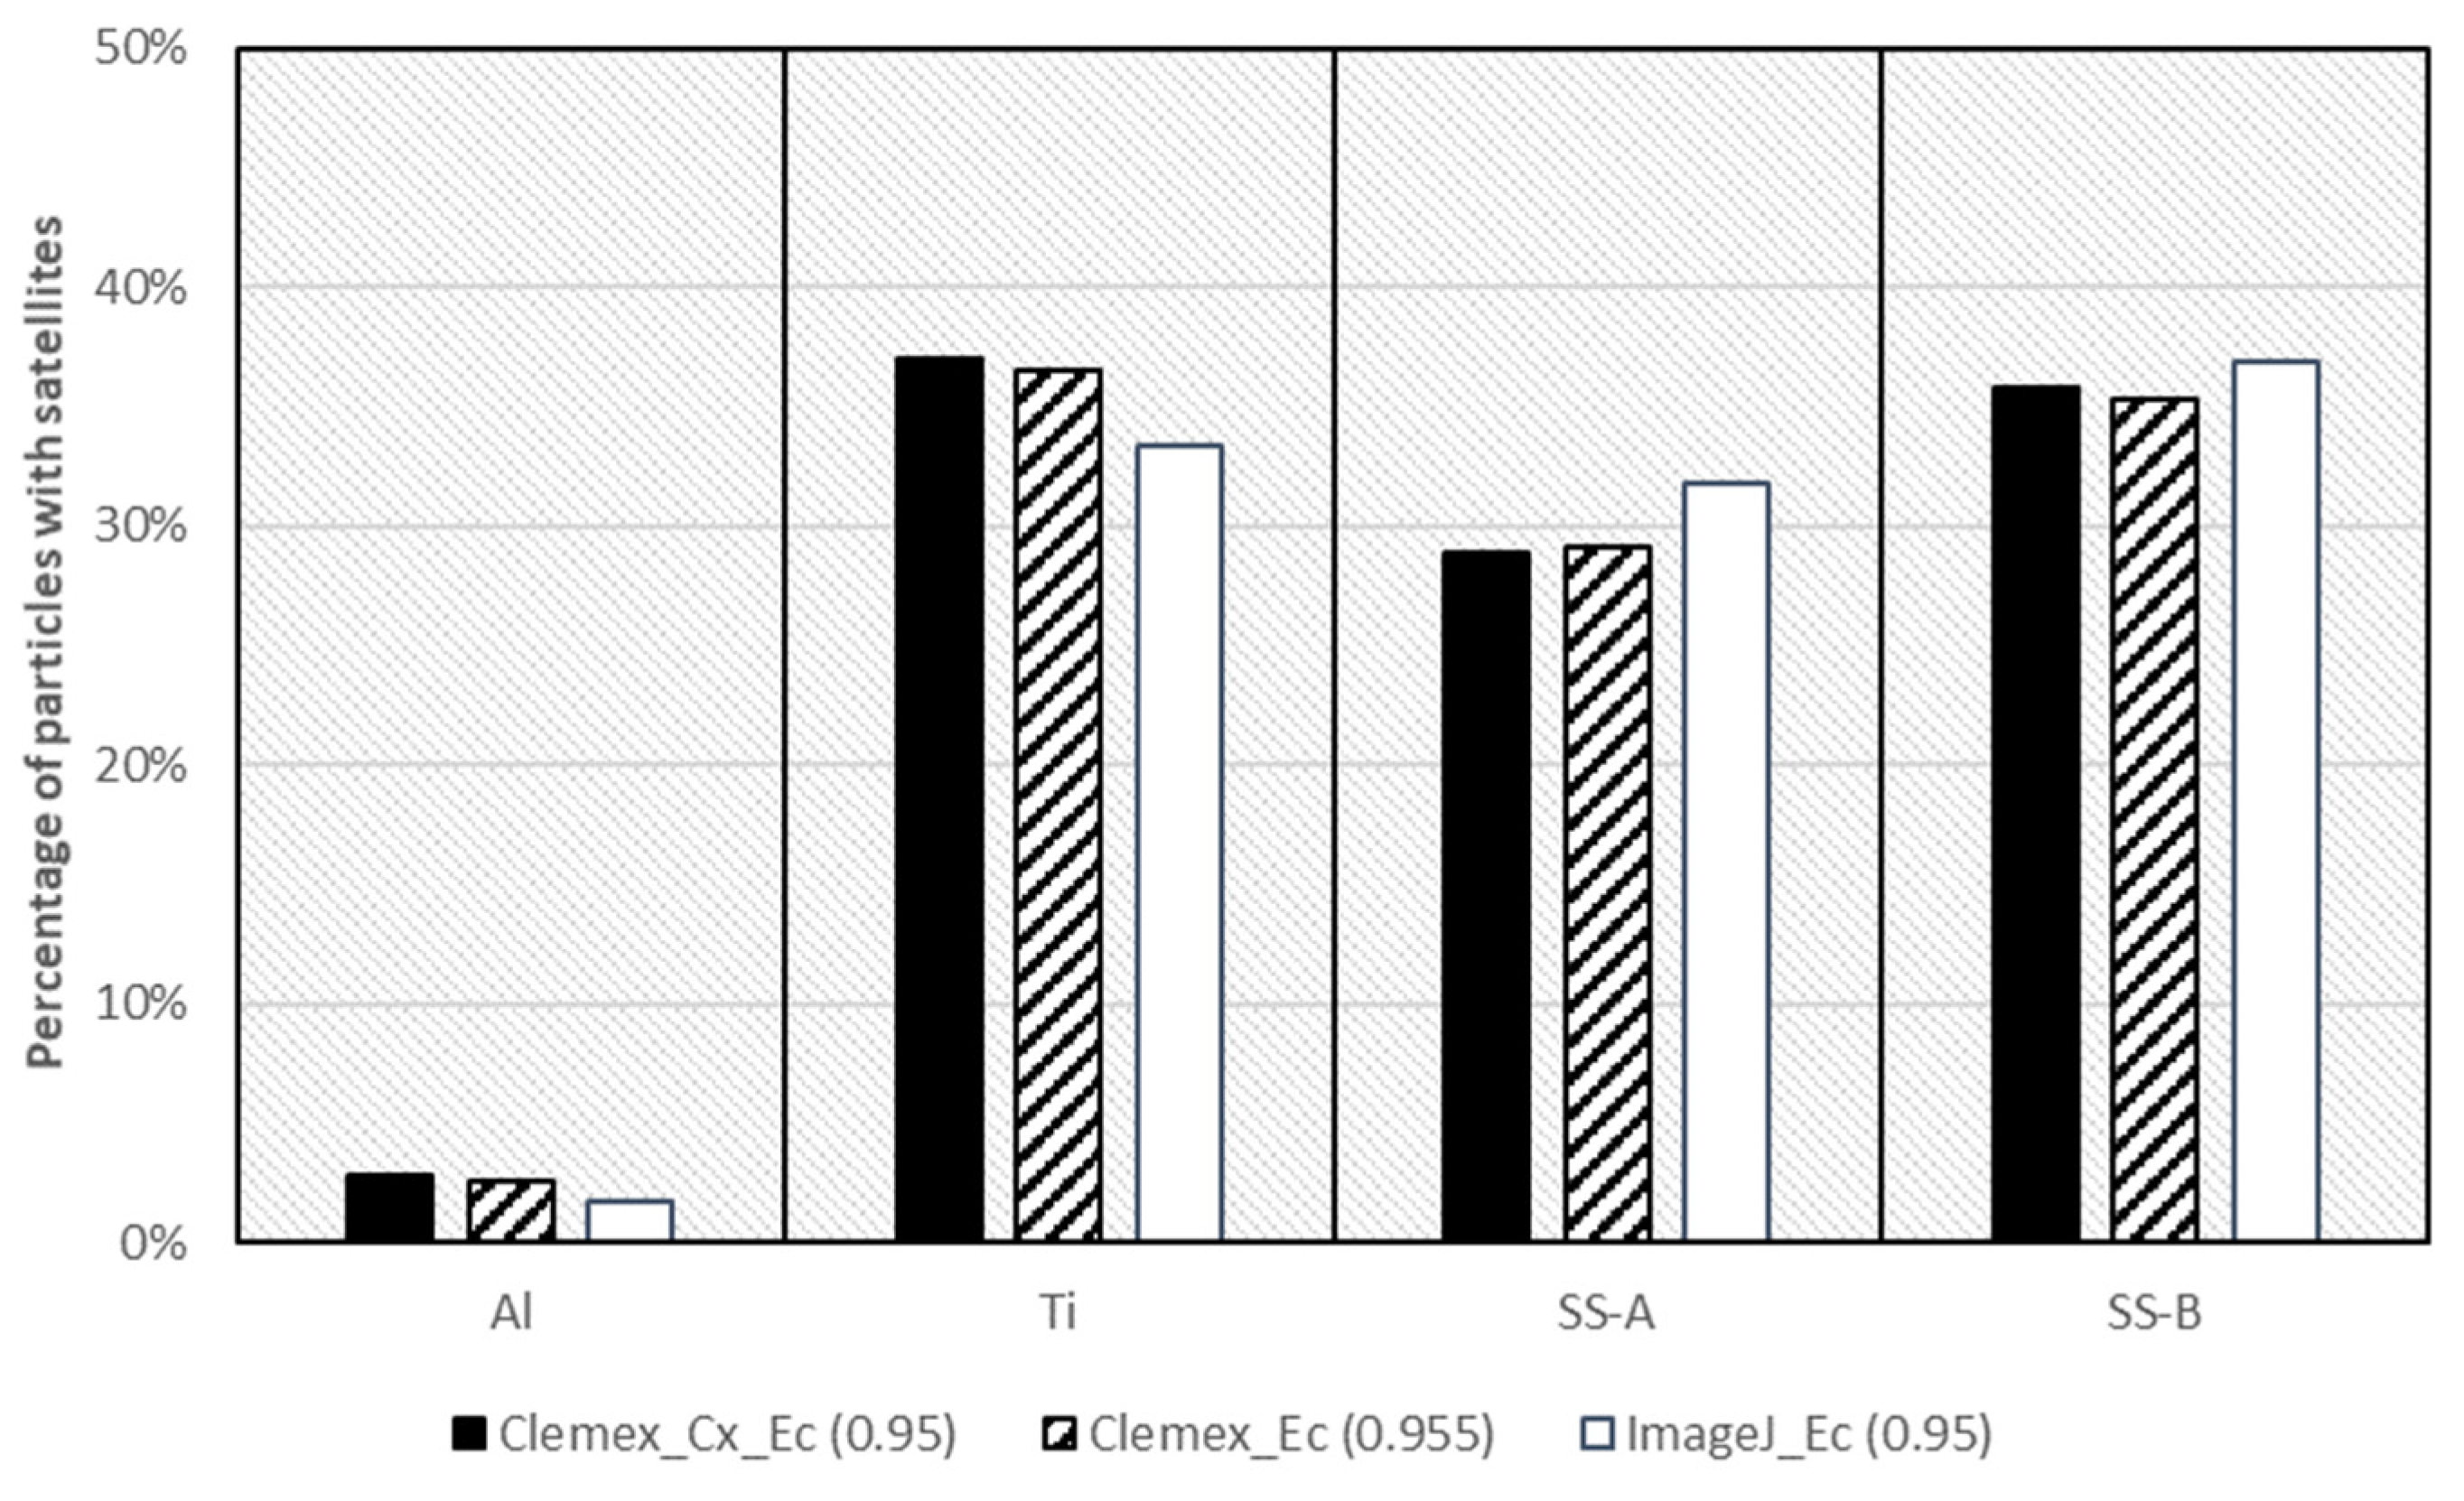
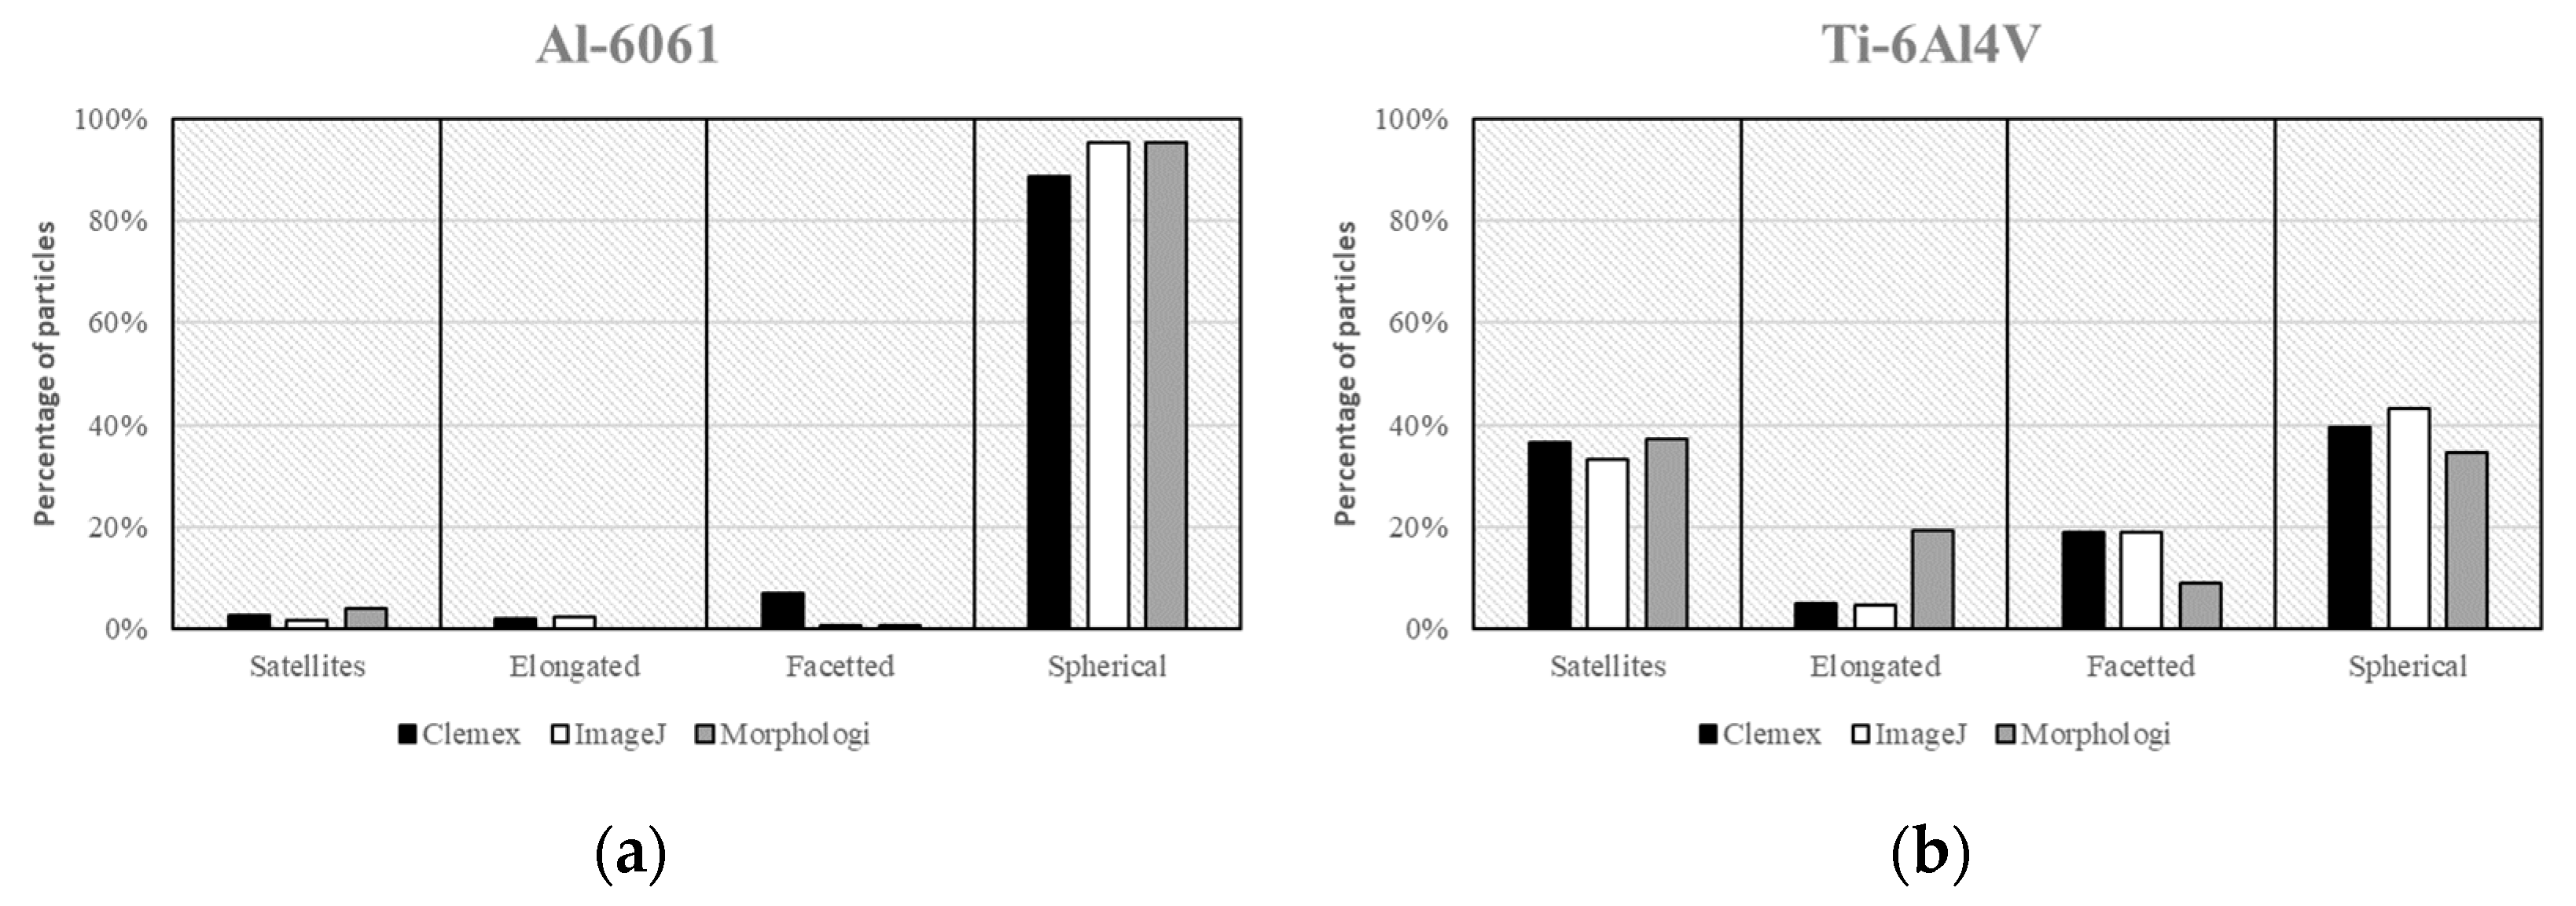
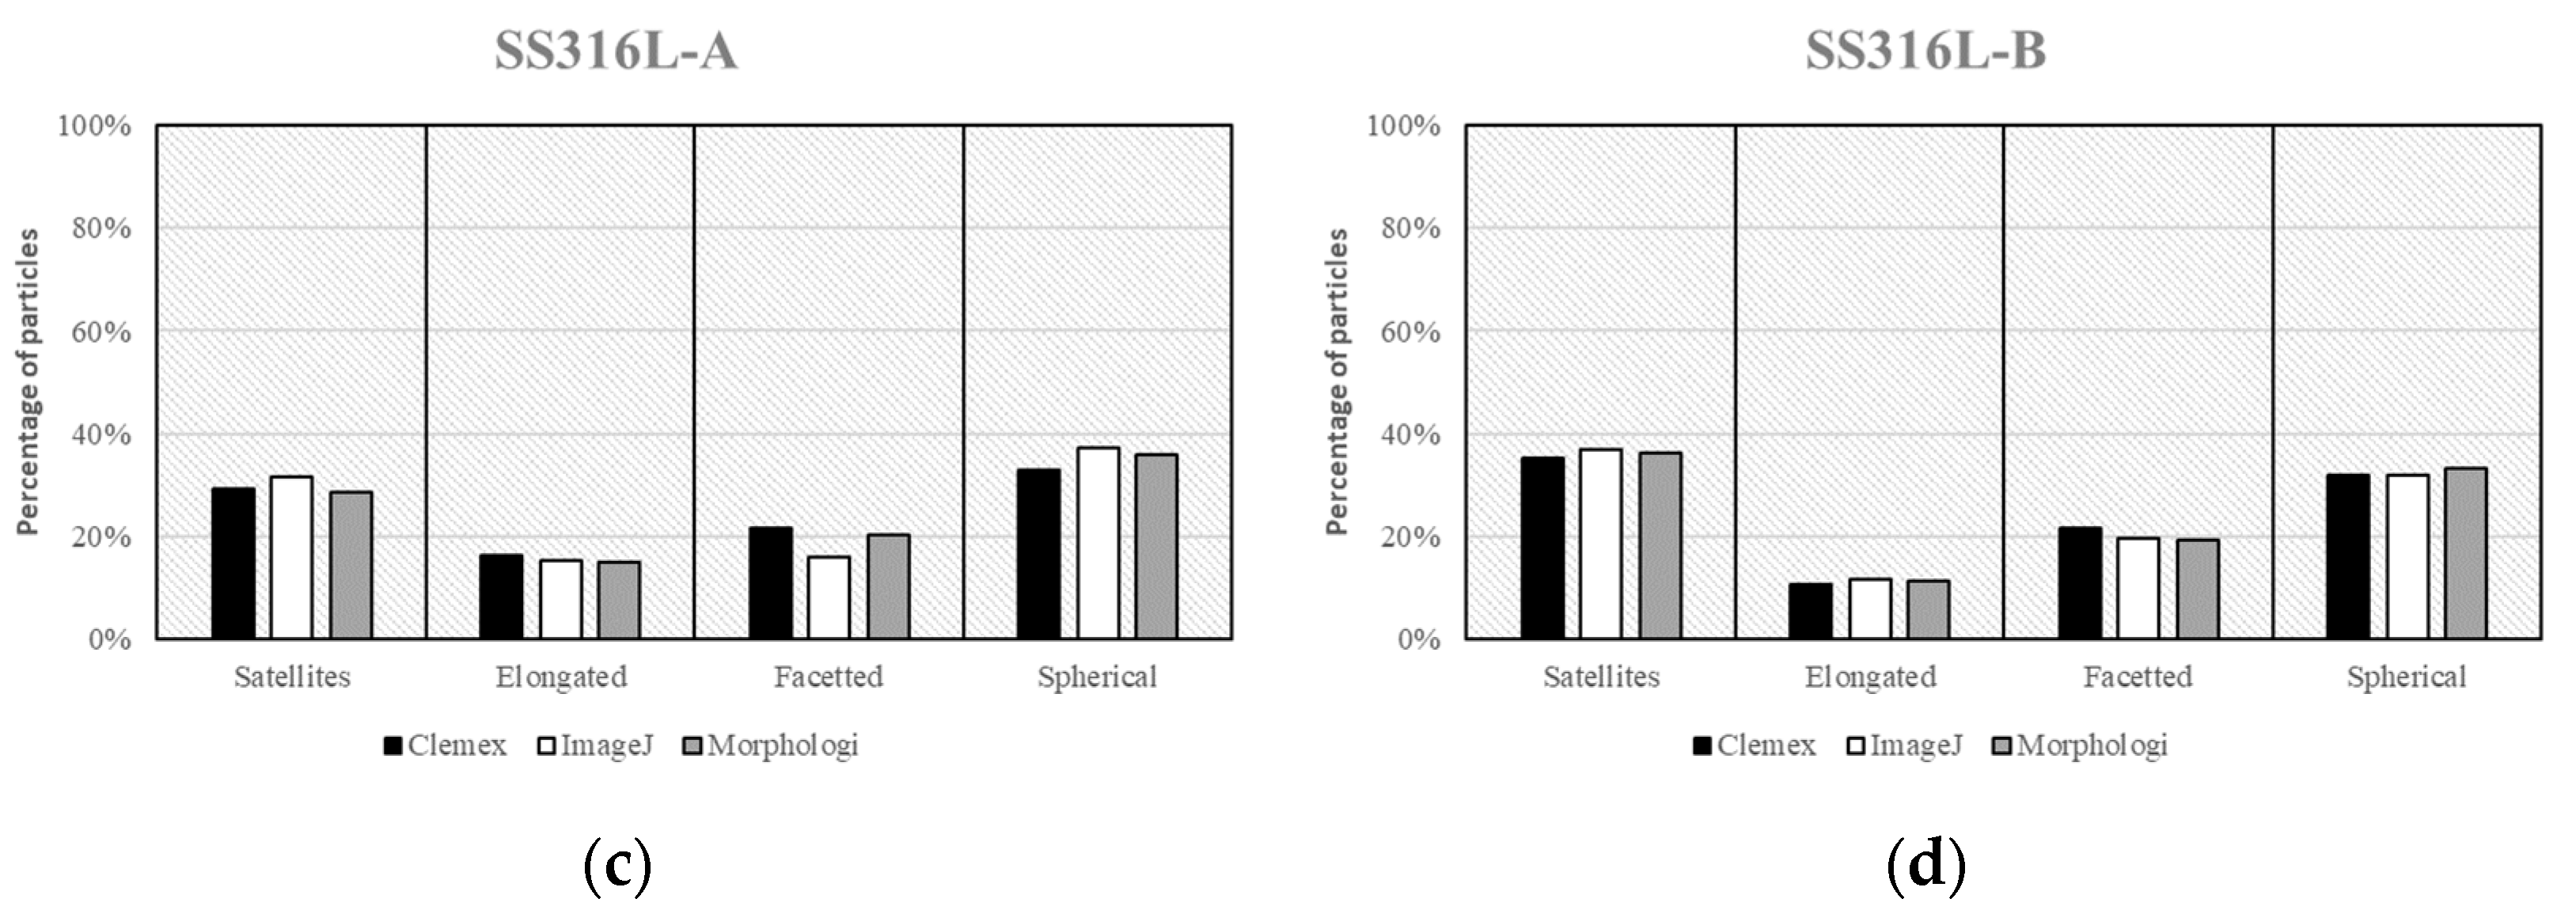
3.3. Automated Static Image Analysis of Metallic Powder Samples
4. Discussion
5. Conclusions
Author Contributions
Funding
Institutional Review Board Statement
Informed Consent Statement
Data Availability Statement
Conflicts of Interest
Abbreviations
| A | Area |
| Al | Aluminum |
| AM | Additive Manufacturing |
| BSE | Backscattered Electron |
| Cx | Convexity Index |
| Deq | Equivalent Diameter |
| EB-PBF | Electron Beam Powder Bed Fusion |
| EL | Ellipse Length |
| Er | Ellipse Ratio |
| EW | Ellipse Width |
| EC | Extent Ratio |
| ID | Inner Diameter |
| IR | Irregularity Ratio |
| L | Length |
| LPBF-LB/M | Laser Powder Bed Fusion of Metals |
| MIC | Minimum Inscribed Circle |
| OD | Outer Diameter |
| P | Perimeter |
| PC | Convex Hull Perimeter |
| Rn | Roundness Index |
| SD | Standard Deviation |
| SEM | Scanning Electron Microscope |
| SD | Standard Deviation |
| SS | Stainless Steel |
| Ti | Titanium |
| W | Width |
| XFmin | Minimum Feret Diameter |
| XFmax | Maximum Feret Diameter |
References
- Lewis, G. Aspects of the Powder in Metal Additive Manufacturing: A Review. World J. Eng. Technol. 2022, 10, 363–409. [Google Scholar] [CrossRef]
- Powell, D.; Rennie, A.E.; Geekie, L.; Burns, N. Understanding powder degradation in metal additive manufacturing to allow the upcycling of recycled powders. J. Clean. Prod. 2020, 268, 122077. [Google Scholar] [CrossRef]
- Ghods, S.; Schultz, E.; Wisdom, C.; Schur, R.; Pahuja, R.; Montelione, A.; Arola, D.; Ramulu, M. Electron beam additive manufacturing of Ti6Al4V: Evolution of powder morphology and part microstructure with powder reuse. Materialia 2020, 9, 100631. [Google Scholar] [CrossRef]
- Tang, H.P.; Qian, M.; Liu, N.; Zhang, X.Z.; Yang, G.Y.; Wang, J. Effect of Powder Reuse Times on Additive Manufacturing of Ti-6Al-4V by Selective Electron Beam Melting. JOM 2015, 67, 555–563. [Google Scholar] [CrossRef]
- Capozzi, L.C.; Sivo, A.; Bassini, E. Powder spreading and spreadability in the additive manufacturing of metallic materials: A critical review. J. Mater. Process. Technol. 2022, 308, 117706. [Google Scholar] [CrossRef]
- Gaffin, N.D.; Milner, J.L.; Palomares, K.B.; Ironman, T.; Zinkle, S.J. Effect of powder size and geometry on consolidation of Mo30%W alloy by spark plasma sintering. Int. J. Refract. Met. Hard Mater. 2022, 108, 105944. [Google Scholar] [CrossRef]
- Gallagher, C.; Kerr, E.; McFadden, S. Particle size distribution for additive manufacturing powder using stereological corrections. Powder Technol. 2023, 429, 118873. [Google Scholar] [CrossRef]
- Tan, J.H.; Wong, W.L.E.; Dalgarno, K.W. An overview of powder granulometry on feedstock and part performance in the selective laser melting process. Addit. Manuf. 2017, 18, 228–255. [Google Scholar] [CrossRef]
- Mussatto, A.; Groarke, R.; O’Neill, A.; Obeidi, M.A.; Delaure, Y.; Brabazon, D. Influences of powder morphology and spreading parameters on the powder bed topography uniformity in powder bed fusion metal additive manufacturing. Addit. Manuf. 2021, 38, 101807. [Google Scholar] [CrossRef]
- Zhao, Y.; Aoyagi, K.; Daino, Y.; Yamanaka, K.; Chiba, A. Significance of powder feedstock characteristics in defect suppression of additively manufactured Inconel 718. Addit. Manuf. 2020, 34, 101277. [Google Scholar] [CrossRef]
- Riener, K.; Albrecht, N.; Ziegelmeier, S.; Ramakrishnan, R.; Haferkamp, L.; Spierings, A.B.; Leichtfried, G.J. Influence of particle size distribution and morphology on the properties of the powder feedstock as well as of AlSi10Mg parts produced by laser powder bed fusion (LPBF). Addit. Manuf. 2020, 34, 101286. [Google Scholar] [CrossRef]
- Cooke, A.; Slotwinski, J. Properties of Metal Powders for Additive Manufacturing: A Review of the State of the Art of Metal Powder Property Testing. In NIST Interagency/Internal Report (NISTIR); National Institute of Standards and Technology: Gaithersburg, MD, USA, 2012. [Google Scholar]
- Charbonneau, C.; Bernier, F.; Pelletier, R.; Lefebvre, L.P. Classification of Particle Shape Using Two-Dimensional Image Analysis. Prog. Addit. Manuf. 2022, 25–39. [Google Scholar] [CrossRef]
- Singh, P.; Ramakrishnan, P. Powder Characterization by Particle Shape Assessment. KONA Powder Part. J. 1996, 14, 16–30. [Google Scholar] [CrossRef]
- ISO. Representation of Results of Particle Size Analysis—Part 6: Descriptive and Quantitative Representation of Particle Shape and Morphology; International Organization for Standardization: Geneva, Switzerland, 2008. [Google Scholar]
- ASTM F3049; Standard Guide for Characterizing Properties of Metal Powders Used for Additive Manufacturing Processes. ASTM International: West Conshohocken, PA, USA, 2014.
- ASTM F3571; Standard Guide for Additive Manufacturing—Feedstock—Particle Shape Image Analysis by Optical Photography to Identify and Quantify the Agglomerates/Satellites in Metal Powder Feedstock. ASTM International: West Conshohocken, PA, USA, 2022.
- Grace, J.R.; Ebneyamini, A. Connecting particle sphericity and circularity. Particuology 2021, 54, 1–4. [Google Scholar] [CrossRef]
- Underwood, E.E. Quantitative Stereology for Microstructural Analysis. In Microstructural Analysis; McCall, J.L., Mueller, W.M., Eds.; Springer: Boston, MA, USA, 1973; pp. 35–66. [Google Scholar]
- Sutton, A.T.; Kriewall, C.S.; Leu, M.C.; Newkirk, J.W. Powders for Additive Manufacturing Processes: Characterization Techniques and Effects on Part Properties. In Proceedings of the 27th Annual International Solid Freeform Fabrication Symposium, Austin, TX, USA, 8–10 August 2016. [Google Scholar]


| Basic Measurement | ∆ (%) | SD (%) | Basic Measurement | ∆ (%) | SD (%) | ||
|---|---|---|---|---|---|---|---|
 | A | 0.53 | 0.04 |  | A | 0.84 | 0.03 |
| PC | 0.12 | 0.02 | PC | 0.29 | 0.01 | ||
| P | −3.83 | 0.23 | P | −3.48 | 0.27 | ||
| XFmax | 0.18 | 0.11 | XFmax | 0.35 | 0.05 | ||
| XFmin | 0.23 | 0.13 | XFmin | 0.48 | 0.20 | ||
| EL | 0.57 | 0.21 | EL | 0.80 | 0.17 | ||
| EW | 0.55 | 0.24 | EW | 0.87 | 0.13 | ||
 | A | 1.61 | 0.13 |  | A | 1.83 | 0.64 |
| PC | 0.64 | 0.04 | PC | 0.48 | 0.05 | ||
| P | −3.48 | 0.24 | P | −3.23 | 0.61 | ||
| XFmax | 0.68 | 0.13 | XFmax | 0.61 | 0.16 | ||
| XFmin | 0.61 | 0.39 | XFmin | 0.56 | 0.20 | ||
| EL | 0.74 | 0.05 | EL | 0.73 | 0.24 | ||
| EW | 0.88 | 0.14 | EW | 1.16 | 0.49 | ||
 | A | 0.40 | 0.12 |  | A | 1.46 | 0.04 |
| PC | 0.00 | 0.03 | PC | 0.61 | 0.04 | ||
| P | −4.57 | 0.65 | P | −3.56 | 0.96 | ||
| XFmax | 0.13 | 0.06 | XFmax | 0.54 | 0.08 | ||
| XFmin | 0.10 | 0.07 | XFmin | 0.57 | 0.13 | ||
| EL | 0.50 | 0.13 | EL | 0.76 | 0.05 | ||
| EW | 0.40 | 0.17 | EW | 0.77 | 0.07 | ||
| Morphological Descriptor | ∆ (%) | SD (%) | Morphological Descriptor | ∆ (%) | SD (%) | ||
|---|---|---|---|---|---|---|---|
 | Cx | 3.80 | 0.21 | 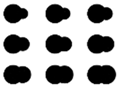 | Cx | 3.64 | 0.27 |
| EC | 0.11 | 0.11 | EC | 0.00 | 0.18 | ||
| Er | −0.02 | 0.07 | Er | 0.07 | 0.06 | ||
| Rn | 0.16 | 0.19 | Rn | 0.14 | 0.11 | ||
 | Cx | 4.01 | 0.22 |  | Cx | 3.56 | 0.60 |
| EC | 0.33 | 0.36 | EC | 0.98 | 0.94 | ||
| Er | 0.14 | 0.17 | Er | 0.43 | 0.35 | ||
| Rn | 0.26 | 0.26 | Rn | 0.63 | 0.81 | ||
 | Cx | 4.37 | 0.60 |  | Cx | 4.02 | 0.84 |
| EC | 0.41 | 0.22 | EC | 0.36 | 0.18 | ||
| Er | −0.10 | 0.09 | Er | 0.01 | 0.05 | ||
| Rn | 0.52 | 0.29 | Rn | 0.40 | 0.15 | ||
Disclaimer/Publisher’s Note: The statements, opinions and data contained in all publications are solely those of the individual author(s) and contributor(s) and not of MDPI and/or the editor(s). MDPI and/or the editor(s) disclaim responsibility for any injury to people or property resulting from any ideas, methods, instructions or products referred to in the content. |
© 2025 by the authors. Licensee MDPI, Basel, Switzerland. This article is an open access article distributed under the terms and conditions of the Creative Commons Attribution (CC BY) license (https://creativecommons.org/licenses/by/4.0/).
Share and Cite
Charbonneau, C.; Bernier, F.; Perrault, É.; Pelletier, R.; Lefebvre, L.-P. Classification of Metallic Powder Morphology Using Traditional and Automated Static Image Analysis: A Comparative Study. Powders 2025, 4, 15. https://doi.org/10.3390/powders4020015
Charbonneau C, Bernier F, Perrault É, Pelletier R, Lefebvre L-P. Classification of Metallic Powder Morphology Using Traditional and Automated Static Image Analysis: A Comparative Study. Powders. 2025; 4(2):15. https://doi.org/10.3390/powders4020015
Chicago/Turabian StyleCharbonneau, Cindy, Fabrice Bernier, Étienne Perrault, Roger Pelletier, and Louis-Philippe Lefebvre. 2025. "Classification of Metallic Powder Morphology Using Traditional and Automated Static Image Analysis: A Comparative Study" Powders 4, no. 2: 15. https://doi.org/10.3390/powders4020015
APA StyleCharbonneau, C., Bernier, F., Perrault, É., Pelletier, R., & Lefebvre, L.-P. (2025). Classification of Metallic Powder Morphology Using Traditional and Automated Static Image Analysis: A Comparative Study. Powders, 4(2), 15. https://doi.org/10.3390/powders4020015