1. Introduction
By the end of 2023, there were more than 117.3 million people who had no choice but to leave their hometowns, fleeing conflict, violence, and persecution [
1]. When people are forcibly displaced, UNHCR first sets up refugee camps for emergency relief and provides shelters such as tents and temporary housing. Tents and refugee housing units can be assembled quickly, but since they are imported products, they take time to arrive at the camps. Refugee housing units are required to be safer and more durable than tents. Still, their durability is not long because their important goals are to protect refugees temporarily from the external environment, such as rain and wind, and to be erected quickly. Therefore, tents and refugee housing units, temporary spaces for evacuation, are not made as spaces to “live in” for a long time. Durable shelters have a long durability of 10 years, but since they are constructed using industrial materials, refugees may face limitations in acquiring these resources. Moreover, owing to budgetary issues, aid from international organizations is not indefinite and decreases over time. So, it is desirable to select easily accessible materials so that forcibly displaced people can build and maintain their houses.
Earth is the building material used by humans for the longest time. According to Marsh et al., the proportion of households living in earthen dwellings worldwide is estimated to be 8–10%, with the average in developing countries ranging from 20–25% [
2]. It exhibits notable environmental performance attributable to its ease of recyclability, and the overall cost, including transportation, remains low owing to its availability in substantial quantities. A study by Bah et al. [
3] stated that in developing countries, earthen houses are the most effective housing form, and in African countries, they can save the cost by at least 25% compared to other housing forms. A study by Adegun et al. [
4] also mentioned that earthen houses could save about 30 to 60% in costs compared to conventional concrete-based construction. Moreover, it has a very low Global Warming Potential (GWP) (~0.002 kg-eqCO
2/kg for sun-dried brick [
5], ~0.023 kg-eqCO
2/kg for rammed earth [
6,
7]).
Emergency shelters are built using natural materials such as earth, earned from the surroundings, so material and transportation costs can be minimized. Therefore, it can be seen that they are cheaper than tents and refugee housing units. Moreover, the construction period is short, several days, and the durability is longer than that of tents and refugee housing units. However, materials such as earth are not industrial products, so the performance of the materials varies depending on the location, and the skill level of the workers also varies. Adjusting the ratio of materials and adding reusable materials, such as waste, is desirable to make the most of limited materials and human resources (technical capabilities).
Enhancing the interparticle forces among soil particles and promoting chemical bonding through adding binders are effective methods to improve the compressive strength of soil solidification. There are several ways to improve the interparticle force, including controlling the particle size distribution, increasing the density of the solidification by controlling the amount of water and packing energy, increasing the cohesion due to clay minerals, and controlling the distance between particles by adding a dispersant [
8,
9,
10,
11,
12,
13]. Soils can be classified into clay, silt, and sand based on particle size, and most studies have evaluated compressive strength according to particle size distribution by adjusting this ratio. However, since the type of soil minerals (one of the factors affecting the compressive strength) also varies depending on the particle size, quantitatively evaluating the relationship between each factor and compressive strength is limited. Meanwhile, it can be considered to enhance the strength and durability of soil solidification through chemical bonding by adding binders such as cement, lime, and gum [
14,
15,
16,
17,
18,
19]. However, the addition of industrial materials, like cement, is not readily available to refugees and has the limitation of generating large CO
2 emissions. According to Ávila et al. [
10], rammed earth stabilized with 7.5% cement emits more than 14 times the carbon than the same volume of unstabilized rammed earth. Moreover, previous studies rarely address the specific challenges faced in refugee camps, such as accessibility to materials and labor constraints.
This study aims to examine the suitability of earthen houses for refugee housing and to quantitatively identify the effects of each factor that enhances interparticle forces in order to develop a more efficient system.
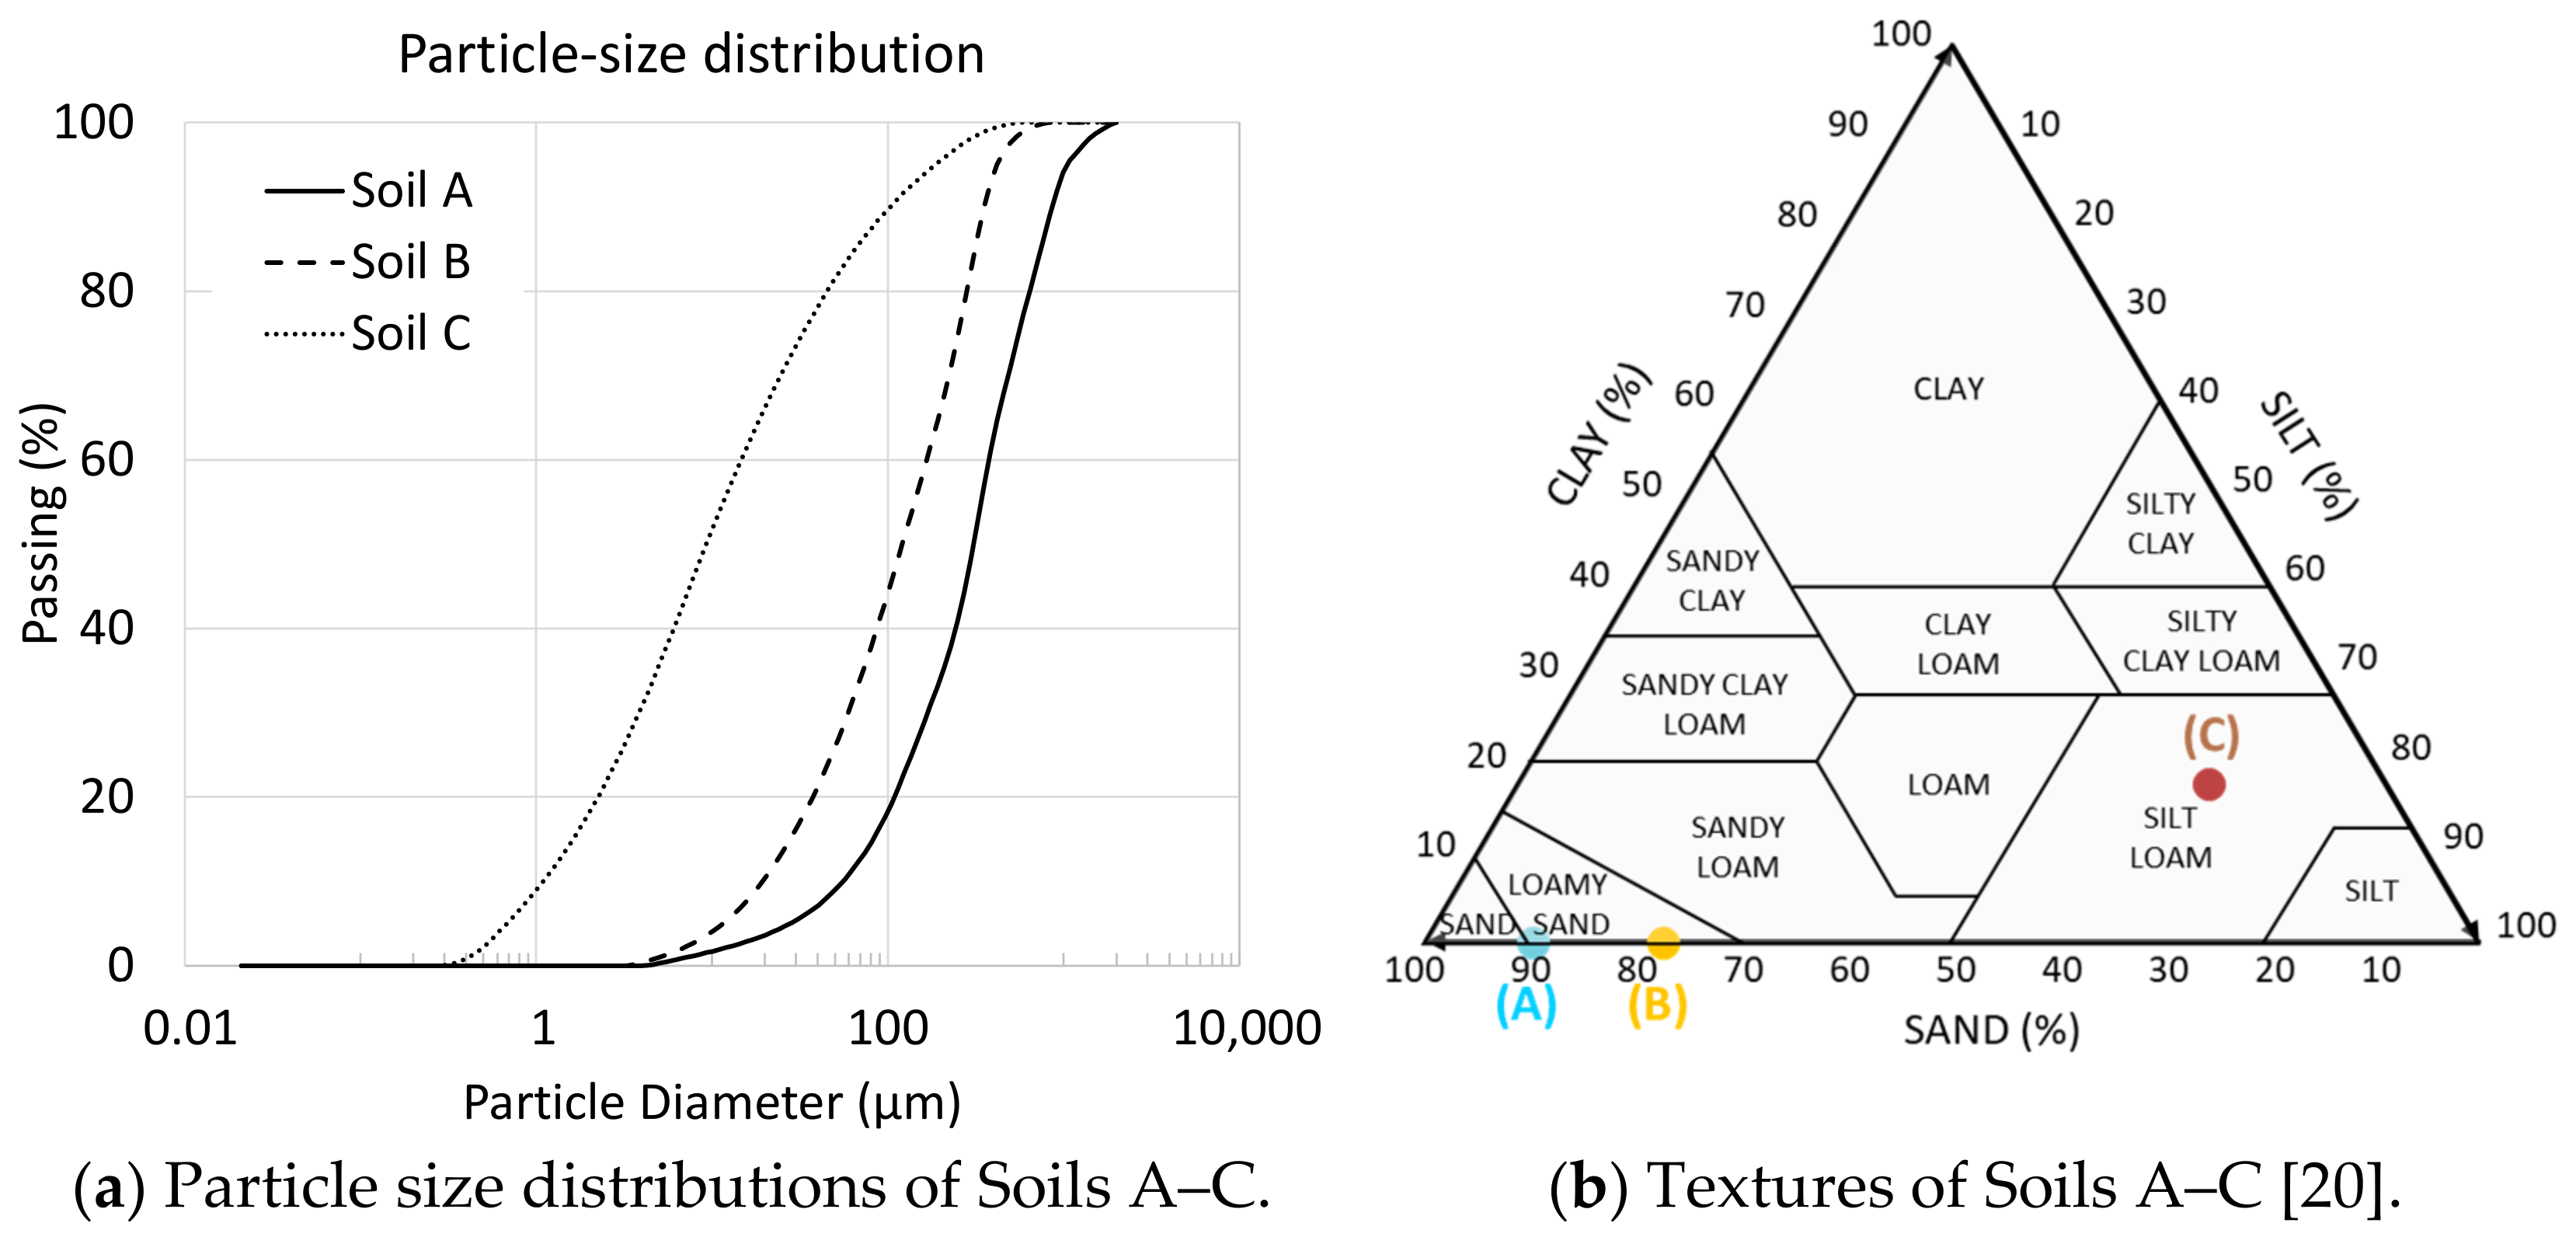
Section 2 describes the properties such as particle size distribution, density, pH, color, chemical, and mineral composition of the three types of soil used in this paper, and analyzes the fundamental physical properties of soils.
Section 3 describes the effects of soil type, moisture content, particle size distribution, and mixture type on compressive strength. In
Section 4, the tensile strength is determined through a predictive equation, and the impacts of capillary forces and cohesive forces resulting from clay minerals are quantitatively evaluated by comparing them with the results of the compressive strength experiments.
Section 5 describes the water resistance of clay soil with an added alkaline stabilizer. Finally, in
Section 6, the performance of earthen houses constructed in refugee camps is evaluated, and methods for constructing houses more efficiently in a given environment are discussed.
3. Compressive Strength of Soil Solidification
3.1. Method
The compressive strength of soil solidifications using Soils A and B were conducted to evaluate the effects of the presence of clay minerals, dry unit weight and particle size distribution of soil solidification, and pH of mixing solutions.
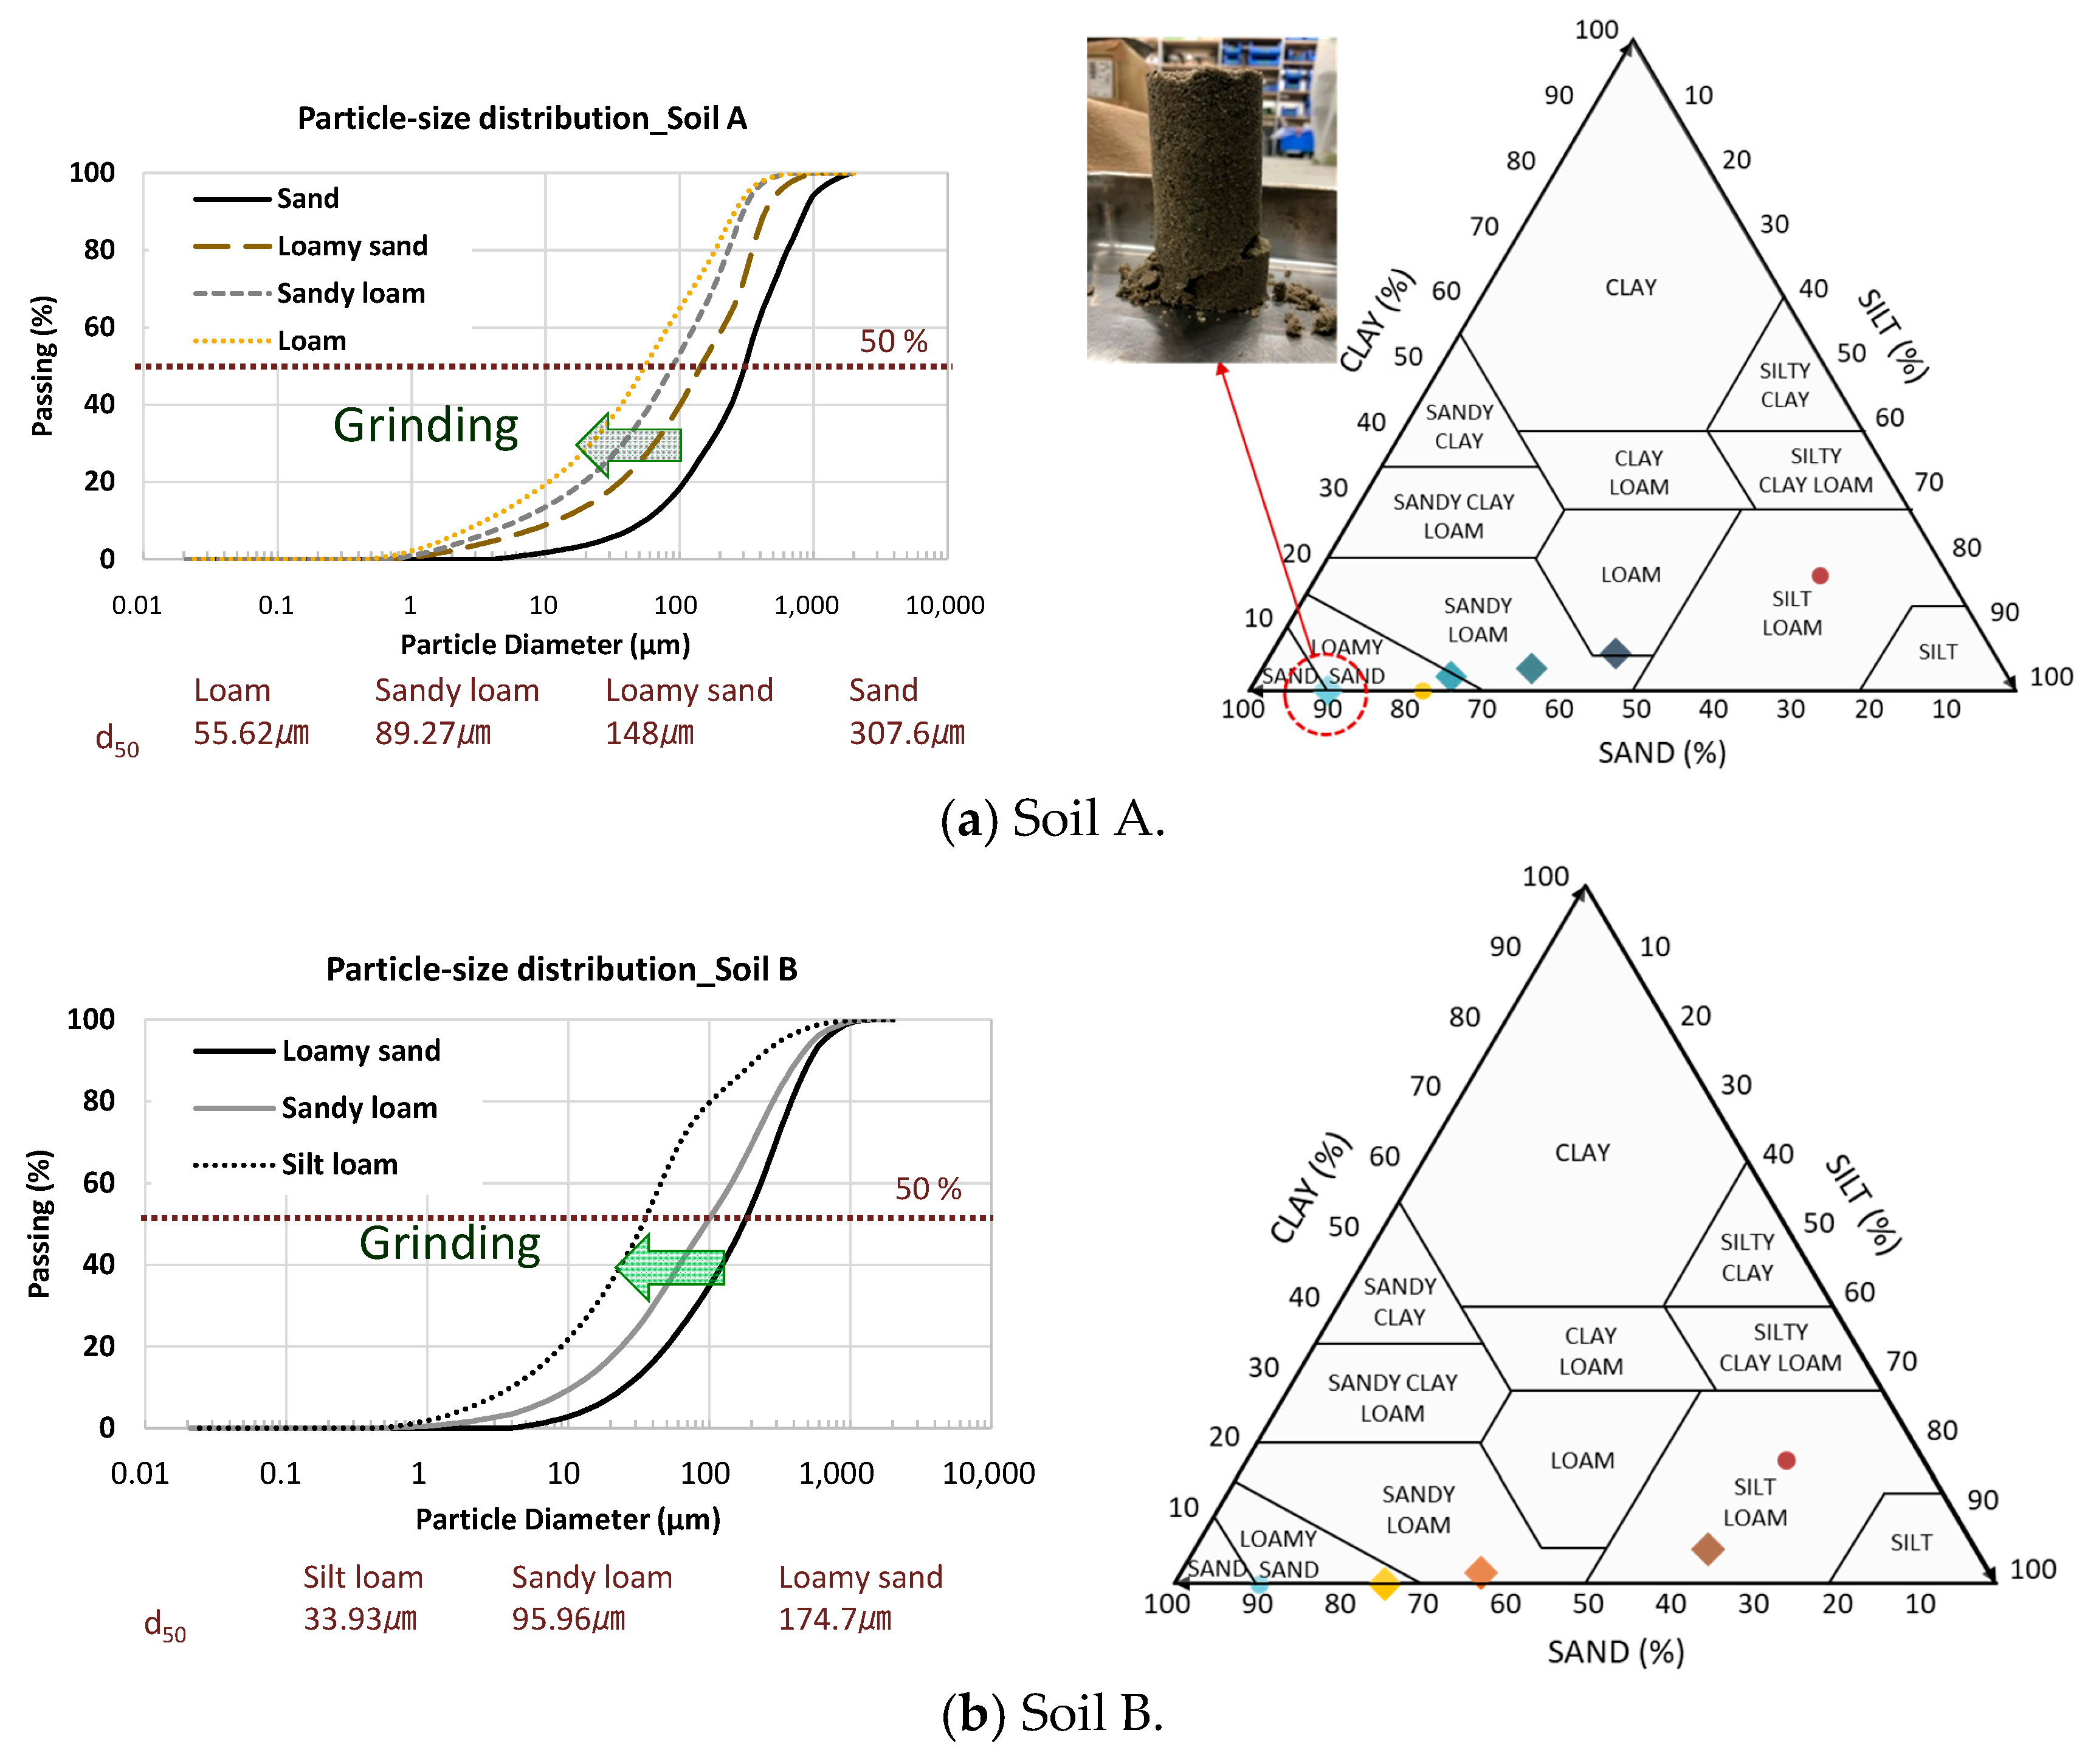
Altering the particle size distribution through sieving can result in changes in mineral proportions because soil comprises diverse minerals, and the mineral composition varies depending on the particle size. Therefore, this experiment employed mechanical grinding via a ball mill to minimize the potential for altering the mineral proportion. To obtain soils with various particle size distributions, unpulverized soil, soil crushed to only one stage, and soil crushed to two stages to make it even finer were appropriately combined and adjusted to obtain loamy sand, sandy loam, and silty loam (loam in the case of Soil A) textures.
Figure 3a shows the results of particle size distribution measurements and the resulting texture after crushing Soil A.
Table 3 shows the median diameter and specific surface area of the original sandy soil and the three types of soil obtained by crushing: loamy sand, sandy loam, and loam. Initially, approximately 90% of the soil consisted of particles with a size of 60 μm or larger, and as shown in the photograph of the test specimen in
Figure 3a, it broke during demolding. Therefore, soil solidifications were prepared using soils with different particle size distributions (loamy sand, sandy loam, and loam) after crushing, except for the original state.
Soil B is characterized as a loamy soil, and the particle size distribution measurement results and texture after crushing are shown in
Figure 3b.
Three types of specimens were prepared for each particle size distribution by varying the solution-to-soil ratio, which means the ratio of the solution weight to the dried soil weight, and the dry unit weight of each specimen was measured. Additionally, the effect of a sodium hydroxide aqueous solution (NaOH 0.25 M) with a high pH as the mixing solution on the compressive strength of the specimen was examined. NaOH 0.25 M was prepared by adding water to 10 g of solid NaOH (97% purity) to make 1 L of aqueous solution. The pH of the solution was 13.17. The preparation of test specimens for measuring the compressive strength of soil solidification is shown in
Table 4.
The size of the soil solidification specimens used in the uniaxial compression test was φ50 × 100 mm. The preparation method was as follows: Each soil that passed through a 2.36 mm sieve was mixed with a solution, followed by layer-wise compaction. Each layer was compacted 30 times using a flat rod with a 3 cm diameter. Additionally, the top surface of each layer was gently scraped with a spoon to enhance cohesion between layers.
Figure 4 shows the details of the specimen preparation process and the specimens. The specimens were promptly demolded, placed in a chamber at 20 °C and 60% RH, and dried. Strength tests were conducted when there was no change in mass. The compressive strength test was performed at a 1 mm/min speed.
3.2. Results of Compressive Strength Testing
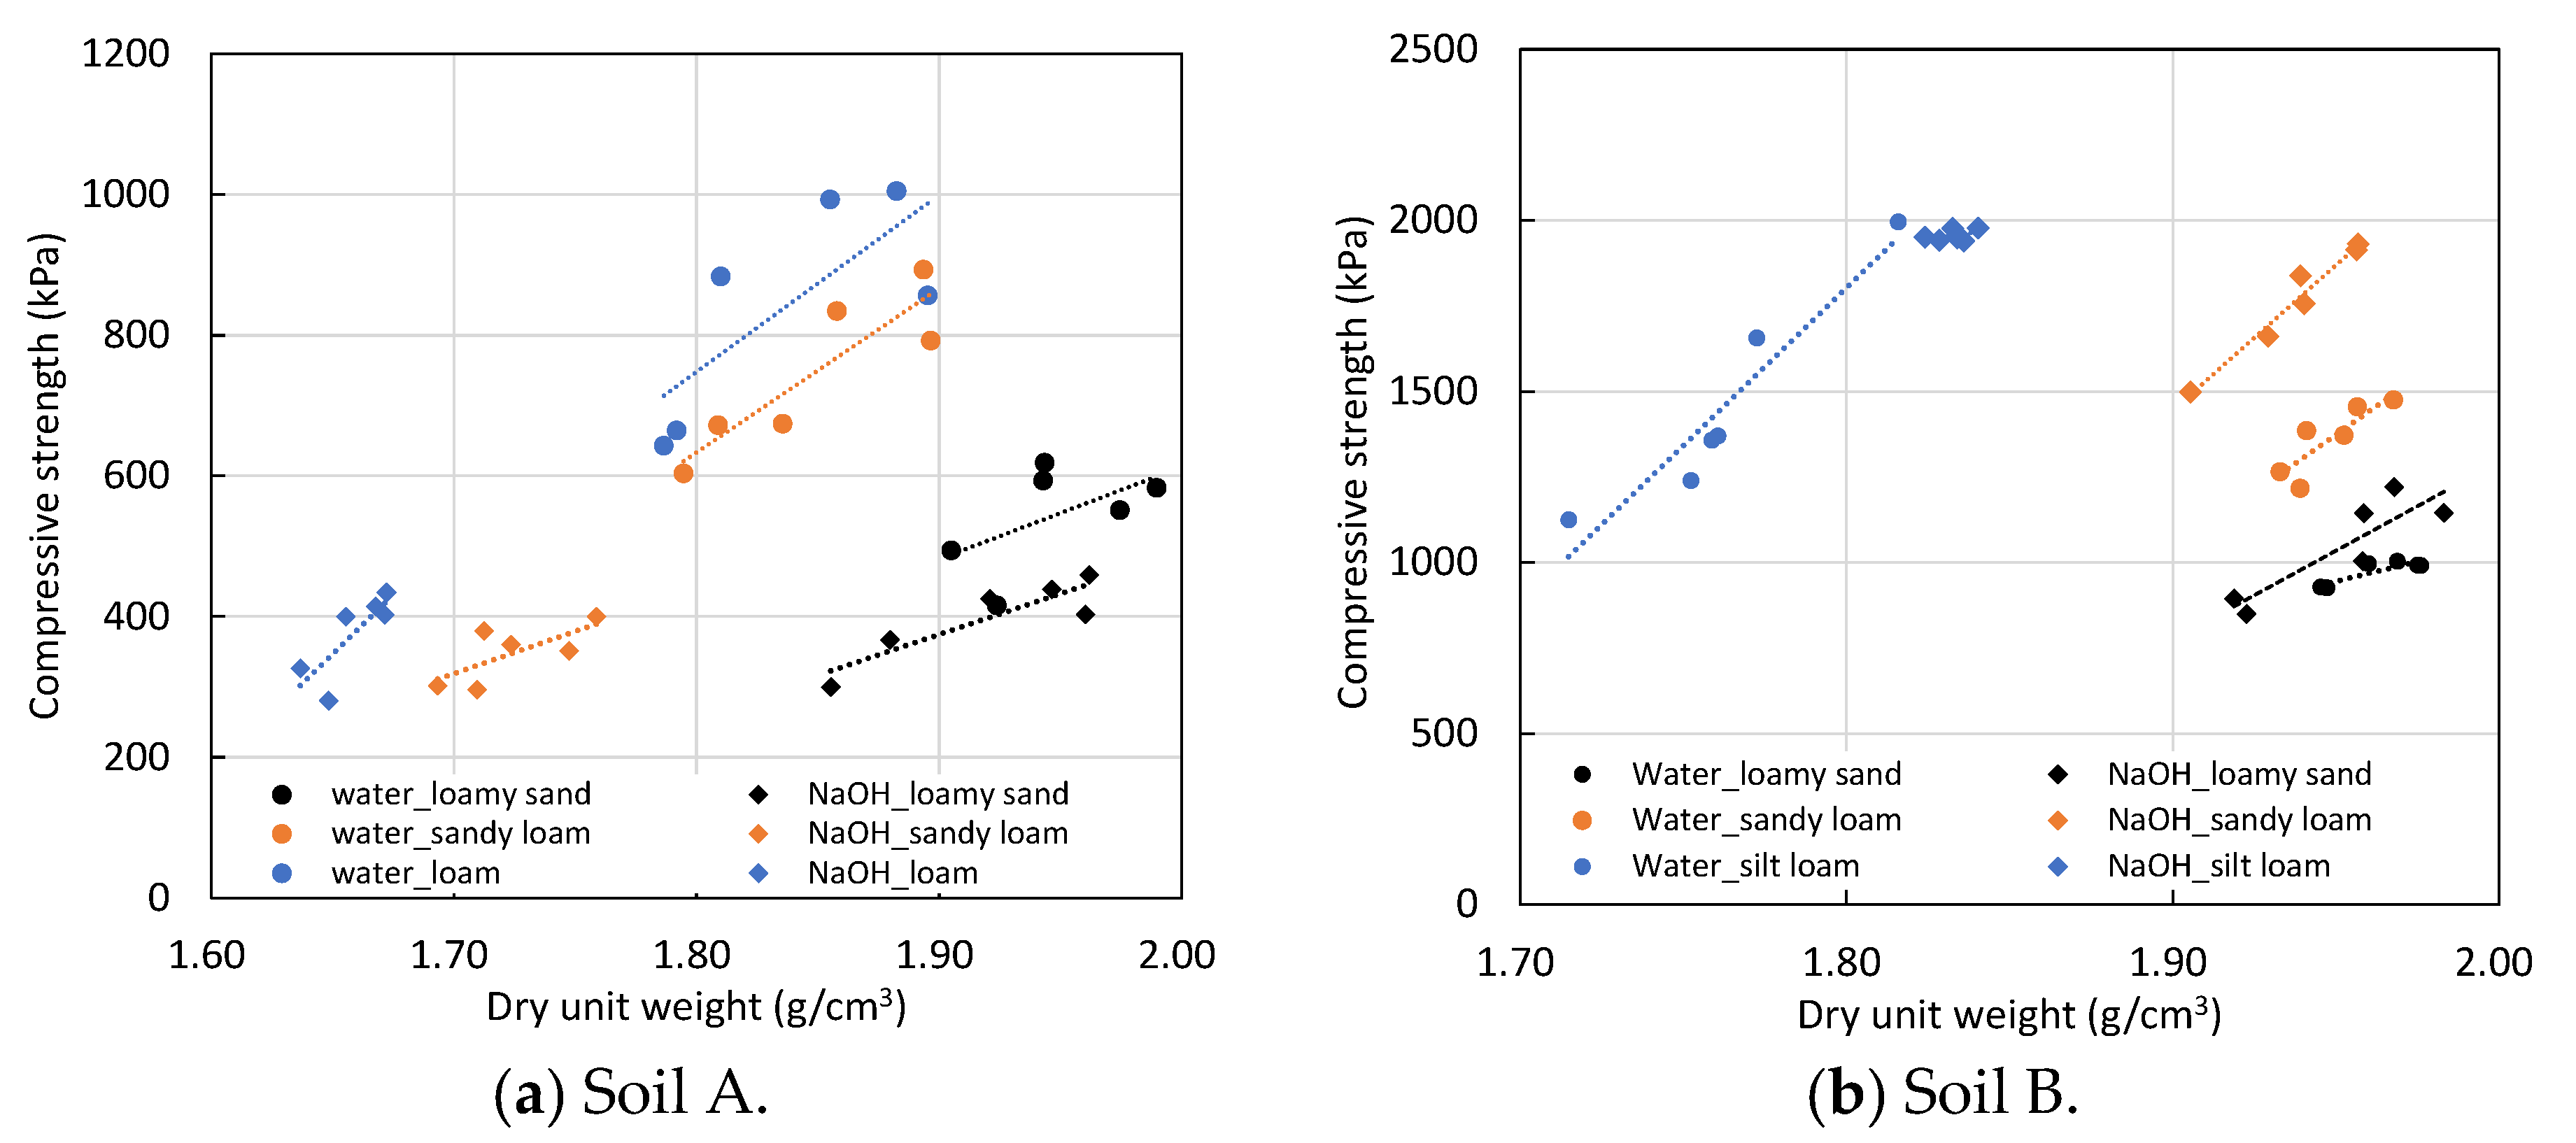
The results of the dry unit weight and compressive strength by texture are shown in
Figure 5.
In the case of Soil A mixed with deionized water, when having the same texture, the dry unit weight increased with the increase in the solution content, and the compressive strength increased as the dry unit weight increased. Meanwhile, as the median diameter decreased, i.e., moving from loamy sand to loam, the dry unit weight decreased, whereas the compressive strength increased. The dry unit weight and the compressive strength of the specimens mixed with NaOH 0.25 M were lower than that of the specimens mixed with deionized water for all textures. Decreasing the dry unit weight is thought to be one of the factors for the reduced strength of the test specimens mixed with NaOH 0.25 M. Furthermore, it is noted that the dry unit weight decreased as the median diameter decreased, whereas the compressive strength did not decrease significantly.
In the case of Soil B mixed with deionized water, similar to the results for Soil A, for soils with the same texture, the strength increased as the dry unit weight increased. In addition, the dry unit weight of the specimens of loamy sand and sandy loam showed almost the same value, but the compressive strength was higher in sandy loam, which has a smaller median diameter and more particles per unit area than loamy sand. It was also notable that the compressive strength results were increased by 1.8 times by making particles finer. Compared to the compressive strength of Soil A, the overall strength of Soil B tended to be higher, owing to substantial differences in mineral composition. Meanwhile, unlike Soil A, the compressive strength of all textures was higher when mixed with NaOH 0.25 M than deionized water. This result was also influenced by clay minerals. The minimum requirements specified in most current standards range from 1.3 to 2 MPa [
22]. However, Soil A, which lacks clay minerals, does not meet the compressive strength standard since its compressive strength is below 1 MPa. In contrast, Soil B, which contains clay minerals, had a compressive strength of less than 1.3 MPa before the particle size distribution adjustment; however, grinding the particles and adding the NaOH, which has the particle dispersion effect, could modify it to attain a compressive strength of approximately 2.0 MPa. It will be discussed in
Section 3.4.
3.3. Effects of Dry Unit Weight and Particle Size Distribution
Figure 6 shows the relationship between the dry unit weight and compressive strength of specimens made from Soils A and B using deionized water or NaOH 0.25 M as the mixing solution.
The dry unit weight and compressive strength have a linear proportional relation in the same texture and mixing solution. This trend is due to the increase in frictional resistance between particles as the porosity of the specimen decreases, whereas the compressive strength of the specimens with different textures is influenced by the number of particles per unit area as well as porosity. When the number of particles per unit area increases, the number of points where interparticle forces act increases. Hence, as the median diameter decreased, the compressive strength of the specimens increased even though the dry unit weight decreased. Consequently, the results shown in
Figure 6 represent the effects of the particle size distribution and the dry unit weight on the compressive strength, making it difficult to analyze the influence of only one parameter.
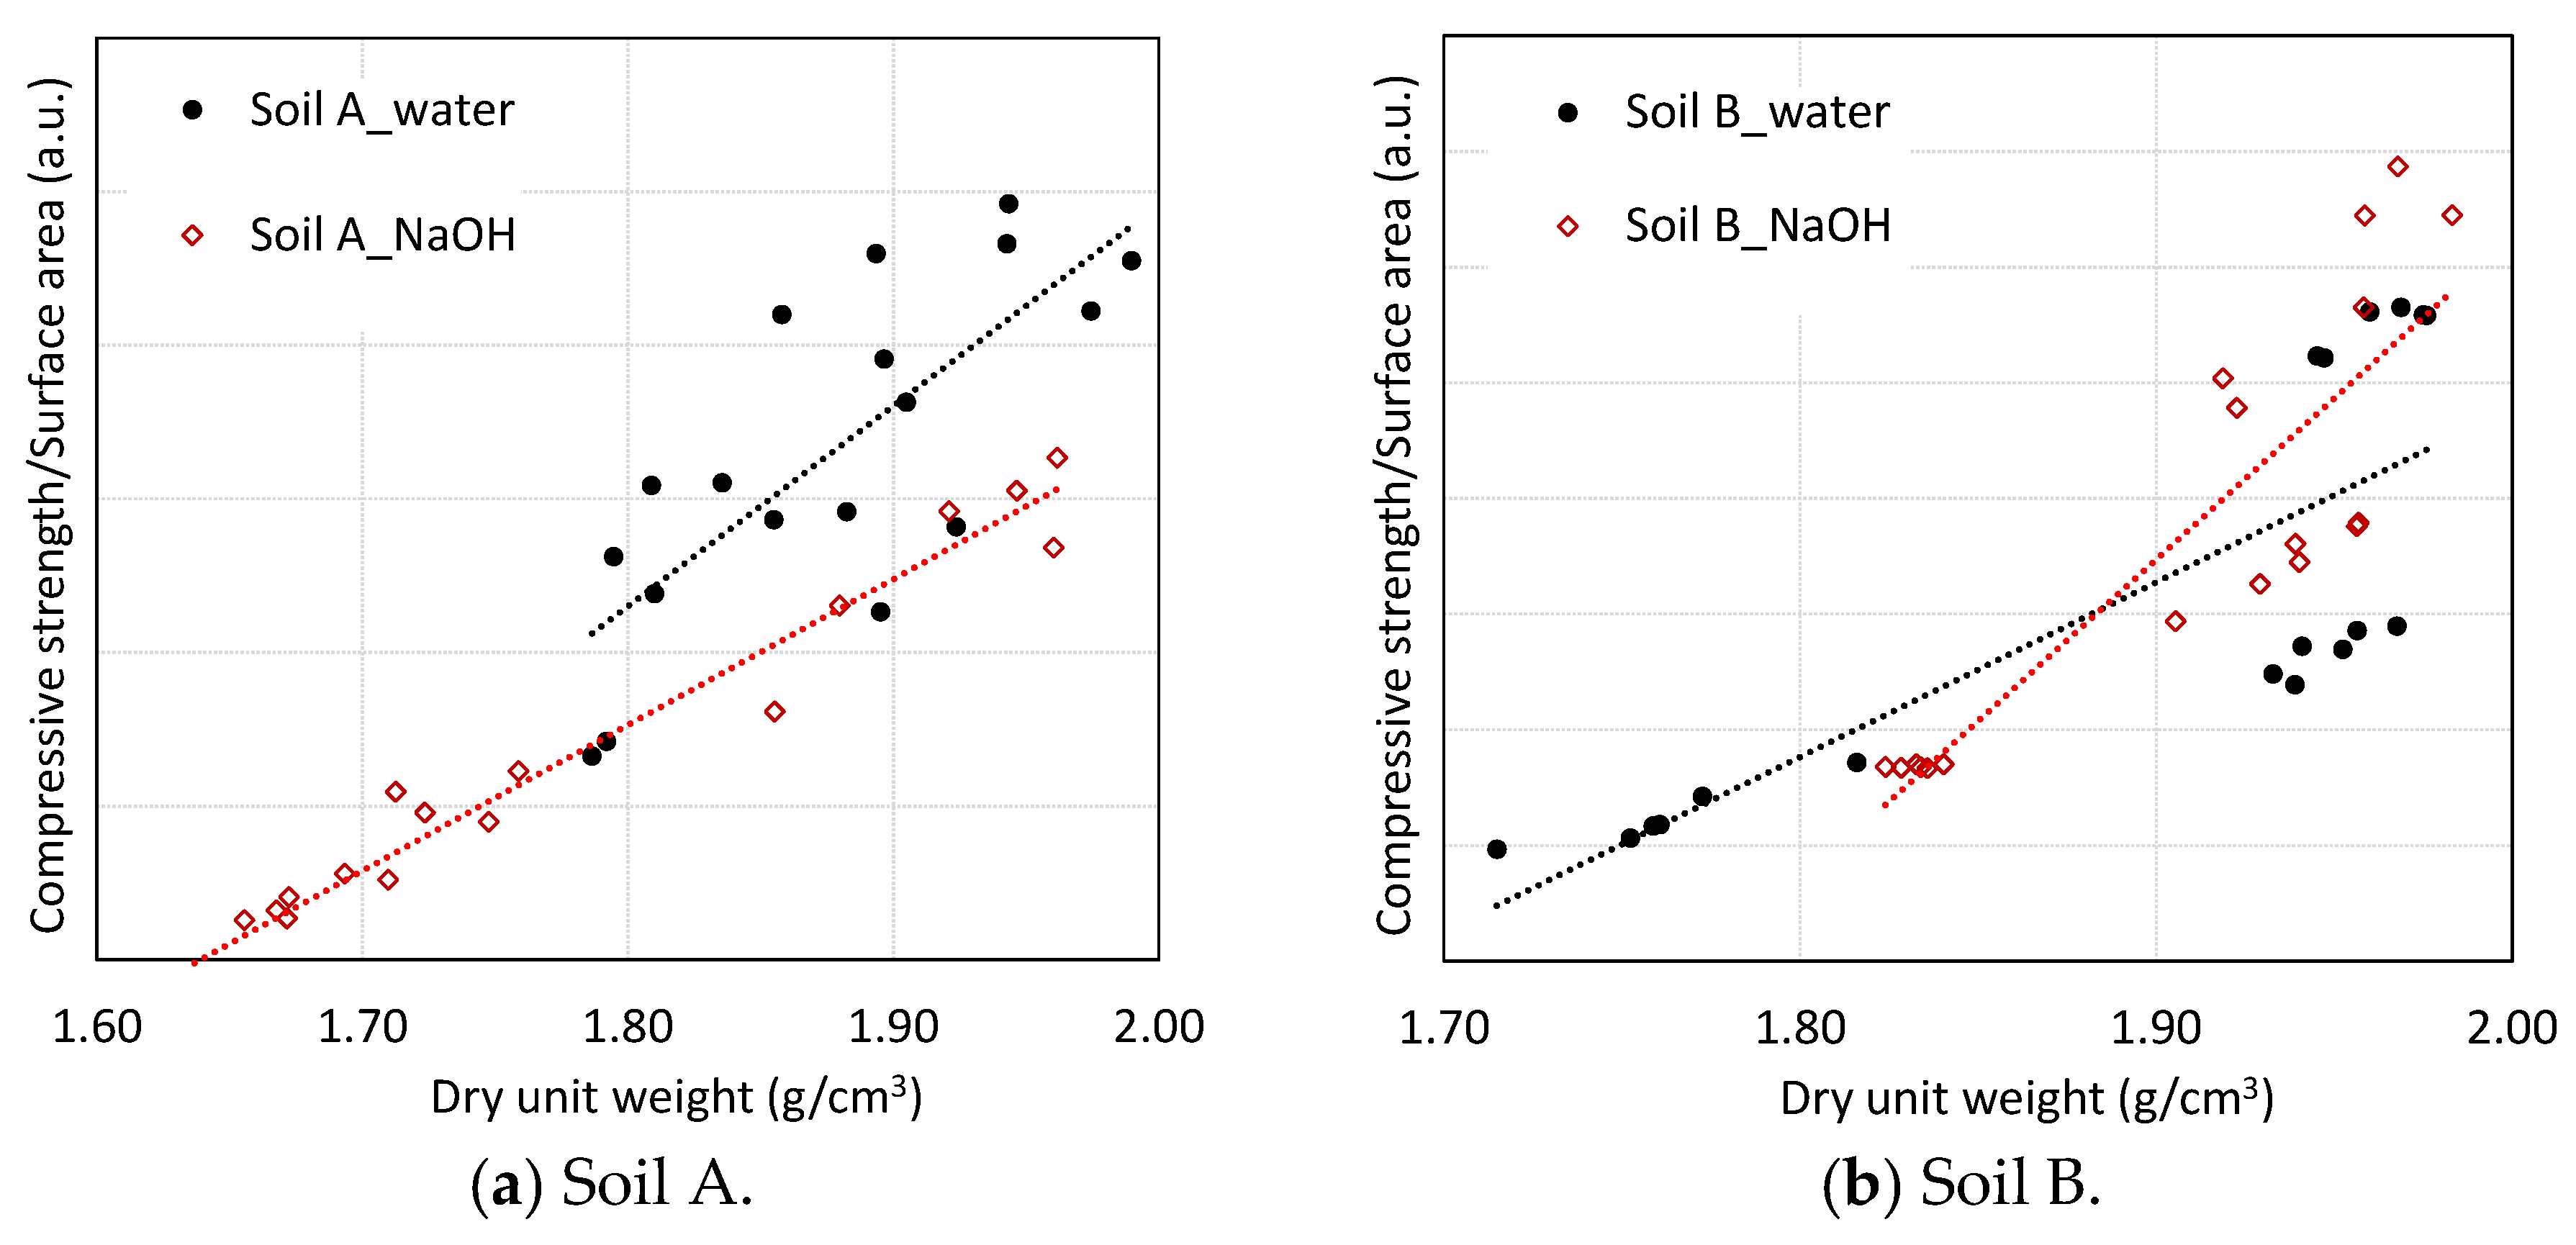
Therefore, to analyze the relationship between dry unit weight and compressive strength without considering the effect of the particle size distribution, the compressive strength is divided by specific surface area. The results are shown in
Figure 7. Compressive strength, which removed the effect of specific surface area, had a linearly proportional relationship with the dry unit weight regardless of their textures.
3.4. Effect of Clay Minerals and pH of Mixing Solution
From the results of the compressive strength experiment, it was found that the influence of changes in the pH of the mixing solution on the compressive strength of soil solidification differs depending on the presence of clay minerals that act as binders. Clay minerals connect large particles, such as sand, within the soil solidification. However, even in the soil, before mixing, clay minerals with fine particle sizes are already attached to the larger particles, like sand, or are aggregated together. For the reasons described above, there is concern that clay minerals may not properly contribute to improving the strength within the solidification. It is necessary to disperse the clay minerals for them to function as binders properly. In the case of Soil B, including clay minerals, the compressive strength was improved due to the dispersion effect of previously agglomerated particles by mixing NaOH 0.25 M. In a basic environment, the surface of clay minerals becomes more negatively charged, leading to the dispersion of clay minerals that were previously aggregated or adhered to larger particles. In the case of Soil A, which does not contain clay minerals, it was found that mixing with NaOH 0.25 M lowered the dry unit weight, which also had a negative effect on the compressive strength of the soil solidification. Soil A was not agglomerated even before the mixing process, so it is thought that the dispersion effect of particles due to changes in the pH of the mixing solution did not lead to an improvement in strength. Furthermore, it was noted that as the particle size decreased, the dry unit weight decreased due to the dispersion effect. This is because the coarser the particles, the fewer particles per unit area and the smaller the surface area.
4. Prediction Value of the Tensile Strength of Soil Solidification
4.1. Relationship Between Compressive Strength and Tensile Strength of Soil Solidification
According to Ávila et al., in the case of rammed earth, the tensile strength can be considered to be approximately 10% of the compressive strength [
10]. Furthermore, Araki et al. mentioned that the tensile strength of soil solidification is equivalent to 5.0 to 12.5% of the compressive strength at the same water content [
23]. Even if the tensile strength is the same, the compressive strength differs depending on the internal friction angle. The relationship between compressive strength and tensile strength is expressed in Equation (1).
σc: unconfined compressive strength, σt: tensile strength.
4.2. Prediction Equation for Tensile Strength of Soil Solidification
The tensile strength of the soil solidifications used in the experiments was calculated by substituting the particle size distribution of Soil A and Soil B and the packing fraction of soil solidifications into the prediction equation proposed by Oh et al., and the formula is expressed in Equation (2) [
24].
average coordination number, Hij: contact force, Pi: packing fraction of particles with radius ri of the cross-section, ri: radius.
Here, the contact force H
ij between particles with radii r
i and r
j can be expressed as Equation (3) [
24]. This equation only reflects the capillary force and does not consider the cohesion caused by clay minerals.
N: the number of particles per unit area, Nj: the number of particles with radius rj per unit area, : surface tension, , : the radii of curvature, half-filling angle, θ: solid–liquid contact angle.
The conditions for each parameter used in the calculations were assumed to be the same as the conditions for the soil solidification used in the experiment. The types of mixed water used were pure water and NaOH 0.25 M. Assuming that the water was dried in an environment with a relative humidity of 60% and the water evaporated and the concentration of NaOH in the pore water increased, the molar concentration of the pore water was assumed to be 5 M. The surface tension of the solution and the Van’t Hoff factor at that time were 0.0788 N/m and 2, respectively. The distance between particles was assumed to be 0, because particles must be in complete contact with each other to transmit force as a structural material. The particle size distribution of Soil A and Soil B is shown in
Figure 3. The relationship between the packing ratio and the average coordination number is shown in Equation (4) [
24].
: variable characterizing particle size distribution.
Here, the closest packing fraction and the average coordination number for an arbitrary particle size distribution were calculated using Equations (5) and (6) [
25,
26].
): packing fraction in a virtual sphere around a particle with radius ri that is densely surrounded by particles with radius rj.
: average value of the cube of the radius of all particles.
: average value of the square of the radius of all particles.
): maximum number of particles with radius rj that come into contact with particles with radius ri.
Table 5 shows the parameter conditions used in the equation.
4.3. Results of Tensile Strength by Capillary Force
Figure 8a shows the relationship between the predicted tensile strength by capillary force of the soil solidifications and the compressive strength obtained from the experiment in
Section 3. In the case of Soil A, the predicted tensile strengths were higher than 1/10 of the compressive strengths. One of the reasons is that the shape of the soil particles was assumed to be spherical. Since actual soil particles are not completely spherical, the average coordination number is expected to be smaller than the calculated value. In addition, in the calculations, it was assumed that the contact angle was 0°, but in reality, the contact angle is considered to be higher than 0°. The capillary force decreases as the contact angle increases, so the tensile strength decreases (Equation (3)). Moreover, failure occurs at the weakest point because the soil solidifications are not homogeneous. Meanwhile, the theoretical equation assumed homogeneous states and weak points were not considered. Consequently, the predicted strength was higher than the real strength.
Despite the tensile strength prediction model assuming an ideal situation, in most cases of Soil B, the experimental compressive strengths were higher than ten times the predicted tensile strength. As mentioned above, the calculation results of the tensile strength considered only capillary forces as interparticle forces. However, Soil B contained vermiculite, a clay mineral, and was expected to exert interparticle forces other than capillary forces.
As a result of deriving the relationship between the tensile strength attributed to the capillary force of soil particles and the compressive strength based on Soil A, which does not contain clay minerals, it was found that the compressive strength was approximately 4.3217 times the tensile strength attributed to the capillary force, as shown by the yellow line in
Figure 8b. When the value obtained by excluding 4.3217 times the tensile strength attributed to the capillary force from the compressive strength result of Soil B was referred to the cohesion due to clay minerals, the average cohesion of Soil B was 918.0288 kPa. The result is shown in
Figure 8b. This result shows that in the case of Soil B, the cohesion owing to vermiculite was greater than the strength increase effect due to the control of particle size distribution through grinding.
5. Water Resistance of Soil
Clay minerals exert cohesion and increase interparticle forces. However, when added in excess of 20%, it is judged to be inappropriate for use as a structural material from the viewpoint of workability and dimensional stability [
27,
28].
Soil C, which contains a large amount of fine clay, has large drying shrinkage, making it impossible to ensure dimensional stability, and is highly sticky, resulting in poor workability. Therefore, it cannot be packed in the mold properly. In light of these limitations, this section proposes using clay-rich soil, like Soil C, not as a structural material but as a coating material. Water resistance, one of the characteristics a coating material must have, was evaluated using Soil C.
Soil particles are solidified by physical bonds mediated by water, so if they come into contact with large amounts of water for a long time, the distance between the particles increases, and the bonds break. Stabilizers such as cement or hydraulic lime are usually added to enhance water resistance; Ca
2+ released from cement or hydraulic lime enhances cohesion and increases the pH, promoting the dissolution of silica and alumina in clay minerals. Moreover, the dissolved silica and alumina react with Ca
2+ to form calcium silicate hydrate and calcium aluminate hydrate, which act as cohesive between particles and increase interparticle forces [
29,
30].
Meanwhile, for small particles (clay minerals and clay with particle sizes of 2–5 µm or smaller), where the van der Waals force exceeds gravity, the distance between particles decreases as they dry, causing them to stick together or to adhere to larger particles. Therefore, if the soil contains many clay minerals with small particle sizes, these clay minerals exist in an agglomerated state, attached to silt or sand. As mentioned in
Section 3.4, in a basic environment, the surface of clay minerals becomes more negatively charged, so clay minerals that are agglomerated or attached to large particles become dispersed by repulsion. Soil C also contains clay minerals like montmorillonite, which exhibit stronger van der Waals forces than gravity and carry charges on their surfaces, remaining in an agglomerated state when dry. Therefore, it is necessary to disperse the agglomerated particles to improve the uniformity of the material as a coating material. To disperse particles more efficiently, the pH of the mixing solution was adjusted to take advantage of the electrical properties of the particle surface. Test specimens were prepared using deionized water and NaOH 0.25 M as the mixing solution. NaOH 0.25 M was prepared by adding water to 10 g of solid NaOH (97% purity) to make 1 L of aqueous solution. The pH of the solution was 13.17.
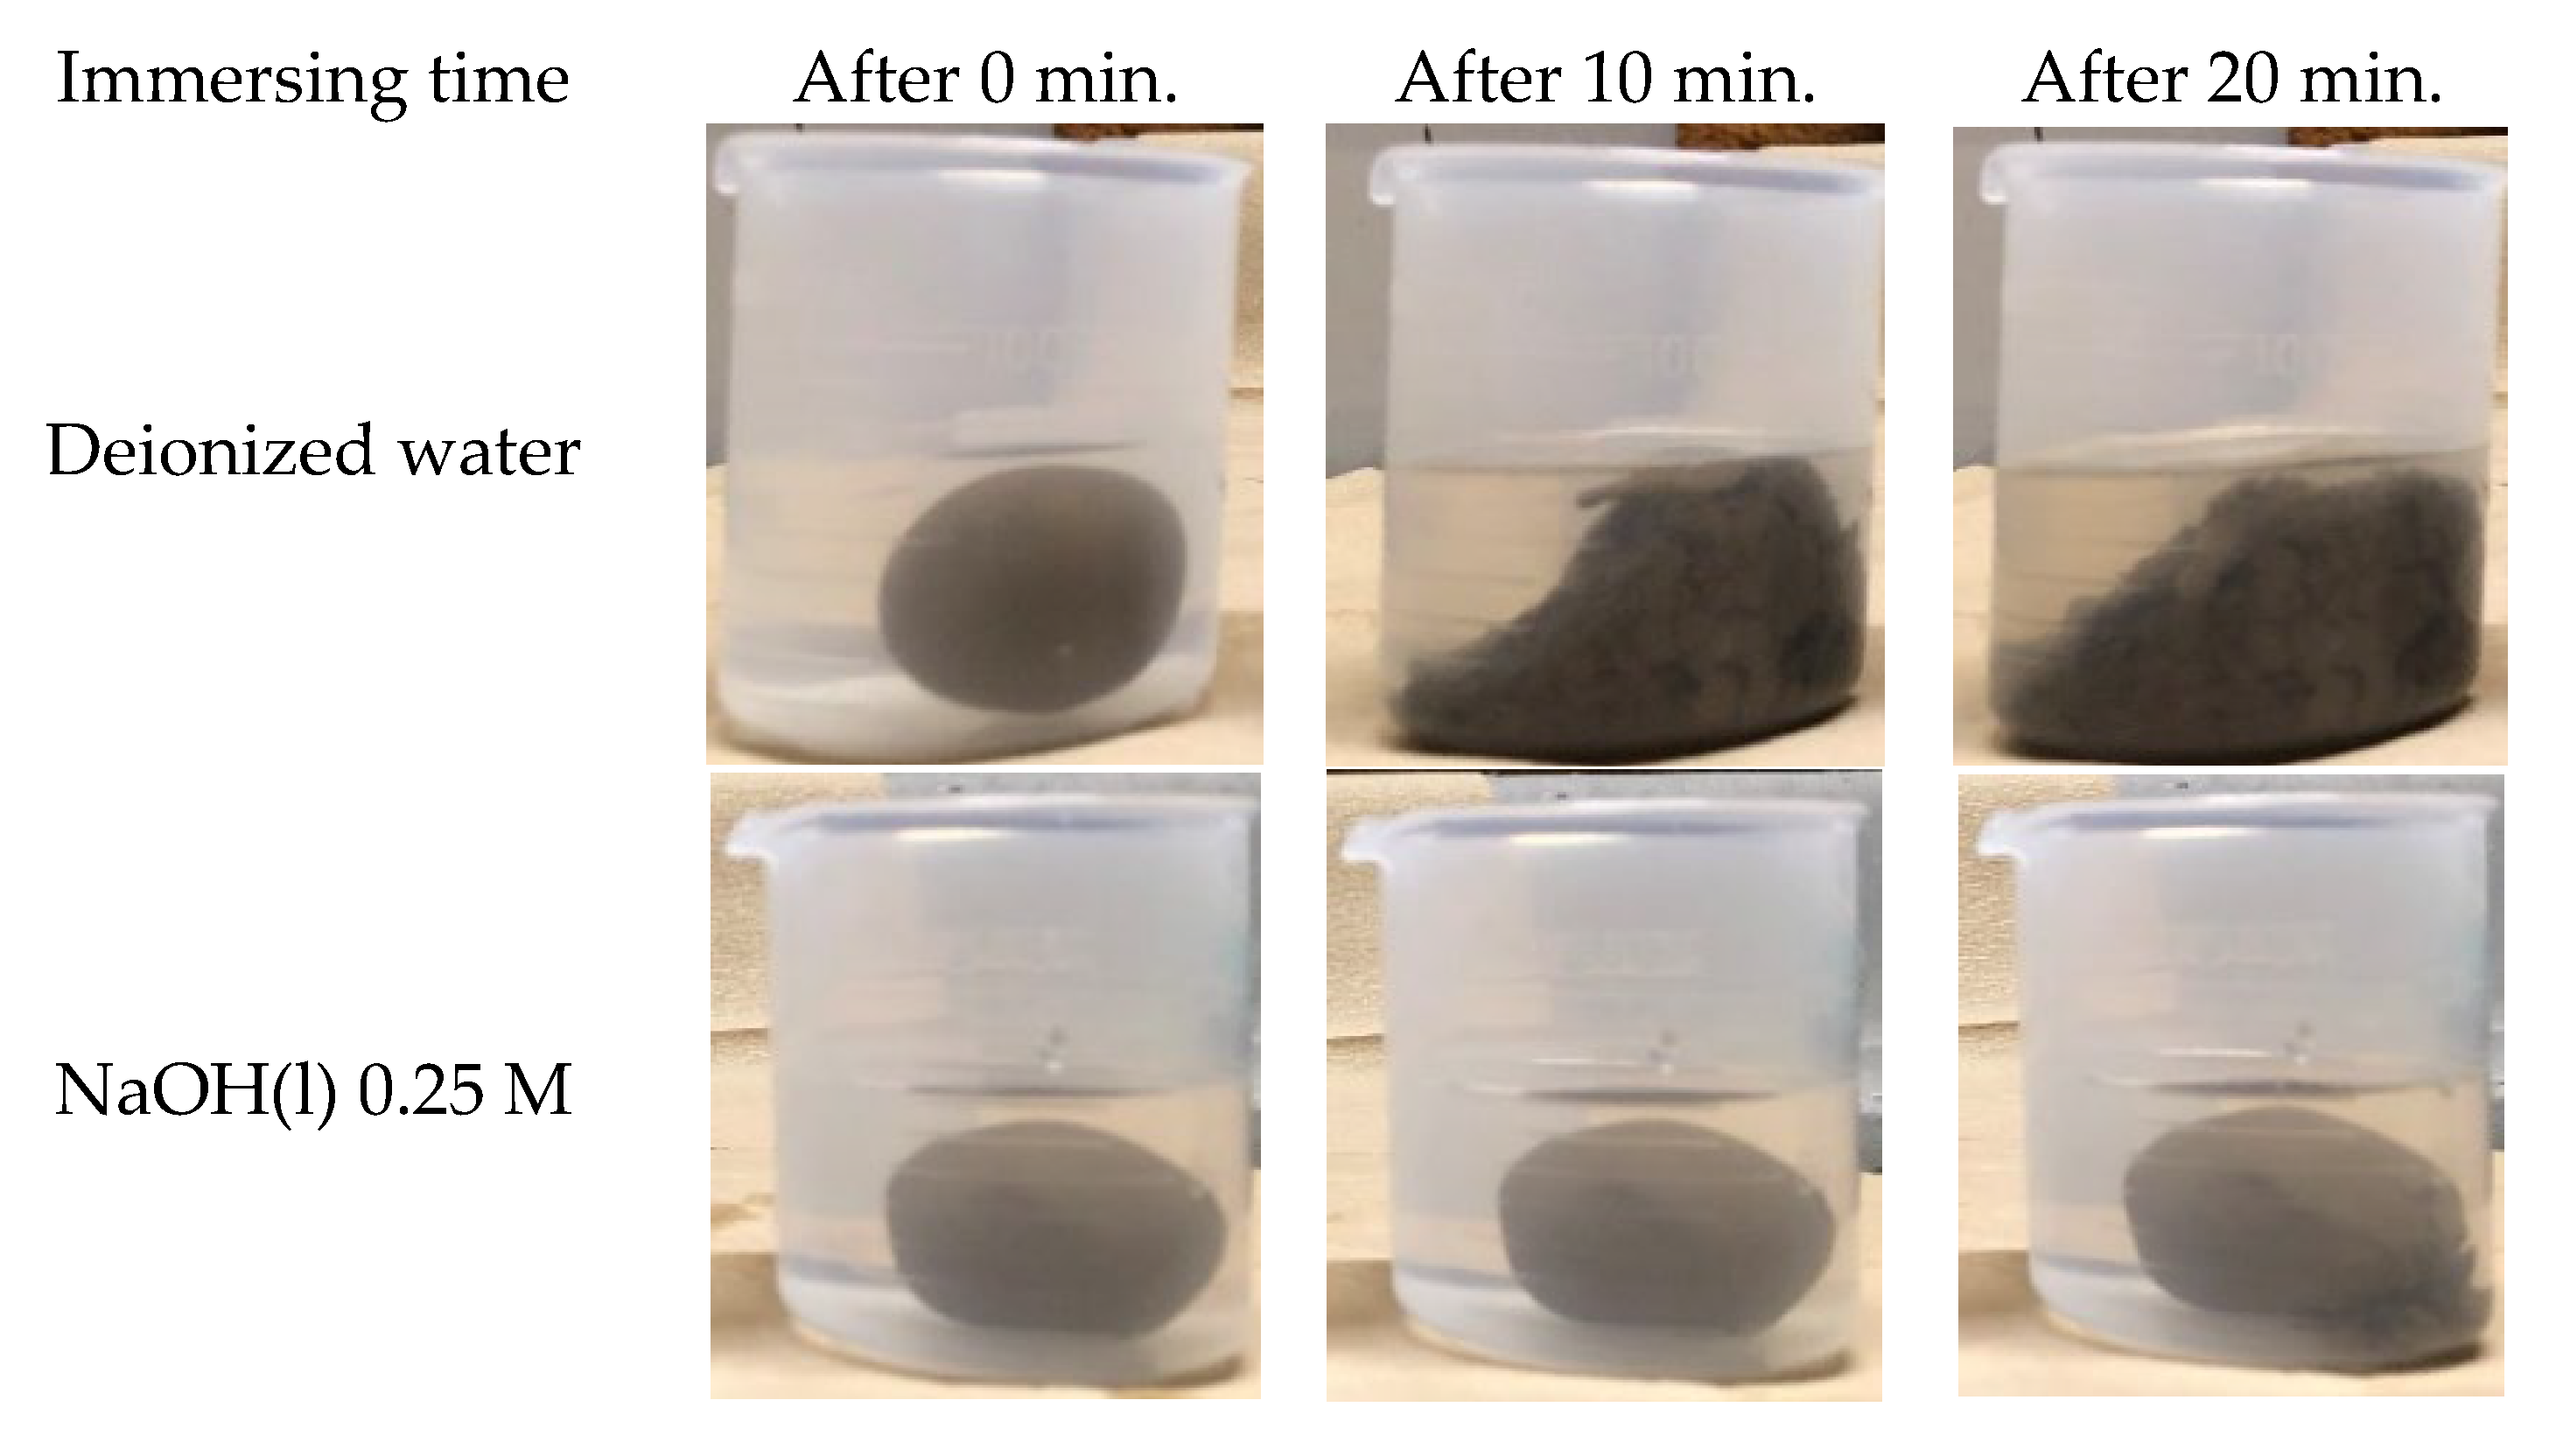
Table 6 shows the proportions of the specimens. Spherical test specimens with an approximate 3 cm diameter were prepared by mixing Soil C with deionized water or NaOH 0.25 M. After curing in a chamber for 7 days, the samples were immersed in water, and the time taken for bond disintegration was measured. The results are shown in
Figure 9.
The test specimen using NaOH 0.25 M as the mixing solution (hereinafter referred to as C0_N) took a longer time to break the bonds between soil particles in water than the specimen using deionized water as the mixing solution (hereinafter referred to as C0_W). The air began to come out of the C0_W specimen approximately 5 min after immersion in water, and it took 17 min for the specimen to collapse completely. In contrast, for C0_N, it took 18 min for water to penetrate into the test specimen and air to start coming out. Even after 30 min, it had not completely collapsed and a solid lump remained inside. The particles in the soil, particularly clay minerals with a large specific surface area and surface charge, react to a high-pH environment by intensifying the negative charge on their surfaces, causing them not to agglomerate in the same manner as previously mentioned. As a result, the enhanced interparticle forces from the dispersion of clay minerals hindered water penetration.
6. Application to Semi-Permanent Housing for Forcibly Displaced People
6.1. Case Study Application
This chapter describes the application of earthen housing, using compressed earth blocks, to semi-permanent housing for forcibly displaced people in the Bidibidi camp in the Yumbe region of northwestern Uganda.
Uganda is one of the countries most proactive in accepting refugees. According to the UNHCR, as of June 2024, there were 1.70 million refugees and asylum seekers residing in Uganda [
31]. The Bidibidi camp is the largest refugee camp in Uganda, where approximately 200,000 displaced people reside [
31].
The type of soil widespread throughout the Yumbe District is ferralitic soil, an acidic soil [
32]. Acidic soil may be agglomerated in the dry state. The results of
Section 3.4 and
Section 5 showed that a basic aqueous solution was effective as a dispersant for agglomerated soil. This study proposes utilizing wood ash to improve the strength and water resistance of the soil. According to Siddique [
33], wood ash contains 5–30% carbon, 7–33% calcium, 3–4% potassium, 1–2% magnesium, and trace amounts of manganese, phosphorus, and sodium. When water is passed through wood ash, highly soluble ions such as potassium and sodium are dissolved in the water, increasing the number of hydroxide ions, and the water becomes a basic solution. A report by the World Bank Group [
34] states that most households in the Yumbe region use firewood for cooking. When clay is used as a coating material, utilizing rainwater that has filtered through wood ash as the mixing solution extends the time it takes for water to break the bonds, consequently enhancing water resistance. This characteristic is thought to improve the durability of earthen housing built in the Yumbe region, which receives a lot of precipitation. Clay-based soil with a high cohesive strength similar to this coating material could also be used for the joint that connects the blocks.
The number of blocks required to build a house with the size of 4 m × 3 m × 2.3 m, having walls with a thickness of 0.3 m, using standard size (290 mm × 140 mm × 90 mm) compressed earth blocks is about 2100 blocks, which can be produced by two workers in 2–3 days, assuming that 800 pieces can be made per day. However, as shown in
Table 7, workers are needed not only to produce the blocks but also to mix the soil and move the blocks. Excluding quality control and tractor operation, 5–6 people can produce 2100 compressed earth blocks in 2–3 days. About 84% of the people at the target campsite are women and children, and about 3% are elderly [
35]. To increase constructability, it is thought that women and children can also perform tasks such as receiving the blocks and sifting the soil.
In addition, since compressed earth blocks generally require a seven-day drying period, it is beneficial to manufacture them in advance to shorten the construction timeline. Once cured, the compressed earth blocks are stacked. The maximum height for stacking in a single day typically ranges from 1.2 to 1.5 m, so this task is completed over two days. Assuming the roof is also constructed, it is estimated that two to three people will need three days to finish it. The total work period from procuring the soil to building the house is approximately 13 days, which includes three days for block production, seven days for curing, and three days for house construction. Five to six workers are necessary for block production, while three workers are needed for house construction. To increase work efficiency, if the members of two to three houses share the roles and build the houses, the time wasted during the curing period can be minimized. Finally, since compressed earth blocks are not chemically bonded, they are easy to dismantle, and construction waste can also be minimized.
6.2. Economic Feasibility
Construction costs are divided into material, labor, and expenses. In this case study, it was assumed that material costs (soil and wood ash) and labor costs (building it themselves) were zero, and only the cost of the compaction machine was considered as construction costs. The cost of a machine that does not require electricity and can be procured in Uganda is about USD 500–800, and since it is only used for three days per house, it is considered possible to share it within the campsite. For example, building 20 houses costs only USD 25–40 per machine. This is lower than the cost of a tent (USD 420), excluding transportation costs.


