Article

Road Weather Forecasts in Norway with the METRo Model

1
Drones and Autonomous Systems, Norwegian Research Centre (NORCE), 9294 Tromsø, Norway
2
Department of Microsystems, University of South-Eastern Norway (USN), 3184 Borre, Norway
3
Fraunhofer Institute for Wind Energy and Energy System Technology (IWES), 27572 Bremerhaven, Germany
4
Geophysical Institute, University of Bergen (UiB), 5007 Bergen, Norway
5
Bjerknes Centre for Climate Research, 5007 Bergen, Norway
6
TracSense AS, 0164 Oslo, Norway
7
Climate Risk, Norwegian Research Centre (NORCE), 5838 Bergen, Norway
*
Author to whom correspondence should be addressed.
Meteorology 2025, 4(2), 16; https://doi.org/10.3390/meteorology4020016
Submission received: 15 April 2025 / Revised: 2 June 2025 / Accepted: 11 June 2025 / Published: 17 June 2025

Abstract

:
We present a model evaluation of road weather forecasts in Norway with the METRo model in a quasi-operational setting. The road weather forecasts are initialized with measurements made by road weather stations and driven by mesoscale weather forecast data from the Norwegian Meteorological Institute. One important source of hazardous driving conditions in Norway are freezing road-surface temperatures. We quantify the skill of our model setup to predict such conditions by computing the hit rates and false-alarm rates for incidences of freezing temperatures, relative to the climatological rates of occurrence. The METRo forecasts consistently add skill in wintertime and the crucial transitional seasons of spring and fall. Our study illustrates a successful proof-of-concept for novel, operational road weather forecasts in Norway, that could easily be realized with an open-source prediction model and readily available input data.

1. Introduction

Road weather forecasting is a special application of weather forecasting, which aims to predict meteorological conditions on a road network [1]. The most important variables in road weather forecasts consist of the road-surface temperature, near-surface temperature, near-surface humidity, and the presence of precipitation and water on the road. Hazardous driving conditions, such as icy roads, can be identified and predicted based on these variables, and ultimately applied for traffic safety, road maintenance and services, and driver warning systems. In Norway, and Nordic countries in general, these applications are particularly important during winter where half of the yearly 27,000 road and 50,000 pedestrian injuries in Finland, Norway, and Sweden can be traced back to slippery road and walkway conditions [2]. In addition, such forecasts will become even more important with the ongoing implementation of driving assistance systems in autonomously driving cars [3].
State-of-the-art road weather forecast systems use the output from numerical weather prediction models to compute the present and near-future road weather, from a few minutes to a few days ahead [4]. During the last few decades, several road weather models (RWMs) were developed and are now used operationally by weather agencies and road-service authorities. Two prominent European examples are the Royal Netherlands Meteorological Institute’s RWM [5] and the Finnish Meteorological Institute’s RWM [6], which both predict road-surface temperatures and surface conditions such as road friction. Their performance and forecast quality were compared in a recent study [4]. Both models are one-dimensional heat balance models that use predicted meteorological surface variables from mesoscale numerical weather prediction models, interpolated onto specific road points. These models differ mainly in the forecast initialization procedure, which is explained in detail in [4,7,8].
METRo (Model of the Environment and Temperature of Roads) is another widely used road weather forecast model, which has been developed in Canada in the late 1990s [8]. In 2006, the METRo code was publicly released under the GPL license, and since then, the model has been adapted for operational use in several countries, for example, in the Czech Republic (METRo-CZ) [9]. The authors evaluated the model with data from 25 road weather stations, demonstrating the crucial role of the radiation flux forecast for the prediction of road-surface temperatures. Later, Sokol et al. [10] presented an ensemble technique for road-surface temperature forecasting, which allows for the estimation of forecast uncertainty and probabilistic forecasts. The METRo model was also used in the work of Djemal et al. [11] for surface temperature forecasts at a military airport in Praha. In addition, the METRo model was integrated into a winter maintenance weather forecast system that covers Finland, Sweden, and Russia [12] as well as the United States [13]. For the 2022 winter Olympic demonstration station (Beijing Huilongguan station), road-surface temperature prediction was tested based on the METRo model [14].
In Norway, the platform Vegvær [15] is also built on the METRo model and is seen as the current benchmark for localized road weather forecasting. Vegvær’s adaptive forecasting methods have been utilized to provide actionable insights for road maintenance teams. Comparable systems, such as the Finnish Meteorological Institute’s RWM [6] and the UK Met Office’s OpenRoad [16], have similarly demonstrated the effectiveness of such solutions.
Recent studies have highlighted the growing role of advanced numerical weather models and ensemble-based approaches in improving road weather predictions. For instance, Kangas et al. [17] demonstrated the effectiveness of machine learning techniques in refining predictions of freezing road conditions across Northern Europe. Similarly, a 2020 study by Carillo et al. [18] showcased the integration of localized sensor and camera networks with weather data to enhance the accuracy of road-surface temperature forecasts in Finland and Sweden. These developments underscore the potential of using multi-source data fusion for road weather modeling.
These studies also emphasize the importance of uncertainty quantification in road weather forecasting. Advances in ensemble forecasting techniques, such as those implemented by Sokol et al. [19], allow for more reliable predictions by accounting for variations in input data and model physics. Other studies explored the role of vehicle-mounted [20,21] and mobile [22] sensors in enhancing real-time data acquisition for road weather models, offering a promising avenue for improving prediction accuracy in dynamic environments.
With Vegvær, the METRo has only been recently introduced for road weather forecasts in Norway. The heterogeneous topography of Norway, with its long coastline and significant south–north span, presents a challenge for numerical weather prediction. Hence, we analyzed the applicability of the METRo model for operational road weather forecasting in Norway by initializing the model with road weather observations from the Norwegian road authority (Statens Vegvesen, SVV). In conjunction with the operational mesoscale forecast from the Norwegian Meteorological Institute [23], we quantify the effectiveness in predicting hazardous conditions, such as freezing road-surface temperatures. Our approach builds on recent advancements exemplified by Vegvær and similar platforms, contributing to the development of a robust framework for highly accurate and localized road weather predictions.

2. METRo Overview

2.1. Physics Module

METRo was developed by the Canadian weather agency in 1999 [8] for operational road weather forecasts up to 24 h in advance at specified, fixed positions within a road network. Its main component is a surface energy balance module, estimating the present and predicting future road-surface temperatures by calculating surface energy fluxes. The energy fluxes taken into consideration are shortwave and longwave radiation, latent and sensible heat flux, and anthropogenic heat flux (for example, friction between the road-surface and passing cars).
METRo has two further modules that allow for a more realistic physical modeling of the meteorological conditions at the road level. The first module is a vertical heat diffusion module, which simulates one-dimensional heat transfer between the surface, different road layers, and the deep soil. For this module, the vertical build-up of the road can be specified in terms of layers of different materials (such as asphalt, concrete, or rock) and depth. The second module tracks the accumulation of water on the road-surface, as a result of precipitation, phase changes (freezing and thawing), and water run-off. There are separate reservoirs for liquid and frozen water, allowing for transfer from one reservoir to the other.

2.2. Input and Output Variables

To initialize the METRo model and its physics modules, initial data such as surface, sub-surface, and near-surface air temperatures, humidity, precipitation, and wind speed are required (see Section 3.1 for details). In our setup, these initial conditions are derived from in situ measurements at SVV road weather stations (see Section 4 for details).
During the model simulation, we need to prescribe atmospheric boundary conditions that describe future external forcing (see Section 3.2 for details). These boundary conditions include variables like wind speed, air temperature, humidity, cloud cover, and precipitation. Variables such as the road-surface temperature are, at this stage, not externally prescribed any longer, but calculated by METRo.
To apply bias correction to road-surface temperatures in the preprocessing phase, METRo requires some forecast data to overlap in time with the observational data. In our configuration, the forecast data overlap in time with the observation data for the previous 4 h, as illustrated in Figure 1. For example, if the desired road forecast is for the next 24 h, forecast data starting from 4 h before the initial time have to be used.
The model output contains all variables needed for initialization and forcing: surface energy fluxes, accumulated water on the road, and hazard warnings that are derived from meteorological conditions, such as freezing rain or melting snow.

3. Technical Implementation and Data Flow

The road weather station data (observations) are obtained from the Frost API (Application Programming Interface), which is maintained by the Norwegian Meteorological Institute (MET). The data can be requested internally through an API. The forecast data can be requested by the internal Forecast API, which downloads the weather forecasts from the Thredds API (also maintained by MET) and converts the parameters to those needed by METRo. Finally, the model API uses the METRo model and data from the stations and Forecast API to calculate the road weather forecast. A general overview of the system and data flow is illustrated in Figure 2.

3.1. Observational Data

We used observations of the last 4 h from SVV road weather stations to initialize the METRo model. Observations were obtained from the Frost API, which is maintained by MET. During data acquisition, the model API is provided with data types, site information, and observation data. The observational data are scraped and stored in a database that is processed to match the format expected by the METRo model.
Sometimes, the observational time series are incomplete, especially for subsurface temperature, which currently is available at only 12 stations. For these cases, we use the following analytic estimations for missing values:
  • Subsurface temperature = Surface temperature minus 2 °C;
  • Surface temperature = Two-meter air temperature;
  • Road condition = Dry, except if precipitation rate > 0.5 mm in the last 2 h, yielding initialization as wet.

3.2. Forecast Data

The Forecast API provides the weather forecast to the model API, which is used as initial and boundary conditions for the METRo model. The list of forecast parameters used are described in Table 1.
The list of parameters used by the METRo model can be found on Table 2.
The conversion of variables from THREDDS API to METRo is performed as described in Table 3.
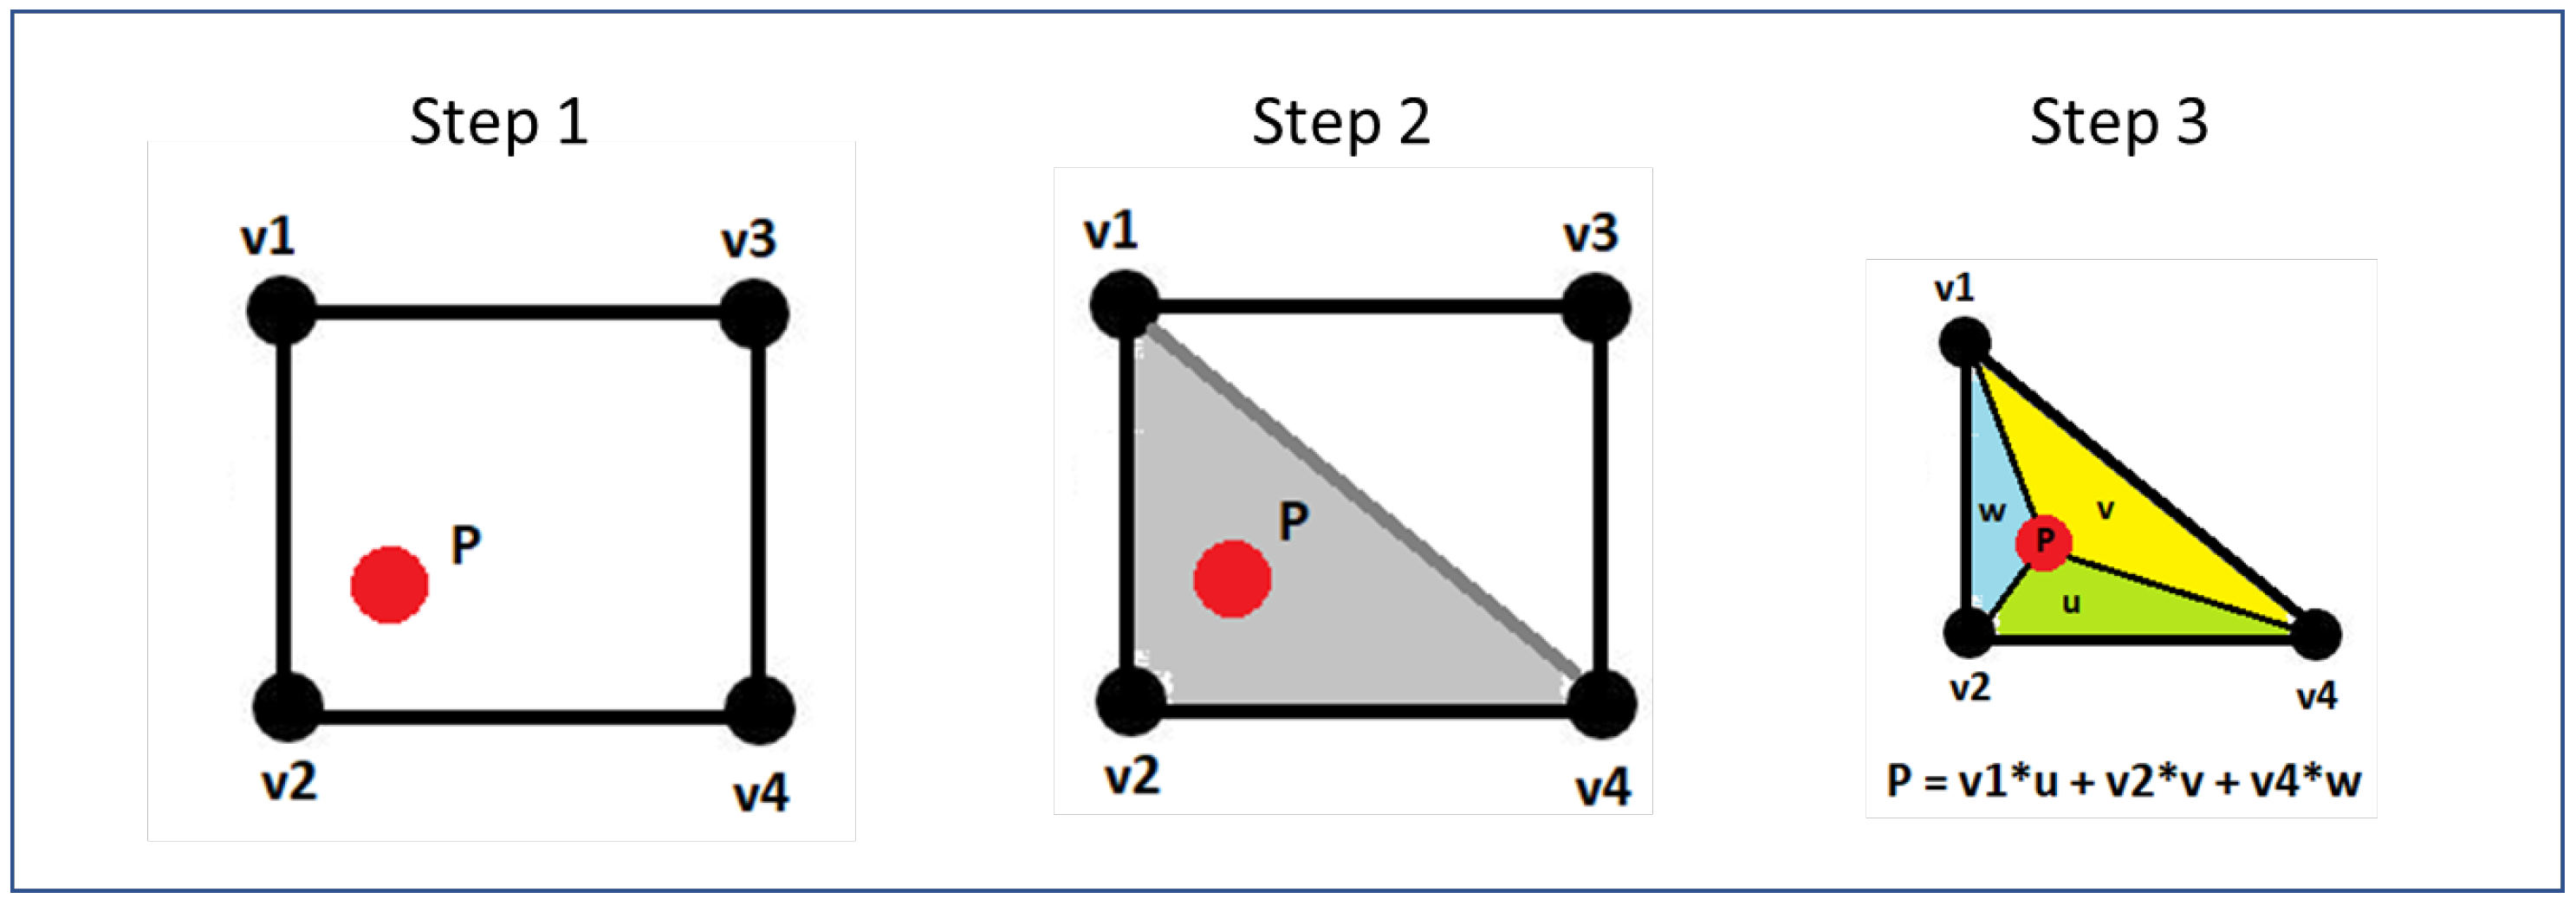
Given that the data from THREDDS API are spatially discretized in a horizontal grid spacing of 1 × 1 km, we use the following steps to estimate the values of the parameters at the locations in METRo:
  • Grid identification: Based on the input coordinate (red dot P in Figure 3), the algorithm identifies the closest coordinates of the horizontal grid of the THREDDS API data surrounding the red dot (v1, v2, v3, v4) to create a polygon.
  • Smallest triangle: The algorithm creates the vertices and finds the triangle that has the minimum distance of the point P to its vertices.
  • Barycentric interpolation: We use the barycentric interpolation [24] to interpolate the vertex data across the surface of the triangle. Using the three sub-areas (u, v, and w), the algorithm calculates the sum of the multiplication of the vertices with the sub-areas.

3.3. Model API

The model API receives the data from the Forecast API and station API and runs them through the METRo road weather model yielding the road weather forecast as output. Detailed information about the input and output of the METRo model is given in the model documentation on the METRo homepage (https://framagit.org/metroprojects/metro, accessed on 15 April 2025) and by Crevier and Delage [8]. The model API requests data from the other APIs and prepares an input file to the METRo model that consists of a timestamped list of observation and forecast data for all the parameters. The main output that we present here is the road-surface temperature (st). Another important output parameter of the METRo model is the road condition (rc), indicating if the road conditions will be dry, wet, ice/snow, mix water/snow, dew, melting snow, frost, or icy rain.

4. Experiment Design

Using the model setup as outlined above, our experiment design aims to recreate the conditions of a routine road weather service based on our METRo configuration. We initialized 24 h road weather forecasts twice a day, at 4 and 16 local time (LT) at the locations of 27 SVV road weather stations over the course of the year 2021. Given that we performed these forecasts retrospectively, we can use SVV road weather measurements to evaluate the model performance (see Section 4).
The 27 SVV road weather stations used in our study take measurements of near-surface temperature and humidity, road-surface temperature, and precipitation. The geographical coordinates of each station, station ID, and altitude above sea level are listed in Table 4. Not all stations provided usable measurements at every hour of the year, with measurement time series regularly containing missing values. We applied a conservative selection for the road weather forecasts used in our evaluation and rejected all forecasts with any missing values in the reference measurement time series. This leaves us with a total of 9586 road weather forecasts for all stations during the 24 h forecast. We checked that every station in Table 4 contributes with an almost equal amount of forecasts and removed any outliers from the study, like physically unrealistic values, such as road-surface temperatures outside a feasible range, e.g., below −50 °C or above 70 °C, or as forecasts with sudden, unexplained jumps in the time series data.

5. Results

5.1. Full-Year Evaluation Scores

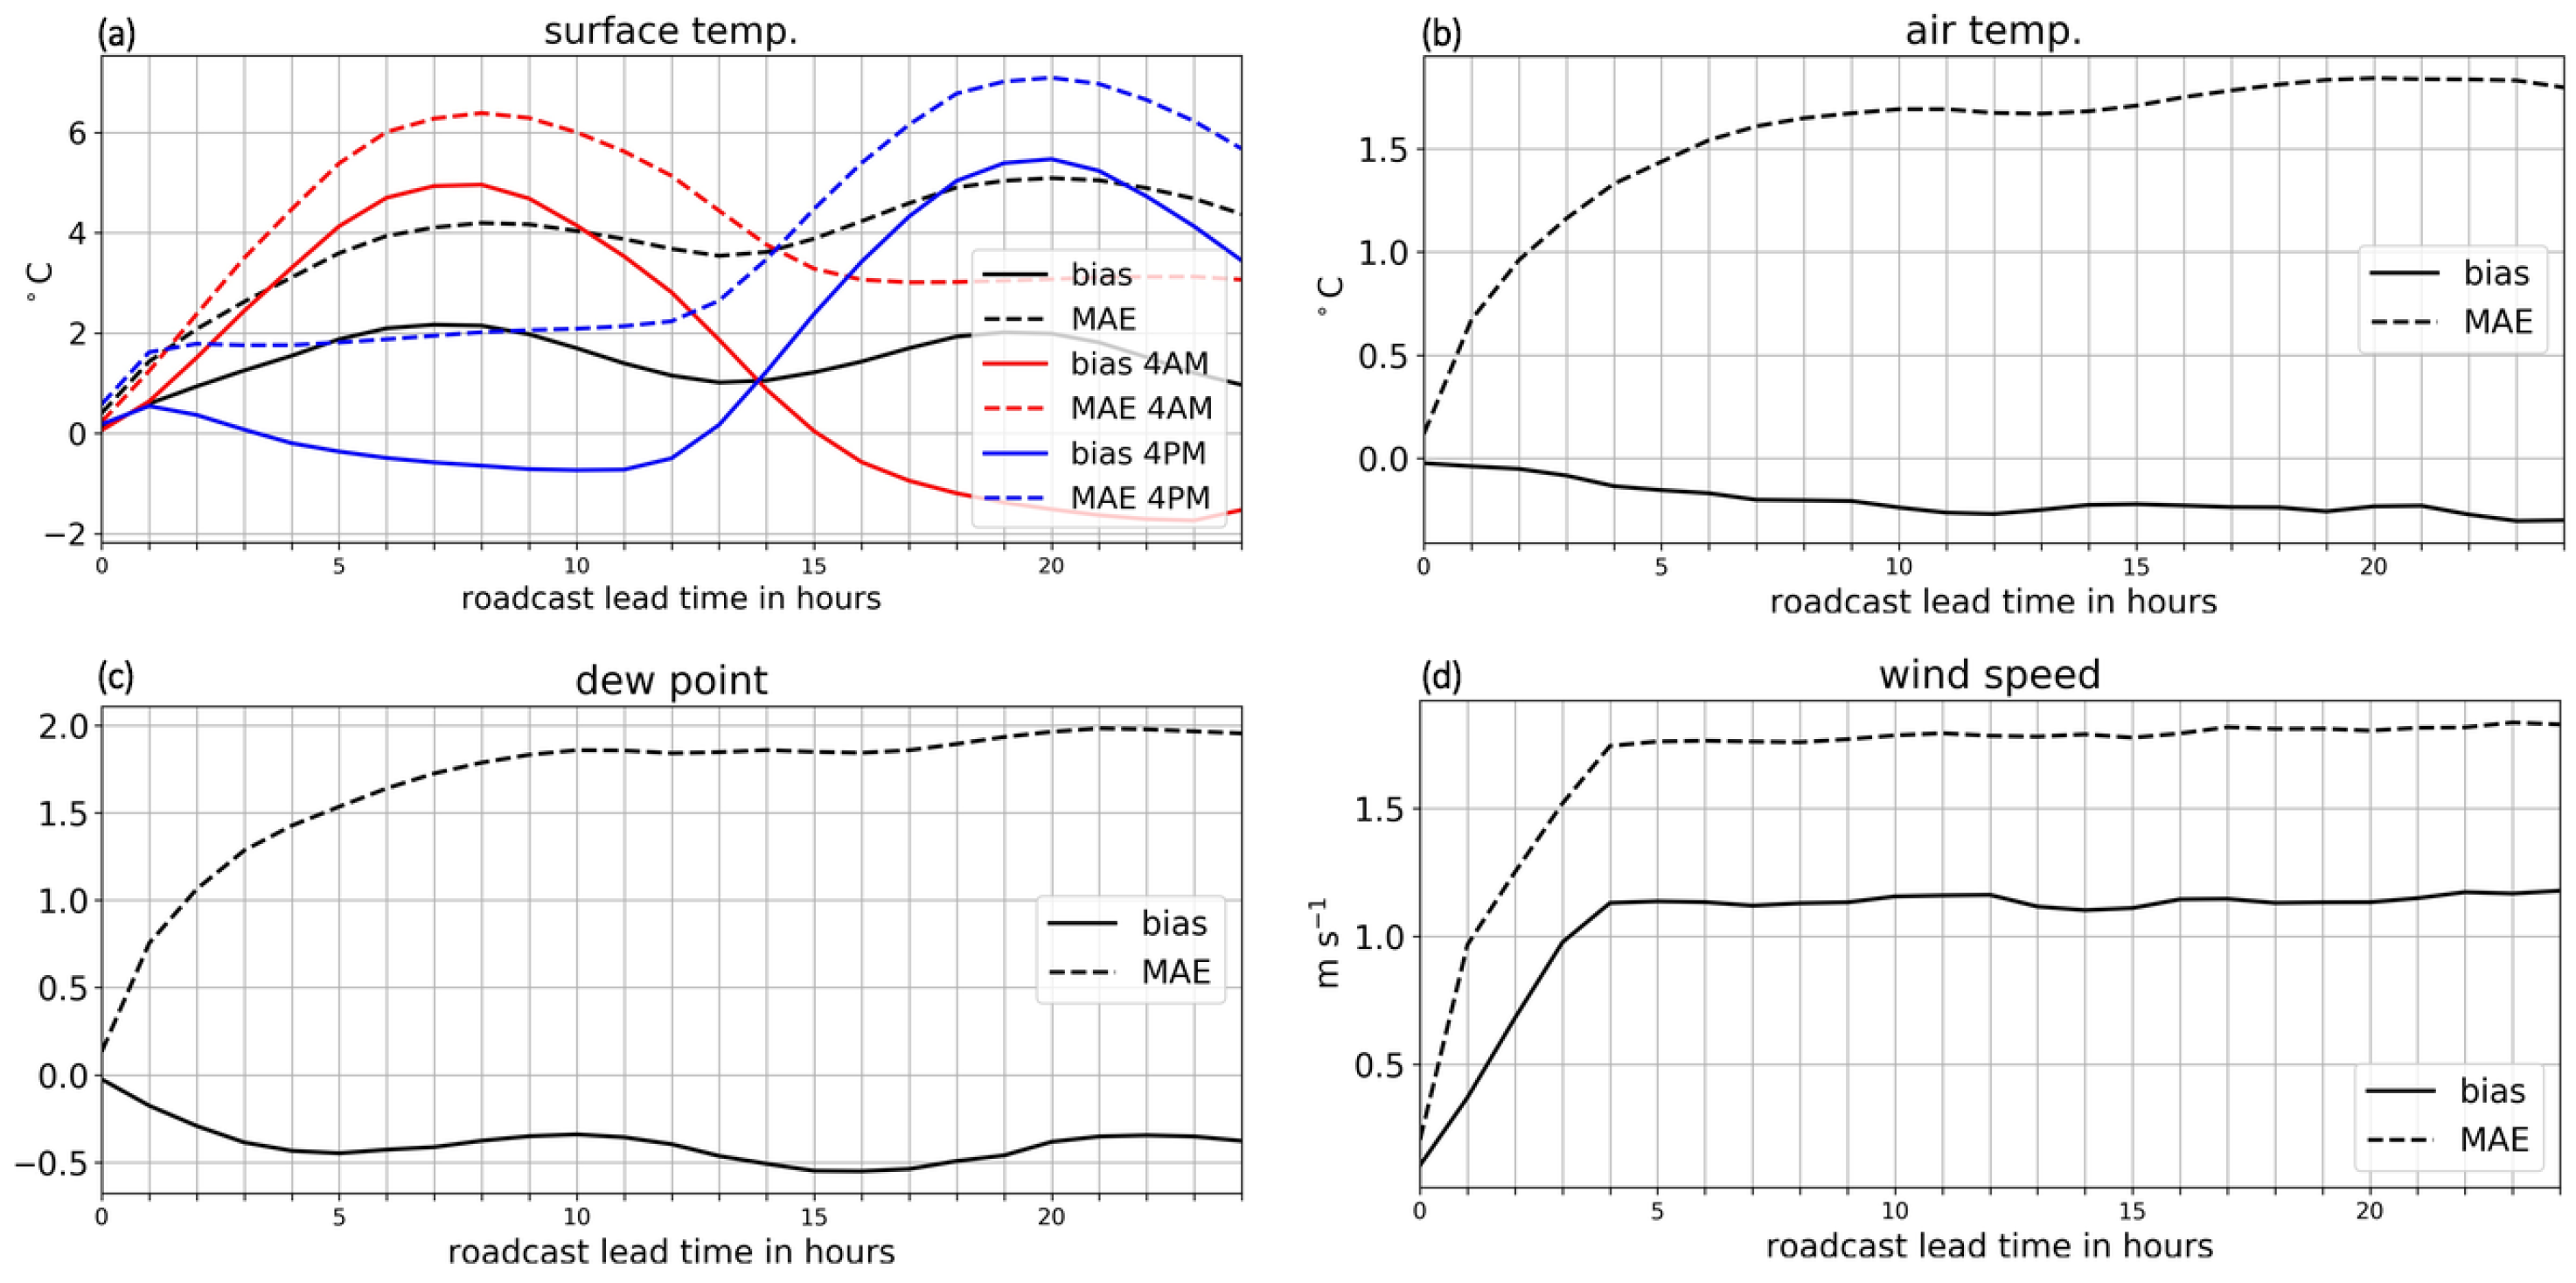
The evaluation scores presented in this section are based on a comparison between METRo model output and SVV road weather station measurements. All scores are computed as a function of forecast lead time up to 24 h. We calculated the mean absolute error (MAE) and bias for road-surface temperature, near-surface air temperature, near-surface dew point, and wind speed. The bias (MAE) at a given lead time is defined as the (absolute) value of the difference between model output and the observed value, averaged over all METRo forecasts. The MAE provides us with an intuitive measure of how much our METRo forecasts deviate from the actually observed road weather on average, whereas the bias allows us to assess if these deviations are caused by systematical issues arising from our METRo configuration.
In our validation, we see the prediction of road-surface temperature (RST) as the most important METRo output, as many hazardous driving conditions in Norway are directly related to freezing RSTs, such as freezing precipitation as well as ice and snow on the road. When looking at scores of wind speed, air temperature, and dew point, it is important to remember that these variables in METRo are prescribed by the boundary conditions. With a validation of these variables, we are basically comparing the weather forecast data that we use as boundary conditions with the SVV road weather measurements.
The MAE of RST increases with forecast lead time with a considerable portion of the MAE caused by a positive bias of 1–2 °C (Figure 4a). There are local maxima in both the bias and MAE at lead times of 8 and 20 h into the forecast, corresponding to 12 a.m./p.m., as our METRo forecasts are initialized at 4 and 16 LT. This finding motivates us to look at the scores of RST for all forecasts initialized at 4 and 16 LT separately (red and blue lines in Figure 4a). We can see that the maxima in RST bias and MAE are caused by a positive temperature bias during daytime, while the values of bias and MAE around midnight are rather low. This daytime bias could indicate an issue related to the surface energy balance, with solar irradiance being a potential error source. Possible sources of error include local shadow effects, an incorrect surface albedo, or errors in the cloud coverage. However, other processes such as surface heat fluxes or errors in long-wave radiation could also play a role, potentially causing insufficient cooling at the surface. Further investigation would be required to determine the dominant source of this bias.
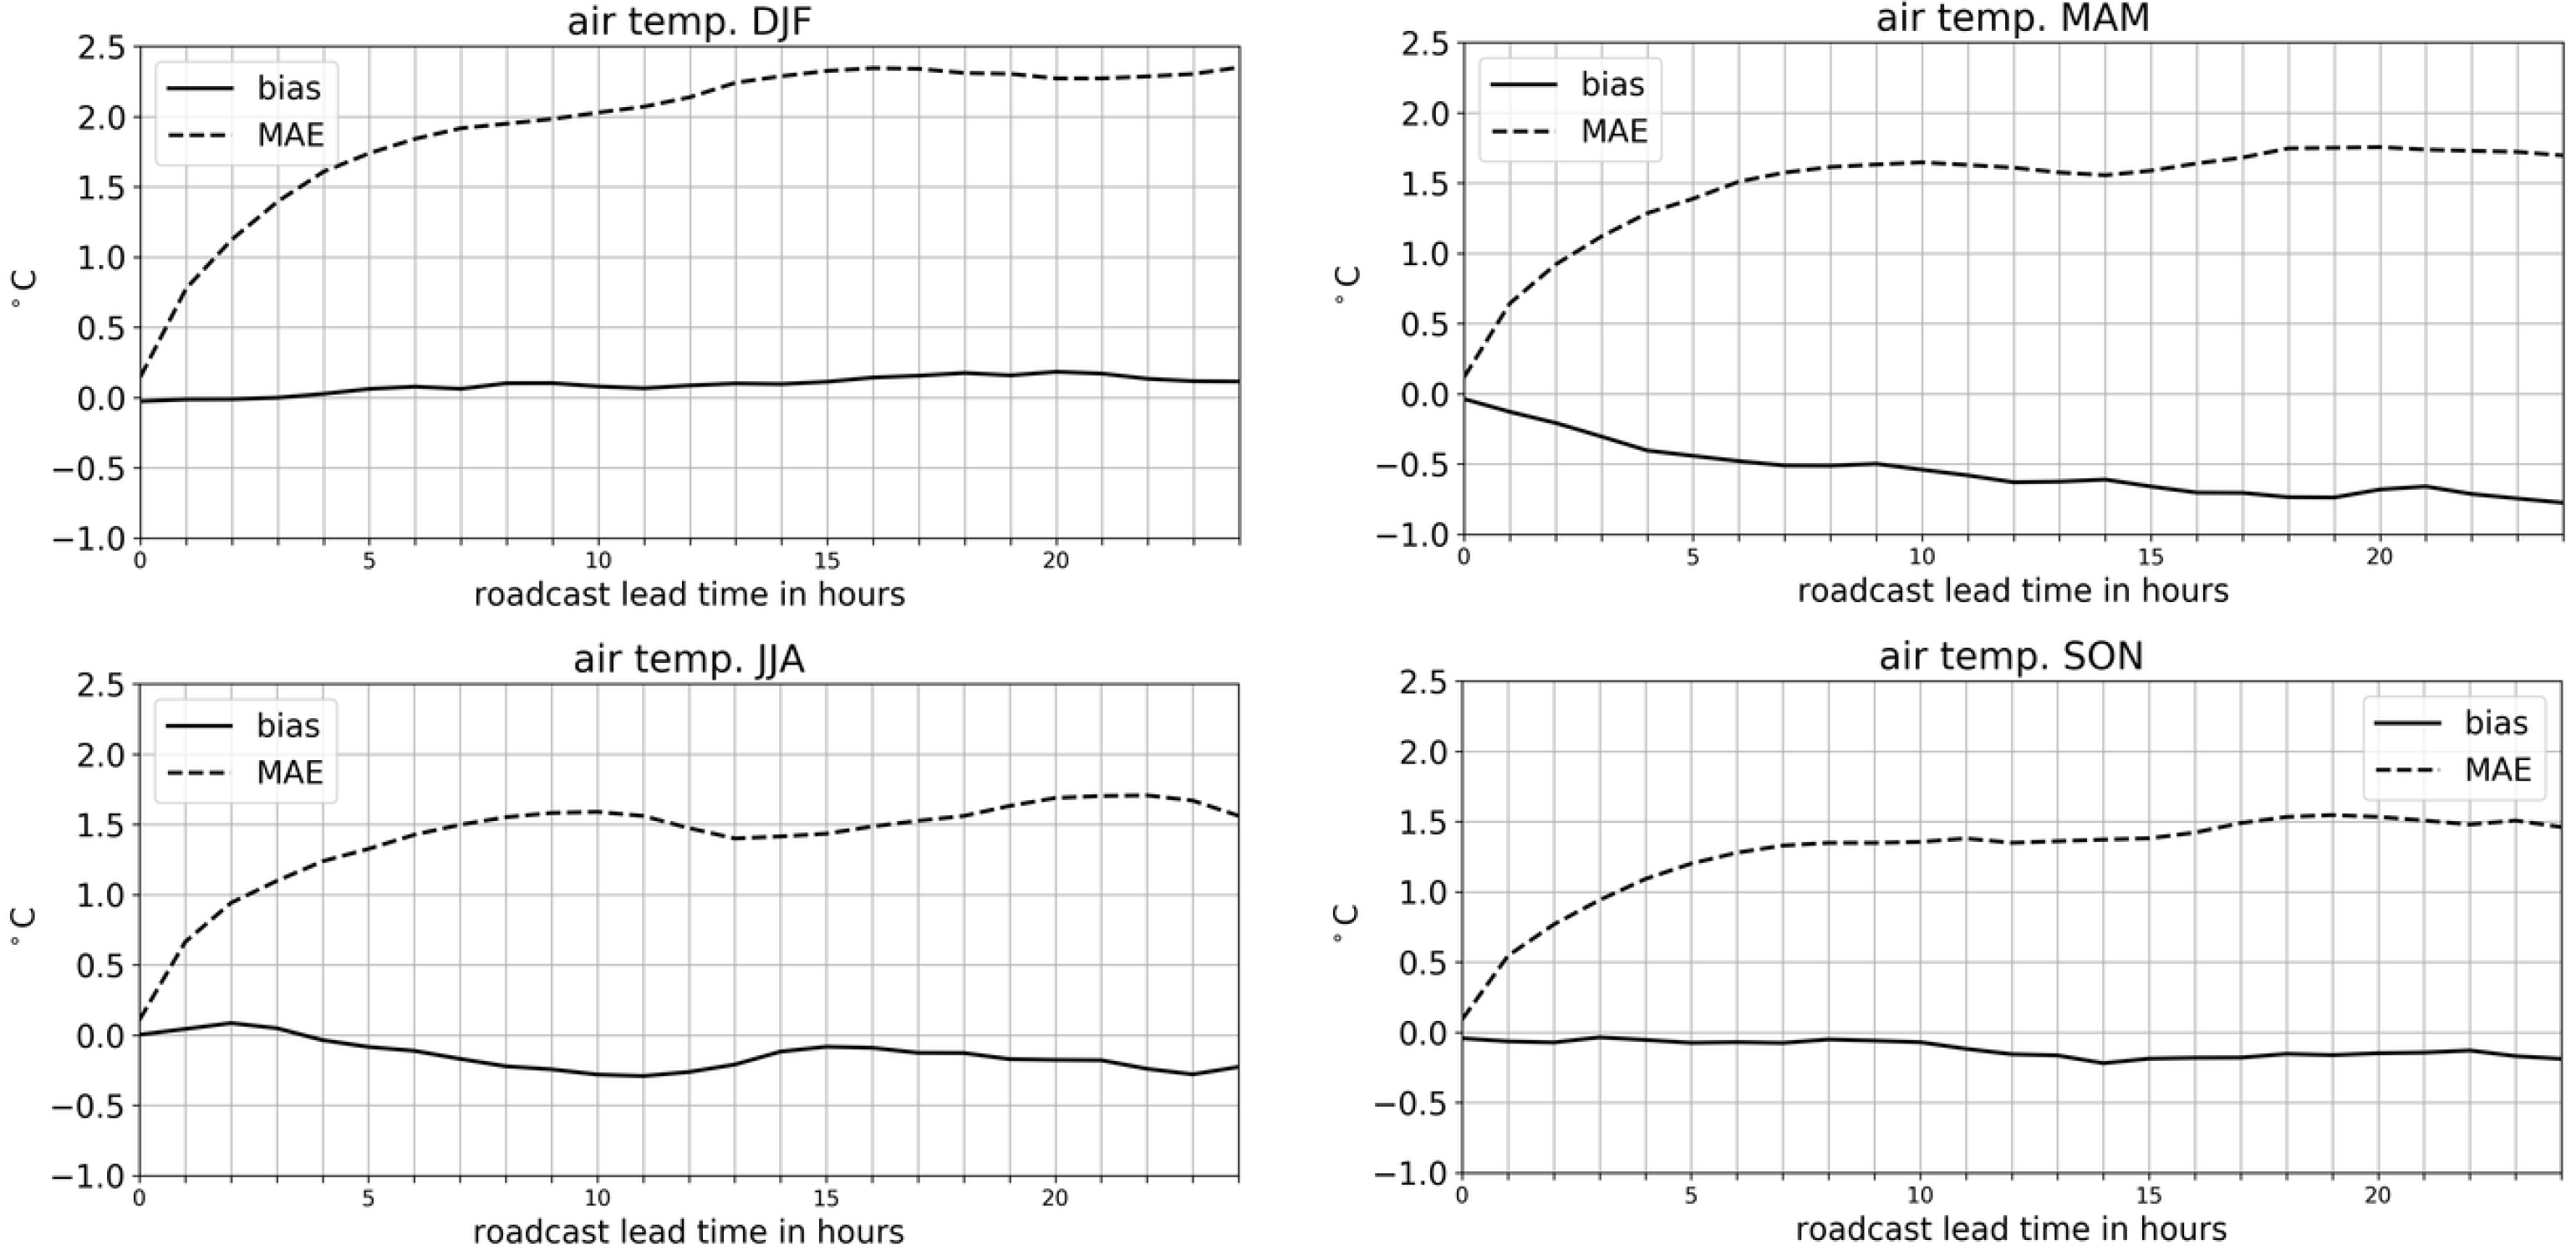
The near-surface air temperature has a negative bias (Figure 4b). This bias, however, is rather small, consistently being less than −0.5 °C. The MAE of air temperature is not that large either, with a mean of 1.51 °C over all lead times. Similar to those of air temperature, the dew point also has a small negative bias and a rather low MAE (Figure 4c). The error growth for both variables is already saturated after 5–10 h of lead time.
The wind speed MAE is clearly dominated by a positive bias of 1.05 m/s, consistent over all lead times after a spinup of around 5 h (Figure 4d). This positive bias is most likely associated with the modeled wind being at 10 m, whereas most SVV road weather stations measure wind speed at a height of 2 m above ground. Assuming a logarithmic wind profile close to the ground will automatically yield the observed bias.
Even more important than the MAE and bias is the model’s accuracy under certain conditions, for example, as a tool to predict hazardous driving conditions associated with freezing surface temperatures, i.e., RST ≤ 0 °C. For this purpose, we computed the model’s hit rate and false-alarm rate for the prediction of RST being ≤ 0 °C. Here, the hit rate (HR) is defined as the ratio of all cases in which both the observed and the modeled RST are ≤0 °C. The miss rate (MR), accordingly, is the ratio of all cases in which the observed RST is ≤0 °C, but where METRo is >0 °C (MR = 1 − HR). We also calculated the false-alarm rate (FAR), which is the ratio of all cases in which the observed RST is >0 °C, while that in METRo is ≤0 °C. Accordingly, one would find the correct rejection rate (CRR) in which both the observed and modeled RST are >0°C (CRR = 1 − FAR).
A well-performing road forecasting system is characterized by a high HR and a low FAR. As a reference for the performance of our METRo configuration, rather than the rates of a completely random predictor (each equal to 0.5), we use the climatological rate of occurrence, CRO, of freezing road-surface temperatures. This mimics a reference that randomly predicts freezing road-surface temperatures based on the CRO of RST ≤ 0 °C. This CRO is in our case derived from the SVV measurement data and defined as the ratio of observations that are ≤0 °C over a given time frame (in this case, the full year 2021). Such a reference system with random predictions based on the CRO would have both a hit rate and a false-alarm rate equal to the CRO. However, it is crucial to note that this climatology-based reference does not account for seasonality. This approach would predict freezing events even in the middle of summer, which is highly questionable and clearly unrealistic. Consequently, the model’s high HR and low FAR compared to climatology are expected. The climatology is relatively easy to outperform since it lacks the temporal context necessary for accurate seasonal predictions.
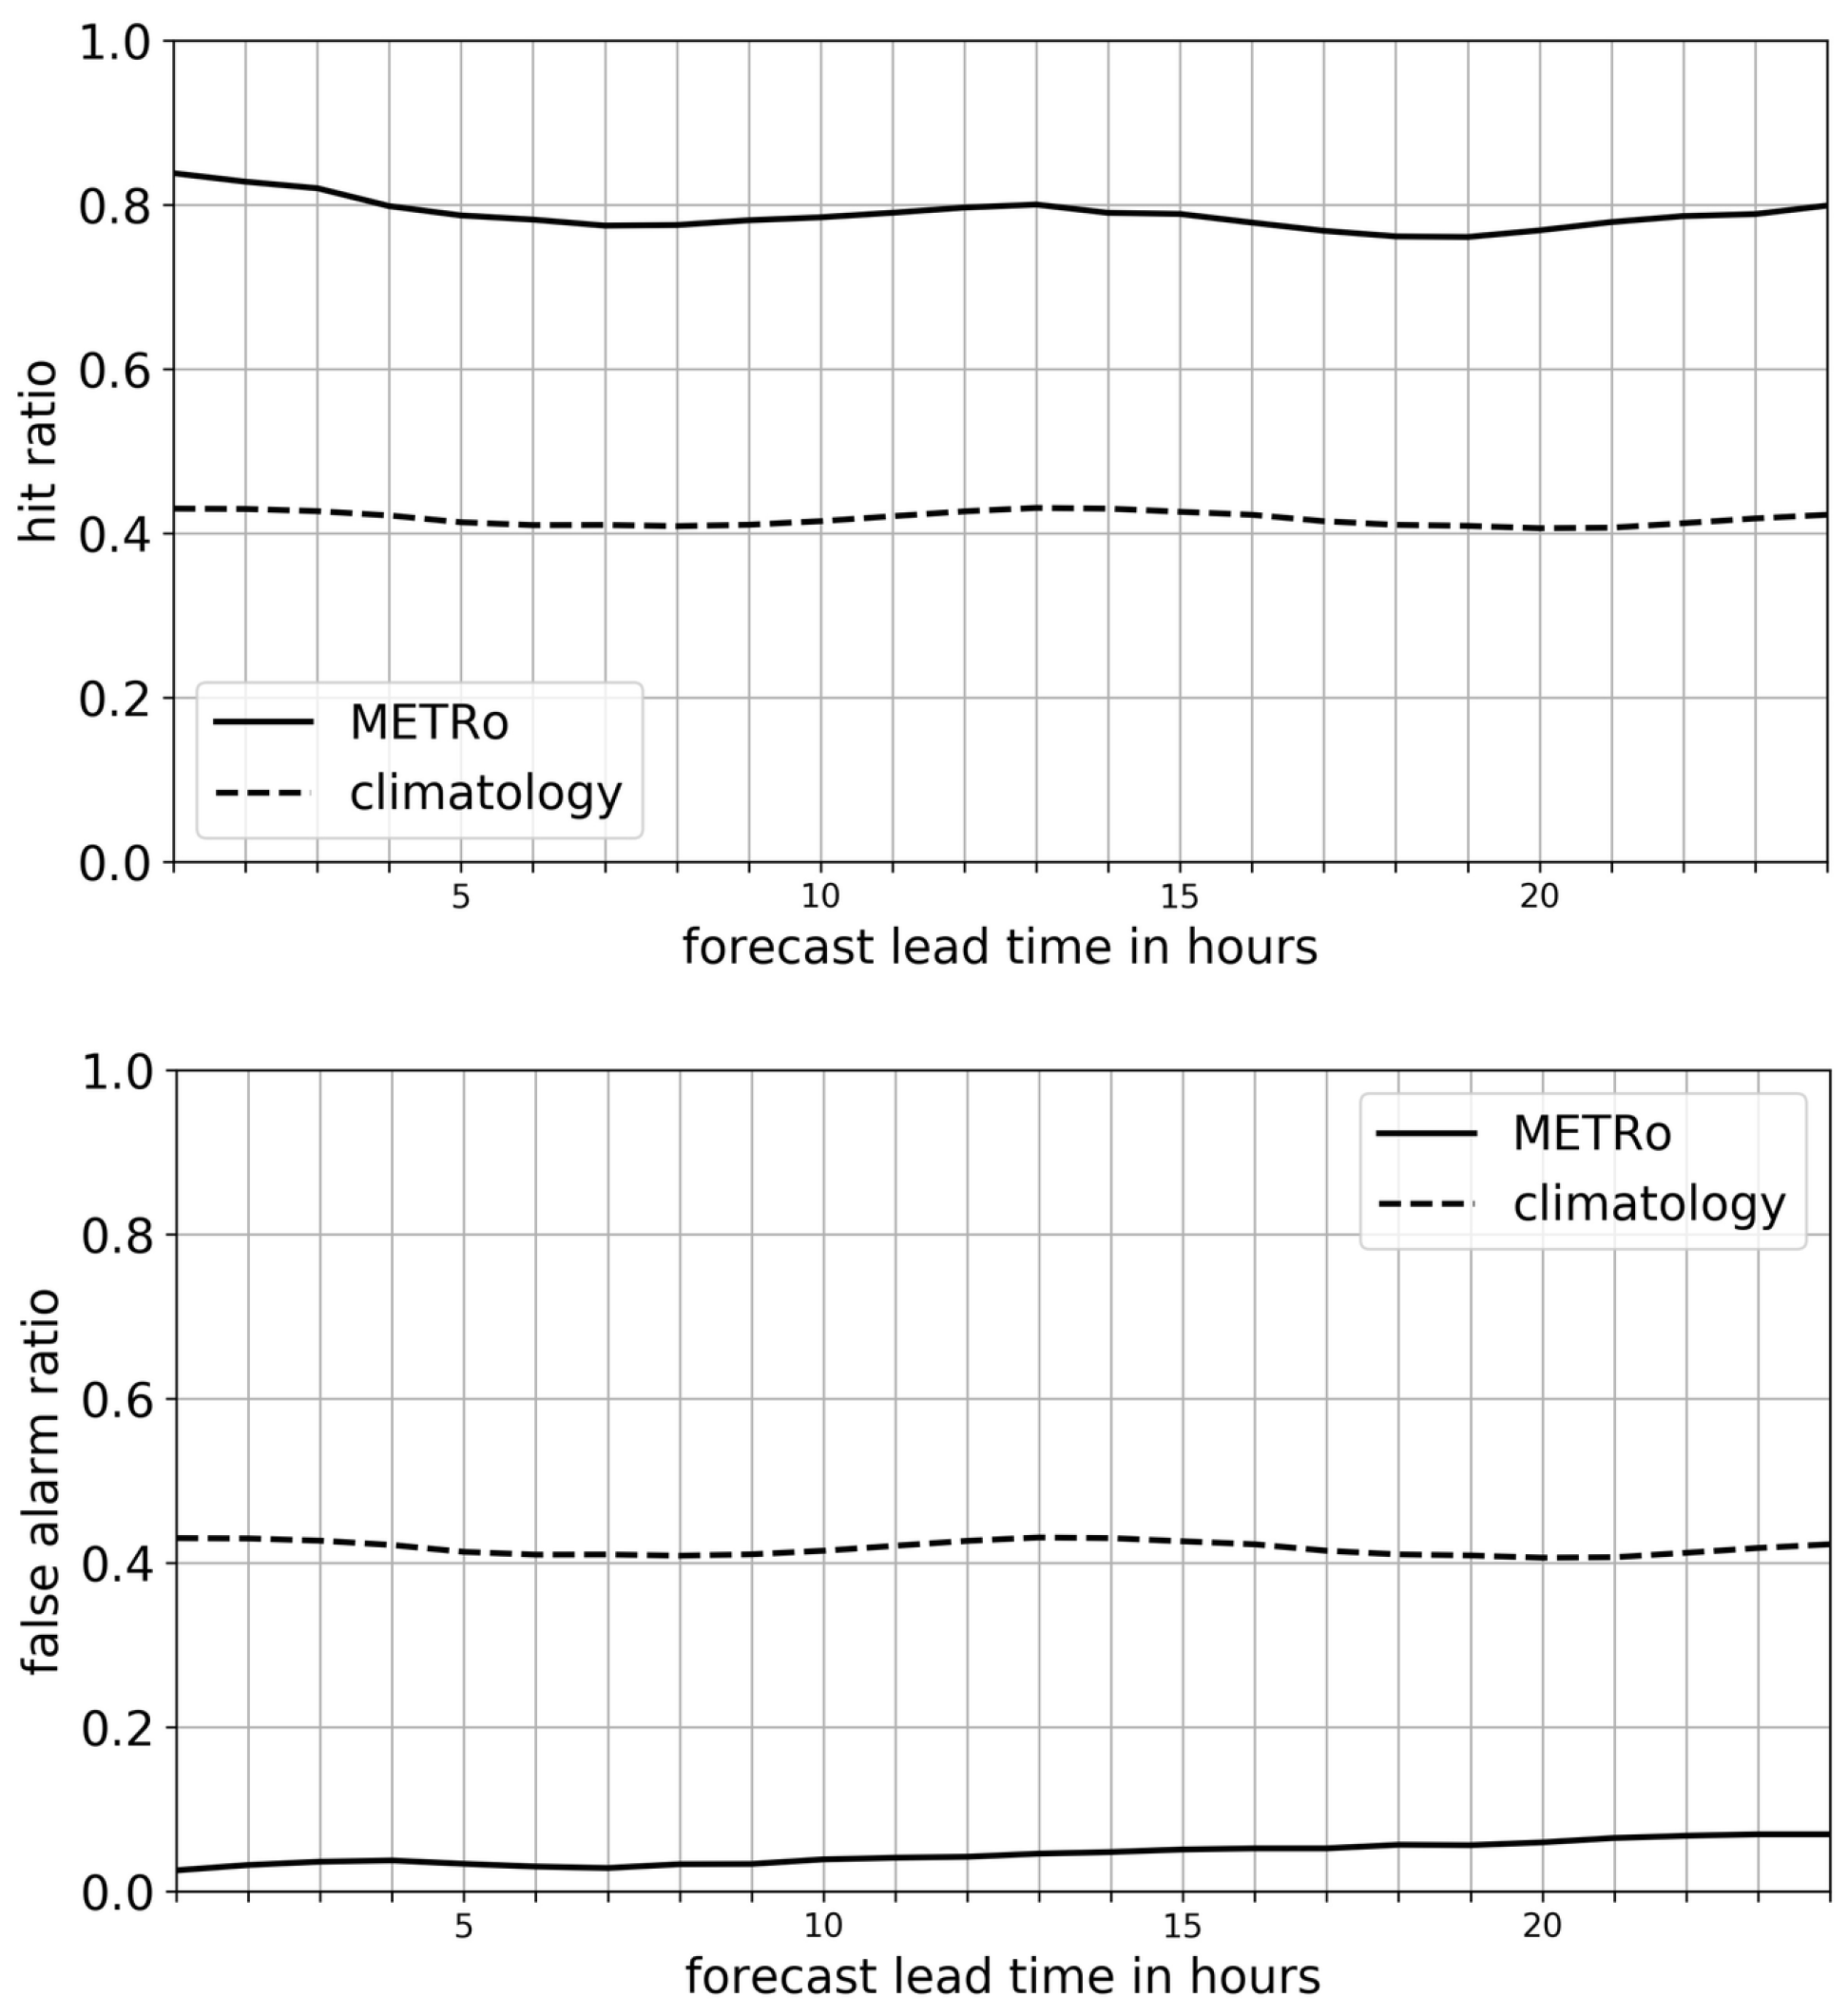
Figure 5 shows the HR and FAR for freezing RSTs over the full set of road weather forecasts in 2021. The model achieves a high HR and a significantly lower FAR compared to the climatological reference, highlighting its capability to capture freezing conditions accurately. The low FAR is particularly encouraging, as it minimizes false alarms and reduces unnecessary interventions by road authorities. The slight decrease in HR at longer lead times may indicate increasing uncertainty in the forecast, which is typical for most prediction systems. Despite this, the model’s overall performance confirms its reliability as a tool for road-safety applications.

5.2. Seasonal Mean Performance

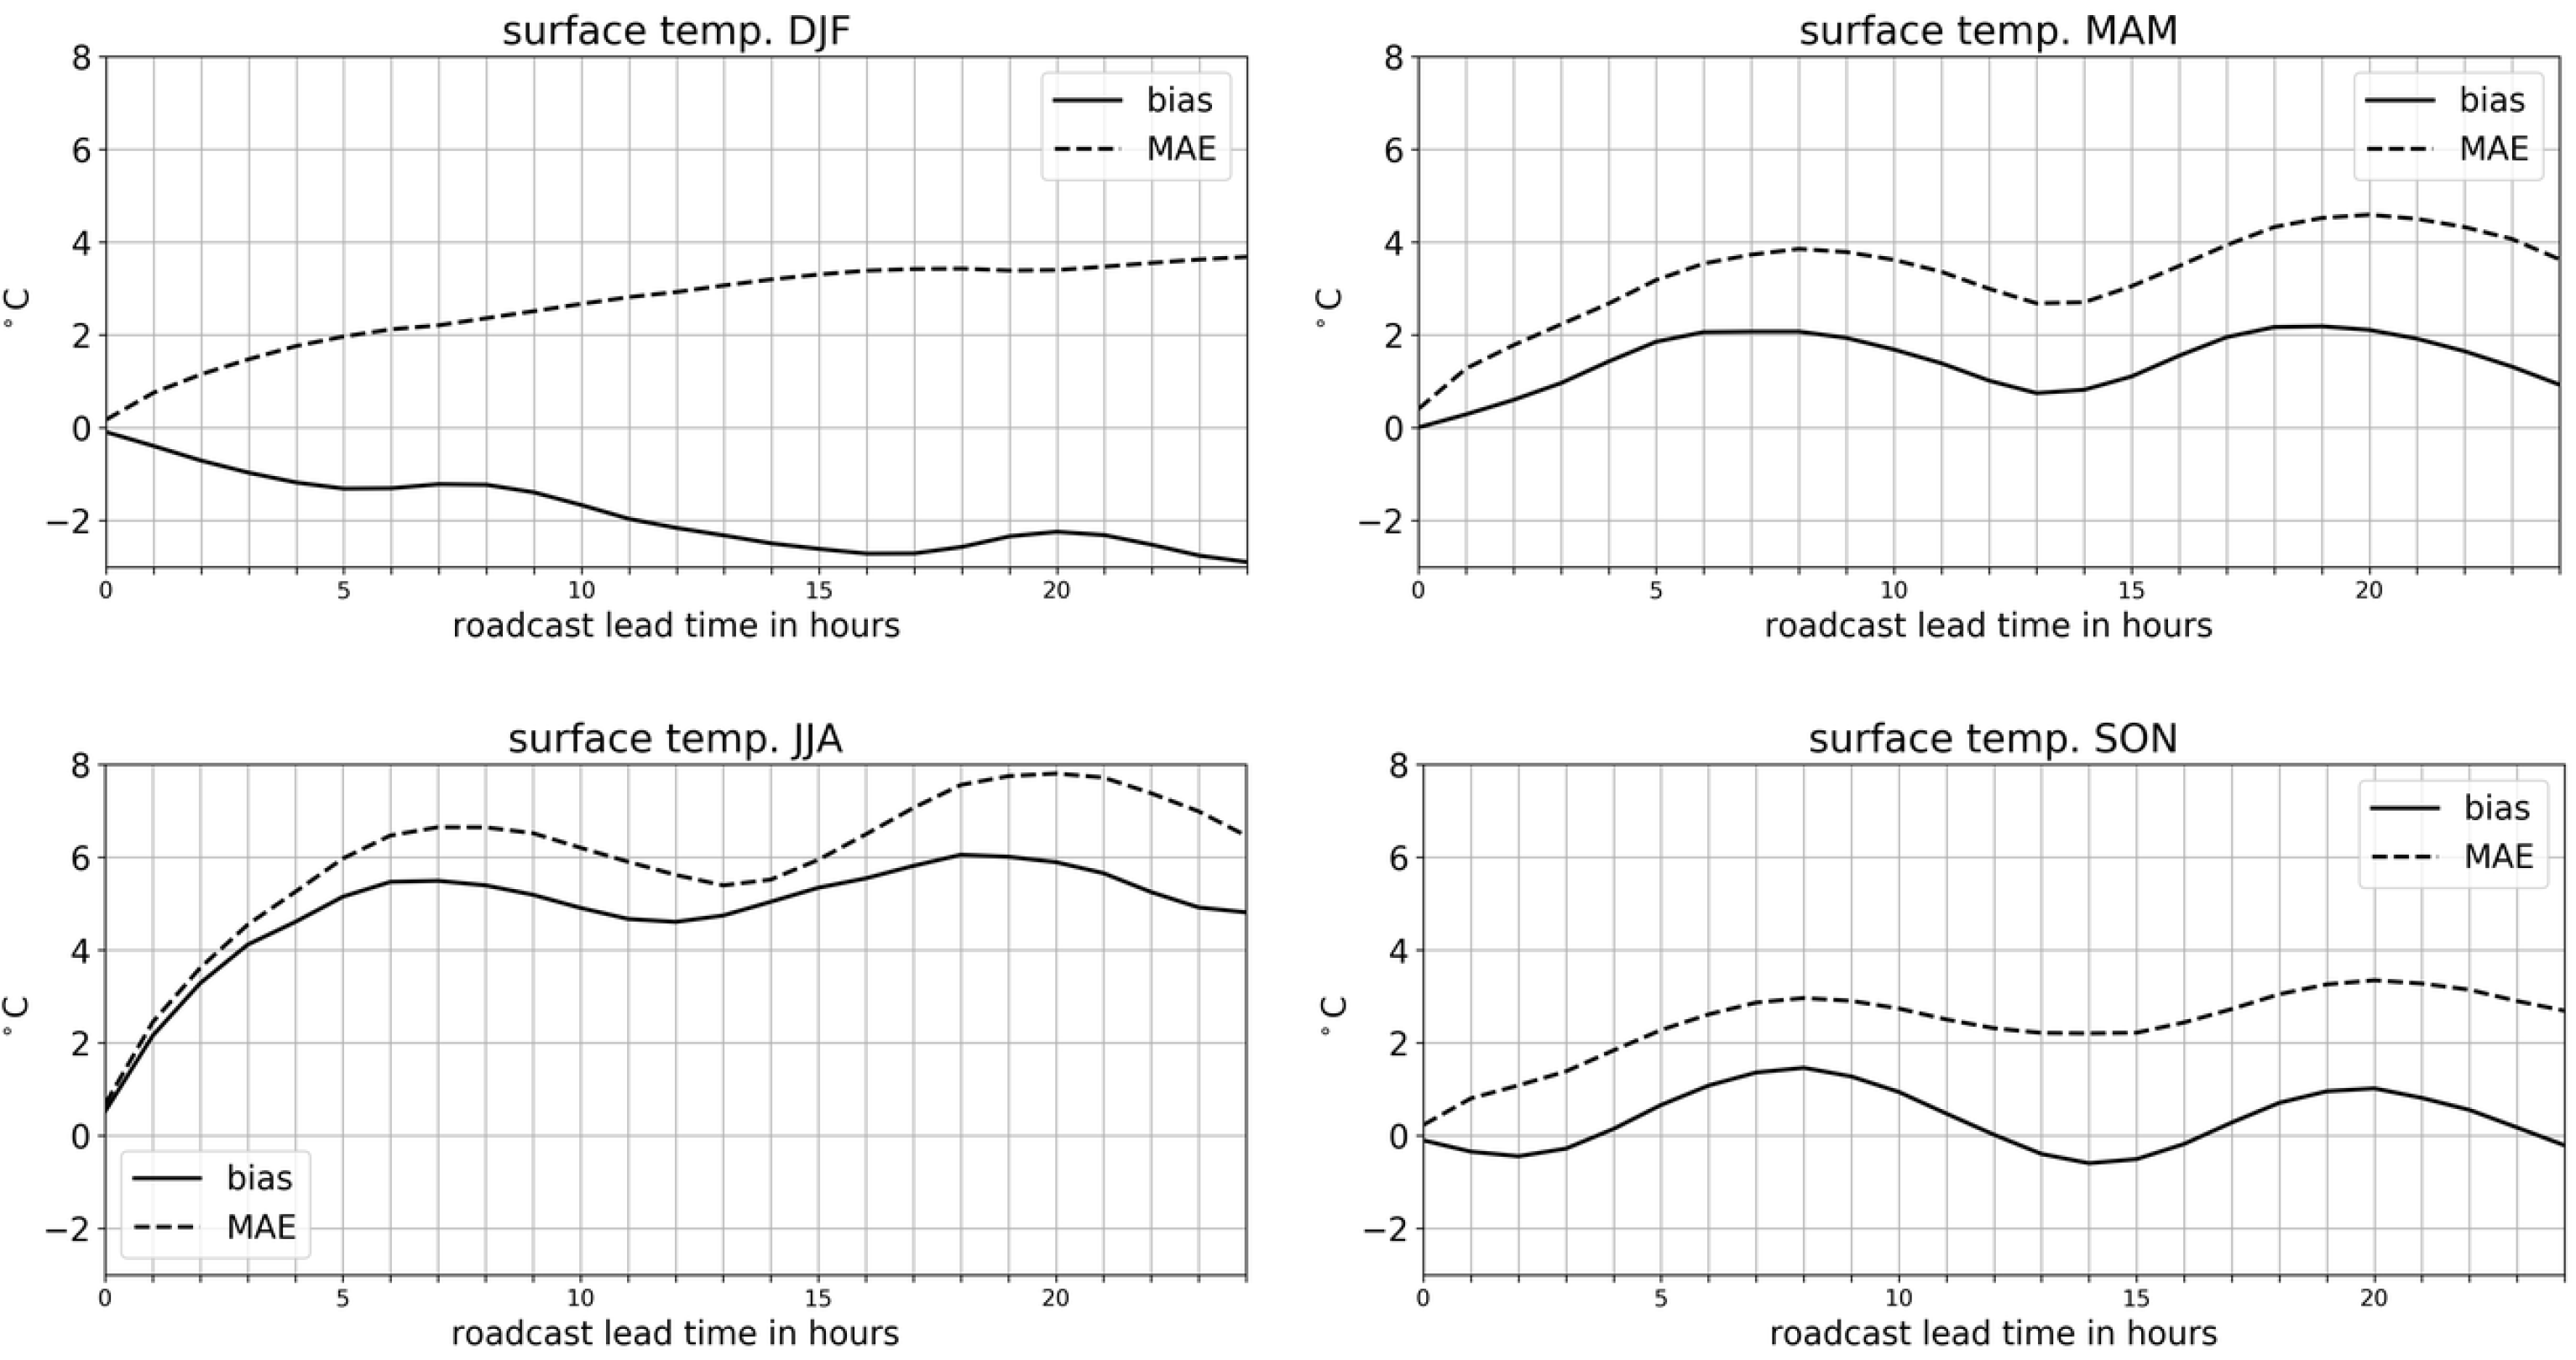
In investigating seasonal biases and MAEs of RST during winter (DJF), spring (MAM), summer (JJA), and fall (SON), our METRo configuration is subject to a positive surface temperature bias for spring, fall, and particularly summer, where the two peaks are visible again (Figure 6). While this could suggest potential issues related to solar radiation or cloud cover representation, directly attributing the origin of the bias to radiation is challenging due to competing effects in the model. Radiation is most likely accurate, but underestimated surface fluxes may lead to excessive surface heating. Errors in RST in winter are lower than in summer. Keeping in mind that the main purpose of the road weather forecasts is the prediction of hazardous driving conditions, such as freezing precipitation on the road, it is reassuring to find that the RST verification scores for winter and fall are much better than those averaged over the full year.
In contrast, winter RST errors are generally smaller than in summer. However, the model exhibits a negative bias during this season, indicating that it tends to predict temperatures that are too cold. This likely results in an overprediction of freezing conditions, which can negatively impact model performance and forecast accuracy. Given that the primary purpose of road weather forecasts is to predict hazardous driving conditions, such as freezing precipitation on the road, it is reassuring to find that RST verification scores for winter and fall are better than those averaged over the full year.
Errors in air temperatures are the largest in wintertime, but overall remain relatively low and consistent across all seasons (Figure 7). The biases in air temperature are small, indicating no systematic deviations. However, the MAE is quite large in all seasons, suggesting that positive and negative errors compensate each other in the mean error calculation. This compensation effect highlights the need to analyze error distributions more closely to understand the underlying variability.
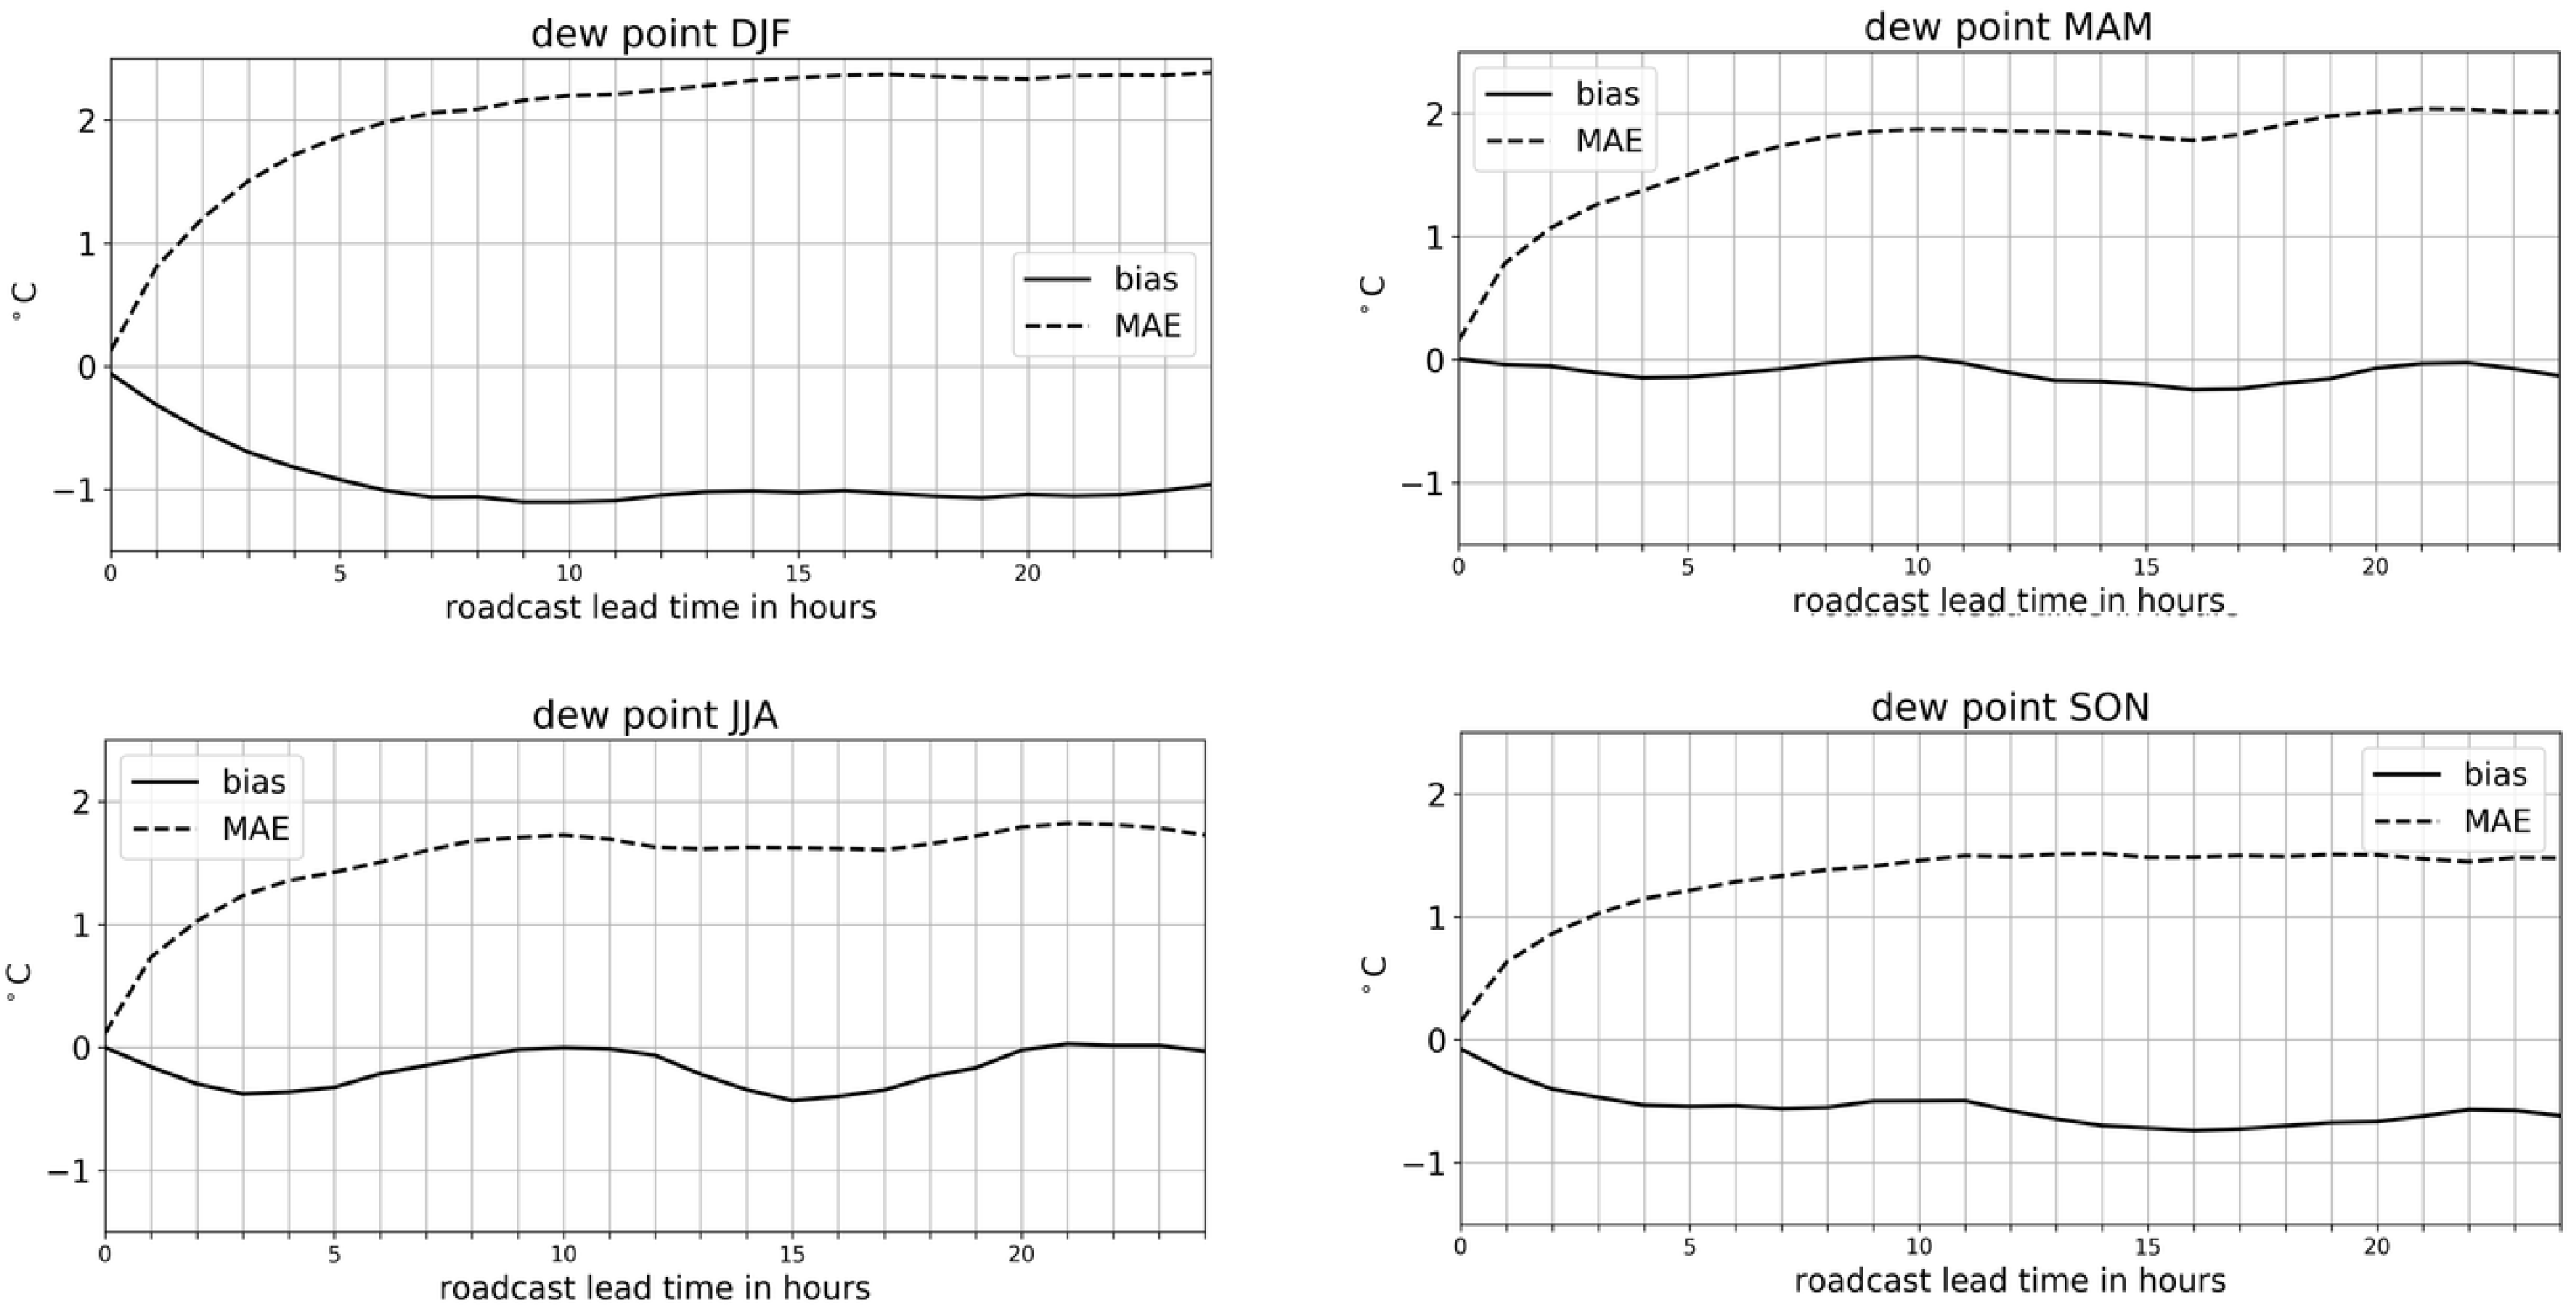
Similarly, seasonal differences in errors of dew point exhibit the same pattern, Figure 8. Dew point errors are generally low, but seasonal variations still exist. Given the relationship between dew point and air temperature, these errors may reflect the combined influence of atmospheric humidity and temperature variations, which should be further explored to assess their implications for predictive modeling.
The seasonal errors in 10 m wind speed are lower in summer and fall, and larger in winter and spring (Figure 9).

Seasonal Hit Rates for Predictions of Freezing RST Conditions

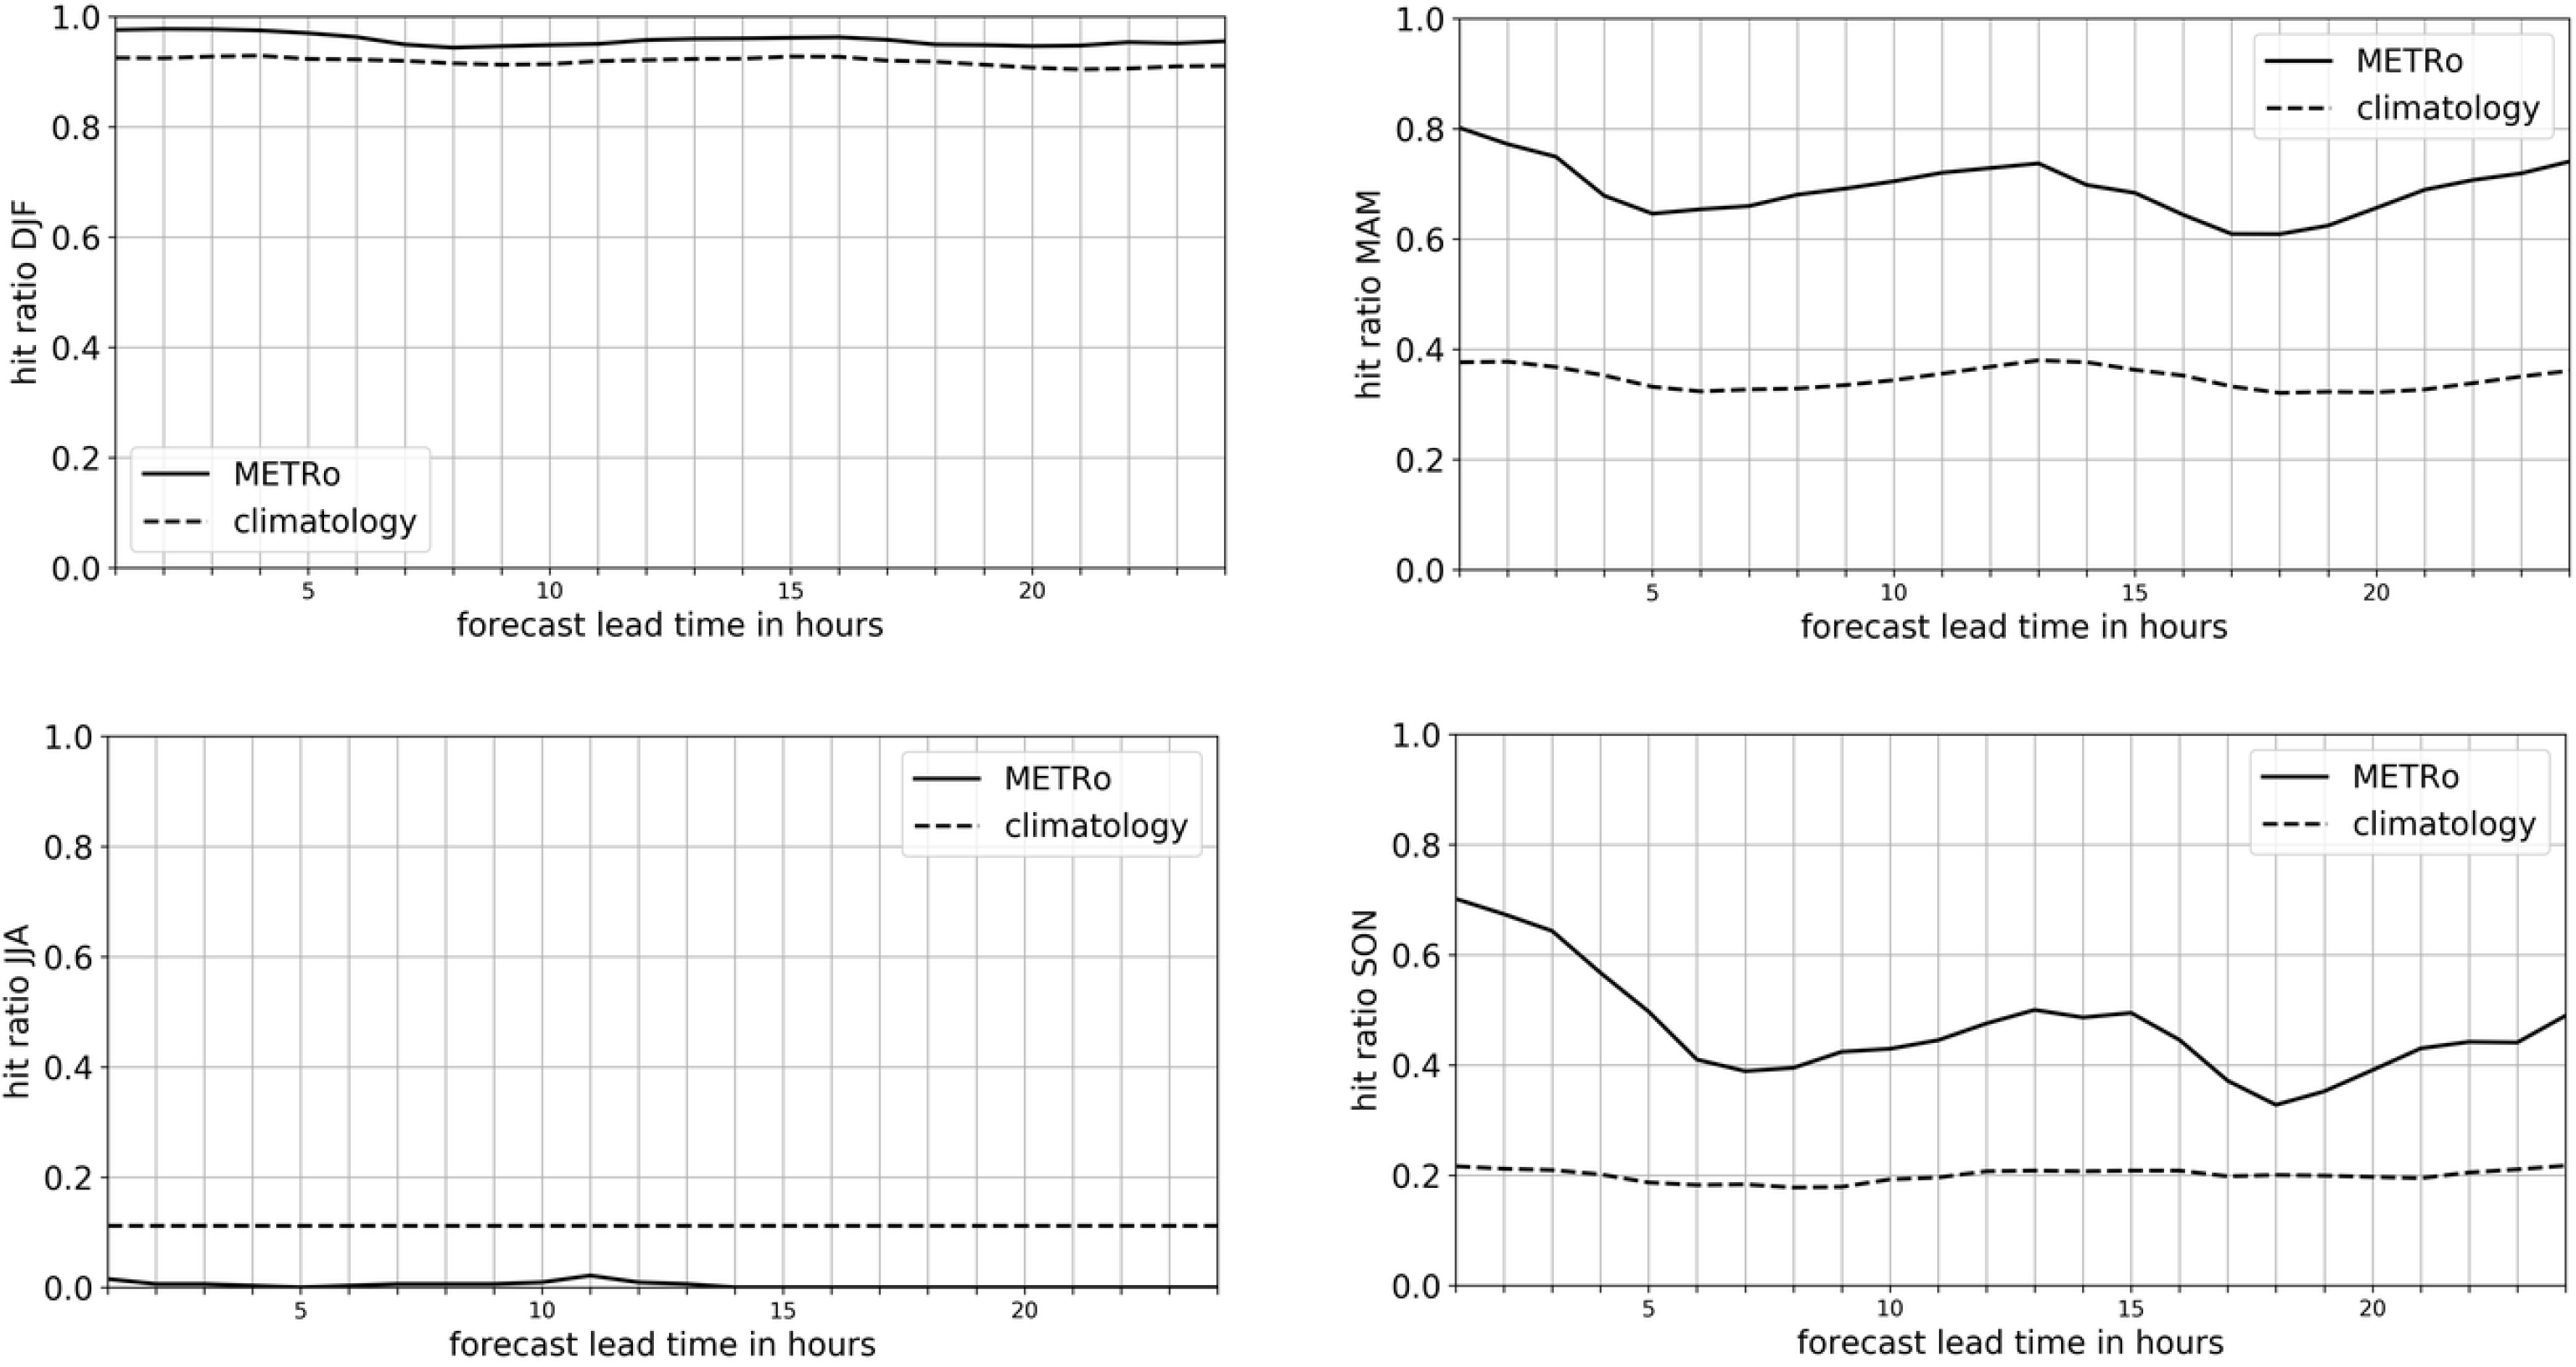
Overall, METRo has a good performance for hazardous driving conditions due to freezing temperatures on Norwegian roads (Figure 10). Even in wintertime, when the climatology-based hit rate is already over 0.9, the METRo forecasts add additional forecast skill to the predictions (Figure 10) In the shoulder seasons, spring and fall, where freezing temperatures occur more seldomly, the METRo forecasts have a hit rate much higher than the climatology. It is only in summer, when the RST forecasts are subject to positive temperature biases (Figure 4 and Figure 6), that the METRo forecasts do not add additional skill, though the occurrence of freezing events at the SVV weather stations is extremely rare.
The increases in hit rate are complemented by low false-alarm rates in winter, spring, and fall (Figure 11). For these seasons, the FARs of METRo are consistently lower than the values derived from the climatological occurrence of freezing RSTs. The low false-alarm rate in summer is, in this case, not a sign of good model performance, as it is paired with a low, almost non-existent, hit rate. The positive temperature bias seems to make it impossible for the model to reach freezing RSTs.

6. Summary and Conclusions

We set up and evaluated a road weather prediction system for Norway based on the road weather model METRo. Our METRo configuration is initialized with road weather measurements from stations belonging to the Norwegian Road Authority. Boundary conditions during the forecast are derived from numerical weather forecasts by the Norwegian Meteorological Institute. The performance of our system is evaluated based on a quasi-operational setup over the course of the year 2021. road weather forecasts at the locations of 27 road weather stations are initialized twice a day, at 4 a.m./p.m., with a forecast length of 24 h. We used the time series from the road weather station measurements to verify the METRo model output.
The forecast of near-surface air temperature, wind speed, and dew point from the proposed system are similar to the measured values (Figure 4). There are small negative biases in both the air temperature and the dew point. The wind speed is subject to a certain positive bias, which may be caused by an irregular measurement height for wind speed at the road weather stations. The MAEs for these variables are, however, not large. As these variables are prescribed by the boundary conditions in METRo, our validation shows that the data from the weather forecasts by the Norwegian Meteorological Institute have low errors at the locations of the road weather stations, and they are a suitable source for the boundary conditions in our METRo road weather forecasts.
In order to evaluate the performance of the METRo model itself, we compute the MAEs and bias for the road-surface temperature (RST, Figure 4). The MAE increases over the forecast lead time, with a considerable contribution of a bias of 1–2 °C. This positive bias seems to be related to the solar radiation, as it is revealed by looking at the forecasts initialized at 4 a.m. and 4 p.m., separately. A seasonal analysis of RST verification scores confirms the relation between positive RST bias and solar irradiance (Figure 6). Errors in the summer months are especially high and the mean errors over the whole year of 2021 deteriorate considerably because of this. METRo’s performance in winter, spring, and fall, the most critical seasons for hazardous driving conditions related to freezing RST, is much better than that in summer.
More importantly, the plain magnitude of the absolute error in RST is the model’s capability to distinguish between freezing and non-freezing road-surface temperatures. We evaluate METRo’s skill by computing hit rates and false-alarm rates for the occurrence of RST ≤ 0 °C. METRo’s performance is characterized by an increased hit rate and a low false-alarm rate, averaged over the full year of 2021 (Figure 5), and in winter, spring, and fall (Figure 10 and Figure 11). For the application of traffic safety in wintertime, it is noteworthy that the hit rate for freezing surface temperatures in our METRo configuration lies above the climatological rate of occurrence, even though the latter is already at about 95%. The large temperature bias in summer prevents successful summertime predictions of RST ≤ 0 °C. The quasi-operational road weather prediction system, which is developed and verified in this study, would provide valuable and much needed information on hazardous driving conditions and safety on the Norwegian road network.
More specifically, our METRo configuration represents a successful proof-of-concept for road weather forecasts initialized by Norwegian road weather station data and driven by weather forecasts from the Norwegian Meteorological Institute. An operational setup following our description would not be difficult to realize, as we use an open-source model, and all input data are already routinely collected and prepared by Statens Vegvesen and the Norwegian Meteorological Institute. For future work on this subject, we recommend a simple bias correction for the boundary conditions of air temperature, dew point, and wind speed, which are all subject to small, but systematic errors. We also recommend the use of more accurate boundary conditions for solar irradiance, instead of octal cloud cover.

Author Contributions

Conceptualization, F.A.A.A. and T.L.; methodology, F.A.A.A., T.L. and S.M.; software, M.F. and M.M.; validation, F.A.A.A., T.L. and T.S.; formal analysis, F.A.A.A. and T.L.; investigation, F.A.A.A.; resources, M.F. and M.M.; data curation, M.F. and M.M.; writing—original draft preparation, F.A.A.A., T.L. and S.M.; writing—review and editing, F.A.A.A., T.S. and M.M.; visualization, F.A.A.A. and T.S.; supervision, F.A.A.A.; project administration, F.A.A.A.; funding acquisition, F.A.A.A., T.L. and S.M. All authors have read and agreed to the published version of the manuscript.

Funding

This research was funded by the AutonoWeather Project, granted by The Research Council of Norway, project number 301575.

Institutional Review Board Statement

Not applicable.

Informed Consent Statement

Not applicable.

Data Availability Statement

Data used in this study can be found at https://api.met.no/product/THREDDS, accessed on 15 April 2025.

Conflicts of Interest

The authors declare no conflicts of interest. The funders had no role in the design of the study; in the collection, analyses, or interpretation of data; in the writing of the manuscript; or in the decision to publish the results.

Abbreviations

The following abbreviations are used in this manuscript:
APIApplication Programming Interface
CNRCorrect Negative Rate
CROClimatological Rate of Occurrence
FARFalse-Alarm Rate
MAEMean Absolute Error
METNorwegian Meteorological Institute
METRoModel of the Environment and Temperature of Roads
RSTRoad-Surface Temperature
RWMsRoad Weather Models
SVVStatens Vegvesen, Norway’s Road Authorities

References

  1. Peng, L.; Liao, X.; Li, T.; Guo, X.; Wang, X. An Overview Based on the Overall Architecture of Traffic Forecasting. Data Sci. Eng. 2024, 9, 341–359. [Google Scholar] [CrossRef]
  2. Freistetter, N.C.; Médus, E.; Hippi, M.; Kangas, M.; Dobler, A.; Belušić, D.; Käyhkö, J.; Partanen, A.I. Climate change impacts on future driving and walking conditions in Finland, Norway and Sweden. Reg. Environ. Chang. 2022, 22, 58. [Google Scholar] [CrossRef]
  3. Gössling, S.; Neger, C.; Steiger, R.; Bell, R. Weather, climate change, and transport: A review. Nat. Hazards 2023, 118, 1341–1360. [Google Scholar] [CrossRef]
  4. Karsisto, V.; Tijm, S.; Nurmi, P. Comparing the performance of two road weather models in the Netherlands. Weather Forecast. 2017, 32, 991–1006. [Google Scholar] [CrossRef]
  5. Kangas, M.; Heikinheimo, M.; Hippi, M. RoadSurf: A modelling system for predicting road weather and road surface conditions. Meteorol. Appl. 2015, 22, 544–553. [Google Scholar] [CrossRef]
  6. Venäläinen, A.; Kangas, M. Estimation of winter road maintenance costs using climate data. Meteorol. Appl. 2003, 10, 69–73. [Google Scholar] [CrossRef]
  7. Karsisto, V.; Nurmi, P.; Kangas, M.; Hippi, M.; Fortelius, C.; Niemelä, S.; Järvinen, H. Improving road weather model forecasts by adjusting the radiation input. Meteorol. Appl. 2016, 23, 503–513. [Google Scholar] [CrossRef]
  8. Crevier, L.P.; Delage, Y. METRo: A new model for road-condition forecasting in Canada. J. Appl. Meteorol. 2001, 40, 2026–2037. [Google Scholar] [CrossRef]
  9. Sokol, Z.; Zacharov, P.; Sedlák, P.; Hošek, J.; Bližňák, V.; Chládová, Z.; Pešice, P.; Škuthan, M. First experience with the application of the METRo model in the Czech Republic. Atmos. Res. 2014, 143, 1–16. [Google Scholar] [CrossRef]
  10. Sokol, Z.; Bližňák, V.; Sedlák, P.; Zacharov, P.; Pešice, P.; Škuthan, M. Ensemble forecasts of road surface temperatures. Atmos. Res. 2017, 187, 33–41. [Google Scholar] [CrossRef]
  11. Dejmal, K.; Novotny, J. Potential of the METRo model for grass temperature forecast. In Proceedings of the International Conference on Military Technologies (ICMT) 2015, Brno, Czech Republic, 19–21 May 2015; IEEE: Piscataway, NJ, USA, 2015; pp. 1–4. [Google Scholar]
  12. Karanko, S.; Alanko, I.; Manninen, M. Integrating METRo into a winter maintenance weather forecast system covering Finland, Sweden and Russia. In Proceedings of the 16th International Road Weather Conference SIRWEC, Helsinki, Finland, 23–25 May 2012; Citeseer: Princeton, NJ, USA, 2012; pp. 23–25. [Google Scholar]
  13. Siems-Anderson, A.R.; Walker, C.L.; Wiener, G.; Mahoney III, W.P.; Haupt, S.E. An adaptive big data weather system for surface transportation. Transp. Res. Interdiscip. Perspect. 2019, 3, 100071. [Google Scholar] [CrossRef]
  14. Xiaoli, Q.; Yuchao, Q.; Qi, Y.; Yuefeng, W.; Dan, W.; Meiqi, L. An approaching prediction method of road surface temperature of Winter Olympic Highway demonstration station based on METRo model. J. Arid Meteorol. 2020, 38, 497. [Google Scholar]
  15. Statens vegvesen. Kart - Vegvær, n.d. Available online: https://www.vegvesen.no/kart/vegvaer/ (accessed on 11 December 2024).
  16. Coulson, R.; Evans, B.; Skea, A. Operational OpenRoad verification. In Proceedings of the 16th International Road Weather Conference, Helsinki, Finland, 23–25 May 2012. [Google Scholar]
  17. Kangas, M.; Heikinheimo, M. Refining Predictions of Freezing Road Conditions Using Machine Learning. Meteorol. Appl. 2023, 30, 123–135. [Google Scholar] [CrossRef]
  18. Carrillo, J.; Crowley, M. Integration of Roadside Camera Images and Weather Data for Monitoring Winter Road Surface Conditions. arXiv 2020, arXiv:2009.12165. [Google Scholar]
  19. Sokol, Z.; Zacharov, P. Advancements in Ensemble Forecasting for Road Surface Temperatures. J. Appl. Meteorol. Climatol. 2023, 62, 765–778. [Google Scholar] [CrossRef]
  20. Stern, A.D.; Shah, V.; Biesecker, K.; Yeung, C.; Pisano, P.; Pol, J. Vehicles as mobile sensing platforms for meteorological observations: A first look. In Proceedings of the American Meteorological Society, San Antonio, TX, USA, 14–18 January 2007. [Google Scholar]
  21. Siems-Anderson, A.R. The use of vehicle-based observations in weather prediction and decision support. Meteorol. Appl. 2024, 31, e2225. [Google Scholar] [CrossRef]
  22. Haavasoja, T.; Nylander, J.; Nylander, P. Verification of road surface temperature forecasts assimilating data from mobile sensors. Weather Forecast. 2019, 34, 539–558. [Google Scholar] [CrossRef]
  23. Sunde, J.; Rønting, B.; Breivik, L.; Midtbø, K.; Ulstad, C. Operational monitoring and forecasting of mesoscale weather phenomena in ocean regions surrounding Norway. Meteorol. Appl. 1994, 1, 237–245. [Google Scholar] [CrossRef]
  24. Hormann, K. Barycentric interpolation. In Proceedings of the Approximation Theory XIV, San Antonio, TX, USA, 7–10 April 2013; Springer: Cham, Switzerland, 2014; pp. 197–218. [Google Scholar]
Figure 1. Observation and forecast data overlap before and during a METRo roadcast.
Meteorology 04 00016 g001
Figure 2. Flowchart illustrating the different data sources and APIs.
Meteorology 04 00016 g002
Figure 3. The three steps of the barycentric interpolation of THREDDS API data onto the coordinates for which a road weather forecast request is issued.
Meteorology 04 00016 g003
Figure 4. MAE and bias for (a) surface temperature, (b) air temperature, (c) dew point, and (d) wind speed based on the full set of 9586 road weather forecasts for the year 2021.
Meteorology 04 00016 g004
Figure 5. Hit ratio (HT) and false alarm ratio (FAR) for the prediction of freezing road-surface temperatures (RST ≤ 0 °C) computed over the full set of 9586 road weather forecasts for 2021. The reference line labeled “climatology” indicates the occurrence of freezing surface temperatures in the observational dataset.
Meteorology 04 00016 g005
Figure 6. Seasonal verification scores for road-surface temperature forecasts (winter: DJF; spring: MAM; summer: JJA; fall: SON).
Meteorology 04 00016 g006
Figure 7. Similar to Figure 6, but for near-surface air temperature.
Meteorology 04 00016 g007
Figure 8. Similar to Figure 6, but for near-surface dew point.
Meteorology 04 00016 g008
Figure 9. Similar to Figure 6, but for 10 m wind speed.
Meteorology 04 00016 g009
Figure 10. Similar to Figure 6, but for the hit rate for predictions of freezing RST.
Meteorology 04 00016 g010
Figure 11. Similar to Figure 6, but for the false-alarm rate for prediction of freezing RST.
Meteorology 04 00016 g011
Table 1. Forecast API Forecast parameters.
ParameterDescriptionUnit
altitudeheight above sea levelm
air_temperature_2 mscreen level temperatureK
relative_humidity_2 mscreen level relative humidityNormalized (0–1)
wind_speed_10 mwind speed at 10 m heightm/s
cloud_area_fractiontotal cloud coverNormalized (0–1)
air_pressure_at_sea_levelair pressure at sea levelhPa
precipitation_amountaccumulated total precipitationkg/m2
Table 2. METRo Forecast parameters.
Parameter NameParameter DescriptionConvertion DescriptionAvailability in THREDDSUnit
atAir temperature at 1.5 mpresent in THREDDS as air temperature at 2 mPresentK
tdDew point at 1.5 mderived from relative humidityDerivedK
wsWind speed at 10 mwind speed at 10 m heightPresentm/s
ccOctal cloud coveragepresent in THREDDS as fractional cloud coverPresentNormalized (0–1)
apSurface pressure at station altitudecalculated as explained in Table 1Not PresenthPa
raRain precipitation quantityderived from total precipitationNot Presentkg/m2
snSnow precipitation quantityderived from total precipitationNot Presentkg/m2
Table 3. Parameter conversion between THREDDS and METRo.
METRo Parameter NameUnitUsed THREDDS ParametersUnitConversion Strategy
forecast timeISO 8601timesJavascript function that returns a string in ISO format
at°Cair_temperature_2 m (T)K a t = T 273.15
td°Cdewpoint_temperature_2 m (T), relative_humidity_2 m (RH)K t d = T 273.15 100 R H · 100 5.0
wskm/hwind_speed_10 mm/s w s = wind_speed_10 m ·   3.6
ccoctal (0–8)cloud_area_fraction (C)0–1 c c = C · 8
apmbarair_pressure_at_sea_level (P0), altitude (h)hPa, m a p = P 0 · 1 0.0065 · h a t + 0.0065 · h + 273.15 5.257
rammprecipitation_amount (prec)kg/m2if at > 0: ra = prec
sncmprecipitation_amount (prec)kg/m2if at ≤ 0: sn = prec
Table 4. Station information.
Station IDLong NameLatitudeLongitudeAltitude [m]
SN27785E18 Rødbøl59.10710.106283.7
SN53280E16 Flåm60.8617.10486.1
SN63595Rv70 Gråura62.58189.2136463.8
SN79215E6 Yttervika66.229813.87289.8
SN16611E6 Fokstugu62.11259.28625976.8
SN16620E6 Avsjøen62.18079.4752929.8
SN27055Fv312 Hanekleiva59.573510.18175.1
SN27075E18 Grelland59.51110.207892
SN27285E18 Gulli Nord59.318310.374826.4
SN27730E18 Fokserød59.182810.2077104.8
SN50815E39 Vågsbotn60.47685.34891.1
SN6700Rv3 Svingen60.957311.4902202
SN67153E39 Øysand63.323710.243813.9
SN68175E6 Moholtlia63.407810.4388118
SN79791E6 Saltfjellet66.554815.3235673.9
SN84770E6 Hålogalandsbrua68.468317.48242.1
SN84905E10 Bjørnfjell68.43618.1035502.2
SN91490E8 Bossovarri69.118520.7455544.8
SN12280Rv3 Stabekken60.816511.2853216.1
SN27320E18 Hem Nord59.353510.382556.4
SN49860Rv7 Dyranut60.36937.49451232.9
SN52390E39 Ostereidet60.6265.472296.6
SN61580E136 Brustuglia62.29438.1255452.1
SN82210Rv80 Bertnes67.287814.593226
SN84910E10 Skitdalshøgda68.51617.8725398.9
SN6690Rv3 Ebru60.863211.4172269
SN91420E8 Halsebakkan Nedre69.285220.4657153.9
Disclaimer/Publisher’s Note: The statements, opinions and data contained in all publications are solely those of the individual author(s) and contributor(s) and not of MDPI and/or the editor(s). MDPI and/or the editor(s) disclaim responsibility for any injury to people or property resulting from any ideas, methods, instructions or products referred to in the content.