1. Introduction
Successful forecasting of precipitation is one of the most challenging tasks of numerical weather prediction. The forecast of precipitation type is especially difficult as it is very changeable in space and time. In the last few years, numerical models developed significantly; thus, precipitation type has become a variable directly calculated in some models. In the European Centre for Medium-Range Weather Forecasts (ECMWF) integrated forecast system (IFS) model, a new method has been used since 2015 to predict the type of precipitation [
1]. Still, precipitation type forecasts are especially important due to their impact on society, the economy and the environment [
2].
In the last few decades, statistical post-processing methods were the best way to be applied beside the experience of the operational forecasters [
3]. As a consequence of intensive development of numerical weather prediction models, precipitation type is directly calculated in the physical processes of the model. In the ECMWF IFS model, rain and snow have been separated since 2010 [
4]. Due to some other developments, six different types of precipitation (rain, snow, freezing rain, wet snow, snowy rain and ice pellet) have been distinguished in the operational model since May 2015 [
2]. During the prediction of precipitation type, the ensemble method is especially important since we can obtain useful information about the probability of dangerous meteorological phenomena [
5].
The verification of two of the ECMWF’s new products was developed using four months’ worth of 3-hourly observations of present weather from manual surface synoptic observation (SYNOPs) in Europe during the 2016/2017 winter period for Europe [
5]. This verification showed that the IFS was highly skillful when forecasting rain and snow, but only moderately skillful for freezing rain and rain and snow mixed, while the ability to predict the occurrence of ice pellets was negligible. Typical outputs were also illustrated via a freezing-rain case study, showing interesting changes with lead time.
In this paper, the work was concentrated for two groups. We aimed to conduct an investigation of ensemble precipitation type forecasts for the territory of Hungary. In the first part of the work, a few visualization forms showed, namely, ensemble meteogram of precipitation types for the selected location, an arbitrary geographic section for ensemble precipitation types, and a combined visualization of precipitation type probabilities on map.
In the second part of our work, we performed an objective verification of single-ensemble-control forecasts and 51-member ensemble forecasts too. We were interested in the relationship of precipitation type and other meteorological variables too. As the precipitation type forecast has been available since May 2015 in the ECMWF meteorological archival and retrieval system (MARS) archive, we studied three winters (2015/2016, 2016/2017, and 2017/2018). Verifications were applied for all available locations of the Hungarian SYNOP observation network. The usefulness of these types of forecasts is illustrated for a nontypical freezing-rain situation that occurred on 17 March 2018. In that selected situation, cooling gradually became dominant in the lowest layers due to northeasterly cold flow. It is slightly unusual in Central Europe as freezing-rain situations are typically connected to warm fronts or Mediterranean cyclones.
2. Formation of the Various Precipitation Types
The type of precipitation principally depends on the vertical temperature profile of the lower atmosphere [
1]. When the temperature of the ascending, moist air reaches the dewpoint temperature, condensation or formation of ice crystals and snow particles begins. After the formation of the snow particles below 0 °C, during the fall of the precipitation, several scenarios can occur; all of these lead to another type of precipitation.
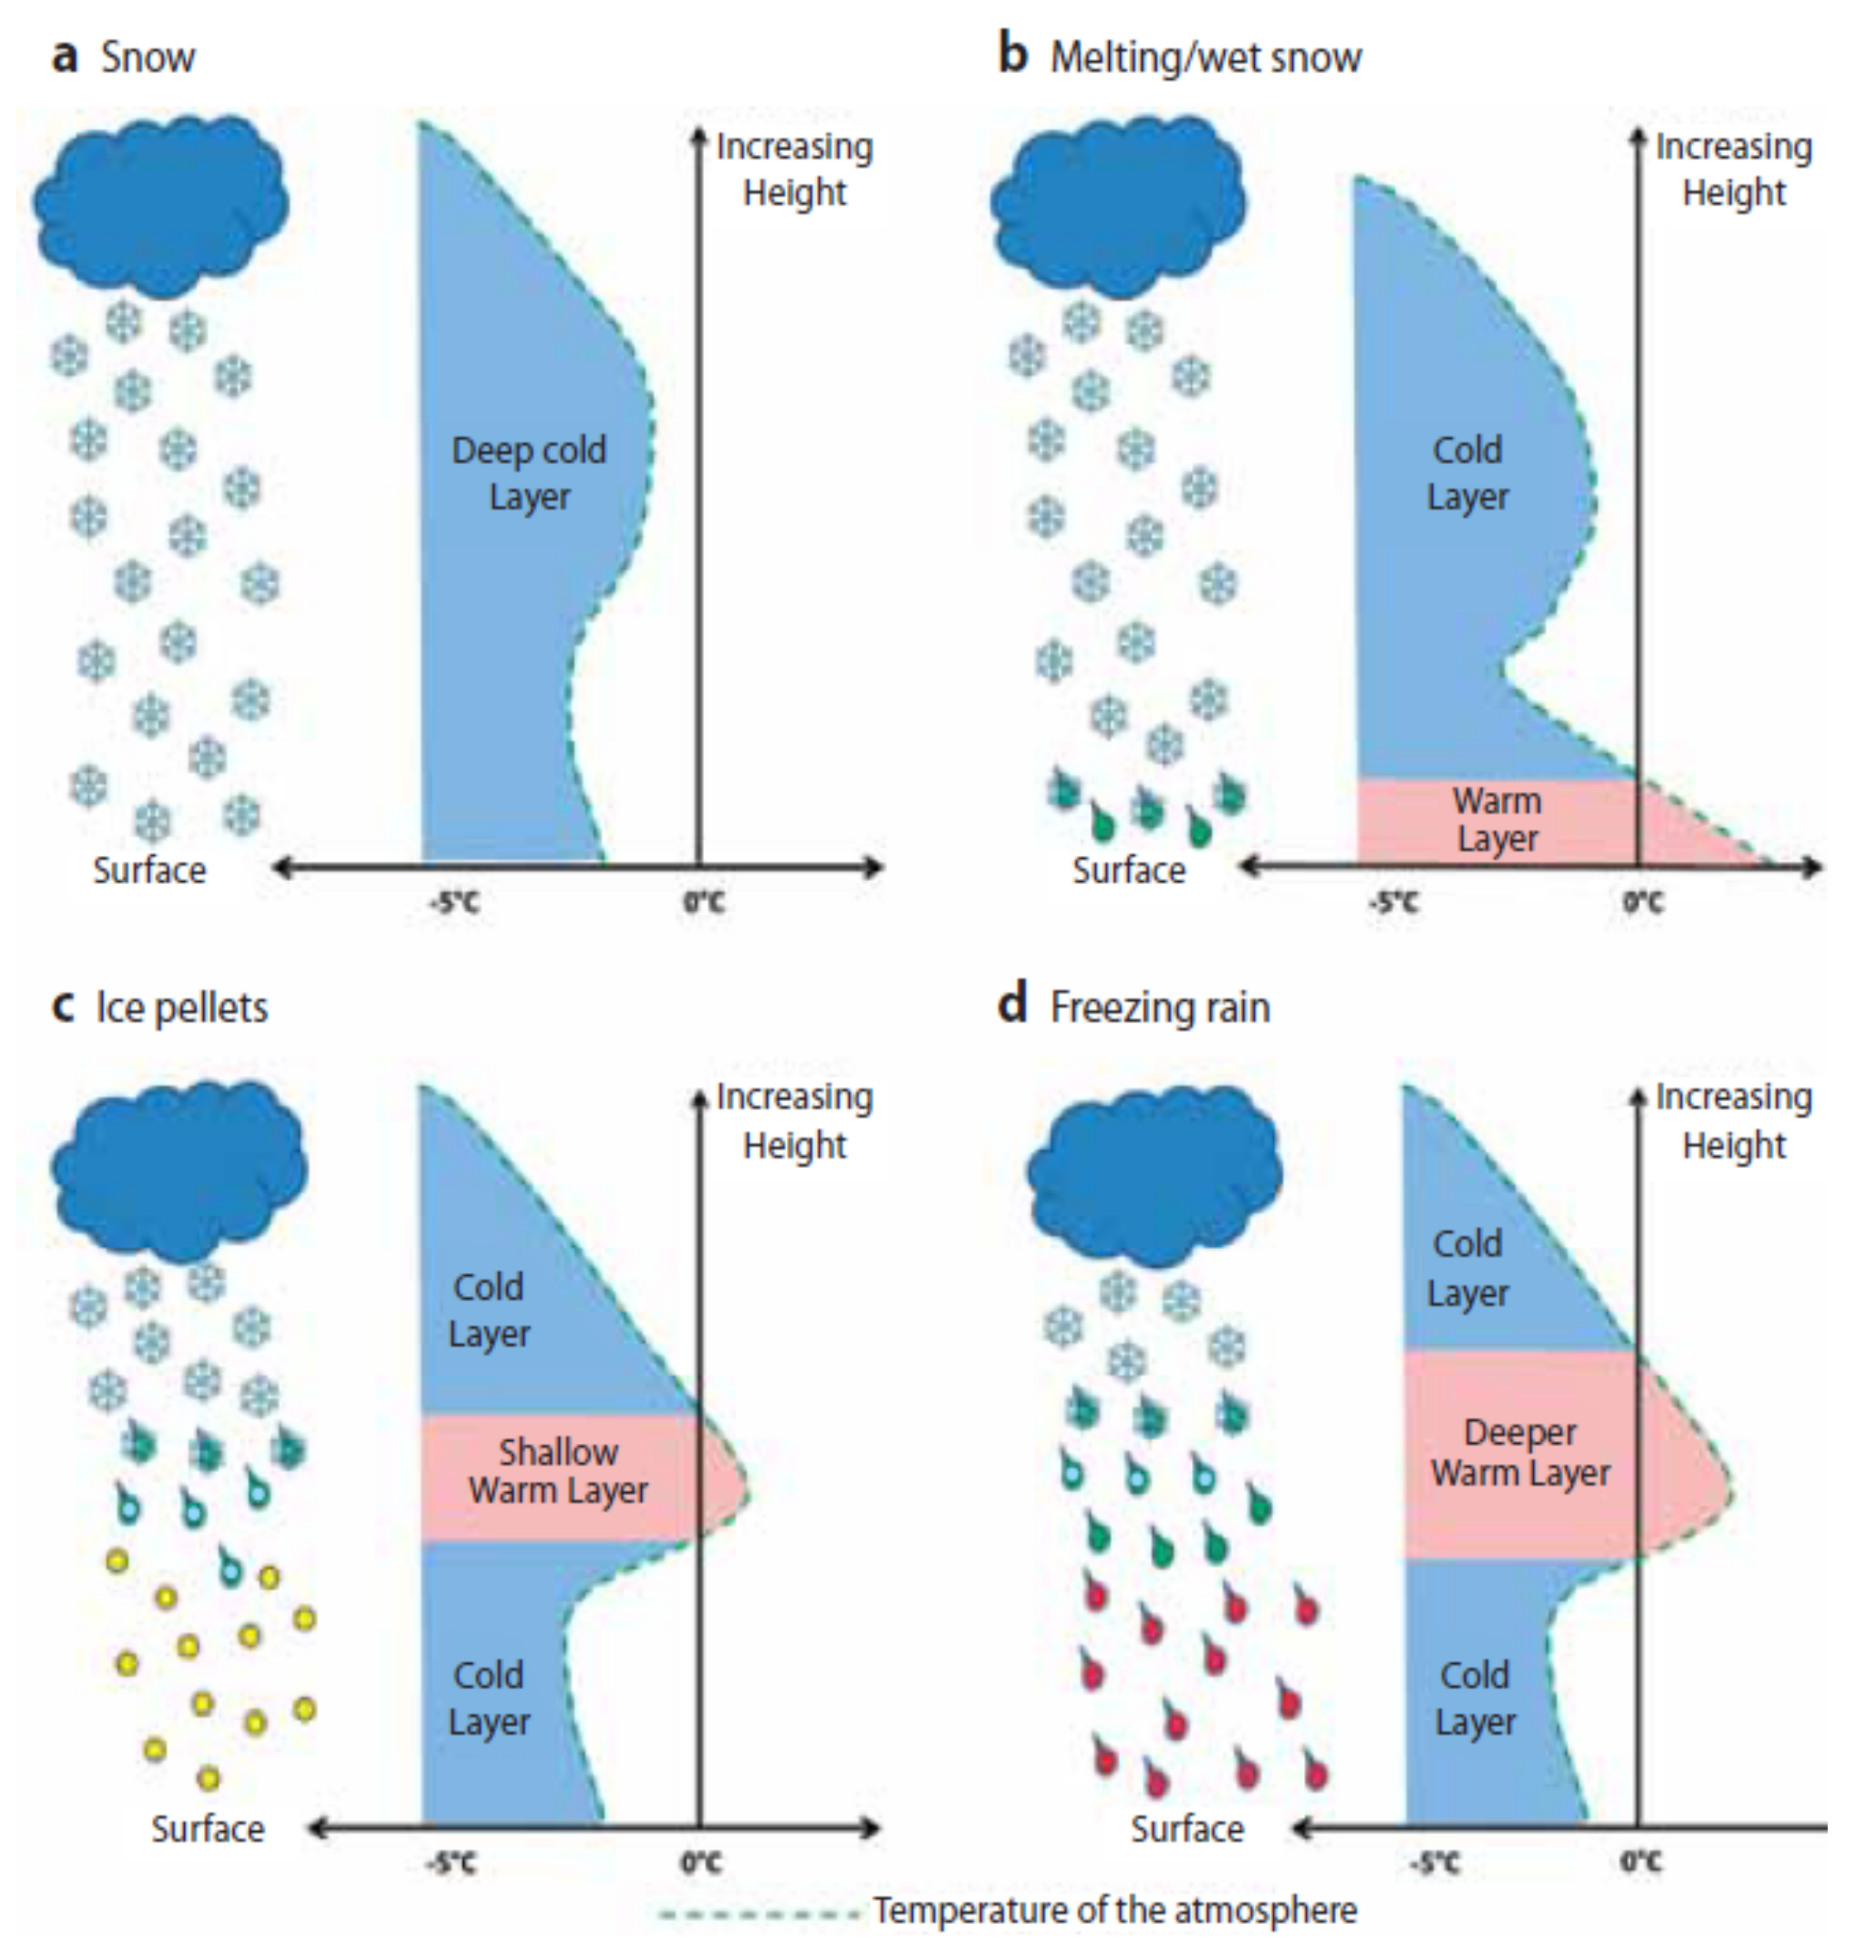
Figure 1 shows four different vertical structures, which lead to certain precipitation types [
1].
When the temperature is sub-zero at all levels, snow occurs. When there is a shallow layer near the surface with a temperature above 0 °C, where the snow particles are capable of melting partially, snowy rain evolves. Because of inversion, a melting layer can appear above the near-surface sub-zero layer. If this layer is thick and warm enough, the snow particles melt partially or completely, depending on the average temperature and thickness of the layer. In this case, freezing rain or ice pellets develop, depending on the thickness and temperature of the certain layers. When the cold layer above the surface is thick and cold enough, the drops refreeze and ice pellets occur. When the sub-zero layer is thin and the drops do not have enough time to refreeze, supercooled drops form and reach the surface [
1].
Diverse precipitation types typically occur during winter along warm fronts, when the warm airmass rises above a near-surface sub-zero layer. In such cases, the type of the precipitation can change from snow to freezing rain and ice pellets to rain within a few hundreds of kilometers [
1].
3. Prediction of Precipitation Type
In the last few decades, weather forecasters have elaborated on predicting precipitation type by experience and by applying statistical post-processing methods only. The point of the post-processing methods is to make weather predictions using raw model outputs completed by observational data and climate data [
5]. This is necessary because the raw outputs of the numerical weather prediction models are not always suitable for making them available for users. The users may need information about parameters which are not included in the raw model outcomes. The model resolution is not appropriate and it needs to be refined, or the raw computation results have systematic error. At the Hungarian Meteorological Service, a quite complex post-processing method [
6] has been used for applying to precipitation type for 15 years.
As a result of the intensive development of numerical weather prediction models in the last decade, it became possible to model the microphysical processes in the clouds; therefore, computations applying to precipitation type could be integrated into the physics of the models.
4. Forecast of Precipitation Type in ECMWF IFS Model
To determine the precipitation type on the surface, a model is required to forecast the amount of precipitation and the vertical temperature profile accurately, but it is also necessary to include the correct physics of the melting and refreezing processes. In November 2010, a new cloud scheme [
7] was introduced into the operational ECMWF model, so that rain and snow were included in the model as separate prognostic variables. The melting of snow above a wet-bulb temperature of 0 °C, refreezing below 0 °C, and the evaporation of precipitation were included in the model as parameters. With this model physics, in case of a temperature profile typical for freezing rain, the snow melts in the warm air, and then quickly refreezes at lower altitudes in the air with a temperature below freezing point, resulting in snow on the surface. Thus, in this model version, the processes leading to the formation of freezing rain were not described properly.
In 2015, in the newest version of cloud and precipitation parameterization [
1], the description of the process of freezing-rain formation in the elevated warm layer was modified. This version uses a more representative timescale for the refreezing of the raindrops, which depends on temperature, but mainly on whether the snowflakes melt completely or not. In case they completely melt by the time they reach the bottom of the melting layer, the process of refreezing is slow and supercooled droplets reach the surface. If the snowflakes do not melt completely, refreezing goes on quickly and ice pellets occur. Whether the precipitation refreezes in the lower cold layer or not, it has an influence on the temperature profile. If the droplets remain supercooled, the temperature of the layer will be lower, since in this case, the amount of heat that would be released during freezing is not released; instead, it is released when the supercooled droplets reach the ground, causing relative heating on and near the surface.
The model parametrizes melting and refreezing based on the prognostic variables for precipitation type: snow and rain. The type of precipitation is determined by the ratio of surface snow to rain and the precipitation and temperature profile above it.
4.1. Parametrization of the Melting Process
The rate of the melting of snow can be determined by thermal equilibrium, taking into account the release of latent heat during the melting and sublimation of snowflakes. When it is completed by the assumed droplet size distribution, the obtained melting rate is proportional to the difference in the wet-bulb temperature and the temperature of 0 °C. The complexity of microscale processes and the wide range of variability in the size of precipitation elements can be more easily represented using the effective melting timescale.
In the model, the melting process is parameterized by the cooling of the grid boxes containing falling snow to a wet-bulb temperature of 0 °C, which is caused by the latent heat during the melting over a timescale
t:
where
cp is the specific heat of water,
Lf is the latent heat of melting,
Tw is the wet-bulb temperature in °C, and
T0 equals 0 °C.
This parameterization includes the fundamental dependence on the difference in the temperature from the 0 °C temperature, the cooling effect of evaporation in the unsaturated air through the usage of the wet-bulb temperature, and the thickness of the melting layer through the relaxation time.
4.2. Parametrization of the Refreezing Process
If the warm layer is thin and most of the raindrops have a frozen core, they will refreeze suddenly when they enter the cold layer. The rate of refreezing is uncertain; it is currently parameterized with the same correlation and timescale as the melting process described above. During parameterization, an assumption is used that in order for the refreezing to occur rapidly, at least 20% of the falling precipitation mass must be in the phase of ice when it reaches the bottom of the warm layer. Otherwise, most of the raindrops do not contain a frozen core and refreezing goes on much more slowly. In the latter case, the rate of refreezing can be described using a longer timescale. Using this description, supercooled water droplets can freeze before they reach the surface if the layer near to the surface is very cold and/or thick.
If the 2 m temperature is below 0 °C, at least 80% of the mass of precipitation is in a liquid state at the bottom of the melting layer and at least 20% of it reaches the surface as supercooled water droplets; the model indicates freezing rain. If the ratio of precipitation in the ice phase is between 20% and 80% by weight at the bottom of the warm layer, the predicted precipitation type is ice pellet, and otherwise, snow. According to the new model physics, reduced refreezing in freezing-rainy regions leads to relative cooling in the lower troposphere (no latent heat released during freezing) and a warming of the soil and the near-surface layer, as the latent heat that would be released during the process of refreezing is transported to the surface.
The formulas described for the rate of melting and refreezing and the use of the chosen thresholds are significant simplifications of complex processes that need to be improved in the future, but these formulas contain the most important characteristics of melting and refreezing of precipitation.
5. Brief Summary of the Implemented Developments
In the course of our work, we developed various types of visualizations to support the interpretation of ensemble precipitation type forecasts. These new visualization types can help synoptic experts in their decision making. In this chapter, we briefly present these developments.
At the Hungarian Meteorological Service, a new, locally developed diagram type (
Figure 2) has been operatively used since 2015 [
8] which depicts the probability of occurrence of each precipitation type based on ensemble forecasts, at different forecast times for a given geographic location [
9].
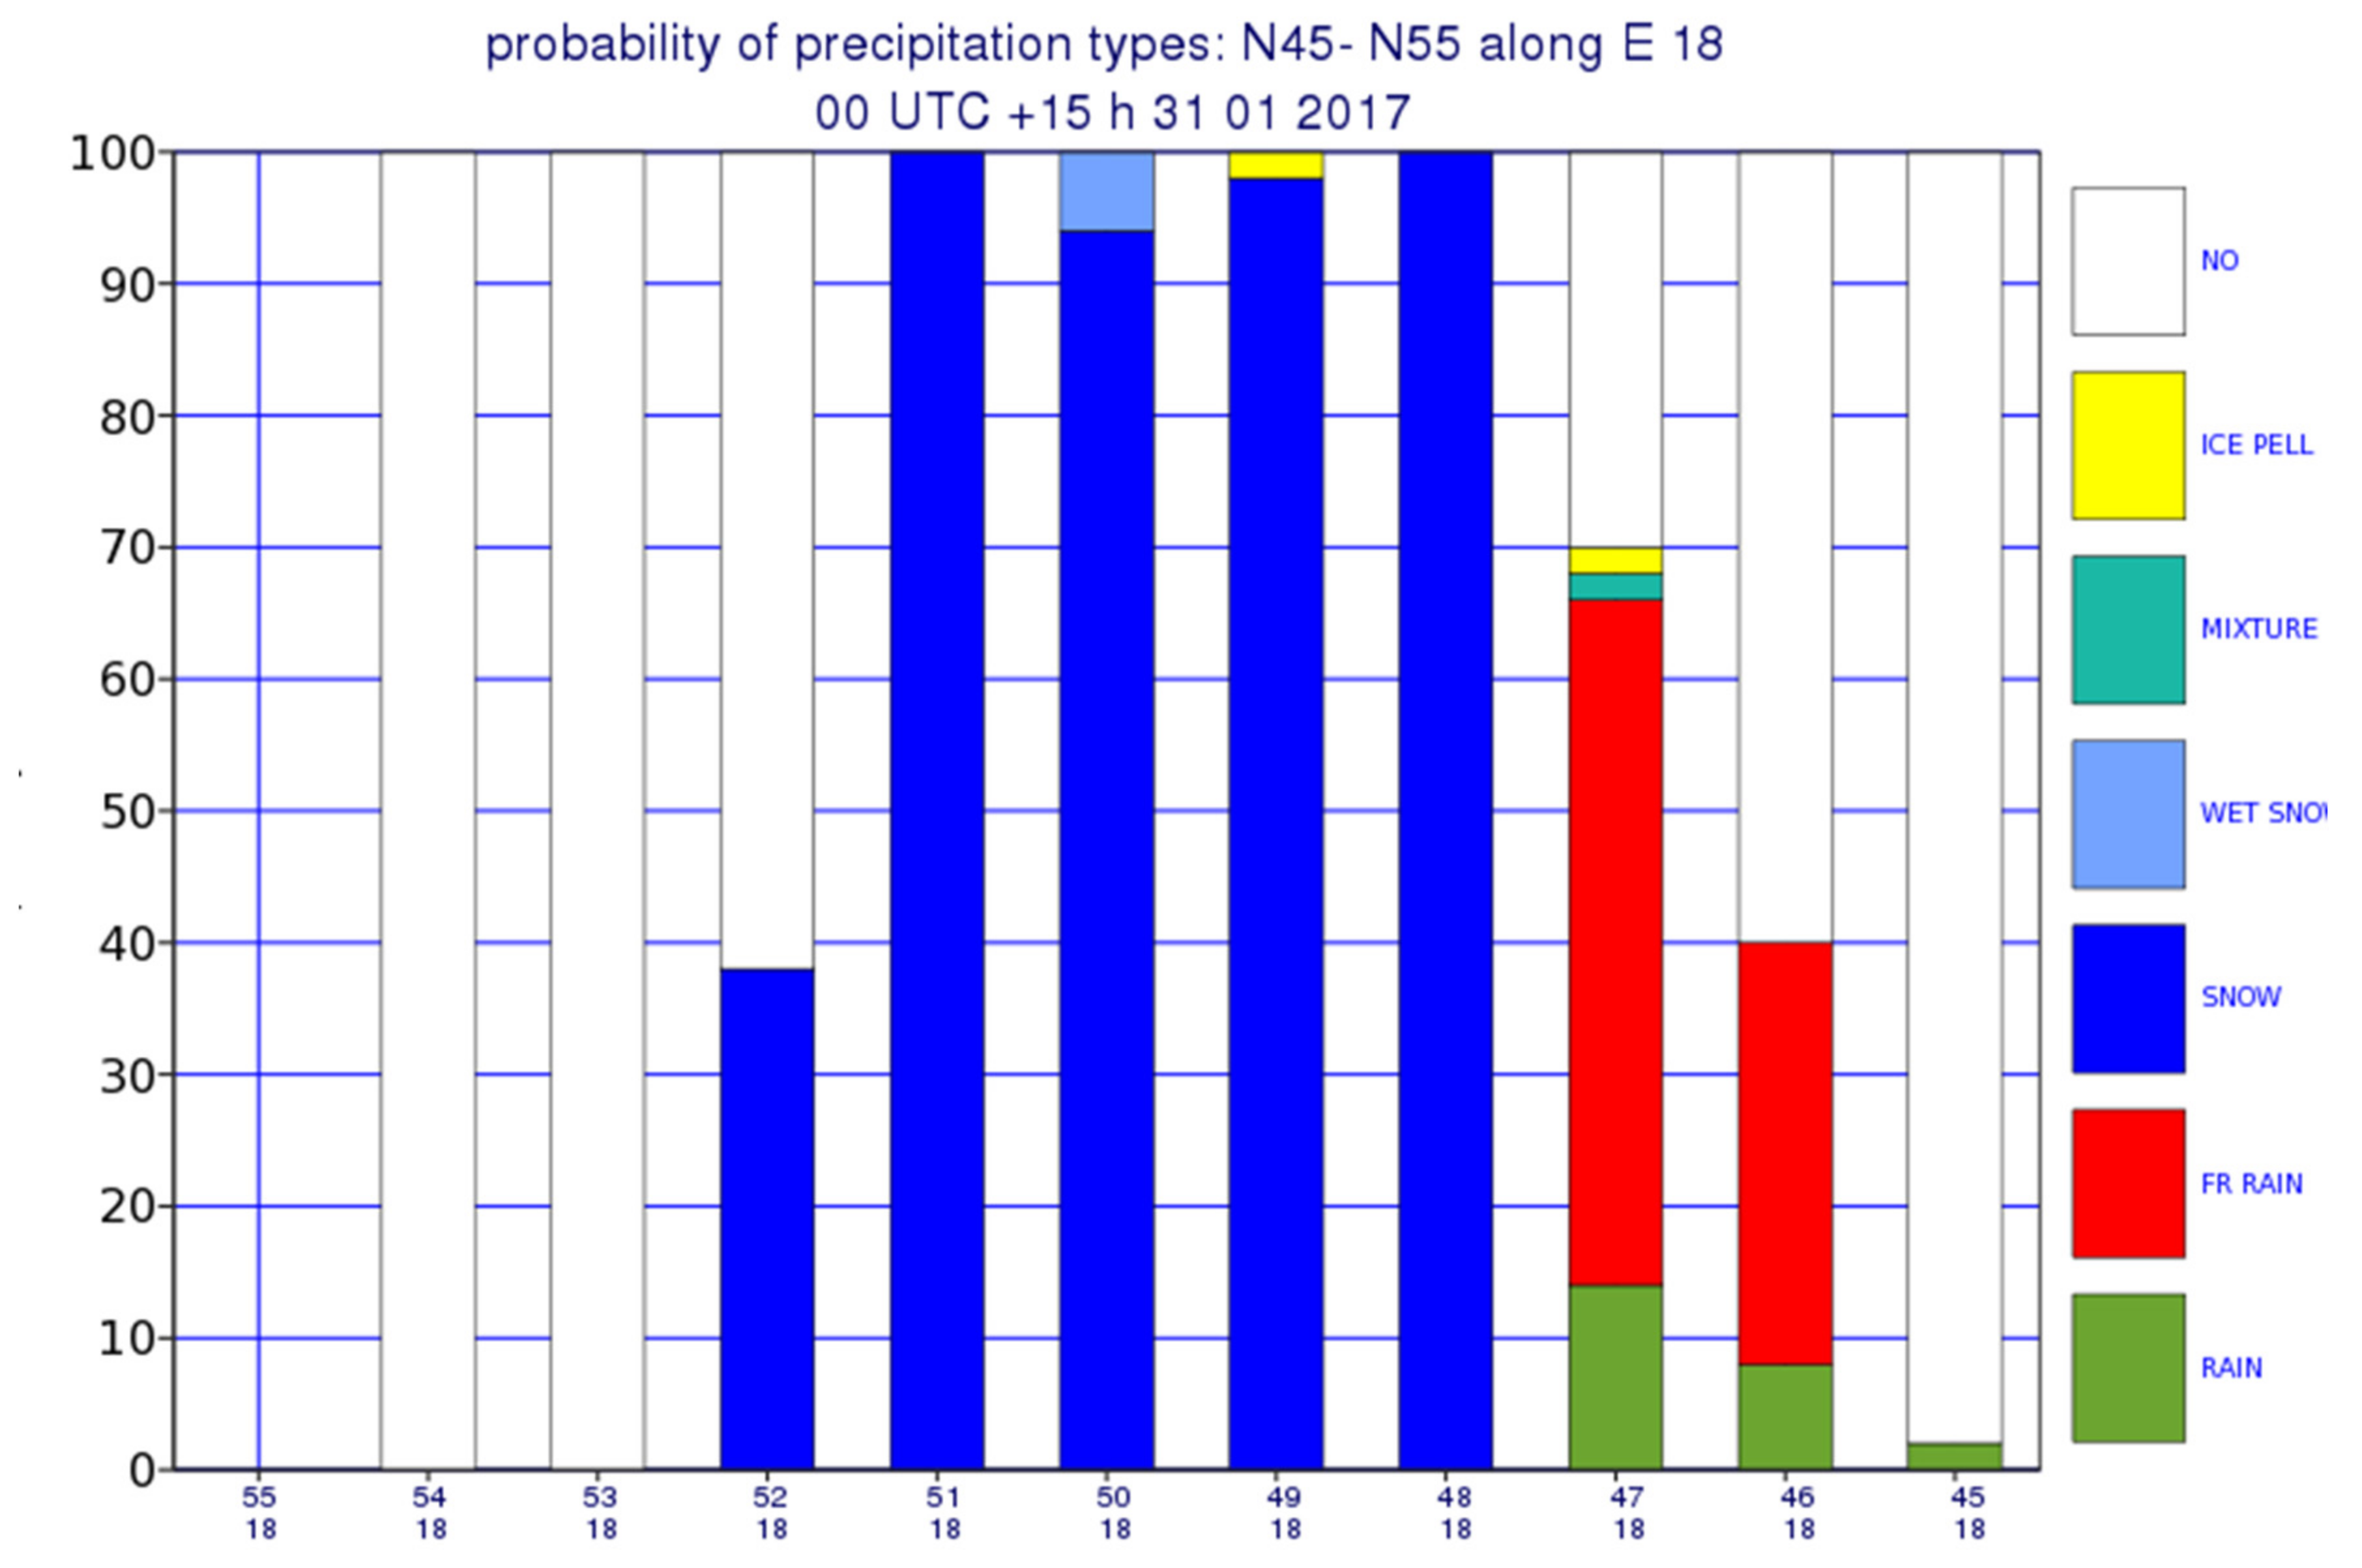
5.1. Arbitrary Geographic Section
Based on this type of diagram, we developed a new display format that shows the probability of occurrence of each precipitation type along an optionally selected geographic section for a given time [
10].
Figure 3 shows the probability of the occurrence of various precipitation types along the line of longitude 18° E which runs across Hungary.
5.2. Visualization per Ensemble Cluster in Graph Form
To support the monitoring of precipitation type probabilities per cluster, we also created a visualization product that displays the probabilities at a given geographic location for each ensemble cluster. An ensemble-clustering method was developed at the Hungarian Meteorological Service [
11]. Thus, the probabilities could be examined separately according to the potentially forthcoming weather systems [
11].
5.3. Combined Visualization of the Precipitation Type Probabilities on Map
We also developed a method for the joint mapping of the probabilities of precipitation types predicted by the ensemble technique. We display each of these types with a different color, and the shades within a color provide information about the probability of the occurrence of the given type. The probability information about a given precipitation type is displayed above an arbitrarily set threshold.
Figure 4 shows the probability distribution of each precipitation type based on an ensemble forecast for 17 March 2018 15 UTC. Precipitation types only appear on the map if there is a probability of occurrence stronger than 30%.
6. Objective Verification
Interest in verification techniques on precipitation has shown an increasing trend in the last two decades [
12,
13]. Besides the subjective verification of the model through a case study, we also performed an objective verification of the deterministic and ensemble precipitation type forecasts. Three-hourly manual SYNOP observations were used for the verification. Since the horizontal resolution of the model increased significantly in March 2016 [
14,
15], we dealt with the winters of 2016/2017 and 2017/2018 in detail.
6.1. Success Rate Chart
We looked at how the percentage of successful precipitation type forecasts changed depending on the forecast period up to +72 h.
Figure 5 shows this rate for predictions from the ensemble control forecast at 00 UTC in the analysis for winter 2017/2018. In all cases, there was a slight diurnal fluctuation in the success rates; however, no trend for declining forecast accuracy can be seen in our data. The amplitude of fluctuation was larger in the winter of 2017/2018. The forecast accuracy fluctuated between 70% and 90% in the winter of 2016/2017 (not shown), and between 65% and 85% in the winter of 2017/2018.
6.2. Verification of Precipitation Types from Ensemble Control Forecasts
In cases of failed forecasts, we also investigated the relationship between the observed precipitation types and the precipitation types coming from ensemble control forecasts. As
Figure 6 and
Figure 7 show, in cases of predicted rain and snow, freezing rain occurred frequently, whereas in many cases, predicted rain was followed by observed freezing rain or snow. When the model incorrectly predicted freezing rain or snowy rain, the observations typically showed snow or rain, with rain being the more frequent of the two. There was a difference between the two winters: in the winter of 2016/2017, in the case of erroneously forecasted snow, freezing rain most frequently occurred in reality, while in 2017/2018, most of the time, snowfall occurred in such cases. The reason for the difference between the two winters probably lies in the different temperature and precipitation conditions. There was no noticeable tendency in the forecast accuracy of the precipitation type that depends on the forecast period.
6.3. Verification of Precipitation Types from Ensemble Forecasts
Many methods can be applied for ensemble verification; one of them is the relative operating characteristics (ROC) diagram [
12]. In our study, we used it to verify the precipitation type forecasts.
The scores represented in the ROC diagram (hit rate and false-alarm rate) are computed from the contingency table (
Table 1) giving the number of observed occurrences or non-occurrences of an event as a function of the forecast occurrences of that event.
Hit Rate shows what proportion of observed events were correctly predicted:
while
False-Alarm Rate shows the proportion of the not observed events that were incorrectly predicted as occurred:
In case of ensemble forecasts, the probability values are transformed into categorical yes/no forecasts by using thresholds varying from 0% to 100%. For the ROC diagram, hit rates and false-alarm rates are computed for each probability interval (N bins), giving N points on the graph of hit rate (vertical axis) against false-alarm rate (horizontal axis). The curve, by definition, passes through the points (0, 0) and (1, 1). The closer the curve lies toward the upper-left corner, the better the forecast skill is. No skill forecast is indicated by a diagonal line (hit rate = false-alarm rate). The ROC score is the area below the ROC curve. The closer the ROC score to 1, the better the forecast. A no-skill forecast has an ROC score of 0.5.
Figure 8 shows ROC diagrams of rain, snow, and freezing-rain forecasts of the winter of 2016/2017 for different timesteps between +12 and +60 h. The most conspicuous feature in the figure is that in cases of snow and rain, the curve lies to the left of the diagonal line at every timestep, while in cases of freezing rain, the curve may lie to the right of the diagonal line, which means that the proportion of false alarms is higher than the proportion of hits. In cases of rain and snow, there is no observable tendency in the performance of the forecast depending on the forecast period. In cases of freezing rain, a diurnal cycle can be found, i.e., the performance ensemble model launched at 00 UTC is better for daytime than nighttime.
7. Case Study: Freezing Rain on 17 March 2018
On the 17 March 2018, cold polar air reached Hungary from the northeast. This cold air, combined with the moist air mass of a Mediterranean cyclone, was responsible for the weather in the country (
Figure 9). At first, rain occurred from the southwest. Later, in the northern part of the country, the rain changed into snow. At night, mainly snow was observed, but in the eastern part of the country, freezing rain occurred as well. In the morning, the intensity of precipitation definitely decreased, and snow occurred only in northern Hungary.
The formation of freezing rain in this situation happened in an unusual way. Usually, warm air gliding over the cold air causes melting of the ice crystals at higher altitudes and then their refreezing or supercooling at lower levels, whereas in this case, the previously positive temperature area near the surface was cooled by the inflow of cold air, leading to inversion and causing the supercooling of droplets that entered the cold layer. As the initially positive temperature of the surface cooled below 0 °C over a long period of time, freezing rain was not critical. By the time the surface cooled below 0 °C, the cold air had filled the atmosphere to a sufficient height, meaning the evolved ice crystals did not enter a layer warmer than 0 °C and reached the surface in snow form.
The prediction of the deterministic model for the temperatures at various altitudes clearly shows the arrival of the cold airmass from the northeast, the initial near-surface cooling, and the expansion of the cold air. Cooling was predicted to be slower, as when the air temperature was already below 0 °C in a thick layer, the temperature of the upper layer of the soil was still above 0 °C.
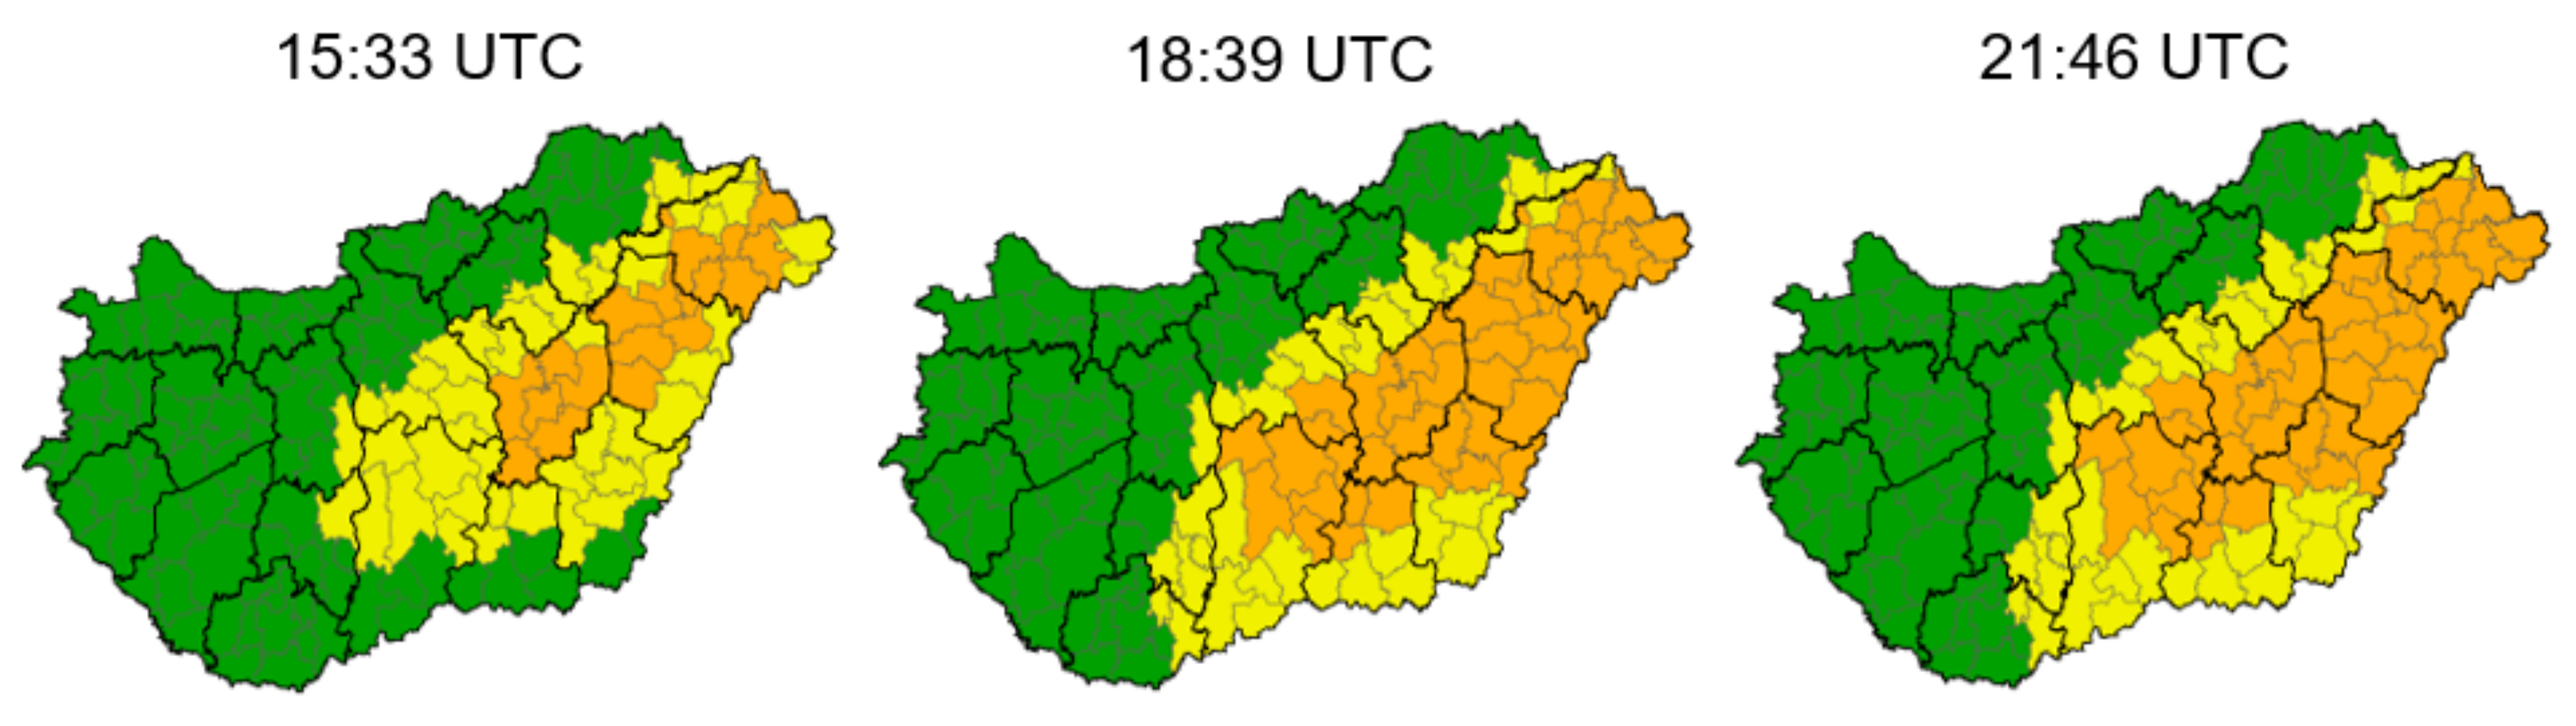
In the afternoon and night of 17 March 2018, the Hungarian Meteorological Service issued first- and second-level warnings on freezing rain for a big part of the Great Hungarian Plain (
Figure 10). The alarm area expanded to a north–south direction over time.
The probability maps made from the ECMWF model precipitation type forecast clearly show the high probability of freezing rain in the eastern part of the country and snowfall in the north. The fact that the cold air filled the atmosphere in an ever-thicker layer increased the probability of snow in an ever-larger area and decreased the probability of freezing rain (
Figure 11).
This spatial distribution can also be discovered by looking at meteograms for different cities together. Based on these graphs, it can be said that in the model forecast, the potential of high probability of freezing rain in the Great Plain appeared well in advance, while in the northern part of the country, the rain immediately turned to snow (
Figure 12).
Examining the probability charts made at different times along a line of longitude which runs across the eastern part of the Great Plain (21° E), snow can be noticed in the north due to cooling caused by cold air coming from the northeast. The temporary extension of the expected freezing-rainy area and its latter decrease with increasing snow probability can also be observed on these charts (not shown).
In operational practice, ensemble temperature plumes at selected standard pressure levels have been used for more than 20 years at the Hungarian Meteorological Service. Forecasters cannot obtain the full information from the current vertical structure of the atmosphere, so in 2011, a new method was developed for displaying the full set of 51 ensemble members in the vertical [
16]. The method uses all model level information in the vertical. At that time, the ensemble model contained 62 levels; during our study, it contained 91 levels. Since 2021, the ensemble model has had the same number of levels as the high-resolution model, i.e., 137 levels [
17]. Using all of the model level information can represent quite well the physical processes in the boundary layers, so it is beneficial to study the ensemble vertical profile in the case of a winter inversion situation too. The usefulness of the Hungarian developments is shown by the fact that the ensemble vertical profile was operatively introduced into the ECMWF ecCharts display system in 2018 [
18].
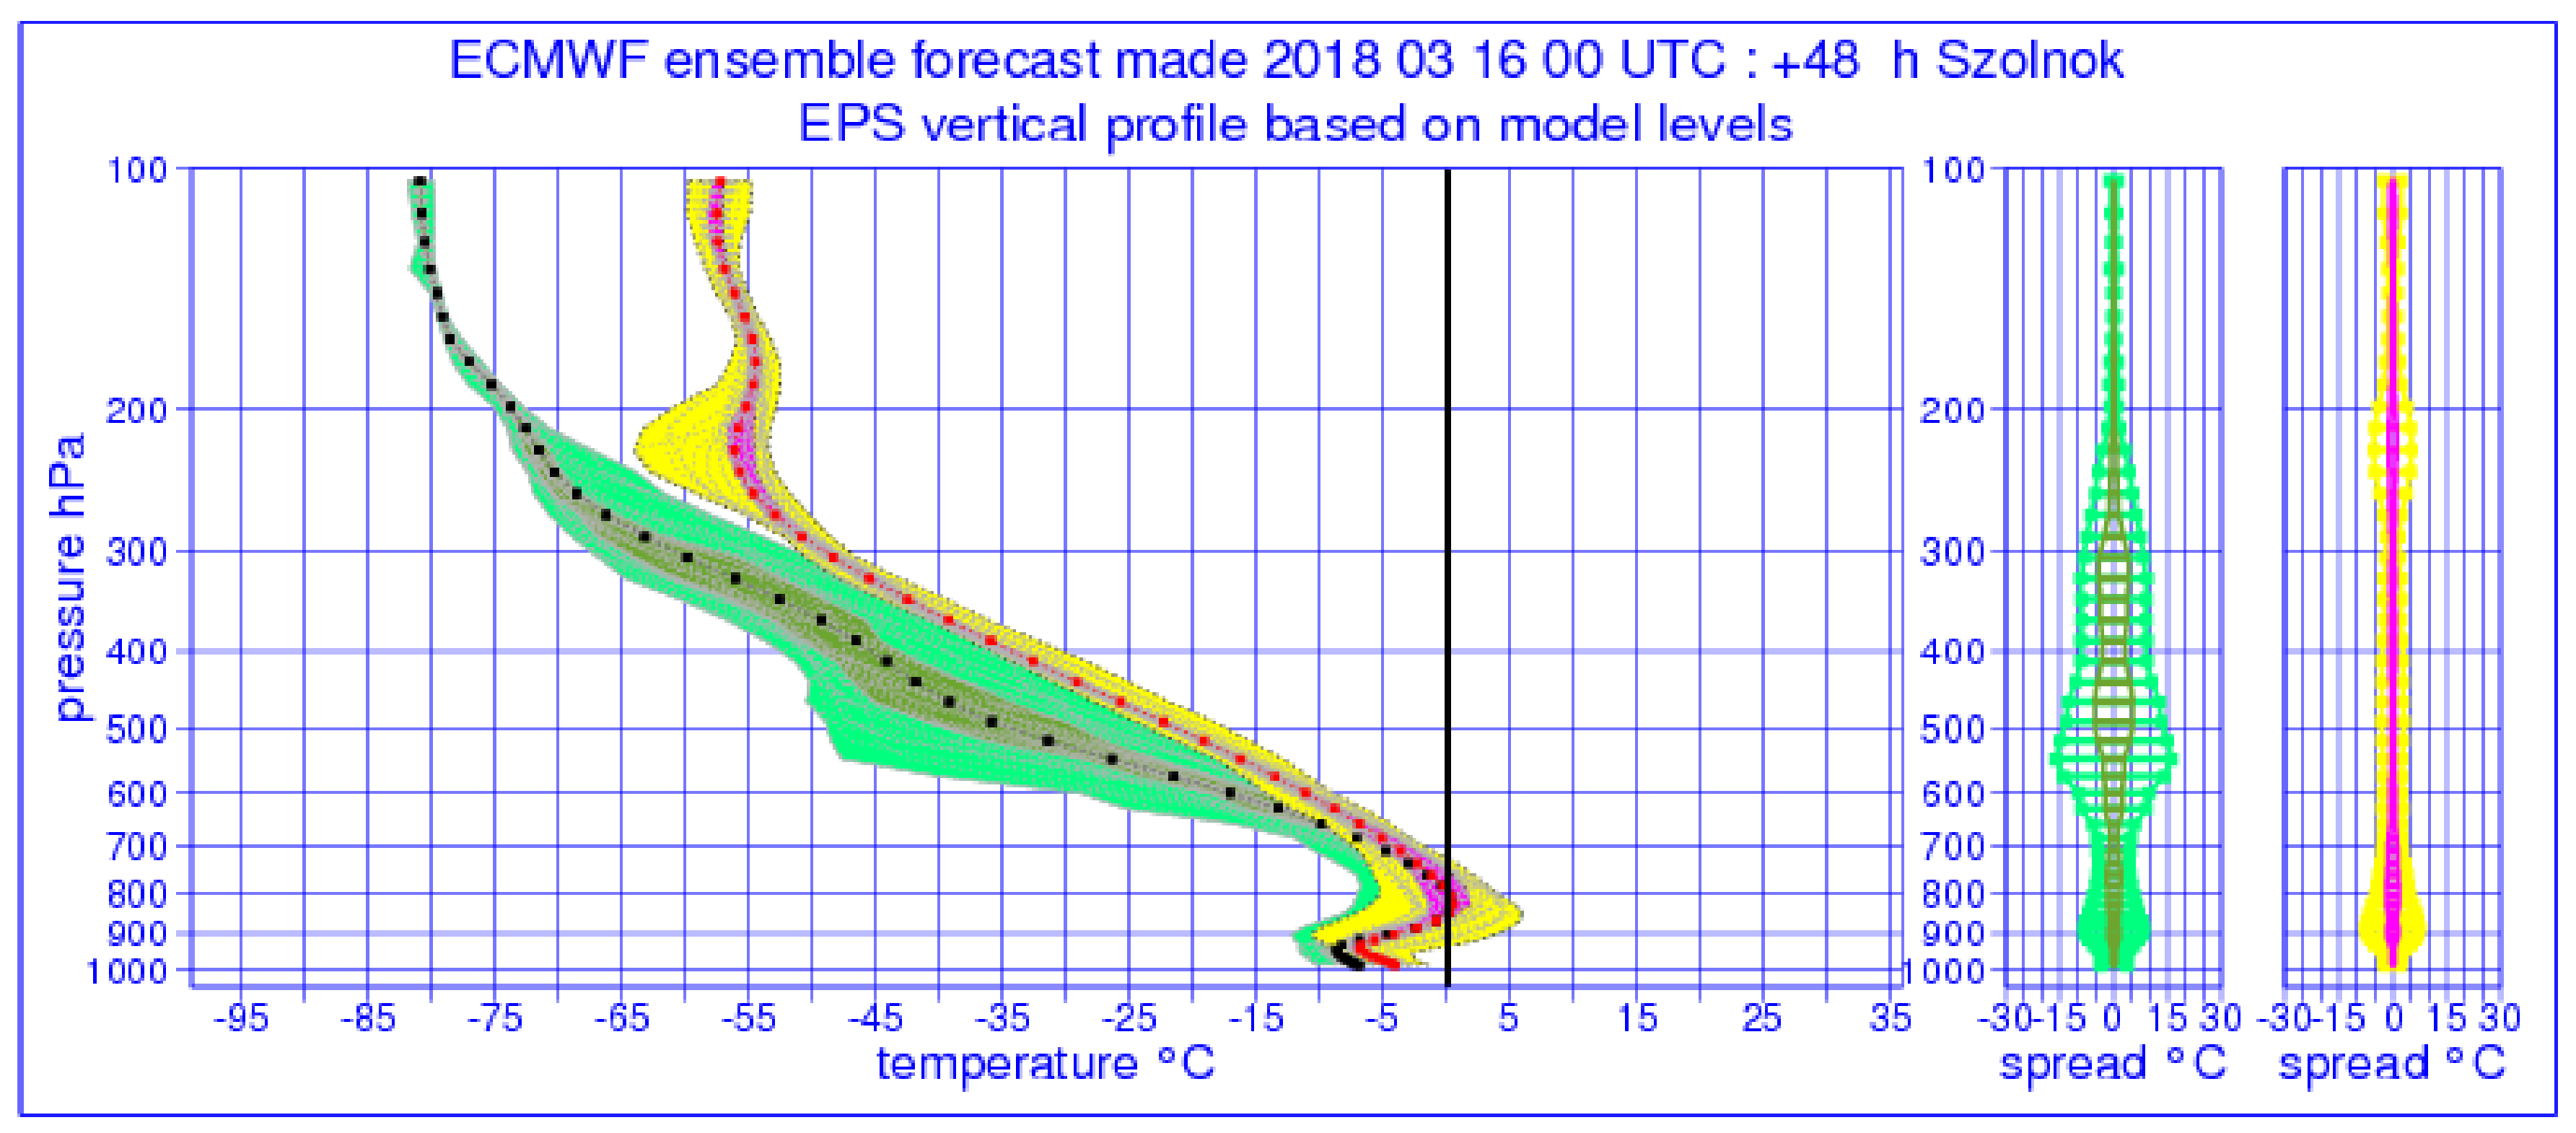
It can also be discovered that the probability maps match the ensemble vertical profile well, as in Miskolc, where snow was the most likely precipitation type and the temperature was characteristically sub-zero at all levels, while in Szolnok, where freezing rain was probable, an inversion appeared in the vertical profile with temperature values around 0 °C (
Figure 13).
Based on the diagrams for Szolnok, depicted at different precipitation intensity thresholds, it can be said that in the area of Szolnok, intensive freezing rain and light snowfall were probable in the examined period (
Figure 12).
8. Conclusions
In the course of this work, we examined the new ECMWF precipitation type ensemble forecasts which were introduced in 2015. The work was concentrated in two groups. We aimed to conduct an investigation of ensemble precipitation type forecasts for the territory of Hungary. In the first part of the work, a few visualization forms showed, namely, an ensemble meteogram of precipitation types for the selected location, an arbitrary geographic section for ensemble precipitation types, and a combined visualization of precipitation type probabilities on a map.
In second part of our work, we performed an objective verification of single-ensemble-control forecasts and 51-member ensemble forecasts too. We performed objective verification for the three winters (2015/2016, 2016/2017, and 2017/2018).
Based on both objective and subjective verification through some case studies, we can state that a precipitation type forecast is a useful product and can be a great help for early warning in dangerous weather situations. In decision making, it is highly advisable to use ensemble products. However, it is not appropriate to rely solely on this variable in decision making. Other parameters such as near-surface temperature maps, 0 °C elevation maps, and the ensemble vertical profile should be examined in a complex way.
The usefulness of the Hungarian developments is shown by the fact that at the end of 2017, the point and map probability visualization forms for precipitation type were operatively introduced into the ECMWF ecCharts display system [
19]. The authors of this article presenting the new products highlight that their work was inspired by similar developments at the Hungarian National Meteorological Service [
16].
Author Contributions
Conceptualization, I.I. and D.C.; methodology, I.I.; software, I.I.; validation, D.C. and I.I.; formal analysis, D.C. and I.I.; investigation, D.C. and I.I.; resources, I.I.; data curation, I.I.; writing—original draft preparation, D.C.; writing—review and editing, D.C. and I.I.; visualization, D.C. and I.I.; supervision, I.I.; project administration, I.I.; funding acquisition, no funding. All authors have read and agreed to the published version of the manuscript.
Funding
This research received no external funding.
Data Availability Statement
ECMWF IFS model data was able to use by dedicated registered users of co-operating states. Hungarian observed precipitation data was able to use by dedicated employees of the Hungarian Meteorological Service.
Conflicts of Interest
The authors declare no conflict of interest.
References
- Forbes, R.; Tsonevsky, I.; Hewson, T.; Leutbecher, M. Towards predicting high-impact freezing rain events. ECMWF Newsl. 2014, 141, 15–21. [Google Scholar]
- Owens, R.G.; Hewson, T.D. ECMWF Forecast User Guide. Available online: https://www.ecmwf.int/en/elibrary/16559-ecmwf-forecast-user-guide (accessed on 22 June 2022).
- Vannitsem, S.; Bremnes, J.B.; Demaeyer, J.; Evans, G.R.; Flowerdew, J.; Hemri, S.; Lerch, S.; Roberts, N.; Theis, S.; Atencia, A.; et al. Statistical postprocessing for weather forecasts: Review, challenges, and avenues in a big data world. Bull. Am. Meteorol. Soc. 2021, 102, E681–E699. [Google Scholar] [CrossRef]
- Forbes, R.; Tompkins, A.; Untch, A. A new prognostic bulk-microphysics scheme for the IFS. ECMWF Tech. Memo. 2011, 649, 28. [Google Scholar]
- Gascón, E.; Hewson, T.; Haiden, T. Improving predictions of precipitation type at the surface: Description and verification of two new products from the ECMWF ensemble. Weather Forecast. 2017, 33, 89–108. [Google Scholar] [CrossRef]
- Hirsch, T. Forecasts and Investigation of Weather Situations Causing Heavy Precipitation in Hungary in Winter (in Hungarian). Ph.D. Thesis, Eötvös Loránd University, Budapest, Hungary, 2008; p. 86. [Google Scholar]
- Forbes, R.; Tompkins, A. An improved representation of cloud and precipitation. ECMWF Newsl. 2011, 129, 13–18. [Google Scholar]
- Ihász, I.; Fehér, B.; Fischer, A. Application and Verification of ECMWF Products, 2016—Hungary. In Green Book 2016; ECMWF: Budapest, Hungary, 2016; p. 10. Available online: https://www.ecmwf.int/en/elibrary/16630-application-and-verification-ecmwf-products-2016-hungary (accessed on 22 June 2022).
- Cséke, D. Estimation of Precipitation Type Based on ECMWF Ensemble Model (in Hungarian). Master’s Thesis, Eötvös Loránd University, Budapest, Hungary, 2018; p. 43. [Google Scholar]
- Cséke, D.; Ihász, I. Predictability of precipitation type based on ECMWF ensemble forecasts. In Proceedings of the EGU General Assembly, Session HS7.2/AS1.17/CL2.06/NH1.17/NP5.4, Precipitation Modelling: Uncertainty, Variability, Assimilation, Ensemble Simulation and Downscaling, Vienna, Austria, 8–13 April 2018. [Google Scholar]
- Ihász, I. Experiments of clustering for central European area especially in extreme weather situations. In Proceedings of the Ninth ECMWF Workshop on Meteorological Systems, Reading, UK, 10–14 November 2003; pp. 112–116. [Google Scholar]
- Nurmi, P. Recommendations on the verification of local weather forecasts. ECMWF Tech. Memo. 2003, 430, 18. [Google Scholar]
- Jolliffe, I.T.; Stephenson, D.B. Forecast Verification: A Practitioners Guide in Atmospheric Science; Wiley: New York, NY, USA, 2011; p. 240. [Google Scholar]
- Hólm, E.; Forbes, E.; Lang, S.; Magnusson, L.; Malardel, S. New model cycle brings higher resolution. ECMWF Newsl. 2016, 147, 14–19. [Google Scholar]
- Malardel, S.; Wedi, N.; Deconick, W.; Diamantakis, M.; Kuehnlein, C.; Mozdynski, G.; Hamrud, M.; Smolarkiewicz, P. A new grid for the IFS. ECMWF Newsl. 2016, 146, 23–27. [Google Scholar]
- Ihász, I.; Tajti, D. Use of ECMWF’s ensemble vertical profiles at the Hungarian Meteorological Service. ECMWF Newsl. 2011, 129, 29. [Google Scholar]
- Rodwell, M.; Diamantakis, M.; Düben, P.; Janoušek, M.; Lang, S.; Polichtchouk, I.; Prates, F.; Roberts, C.; Váňa, F. IFS upgrade privdes more skilful ensemble forecasts. ECMWF Newsl. 2021, 168, 18–23. [Google Scholar]
- Sahin, C.; Hewson, T.; Lamy-Thépaut, S.; Tsonevsky, I.; Modigliani, U.; Richardson, D. Using ECMWF’s new ensemble vertical prodiles. ECMWF Newsl. 2018, 156, 37–42. [Google Scholar]
- Gascón, E.; Hewson, T.; Sahin, C. New meteogram and map ecCharts products for precipitation type probabilities. ECMWF Newsl. 2018, 154, 2–3. [Google Scholar]
Figure 1.
Vertical temperature profiles for various precipitation types (source: ECMWF Newsletter No. 141, Autumn 2014, reproduced with ECMWF’s permission).
Figure 1.
Vertical temperature profiles for various precipitation types (source: ECMWF Newsletter No. 141, Autumn 2014, reproduced with ECMWF’s permission).
Figure 2.
The temporal evolution of the instantaneous precipitation type probabilities for Budapest based on ECMWF ensemble forecast at 00 UTC 31 January 2018.
Figure 2.
The temporal evolution of the instantaneous precipitation type probabilities for Budapest based on ECMWF ensemble forecast at 00 UTC 31 January 2018.
Figure 3.
Meridional section for probabilities of the precipitation along 18 eastern longitudes between 45 and 55 degrees north for timestep +15 h of ECMWF ensemble forecast at 00 UTC 31 January 2017.
Figure 3.
Meridional section for probabilities of the precipitation along 18 eastern longitudes between 45 and 55 degrees north for timestep +15 h of ECMWF ensemble forecast at 00 UTC 31 January 2017.
Figure 4.
Precipitation type probability chart based on ECMWF ensemble forecast for 00 UTC + 15 h 31 January 2017 (rain—green, snowy rain—turquoise, snow—navy, wet snow—cyan, freezing rain—magenta; values in percentages).
Figure 4.
Precipitation type probability chart based on ECMWF ensemble forecast for 00 UTC + 15 h 31 January 2017 (rain—green, snowy rain—turquoise, snow—navy, wet snow—cyan, freezing rain—magenta; values in percentages).
Figure 5.
Success rate of the precipitation type forecast from ensemble control model based at 00 UTC run (+12, +15, …, +72 h).
Figure 5.
Success rate of the precipitation type forecast from ensemble control model based at 00 UTC run (+12, +15, …, +72 h).
Figure 6.
Observed precipitation types in cases of failed ECMWF ensemble control forecasts in the winter of 2016/2017 (green: rain, dark blue: snow, red: freezing rain, light blue and brown: snowy rain) 00 UTC +12, +15, …, +72 h.
Figure 6.
Observed precipitation types in cases of failed ECMWF ensemble control forecasts in the winter of 2016/2017 (green: rain, dark blue: snow, red: freezing rain, light blue and brown: snowy rain) 00 UTC +12, +15, …, +72 h.
Figure 7.
Observed precipitation types in cases of failed ECMWF ensemble control forecasts in the winter of 2017/2018 (green: rain, dark blue: snow, red: freezing rain, light blue and brown: snowy rain) 00 UTC +12, +15, …, +72 h.
Figure 7.
Observed precipitation types in cases of failed ECMWF ensemble control forecasts in the winter of 2017/2018 (green: rain, dark blue: snow, red: freezing rain, light blue and brown: snowy rain) 00 UTC +12, +15, …, +72 h.
Figure 8.
Relative operating characteristics diagrams for rain (green), freezing rain (magenta), and snow (blue) at time steps +12, +24, +36, +48, and +60 h for winter of 2016/2017 based on ECMWF ensemble forecasts. (x-axis: false-alarm rate, y-axis: hit rate).
Figure 8.
Relative operating characteristics diagrams for rain (green), freezing rain (magenta), and snow (blue) at time steps +12, +24, +36, +48, and +60 h for winter of 2016/2017 based on ECMWF ensemble forecasts. (x-axis: false-alarm rate, y-axis: hit rate).
Figure 9.
Synoptic situation at 00 UTC on 17 March 2018 (source: met.hu, publicly available). Abbreviations belonging to pressure centers are in Hungarian: M means anticyclone (high pressure), A means cyclone (low pressure).
Figure 9.
Synoptic situation at 00 UTC on 17 March 2018 (source: met.hu, publicly available). Abbreviations belonging to pressure centers are in Hungarian: M means anticyclone (high pressure), A means cyclone (low pressure).
Figure 10.
Warnings on freezing rain issued by the Hungarian Meteorological Service at 15:33, 18:39, and 21:46 UTC on 17 March 2018. Green (no warning), yellow (first-level warning): slight freezing rain; the predicted amount of precipitation is a few tenths of a millimeter (>0.1 mm). Orange (second-level warning): freezing rain lasts for several hours; the predicted amount of precipitation exceeds 1 mm (source: met.hu, publicly available).
Figure 11.
Precipitation type probability chart based on ECMWF ensemble forecast for 00 UTC +48, +54 h 16 March 2018 (rain—green, ice pellet—violet, snowy rain—turquoise, snow—navy, wet snow—cyan, freezing rain—magenta; values in percentages).
Figure 11.
Precipitation type probability chart based on ECMWF ensemble forecast for 00 UTC +48, +54 h 16 March 2018 (rain—green, ice pellet—violet, snowy rain—turquoise, snow—navy, wet snow—cyan, freezing rain—magenta; values in percentages).
Figure 12.
The temporal evolution of the instantaneous precipitation type probabilities for Szolnok based on ECMWF ensemble forecast at 00 UTC 16 March 2018.
Figure 12.
The temporal evolution of the instantaneous precipitation type probabilities for Szolnok based on ECMWF ensemble forecast at 00 UTC 16 March 2018.
Figure 13.
ECMWF ensemble vertical profiles for Szolnok 00 UTC +48 h 16 March 2018 (dewpoint temperature—green: 0–100% probability, avocado: 25–75% probability; temperature—yellow: 0–100% probability, magenta: 25–75% probability; dots: ensemble mean on the selected vertical levels of the model).
Figure 13.
ECMWF ensemble vertical profiles for Szolnok 00 UTC +48 h 16 March 2018 (dewpoint temperature—green: 0–100% probability, avocado: 25–75% probability; temperature—yellow: 0–100% probability, magenta: 25–75% probability; dots: ensemble mean on the selected vertical levels of the model).
Table 1.
Contingency table (green shows good forecast, orange shows bad forecasts).
Table 1.
Contingency table (green shows good forecast, orange shows bad forecasts).
| | Observation |
|---|
| Yes | No |
|---|
| Forecast | Yes | Hits | False alarms |
| No | Misses | Correct rejections |
| Publisher’s Note: MDPI stays neutral with regard to jurisdictional claims in published maps and institutional affiliations. |
© 2022 by the authors. Licensee MDPI, Basel, Switzerland. This article is an open access article distributed under the terms and conditions of the Creative Commons Attribution (CC BY) license (https://creativecommons.org/licenses/by/4.0/).


