
Evaluation of Satellite-Derived Signatures for Three Verified Hailstorms in Central Argentina


Abstract
1. Introduction
2. Data and Methods
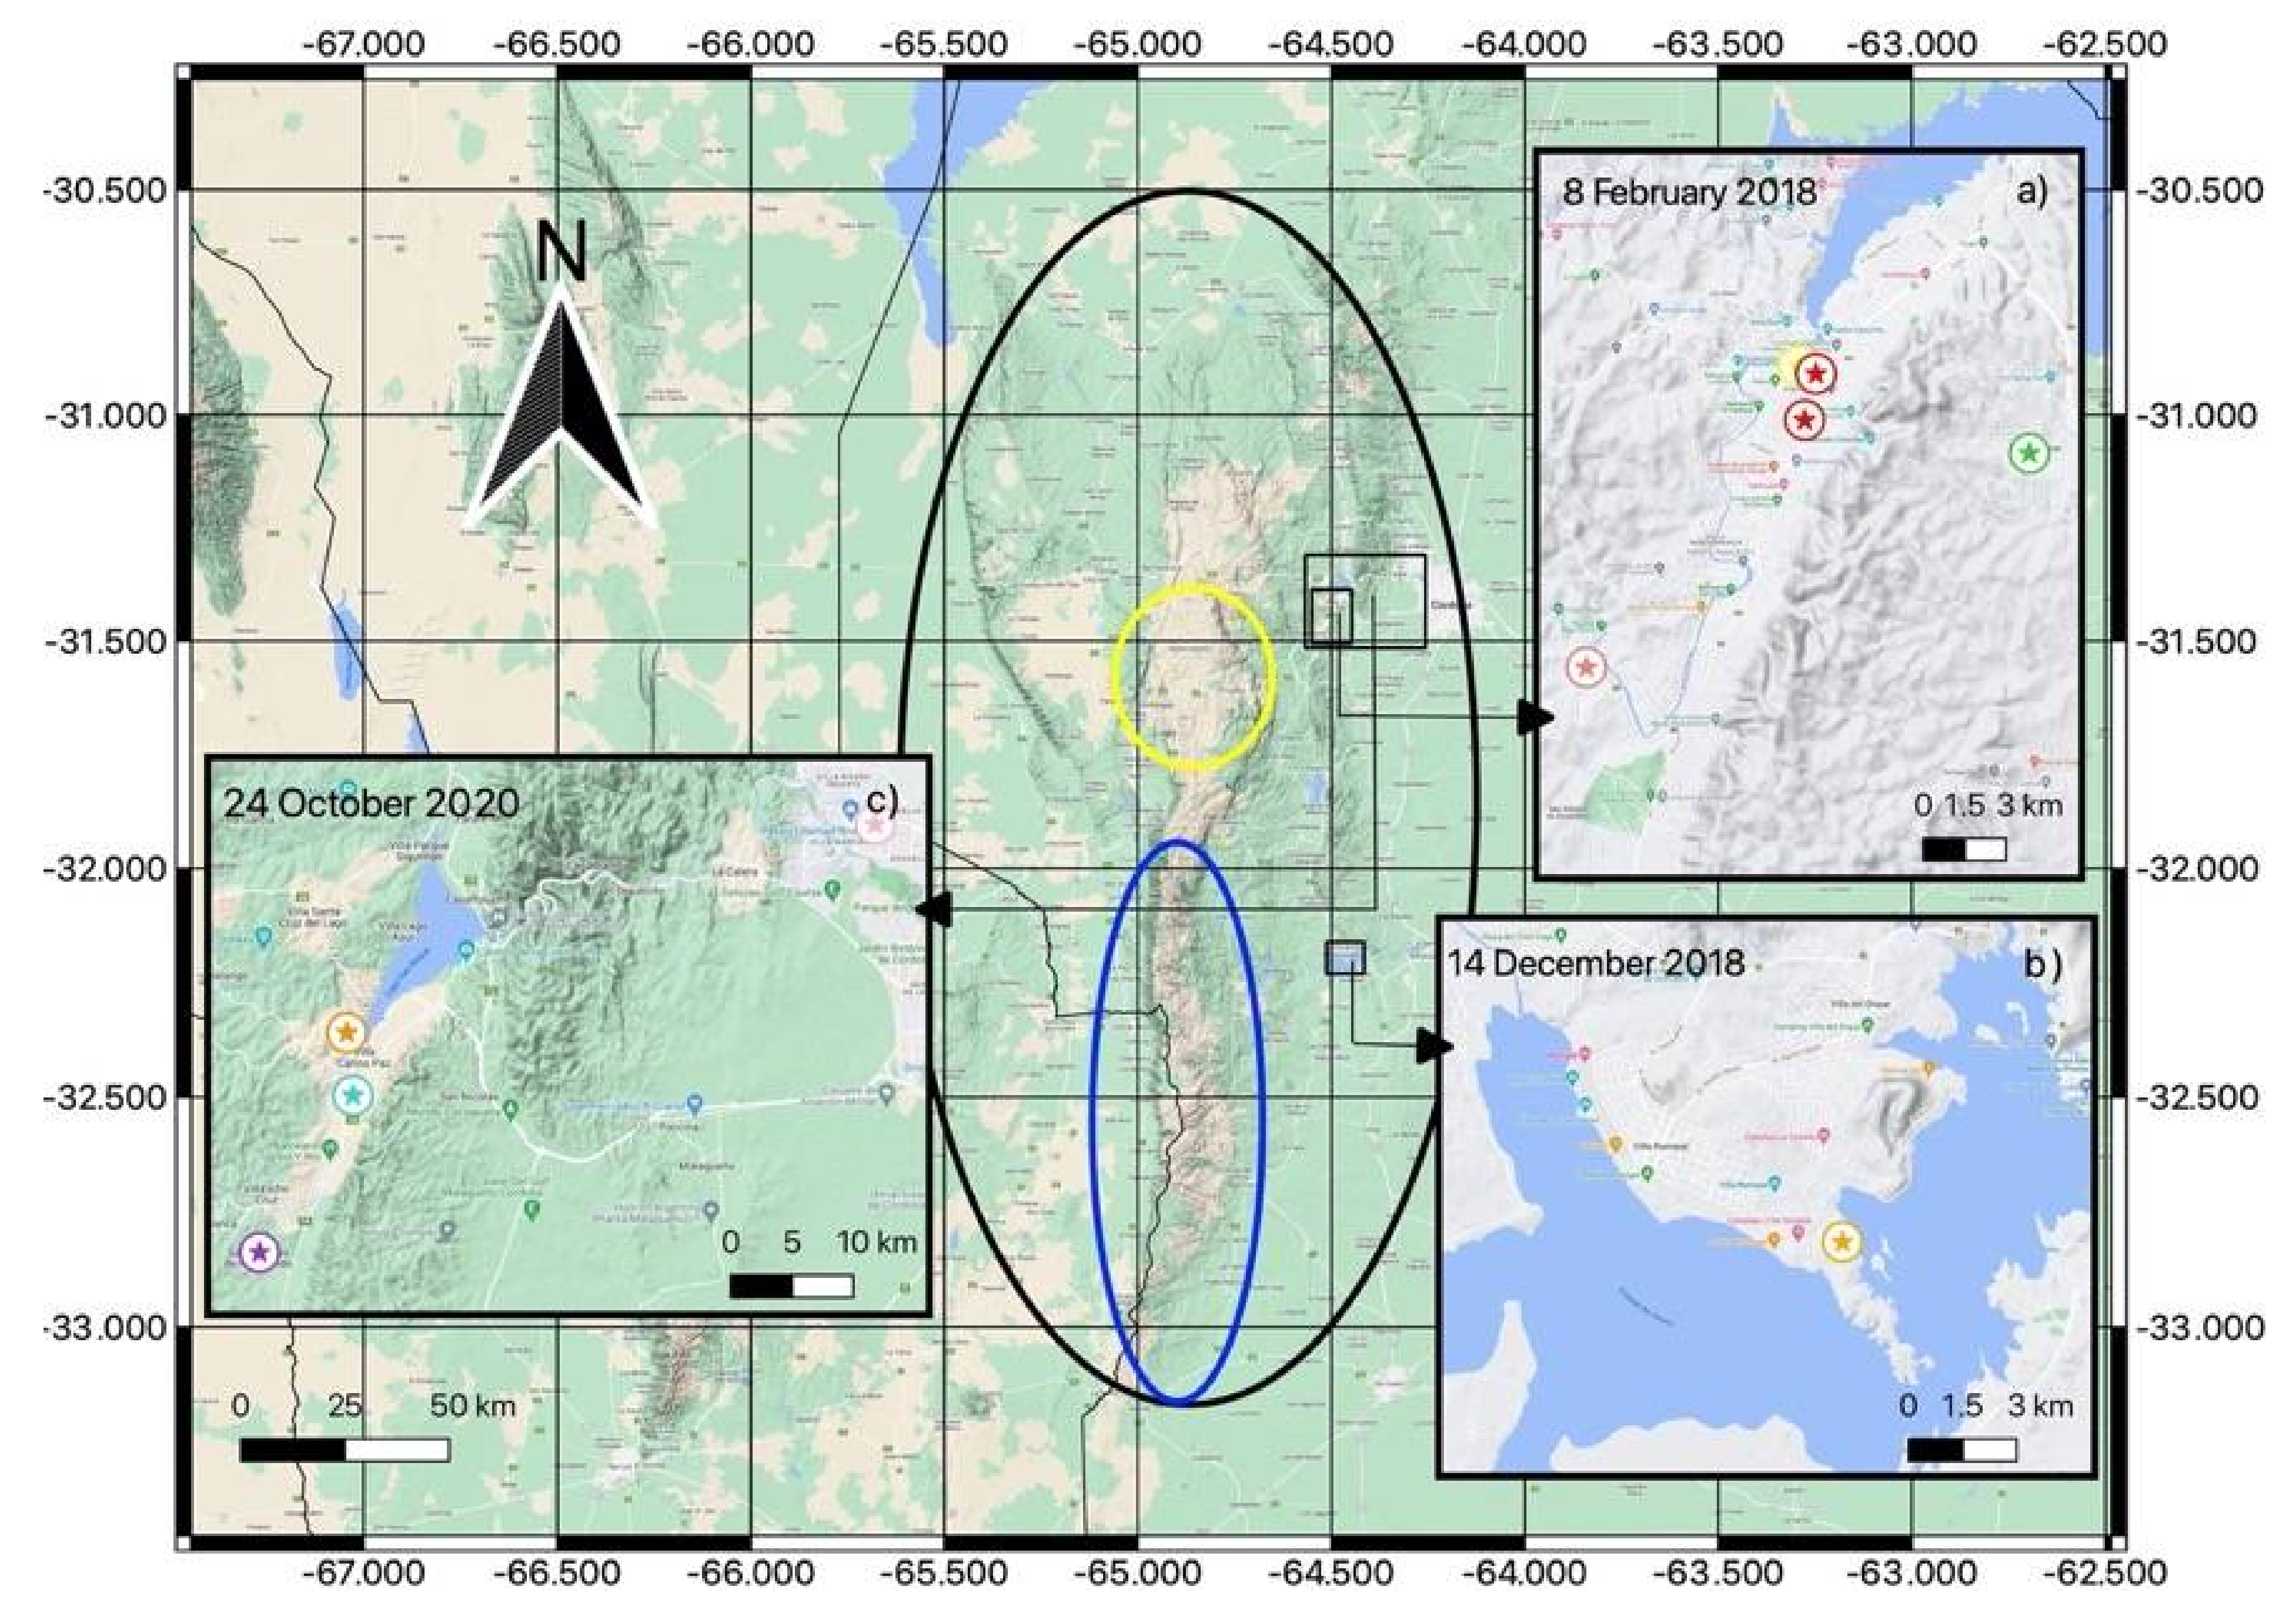
2.1. Hail Events
2.2. Convective Storm Identification and Tracking
2.2.1. Geostationary Satellite
2.2.2. Radar
2.2.3. Environmental Data and Storm Warnings
3. Results
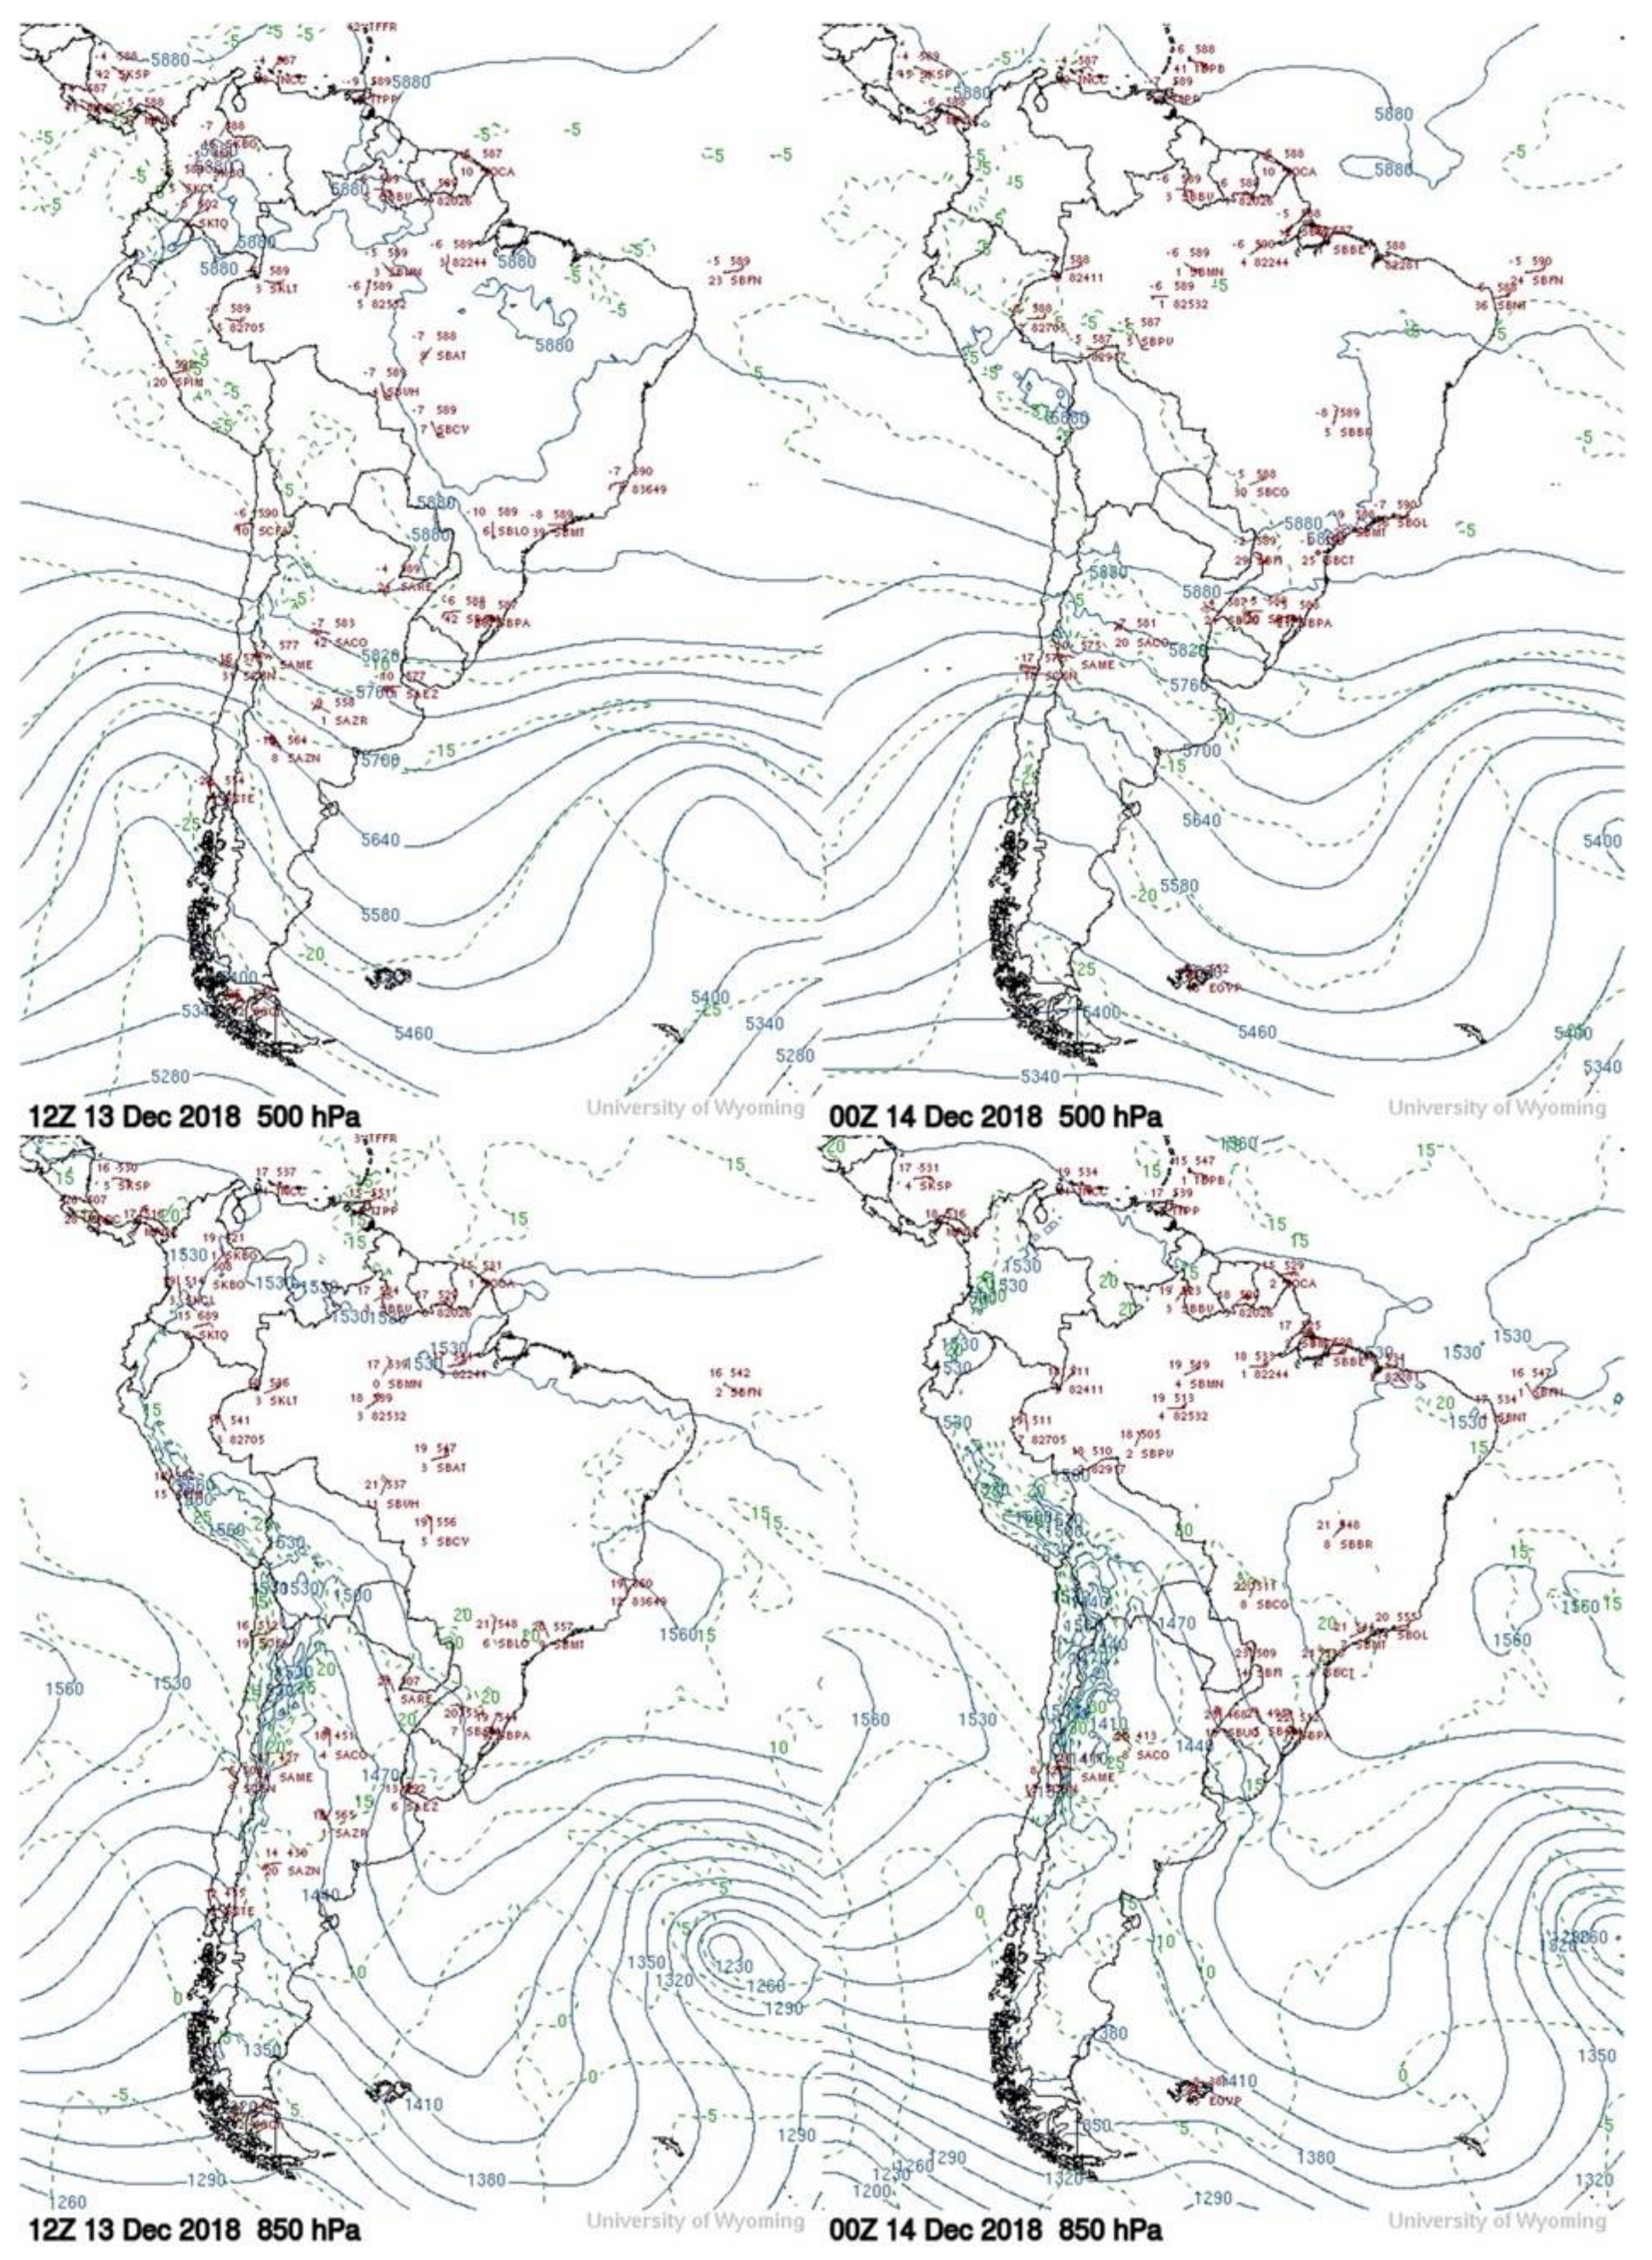
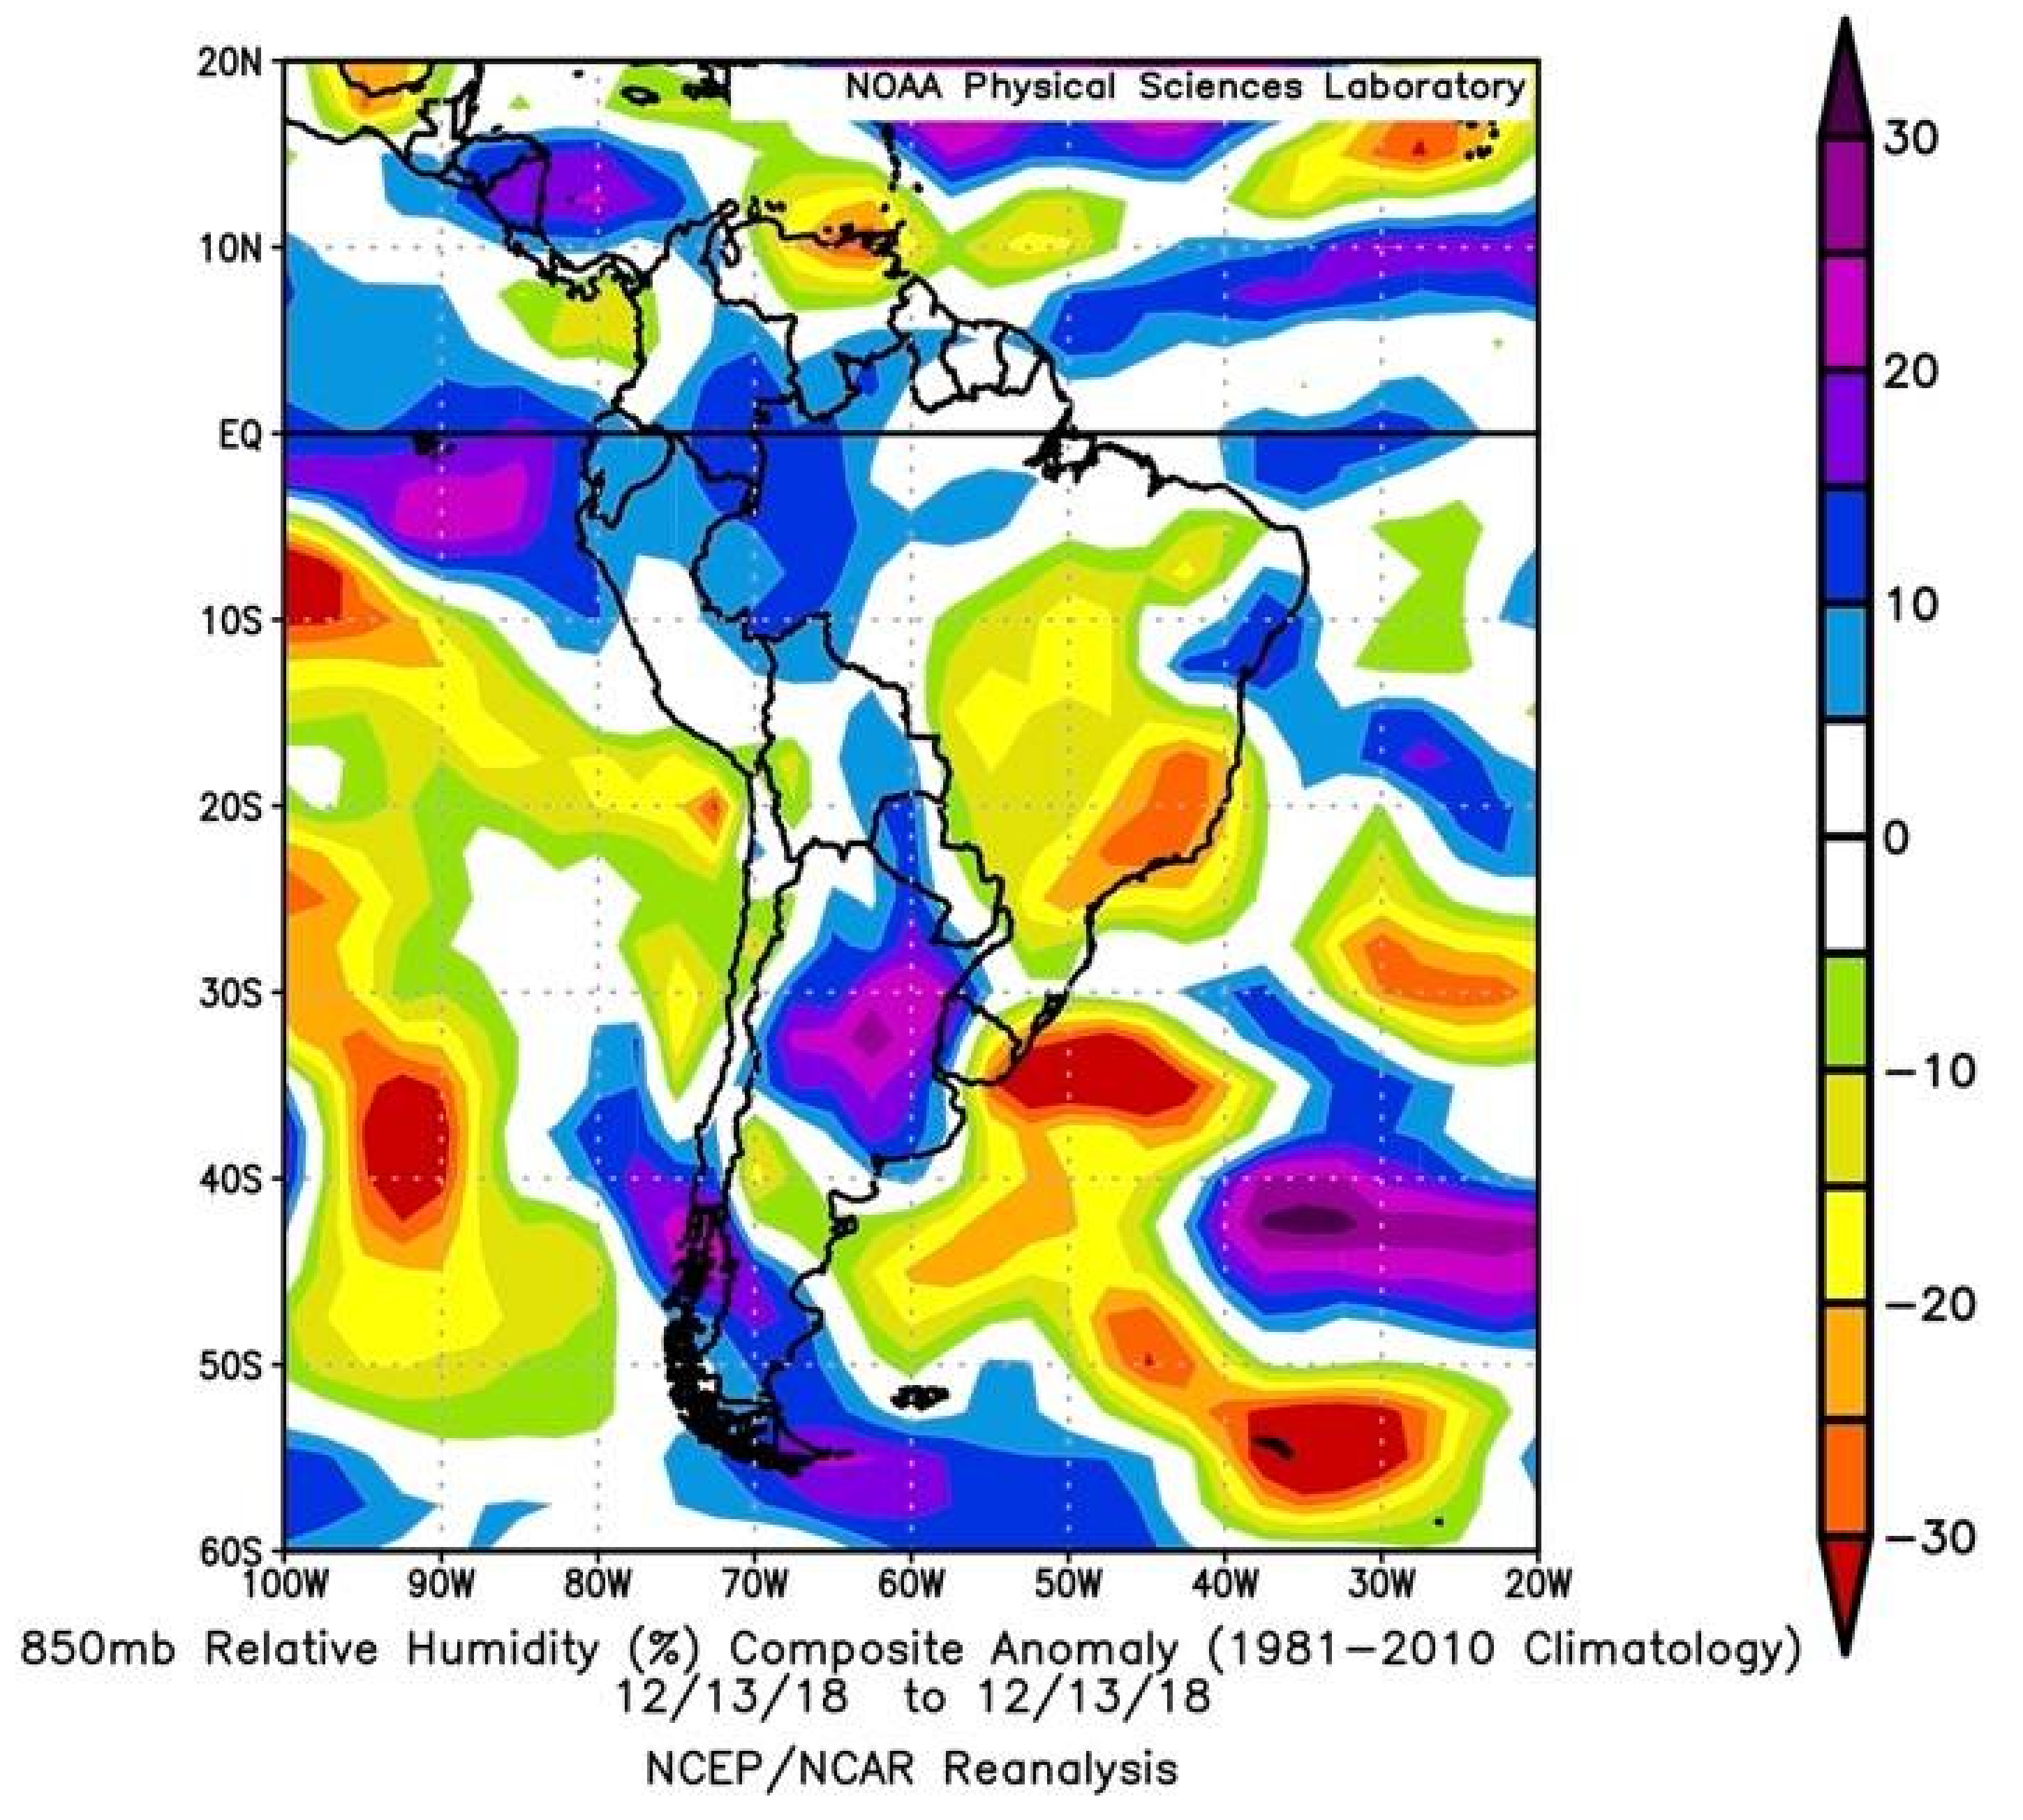
3.1. 13–14 December 2018 MCS
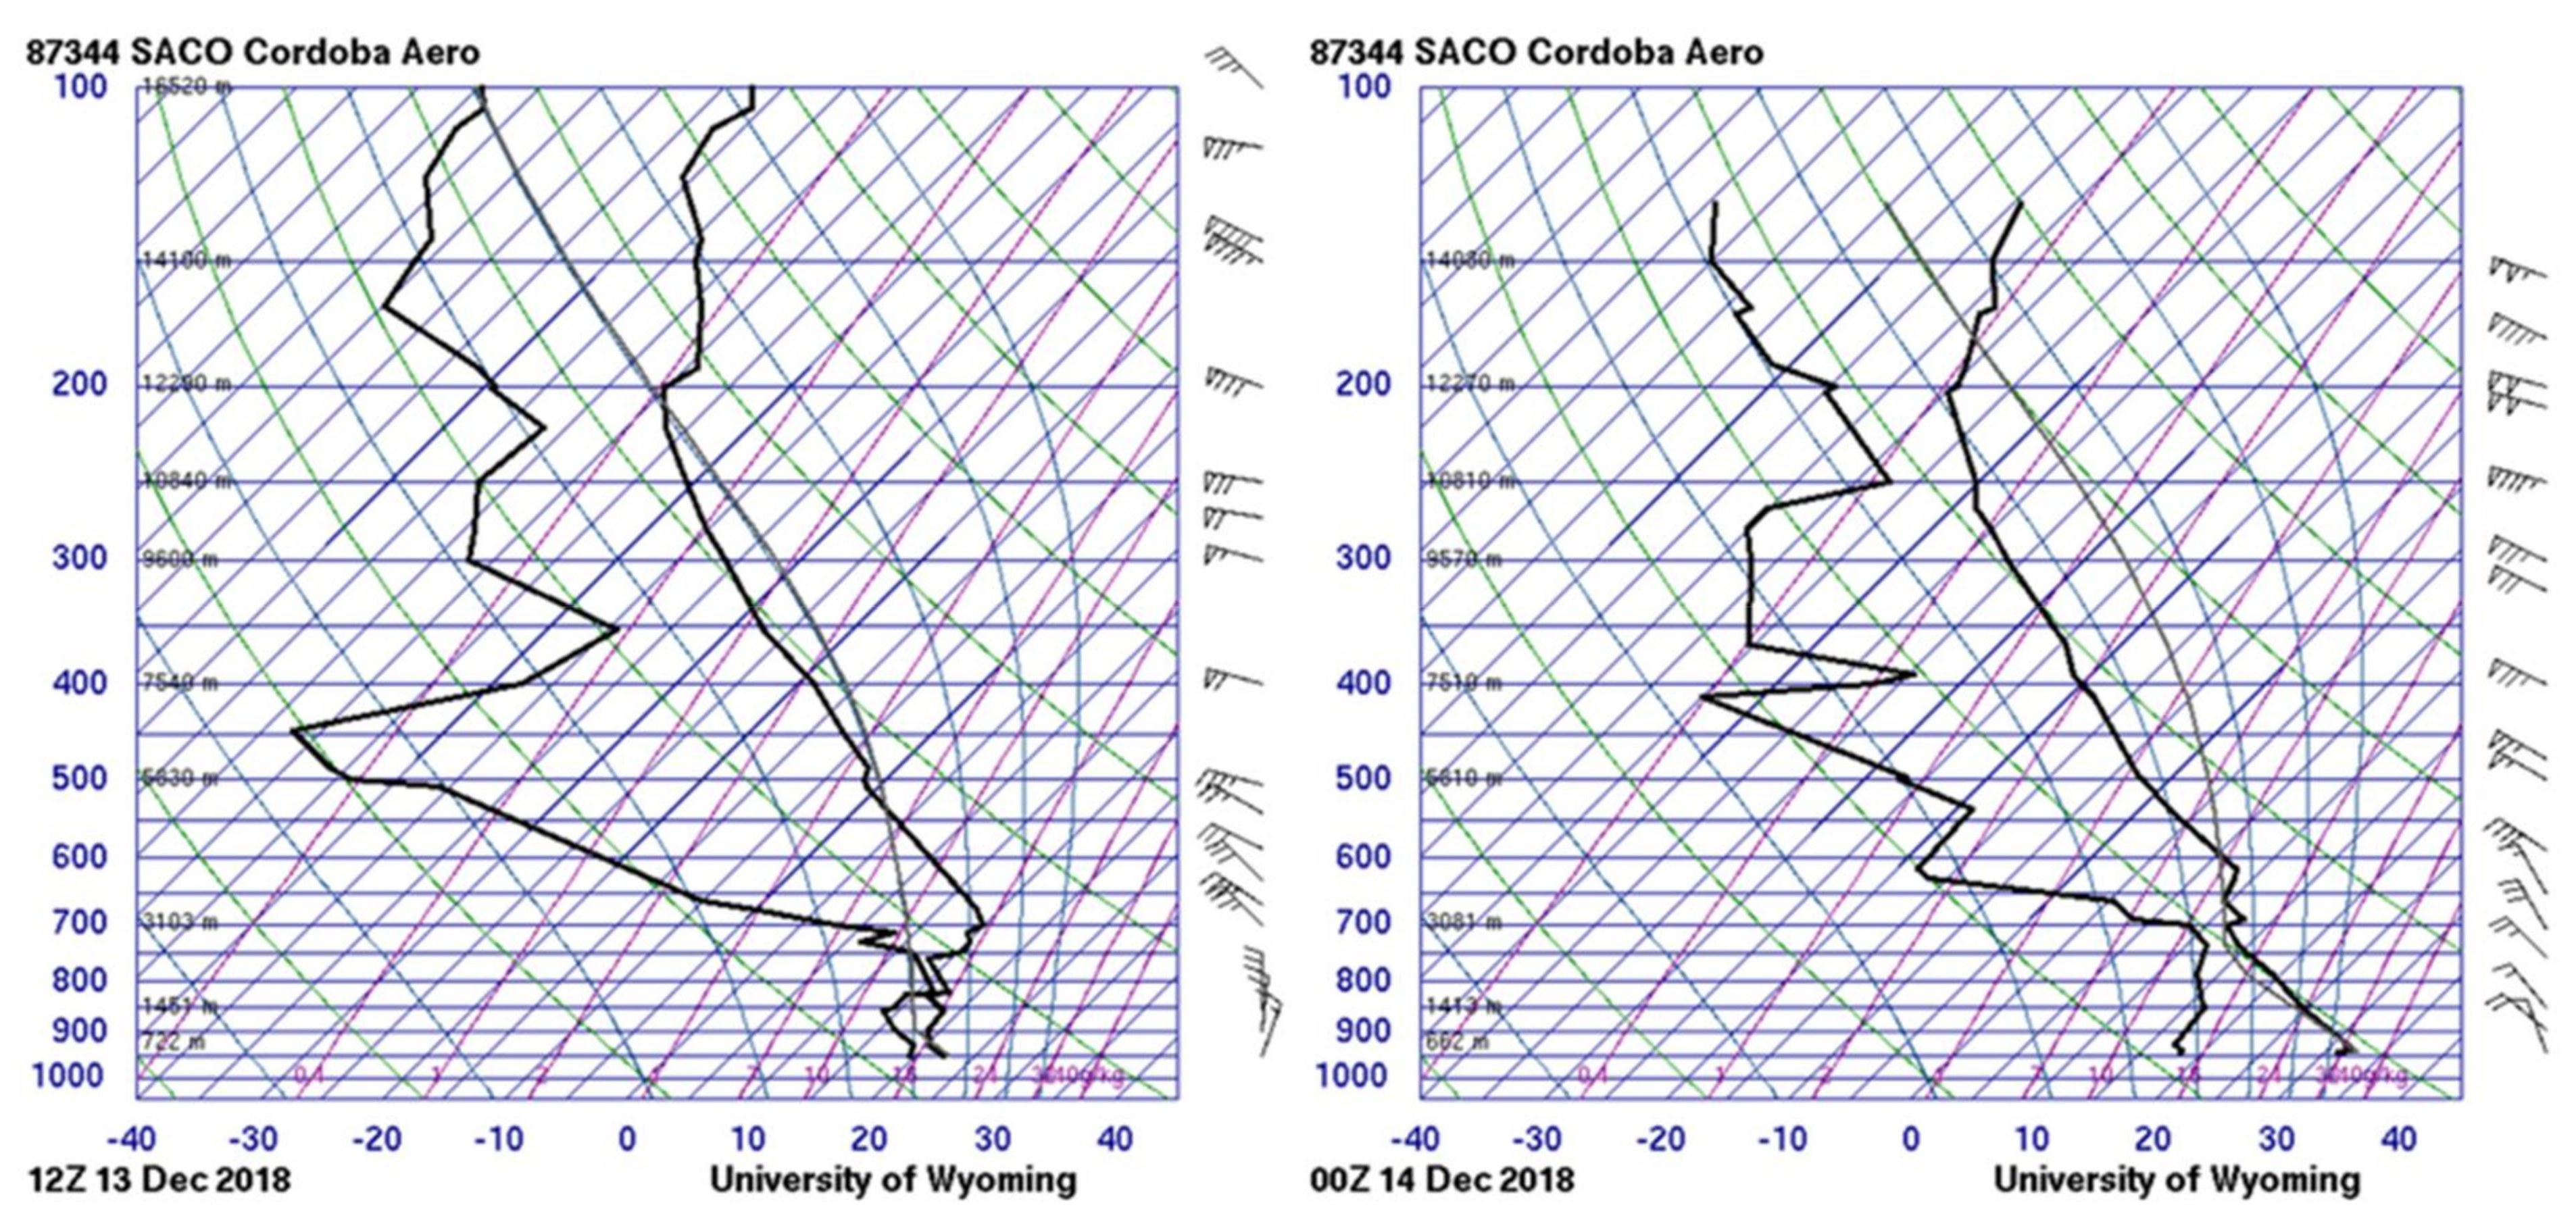
3.1.1. Environmental Setting
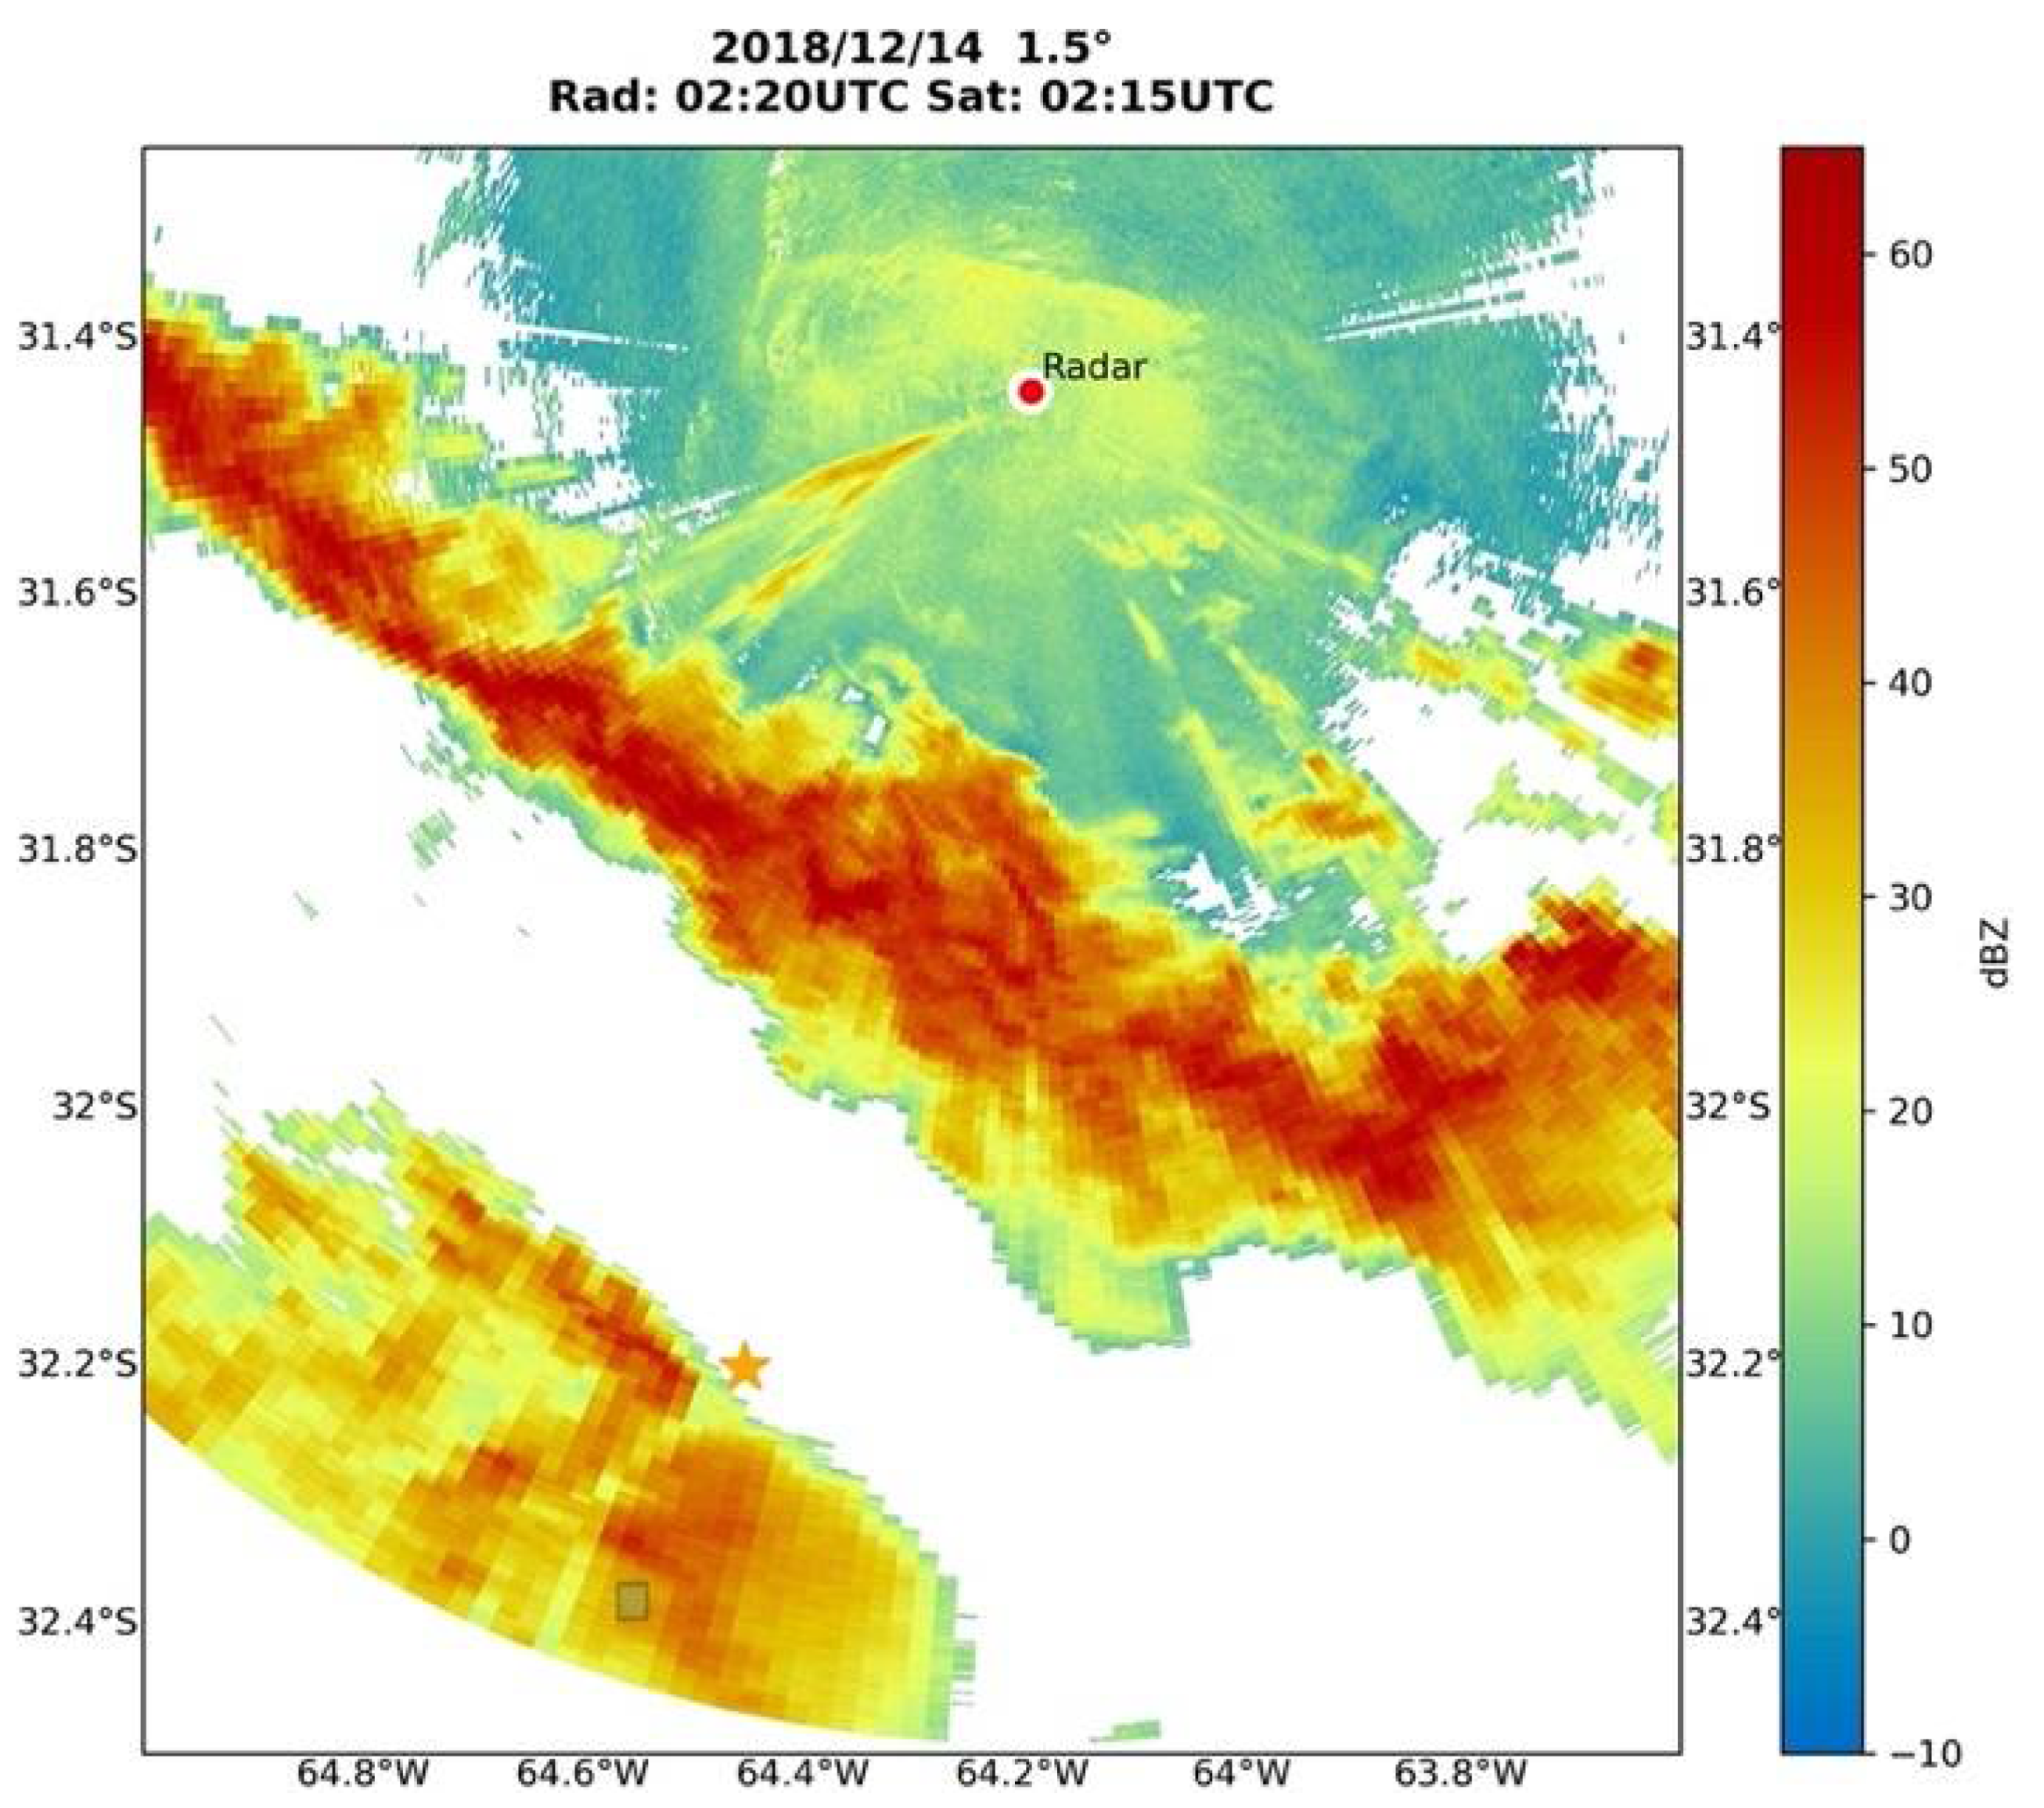
3.1.2. Convective Characteristics
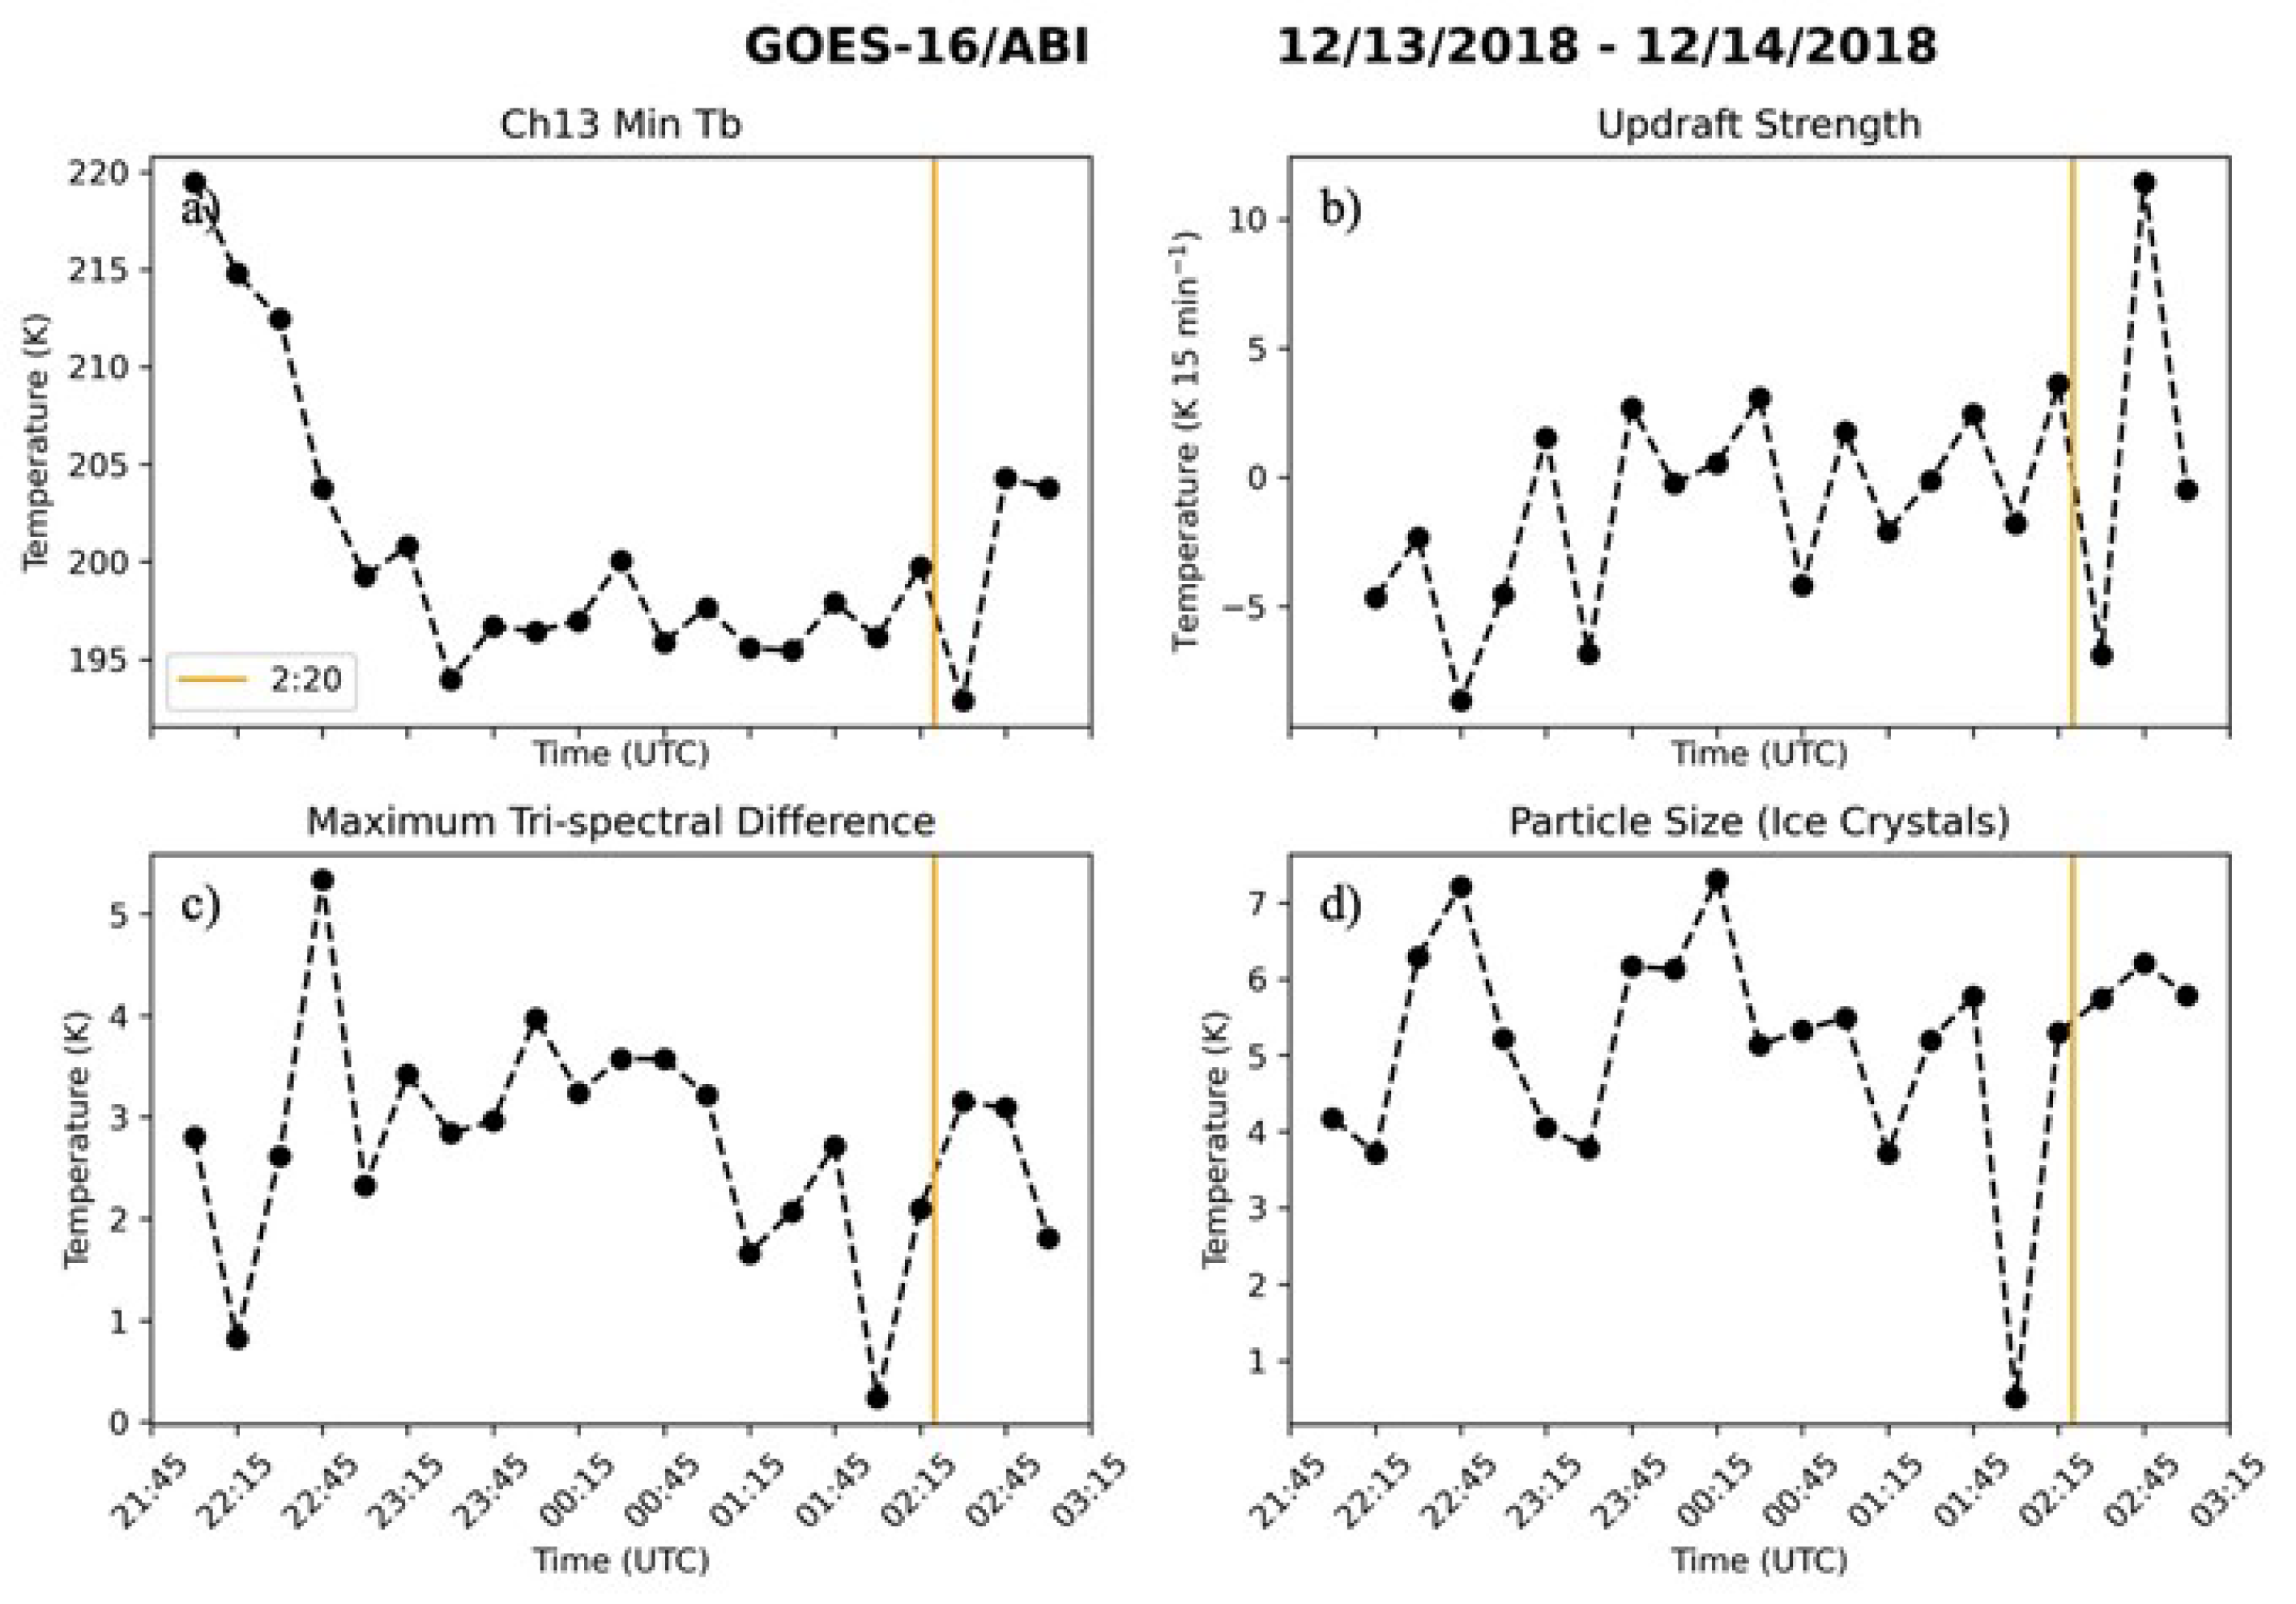
3.1.3. Temporal Trends in Satellite Data
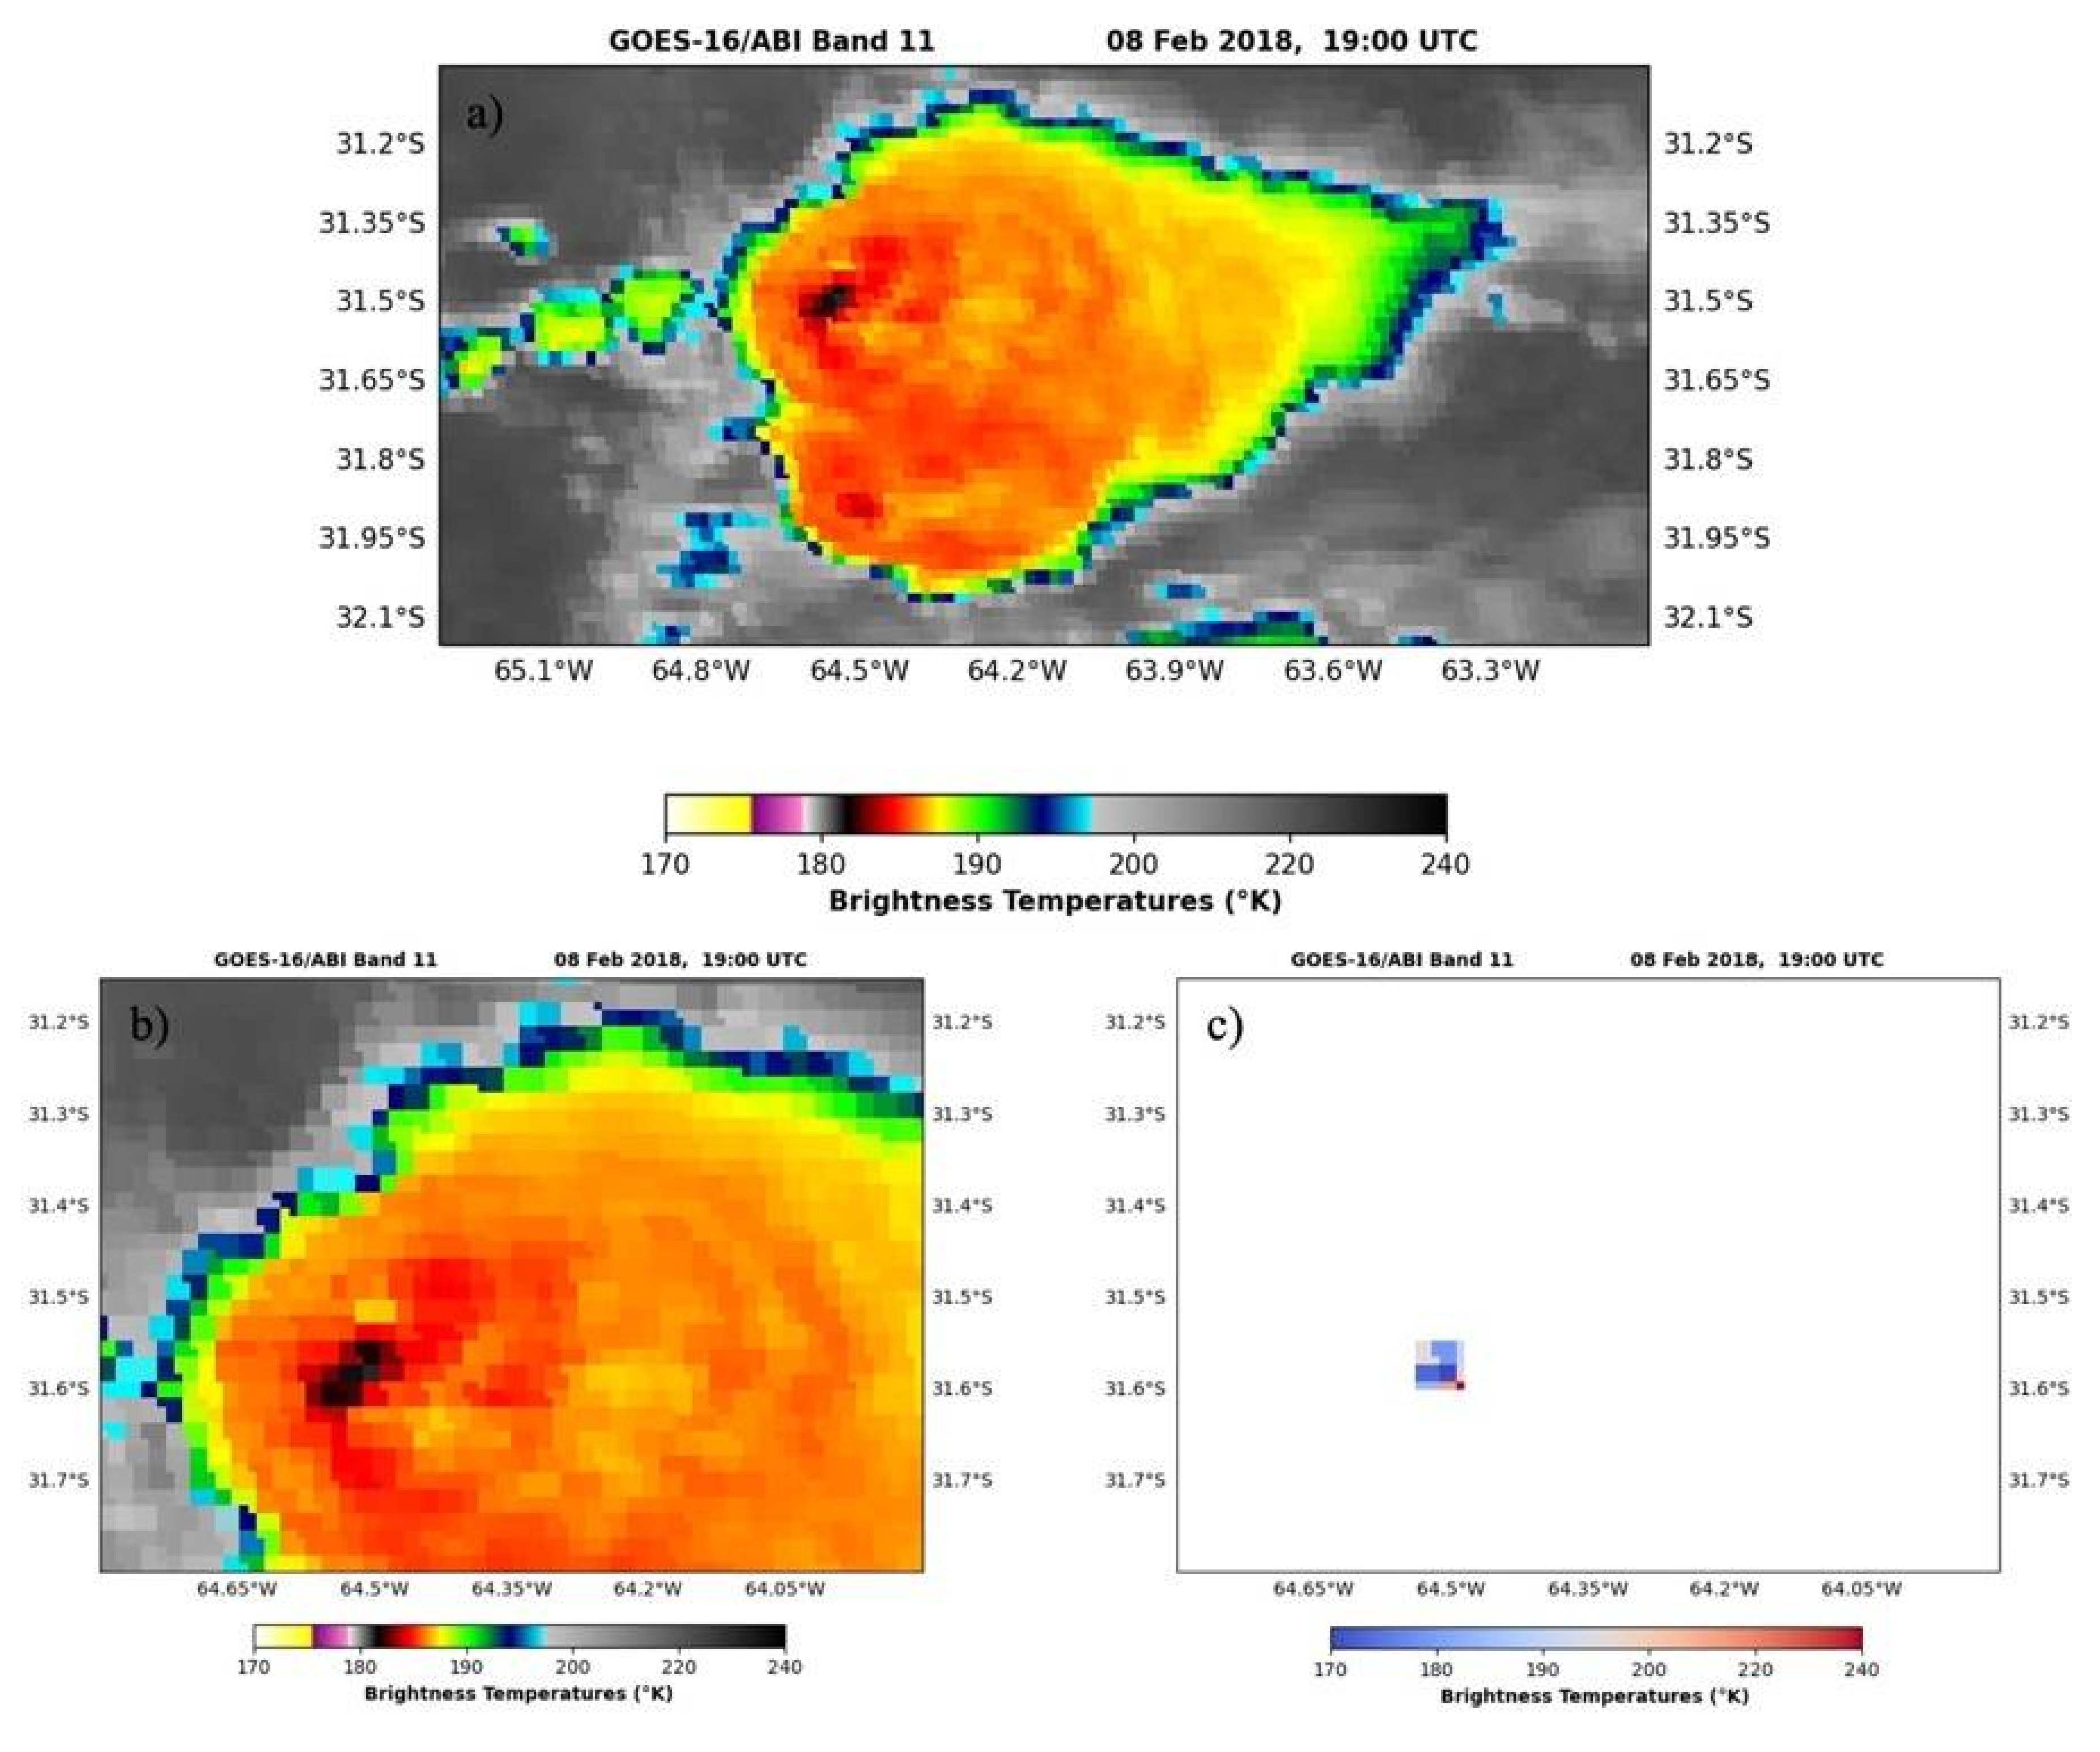
3.2. 8 February 2018 Supercell
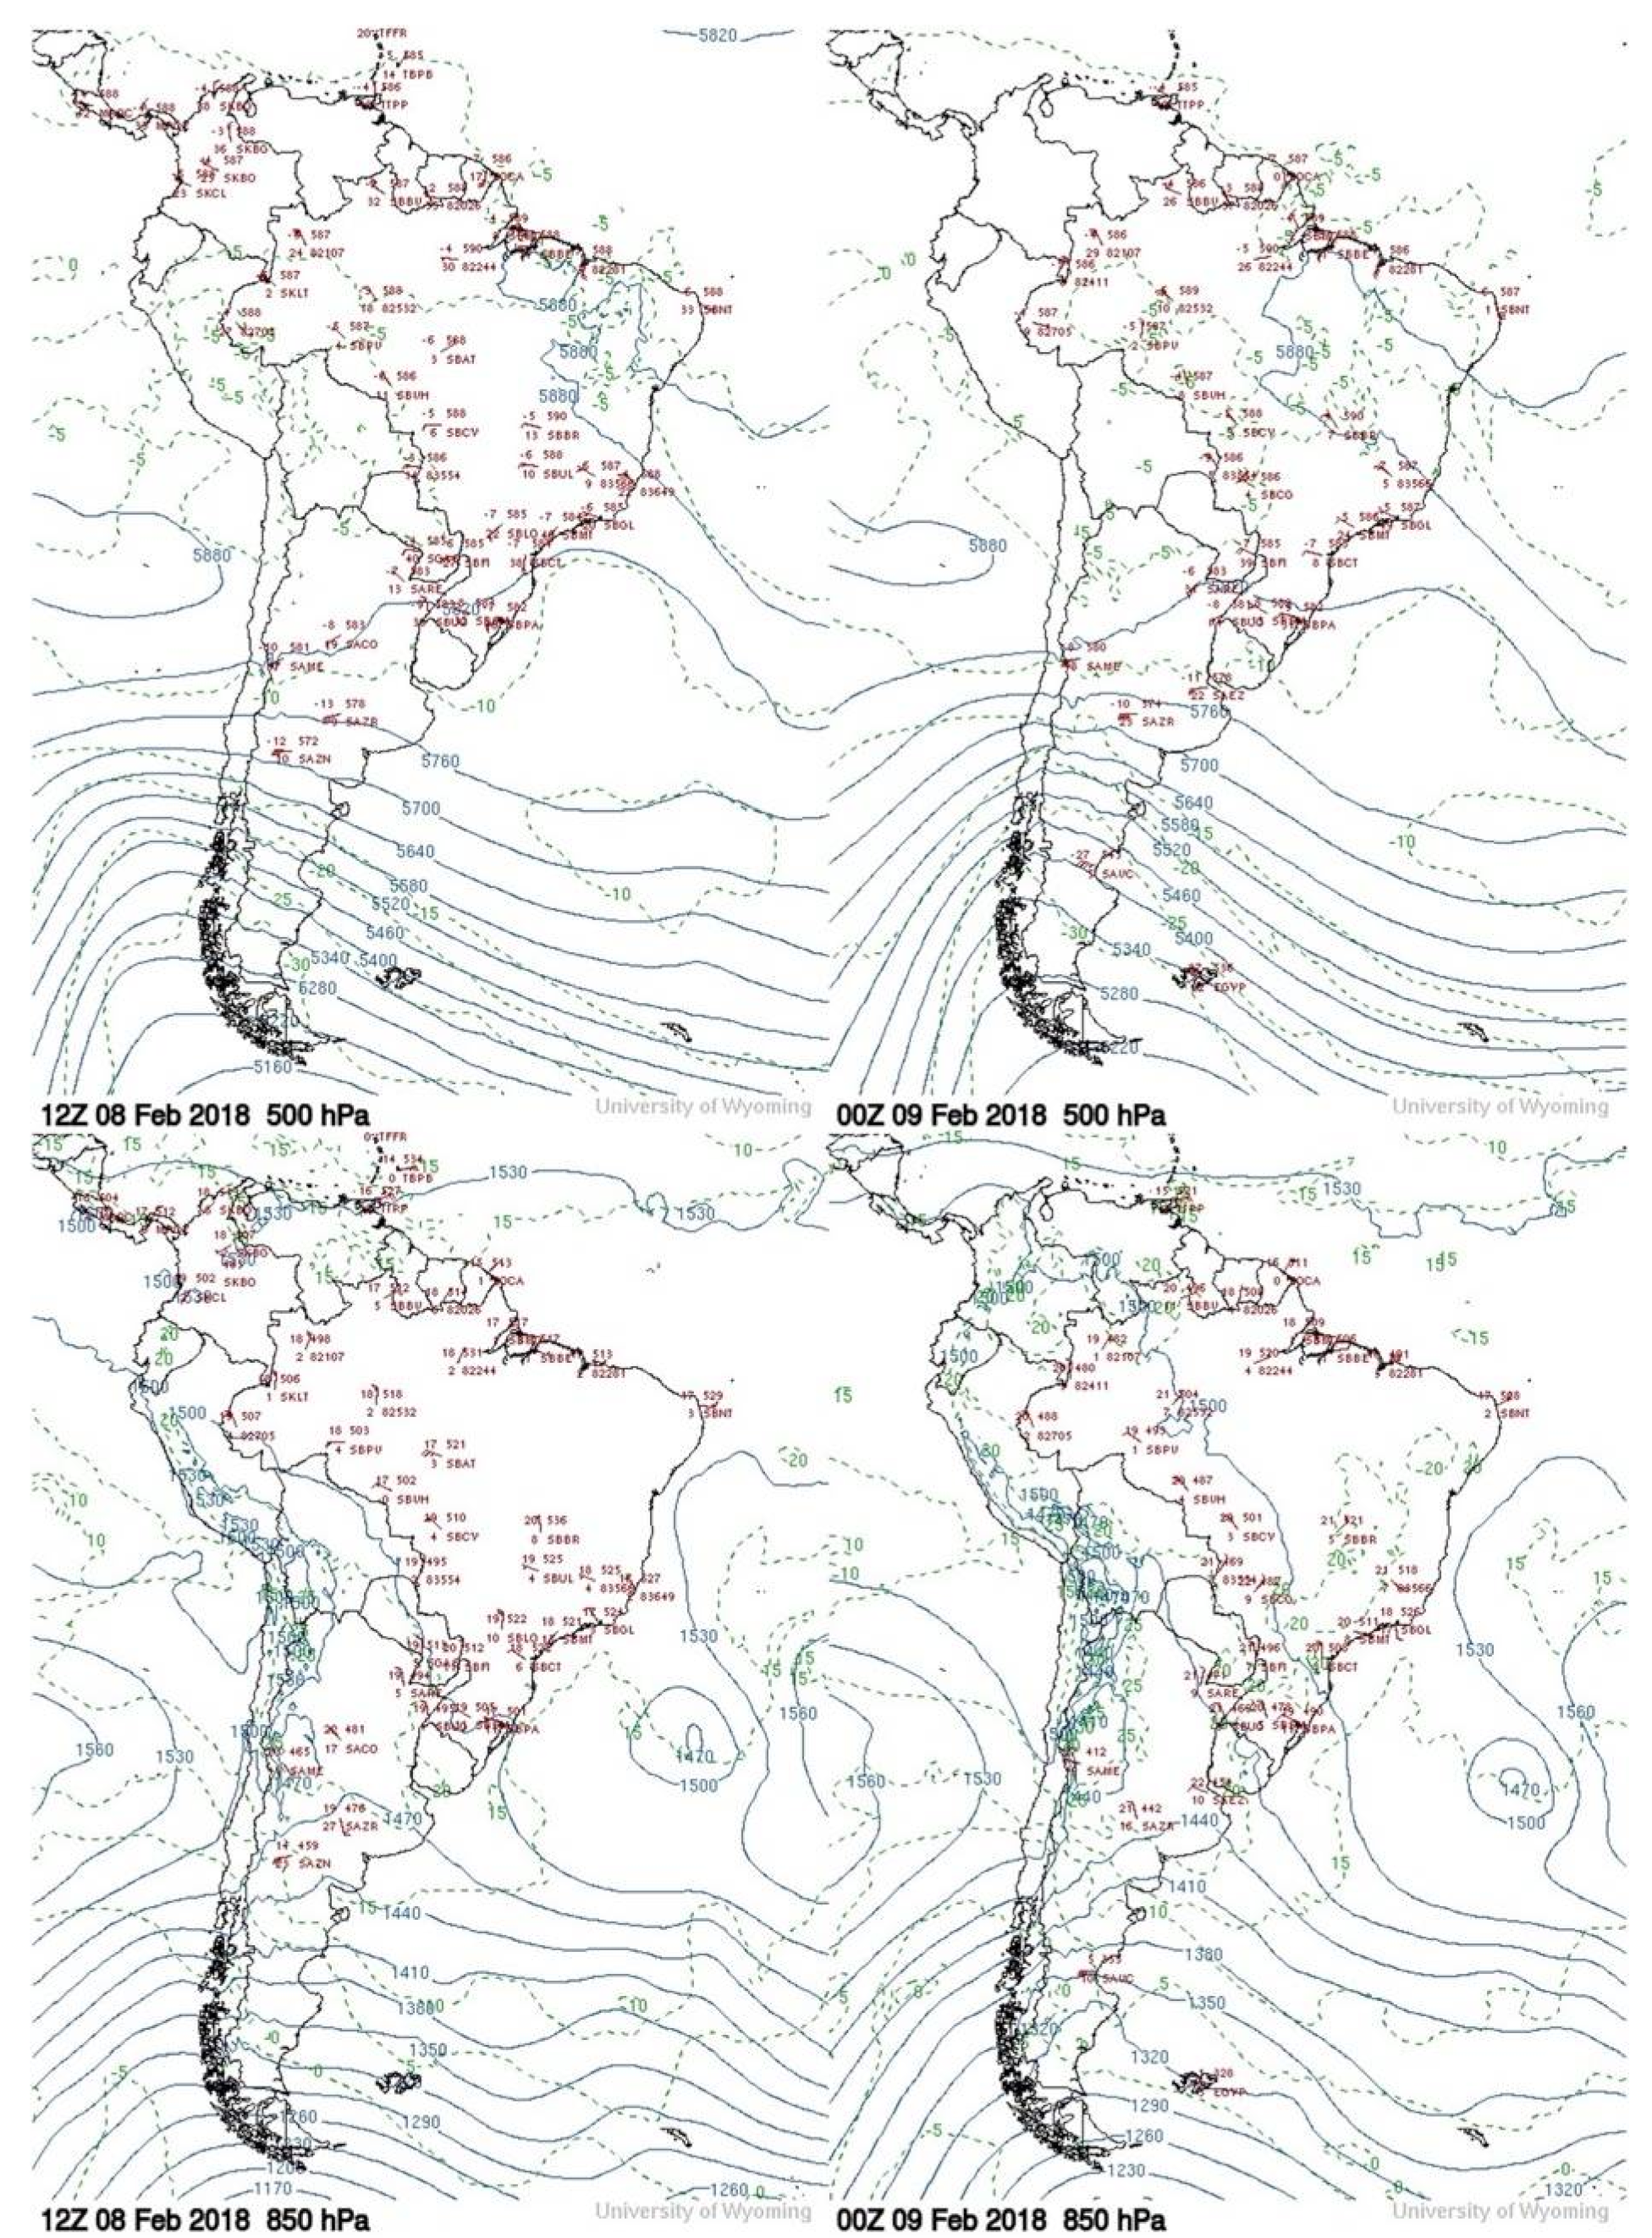
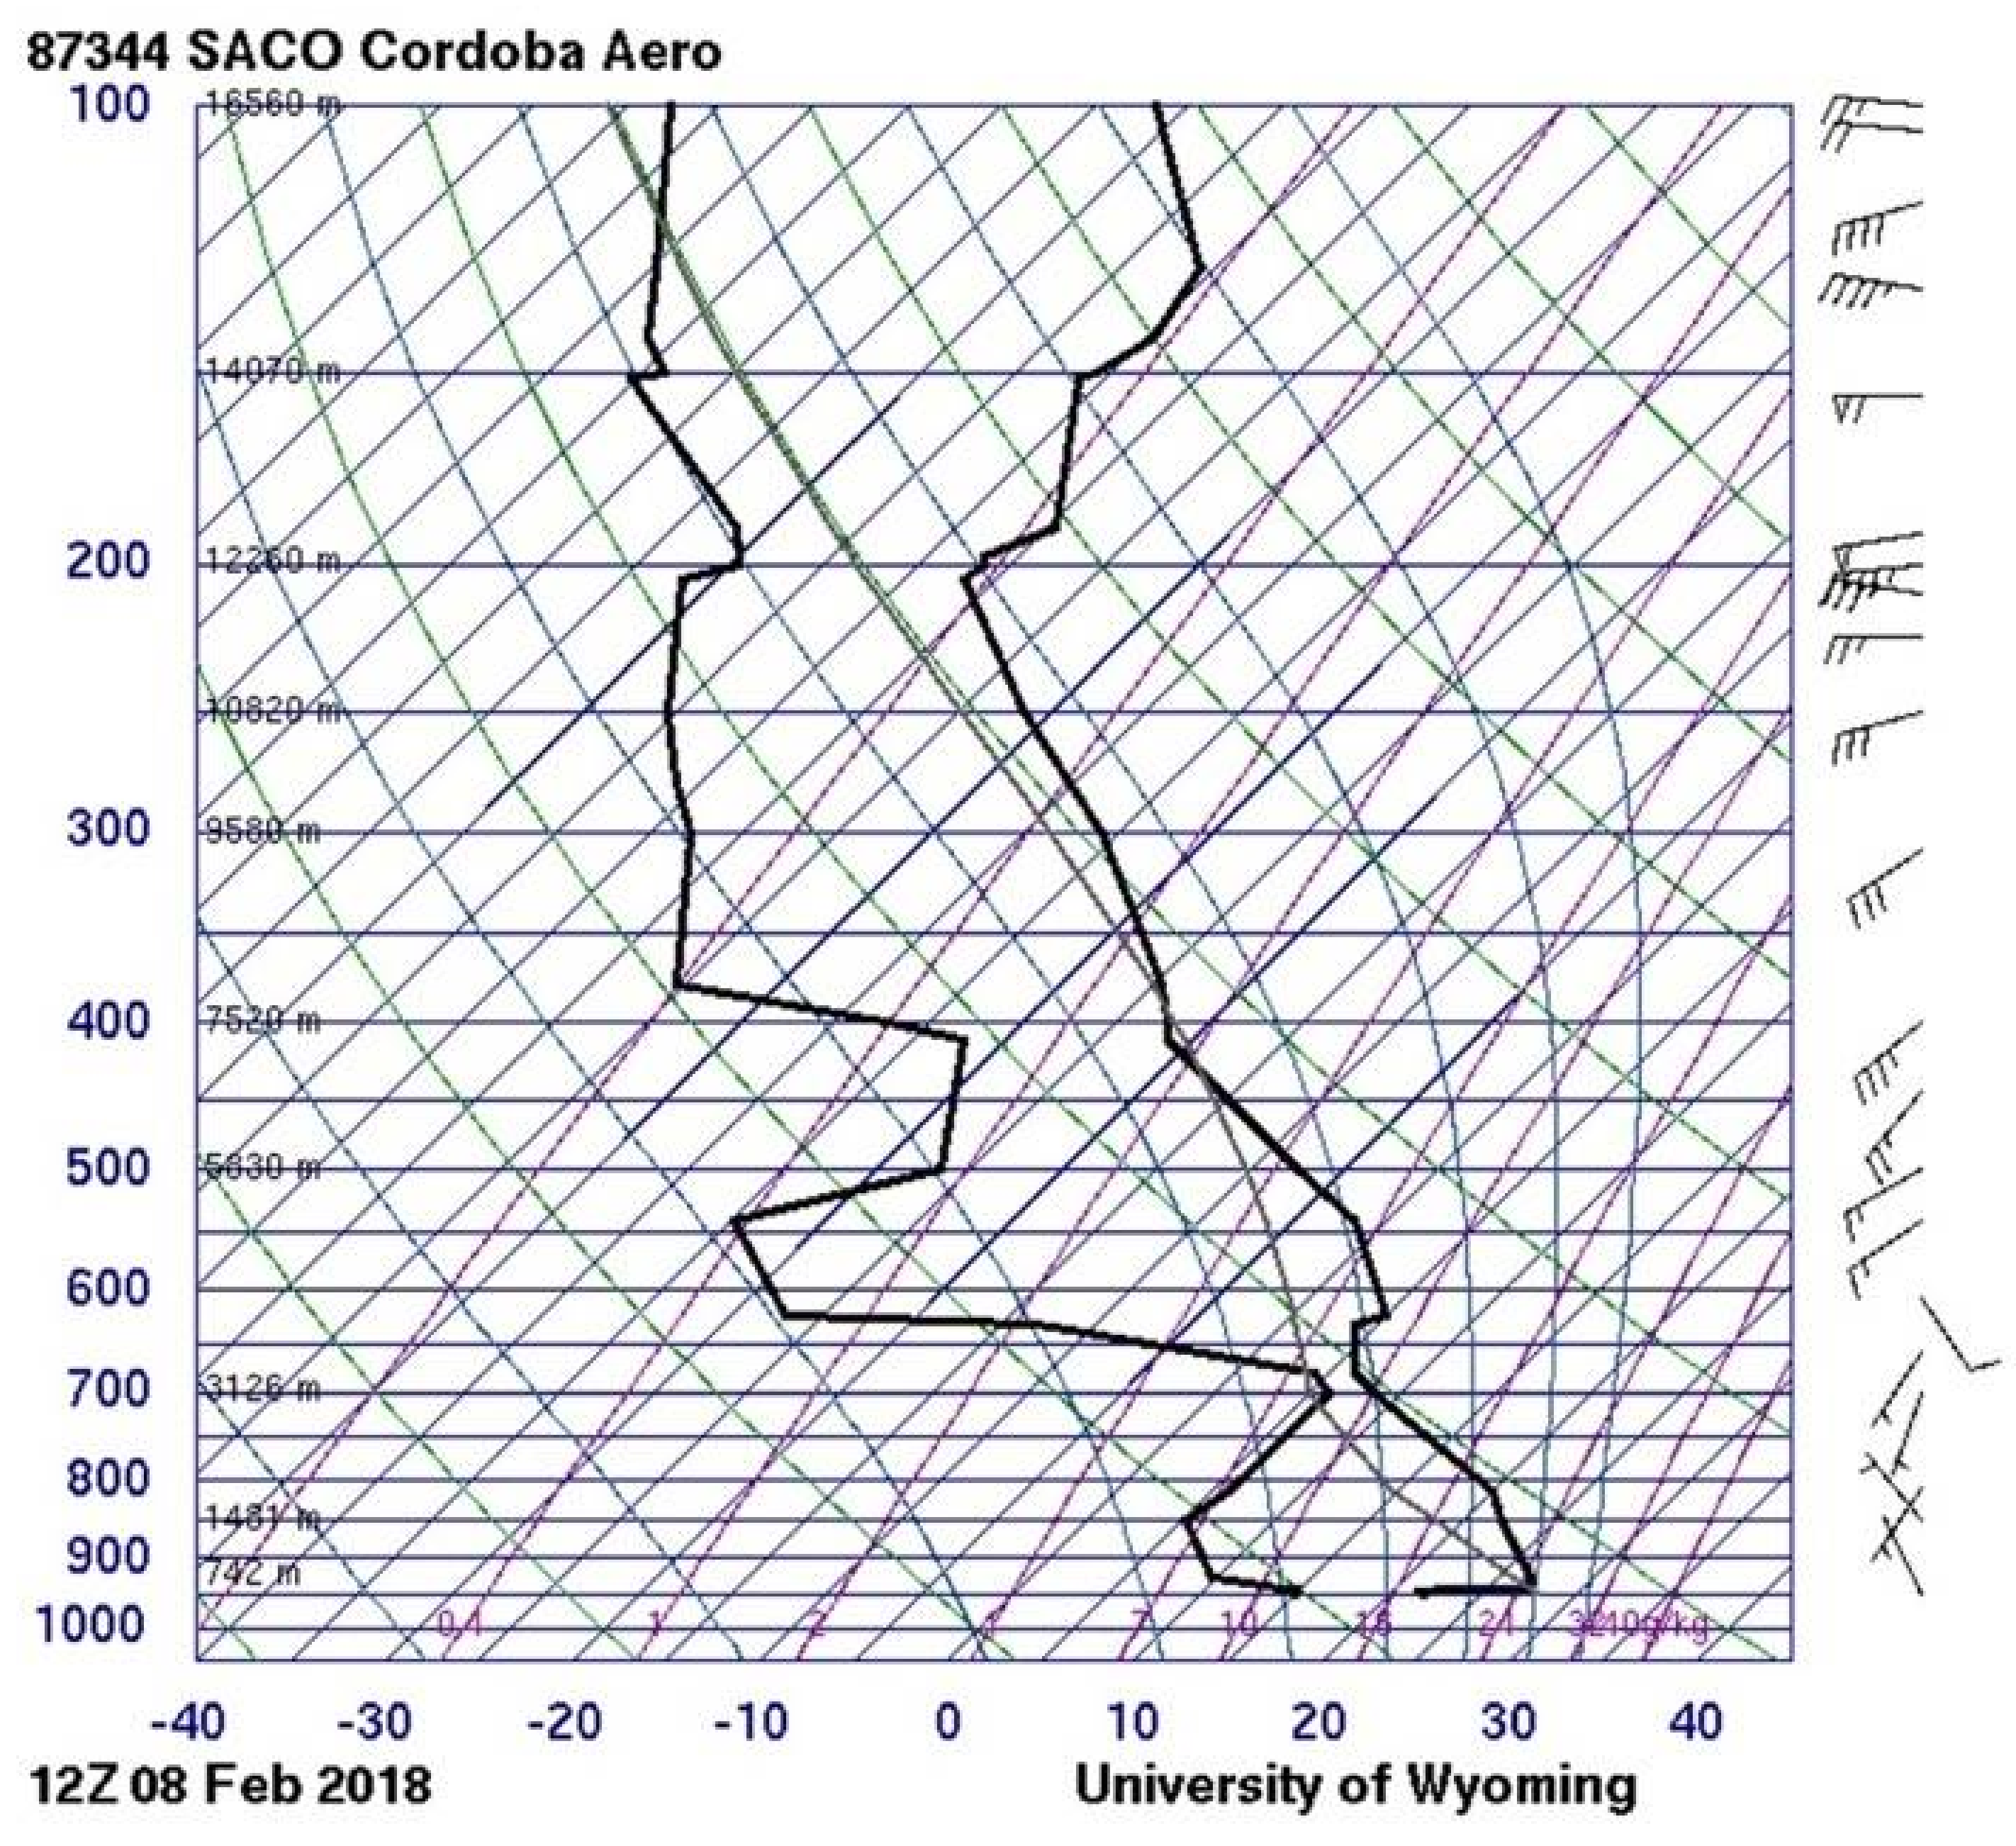
3.2.1. Environmental Setting
3.2.2. Convective Characteristics
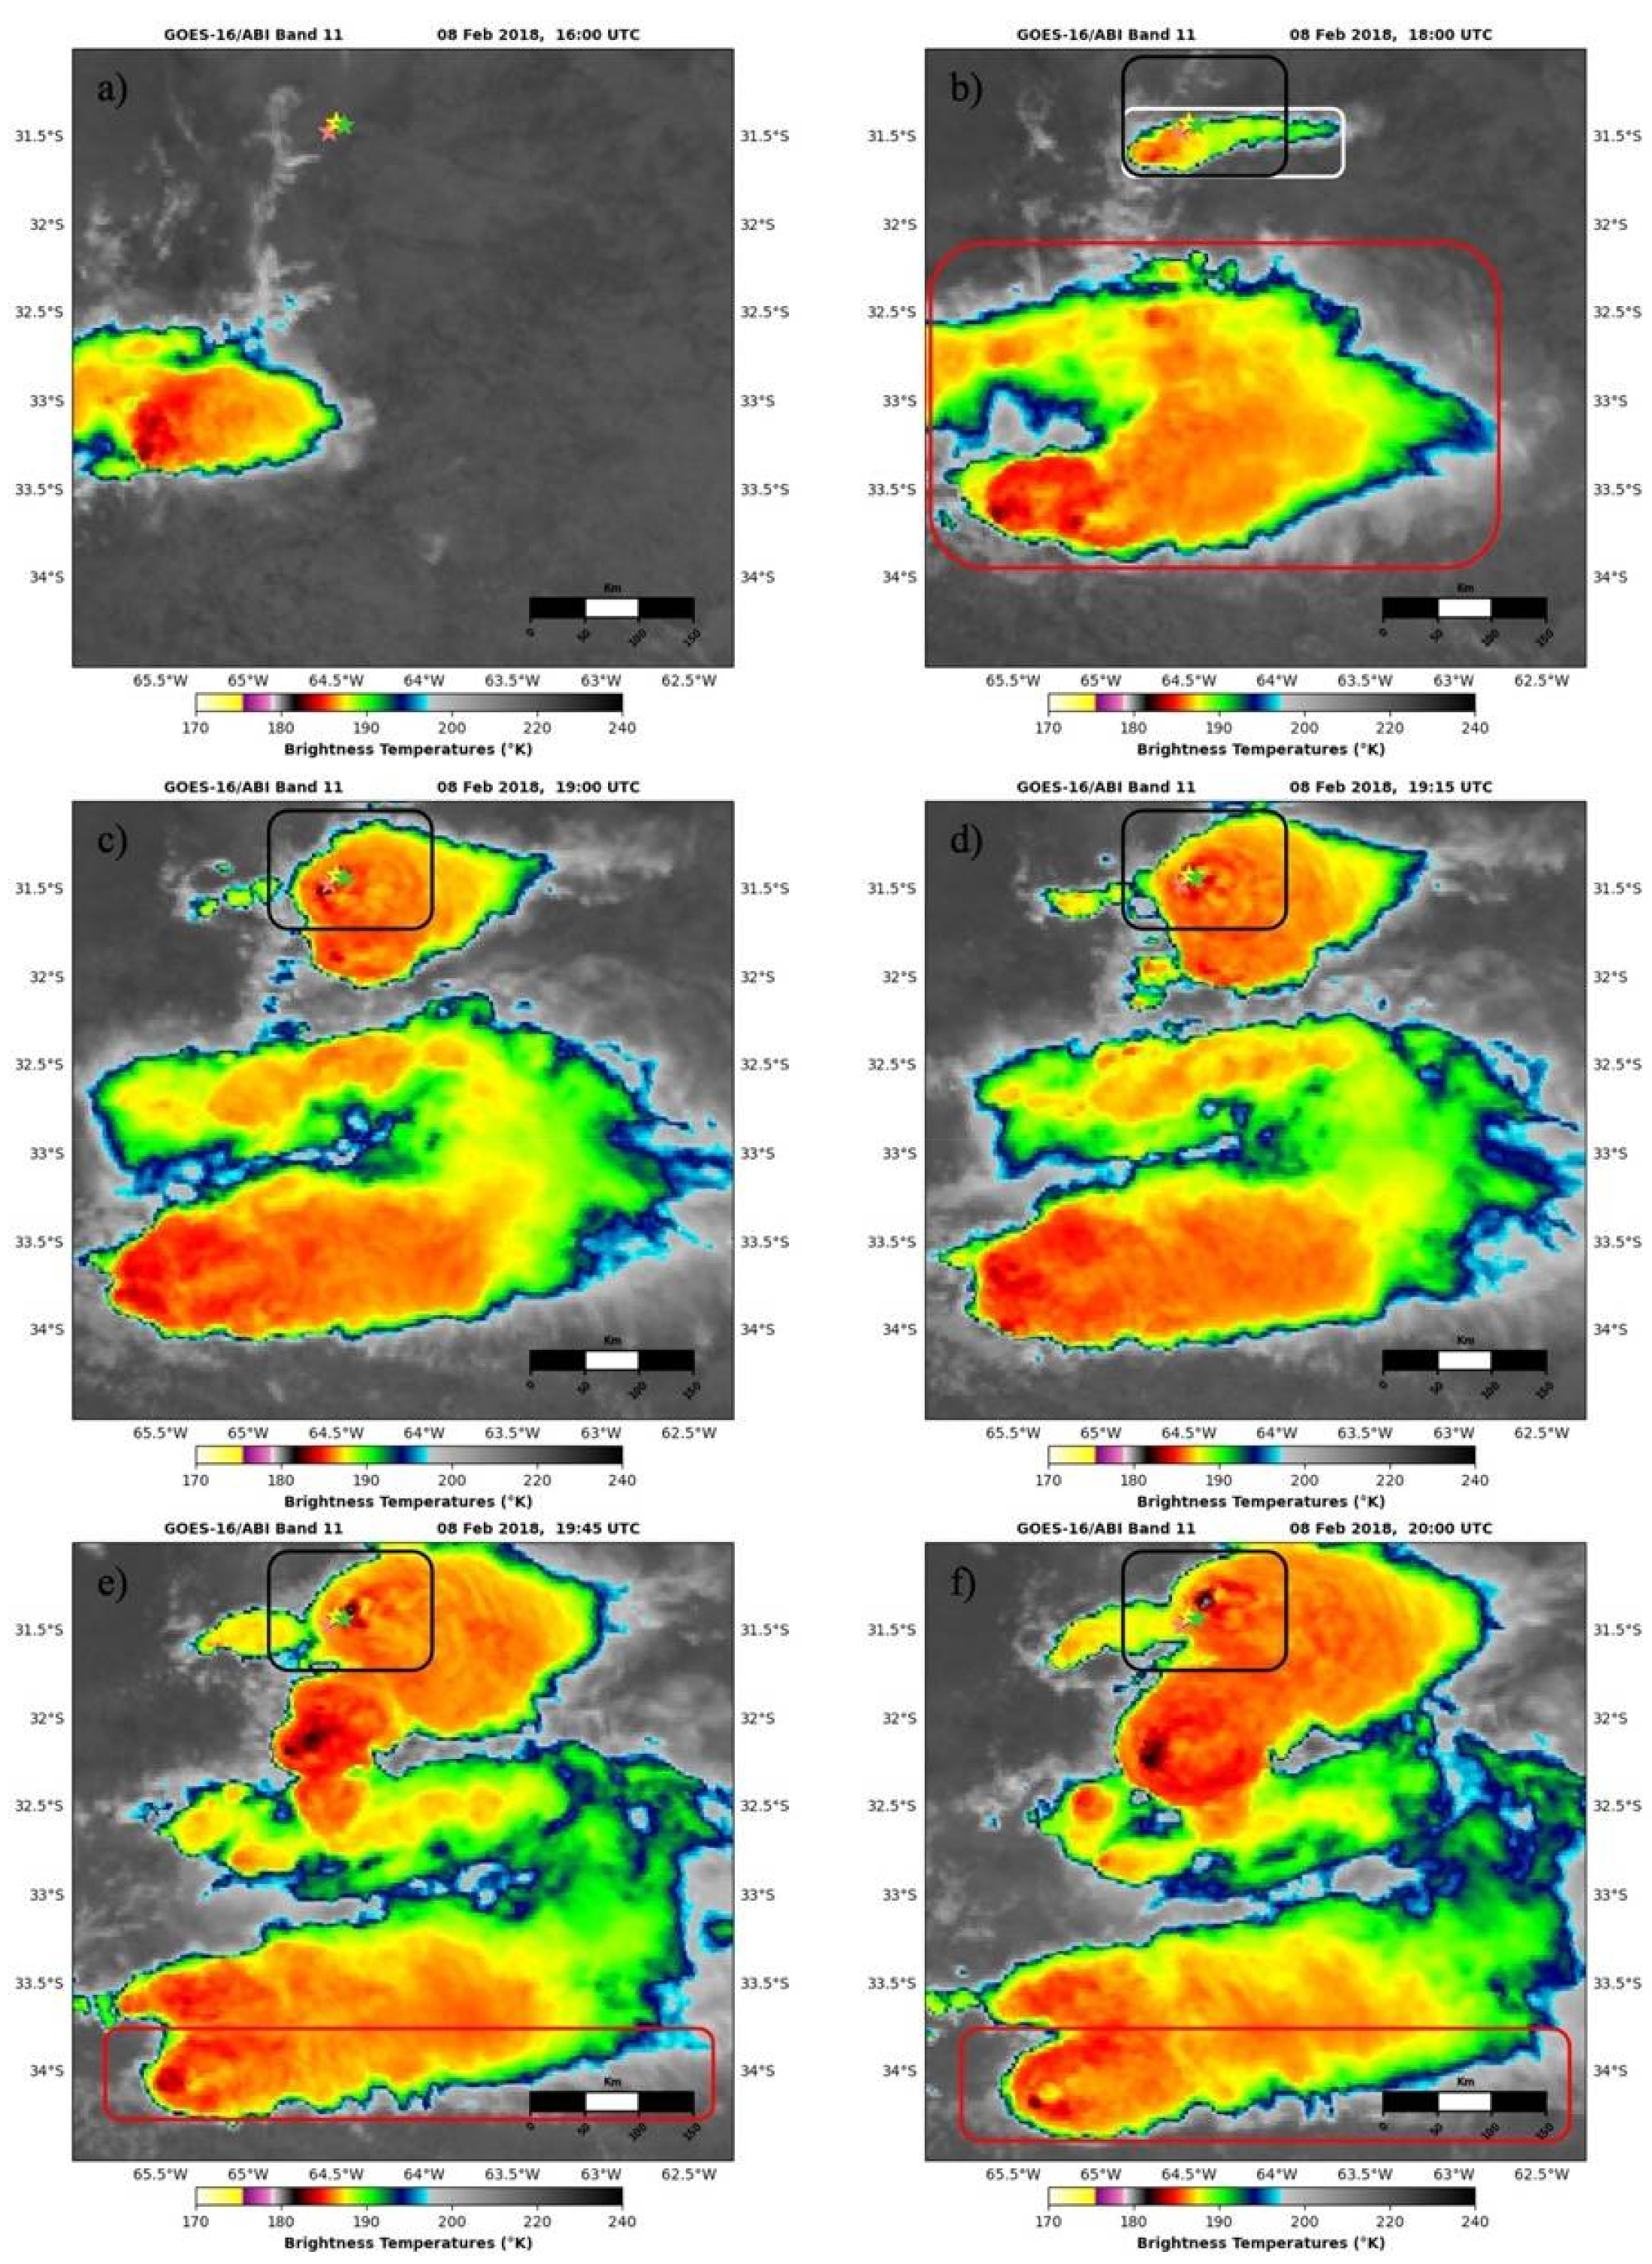
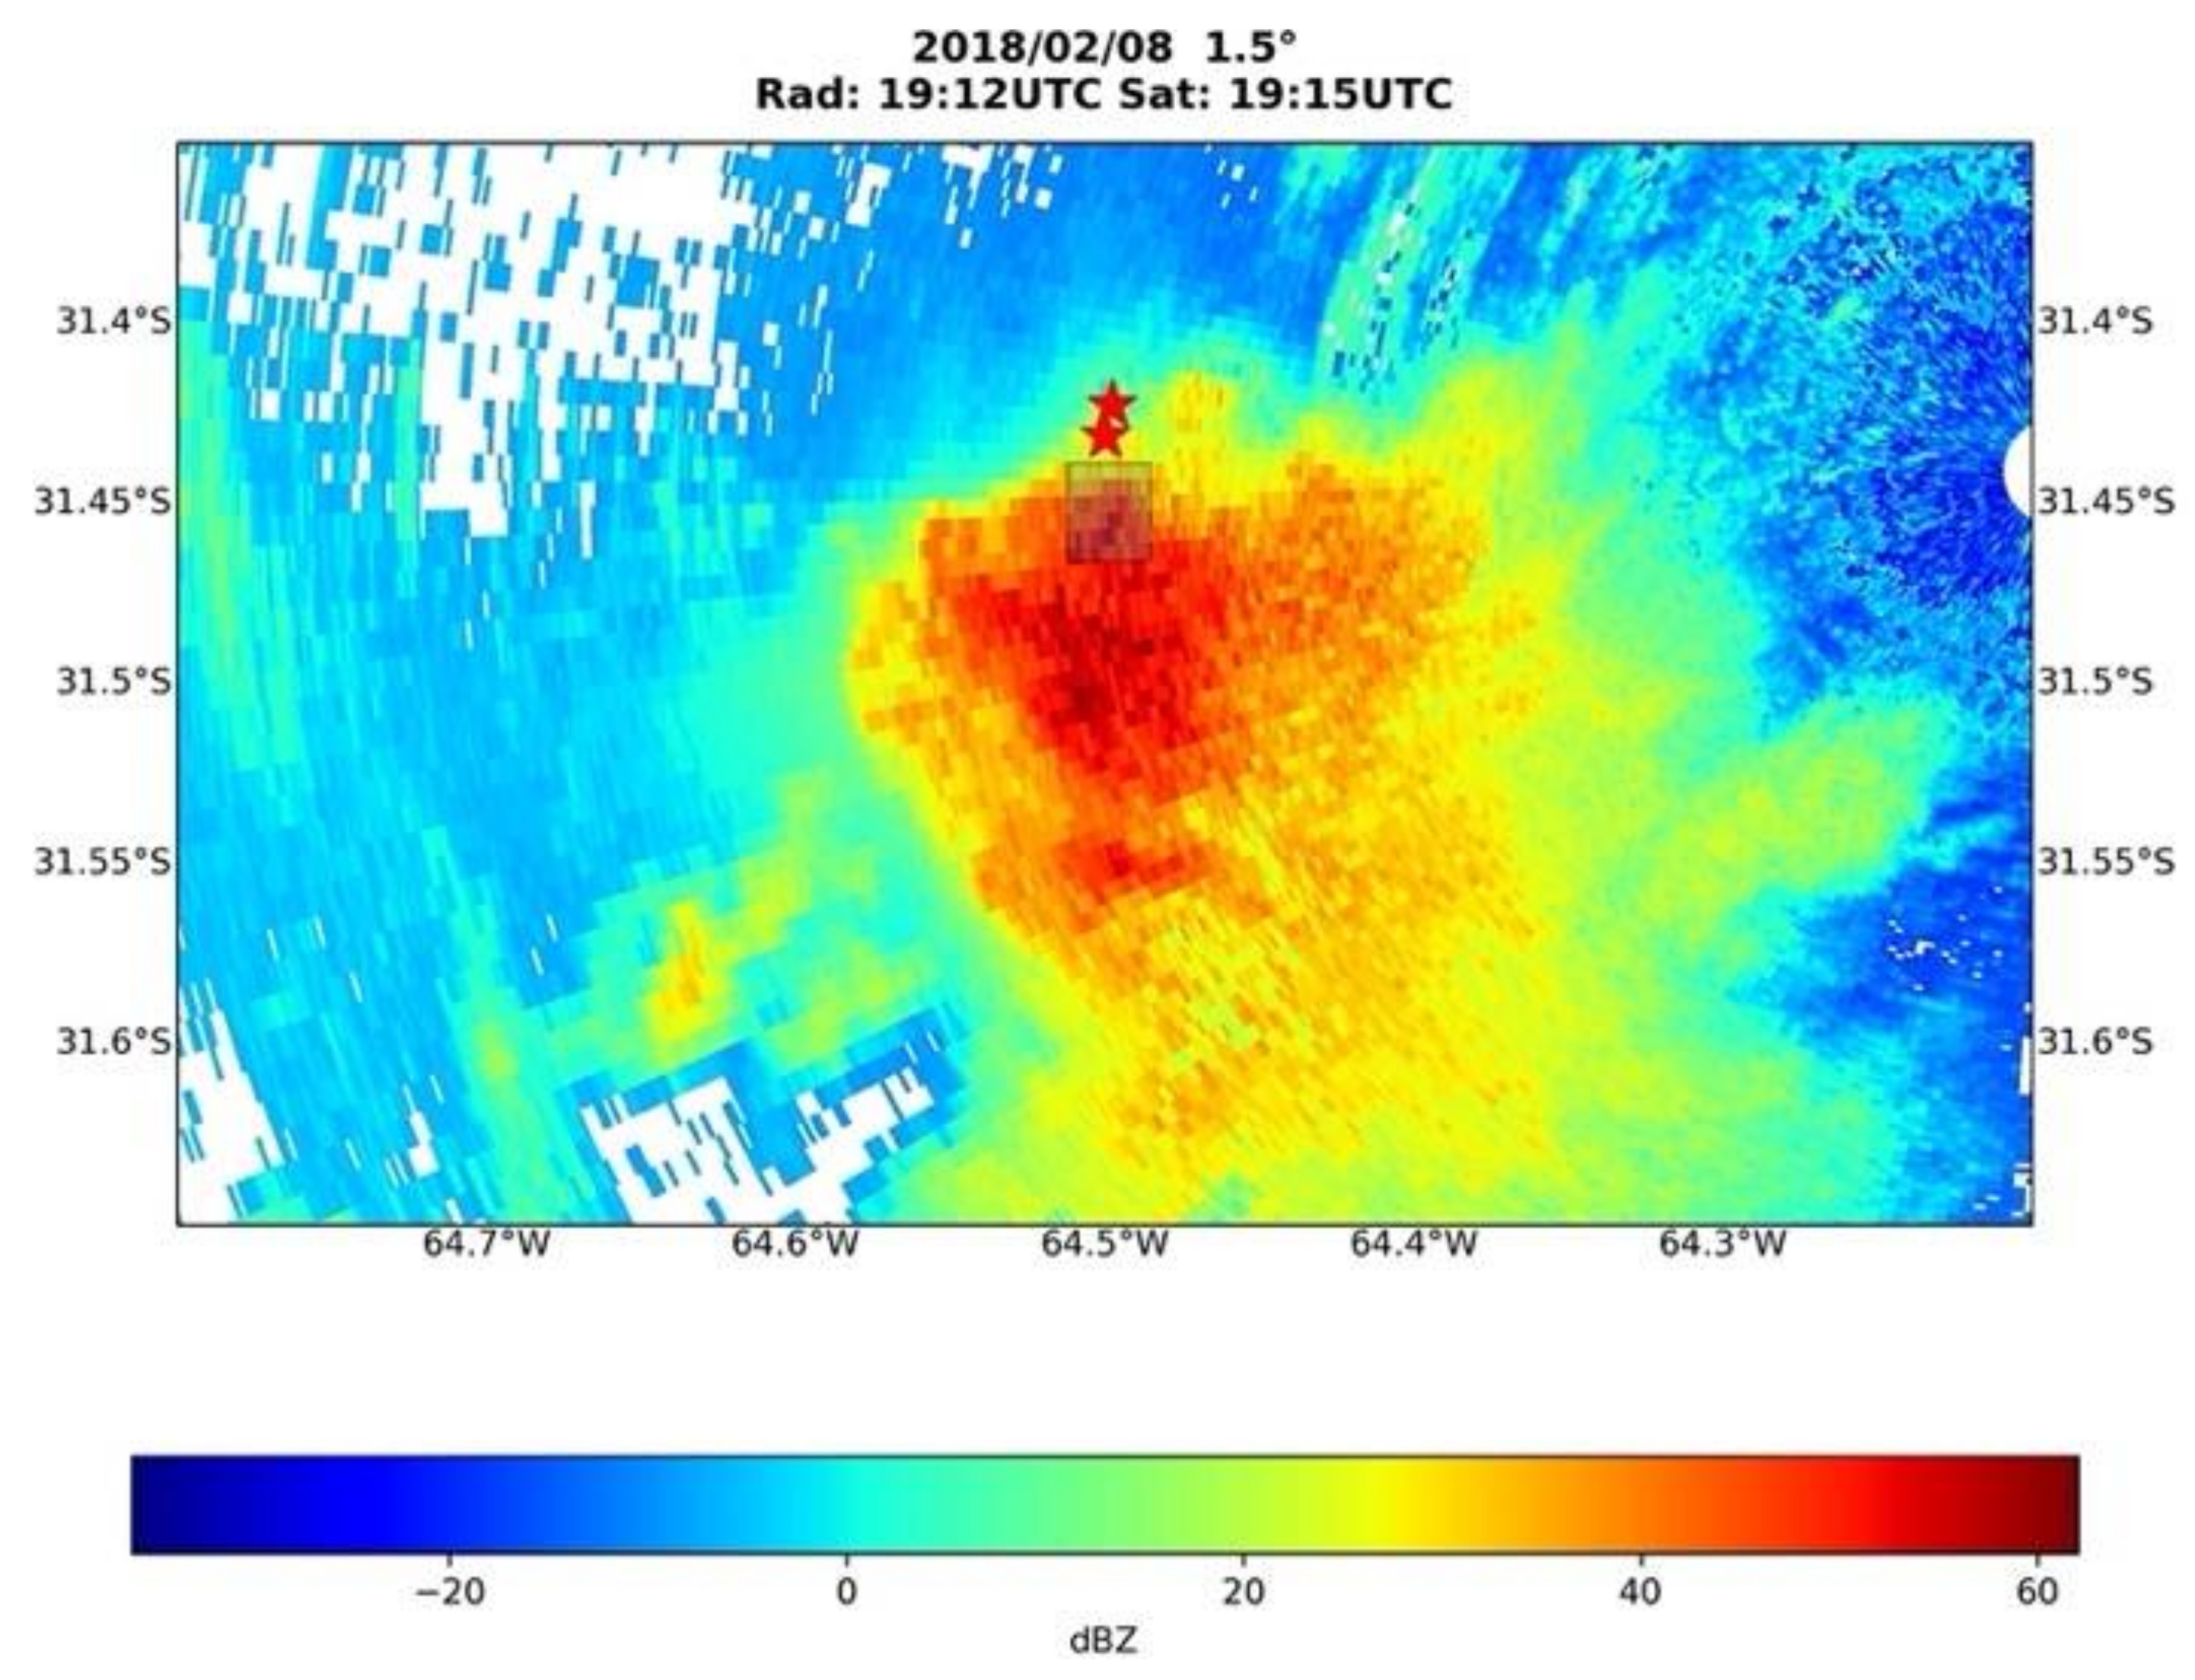
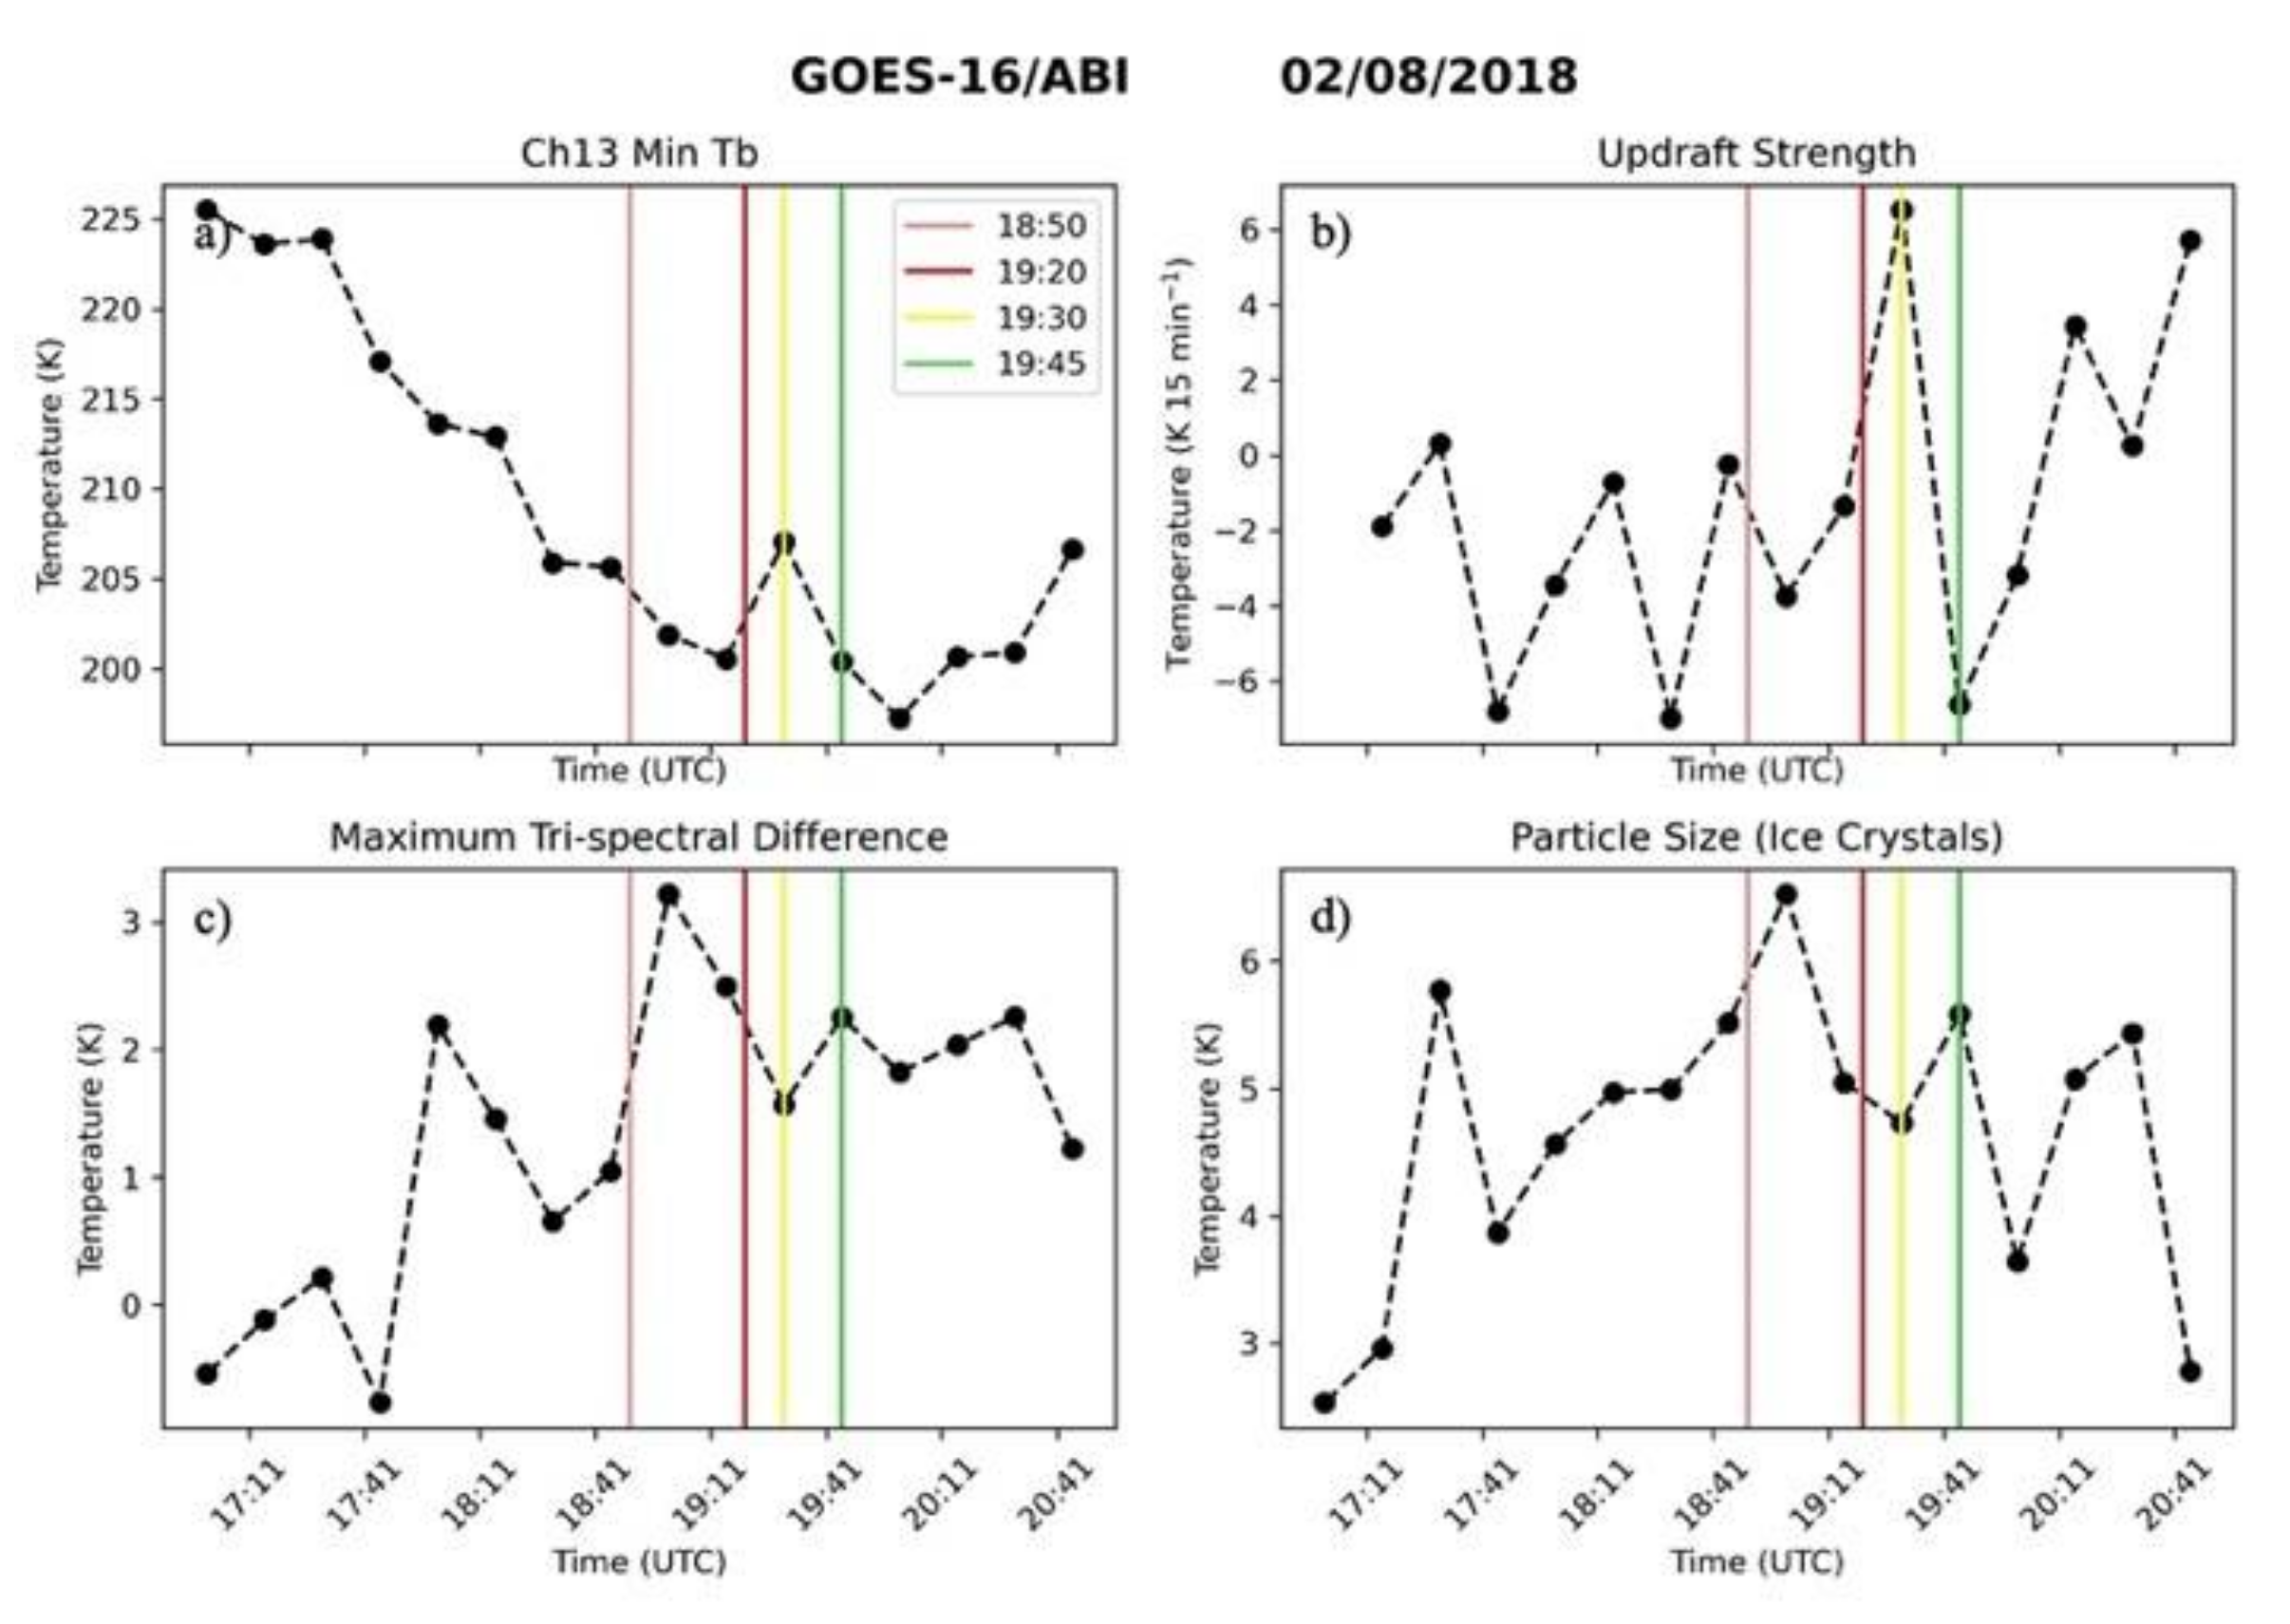
3.2.3. Temporal Trends in Satellite Data
3.3. 24 October 2020 Supercell
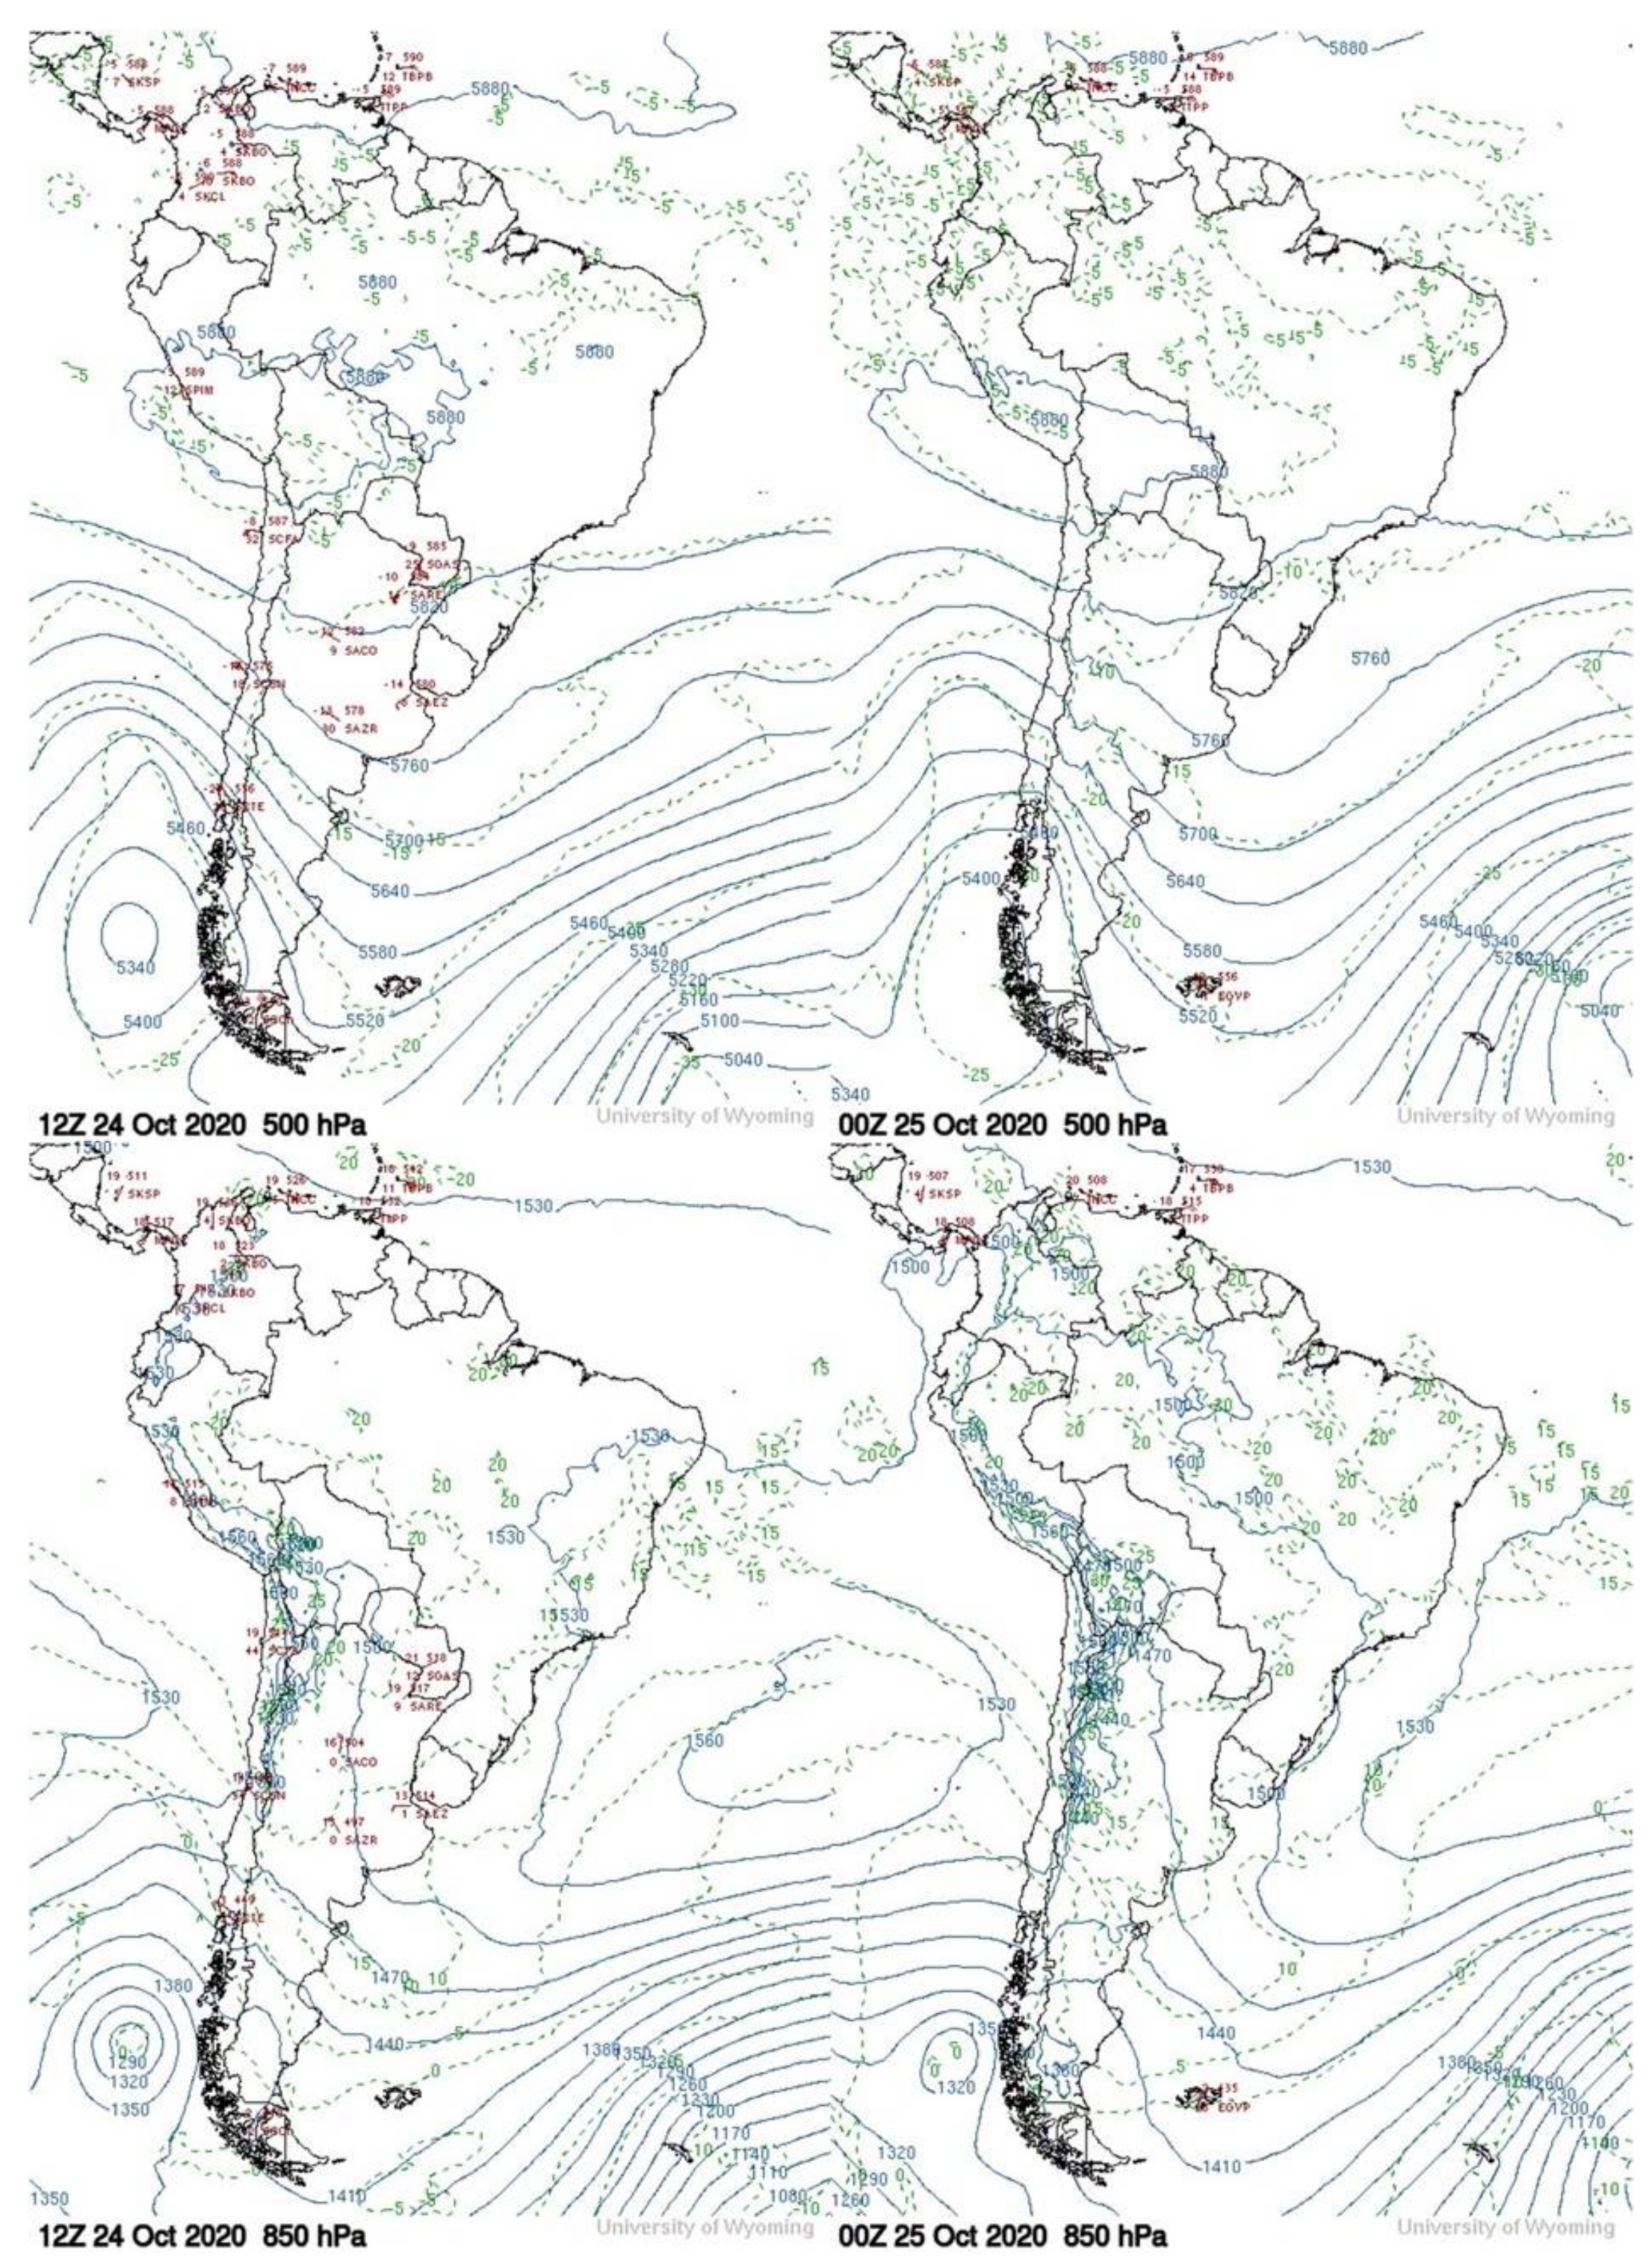
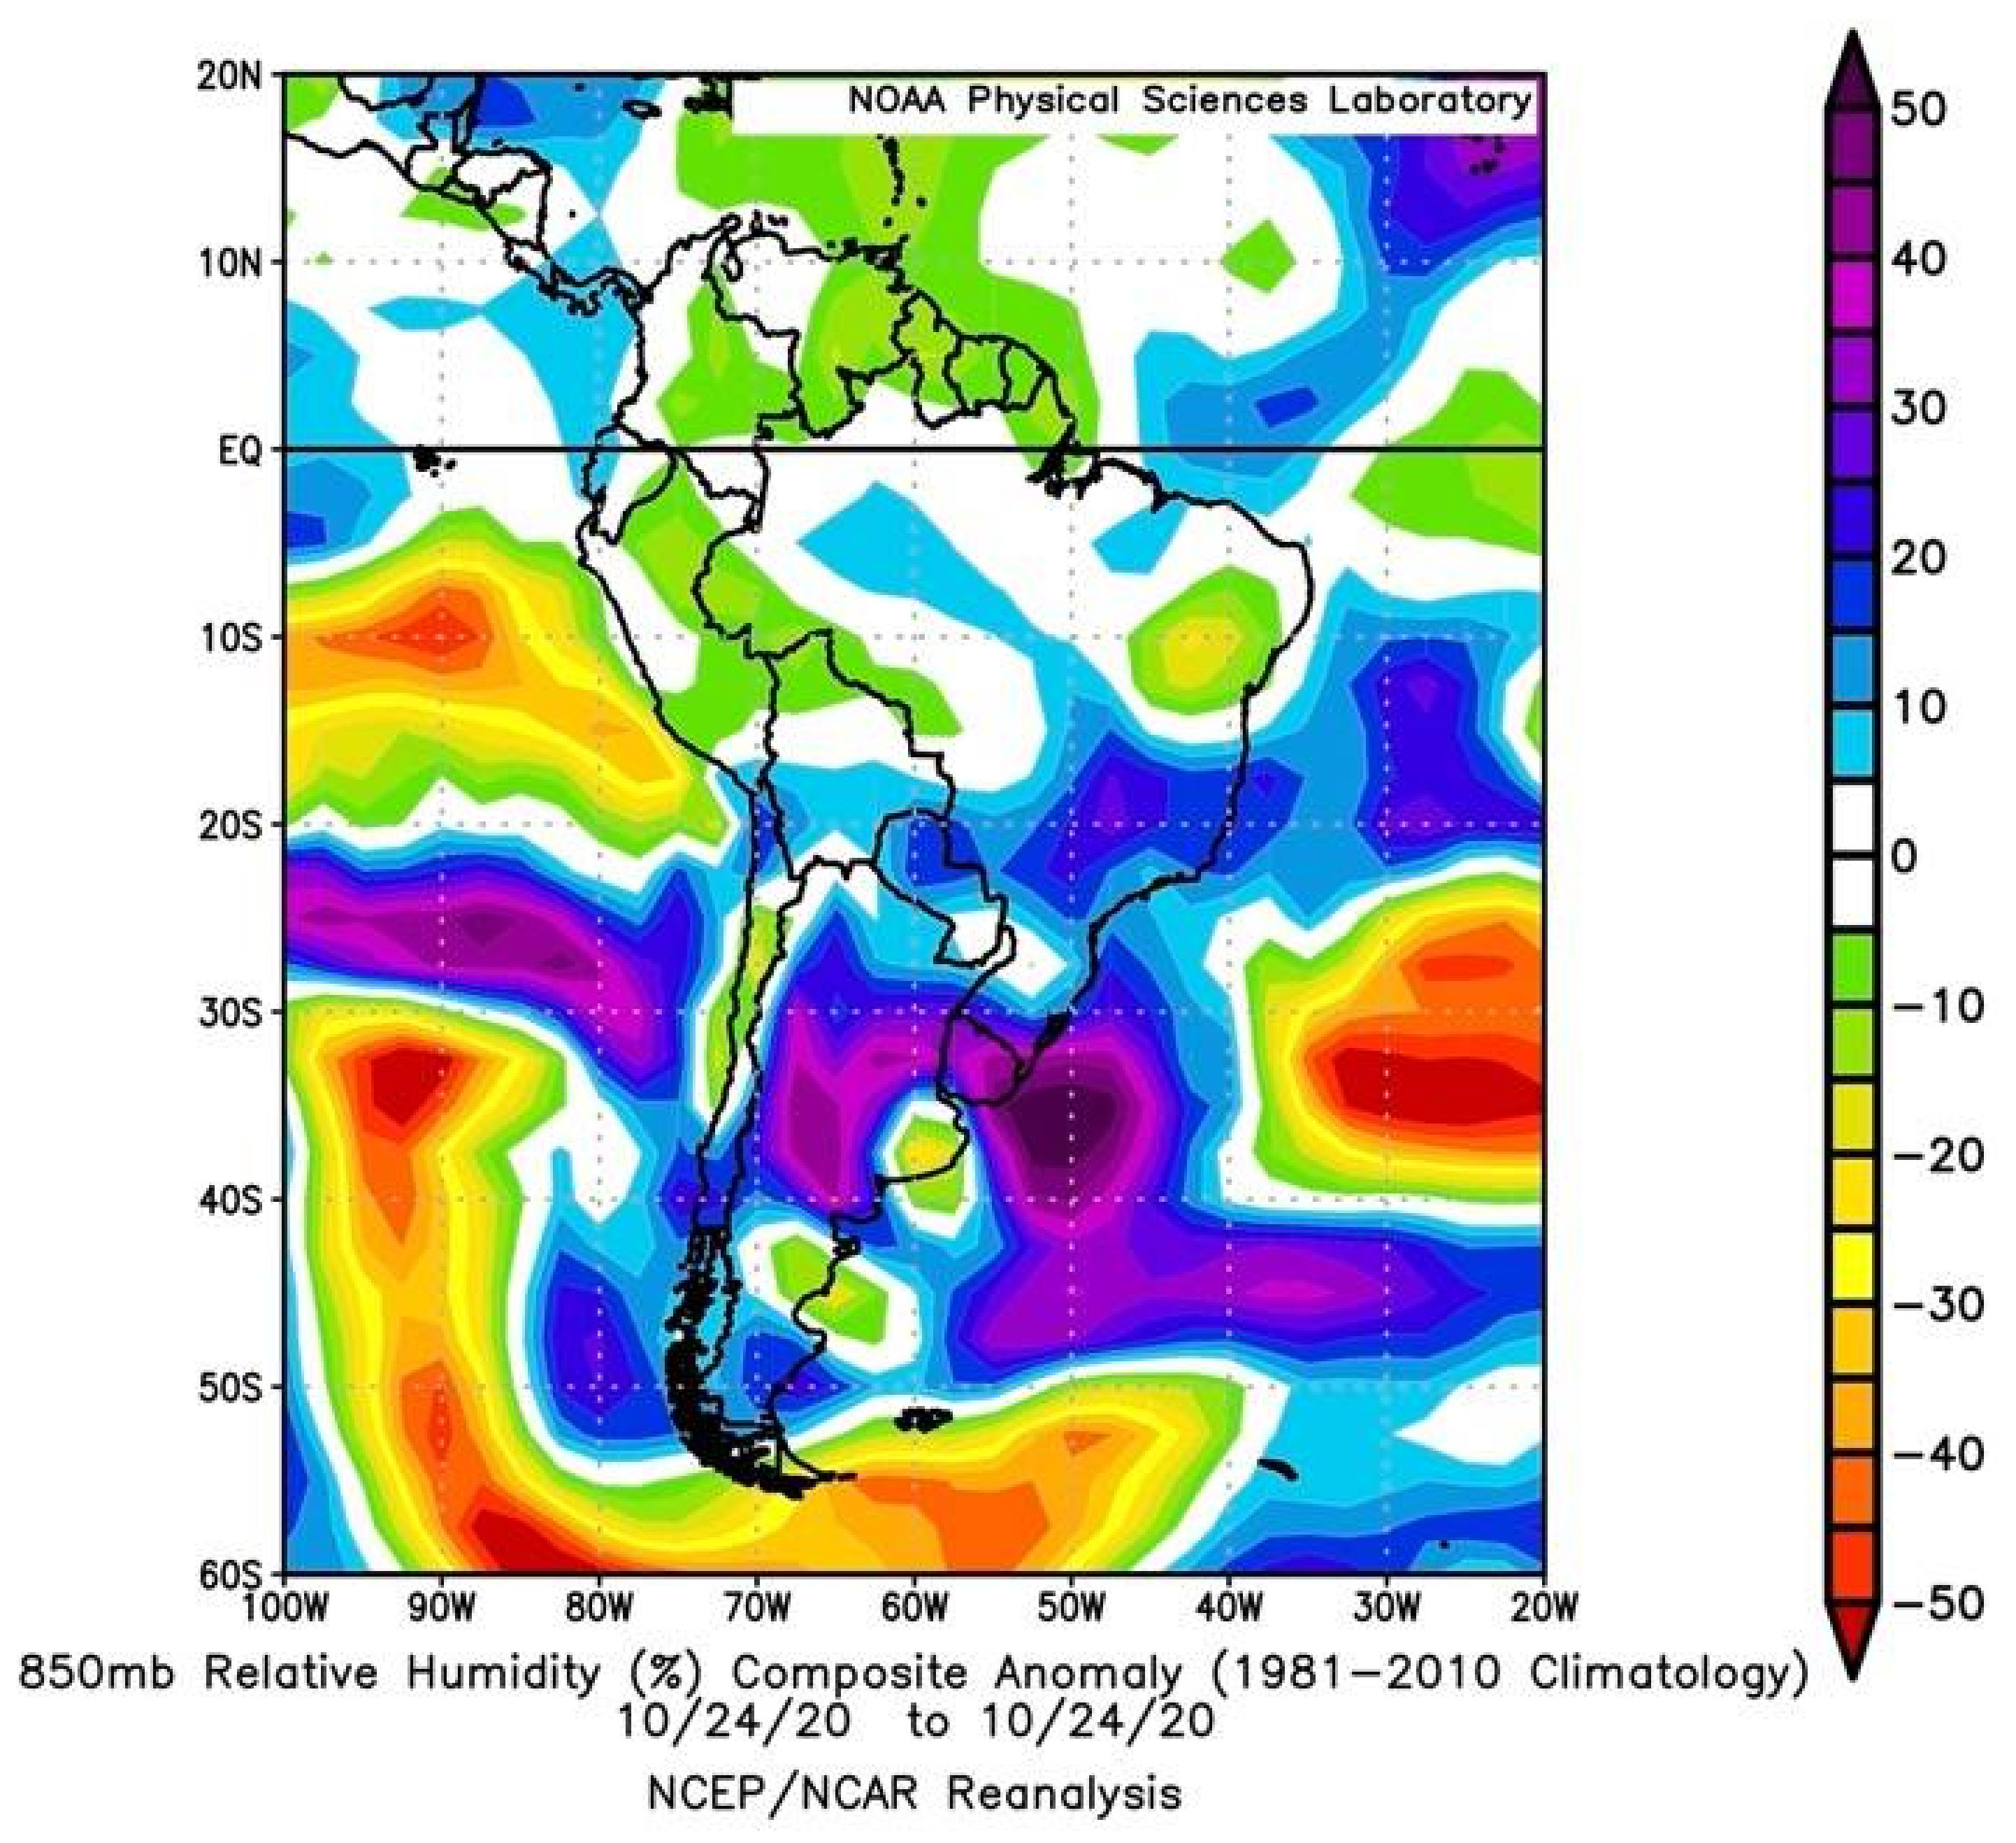
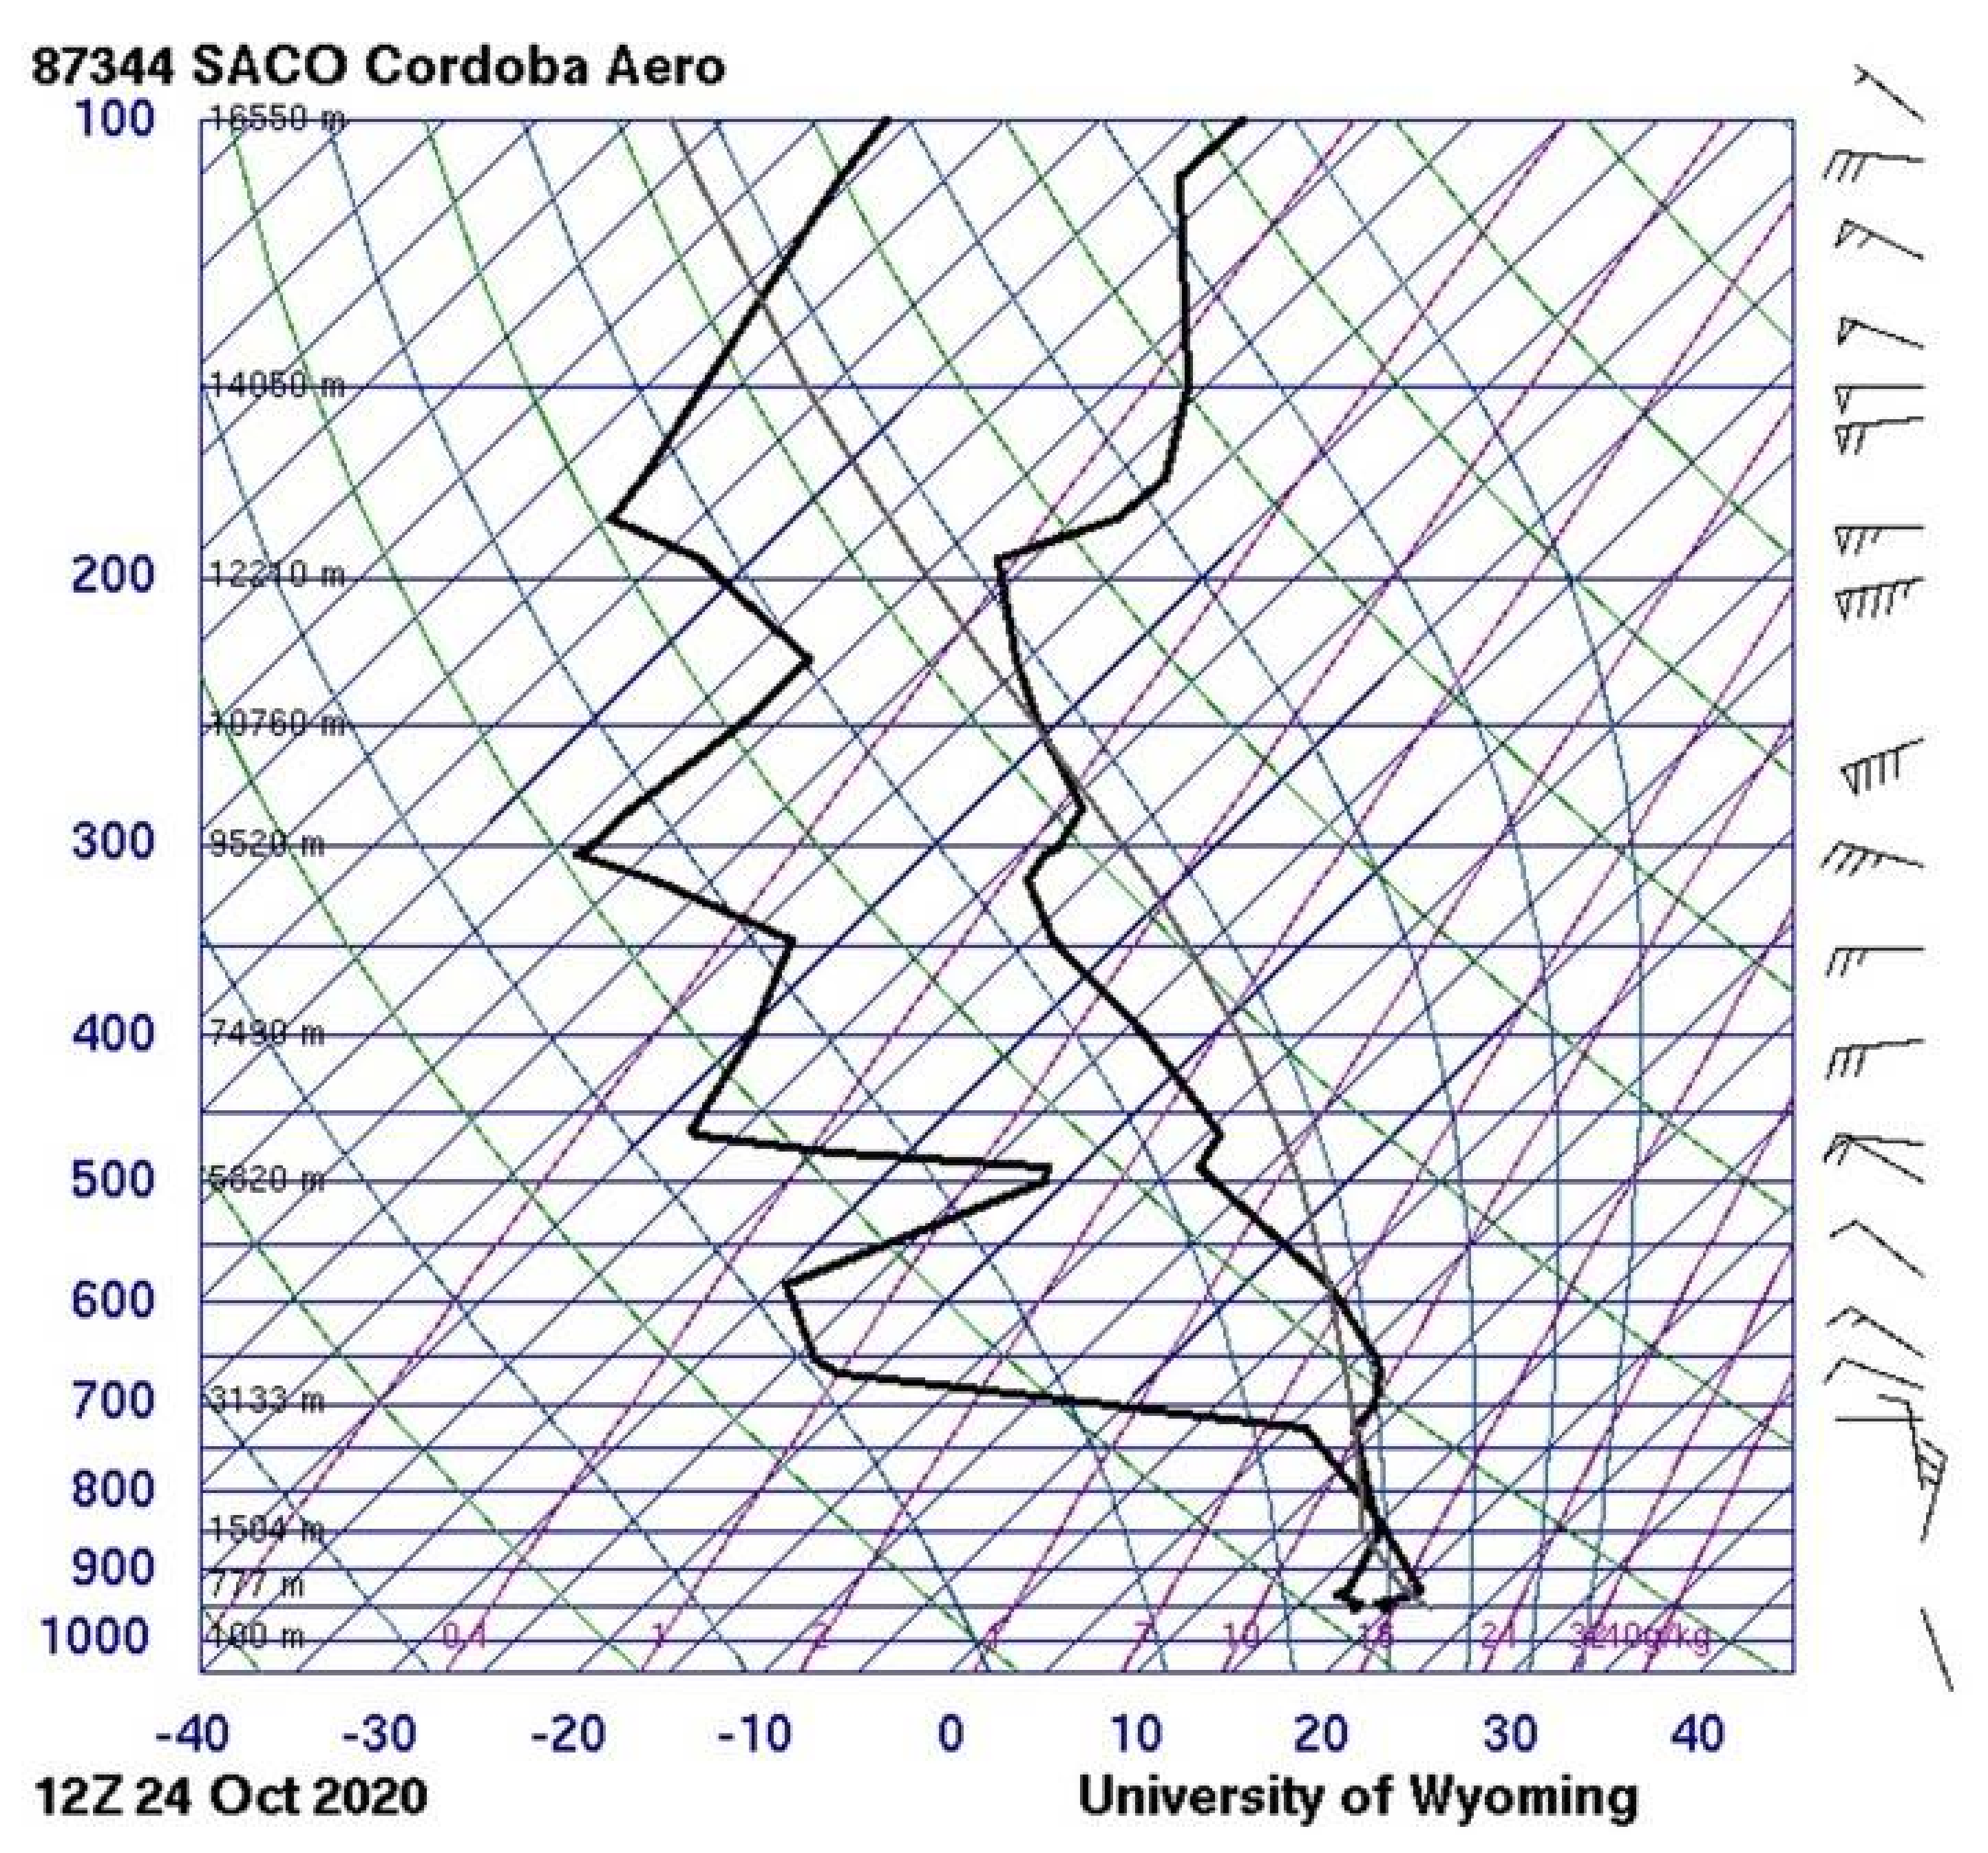
3.3.1. Environmental Setting
3.3.2. Convective Characteristics
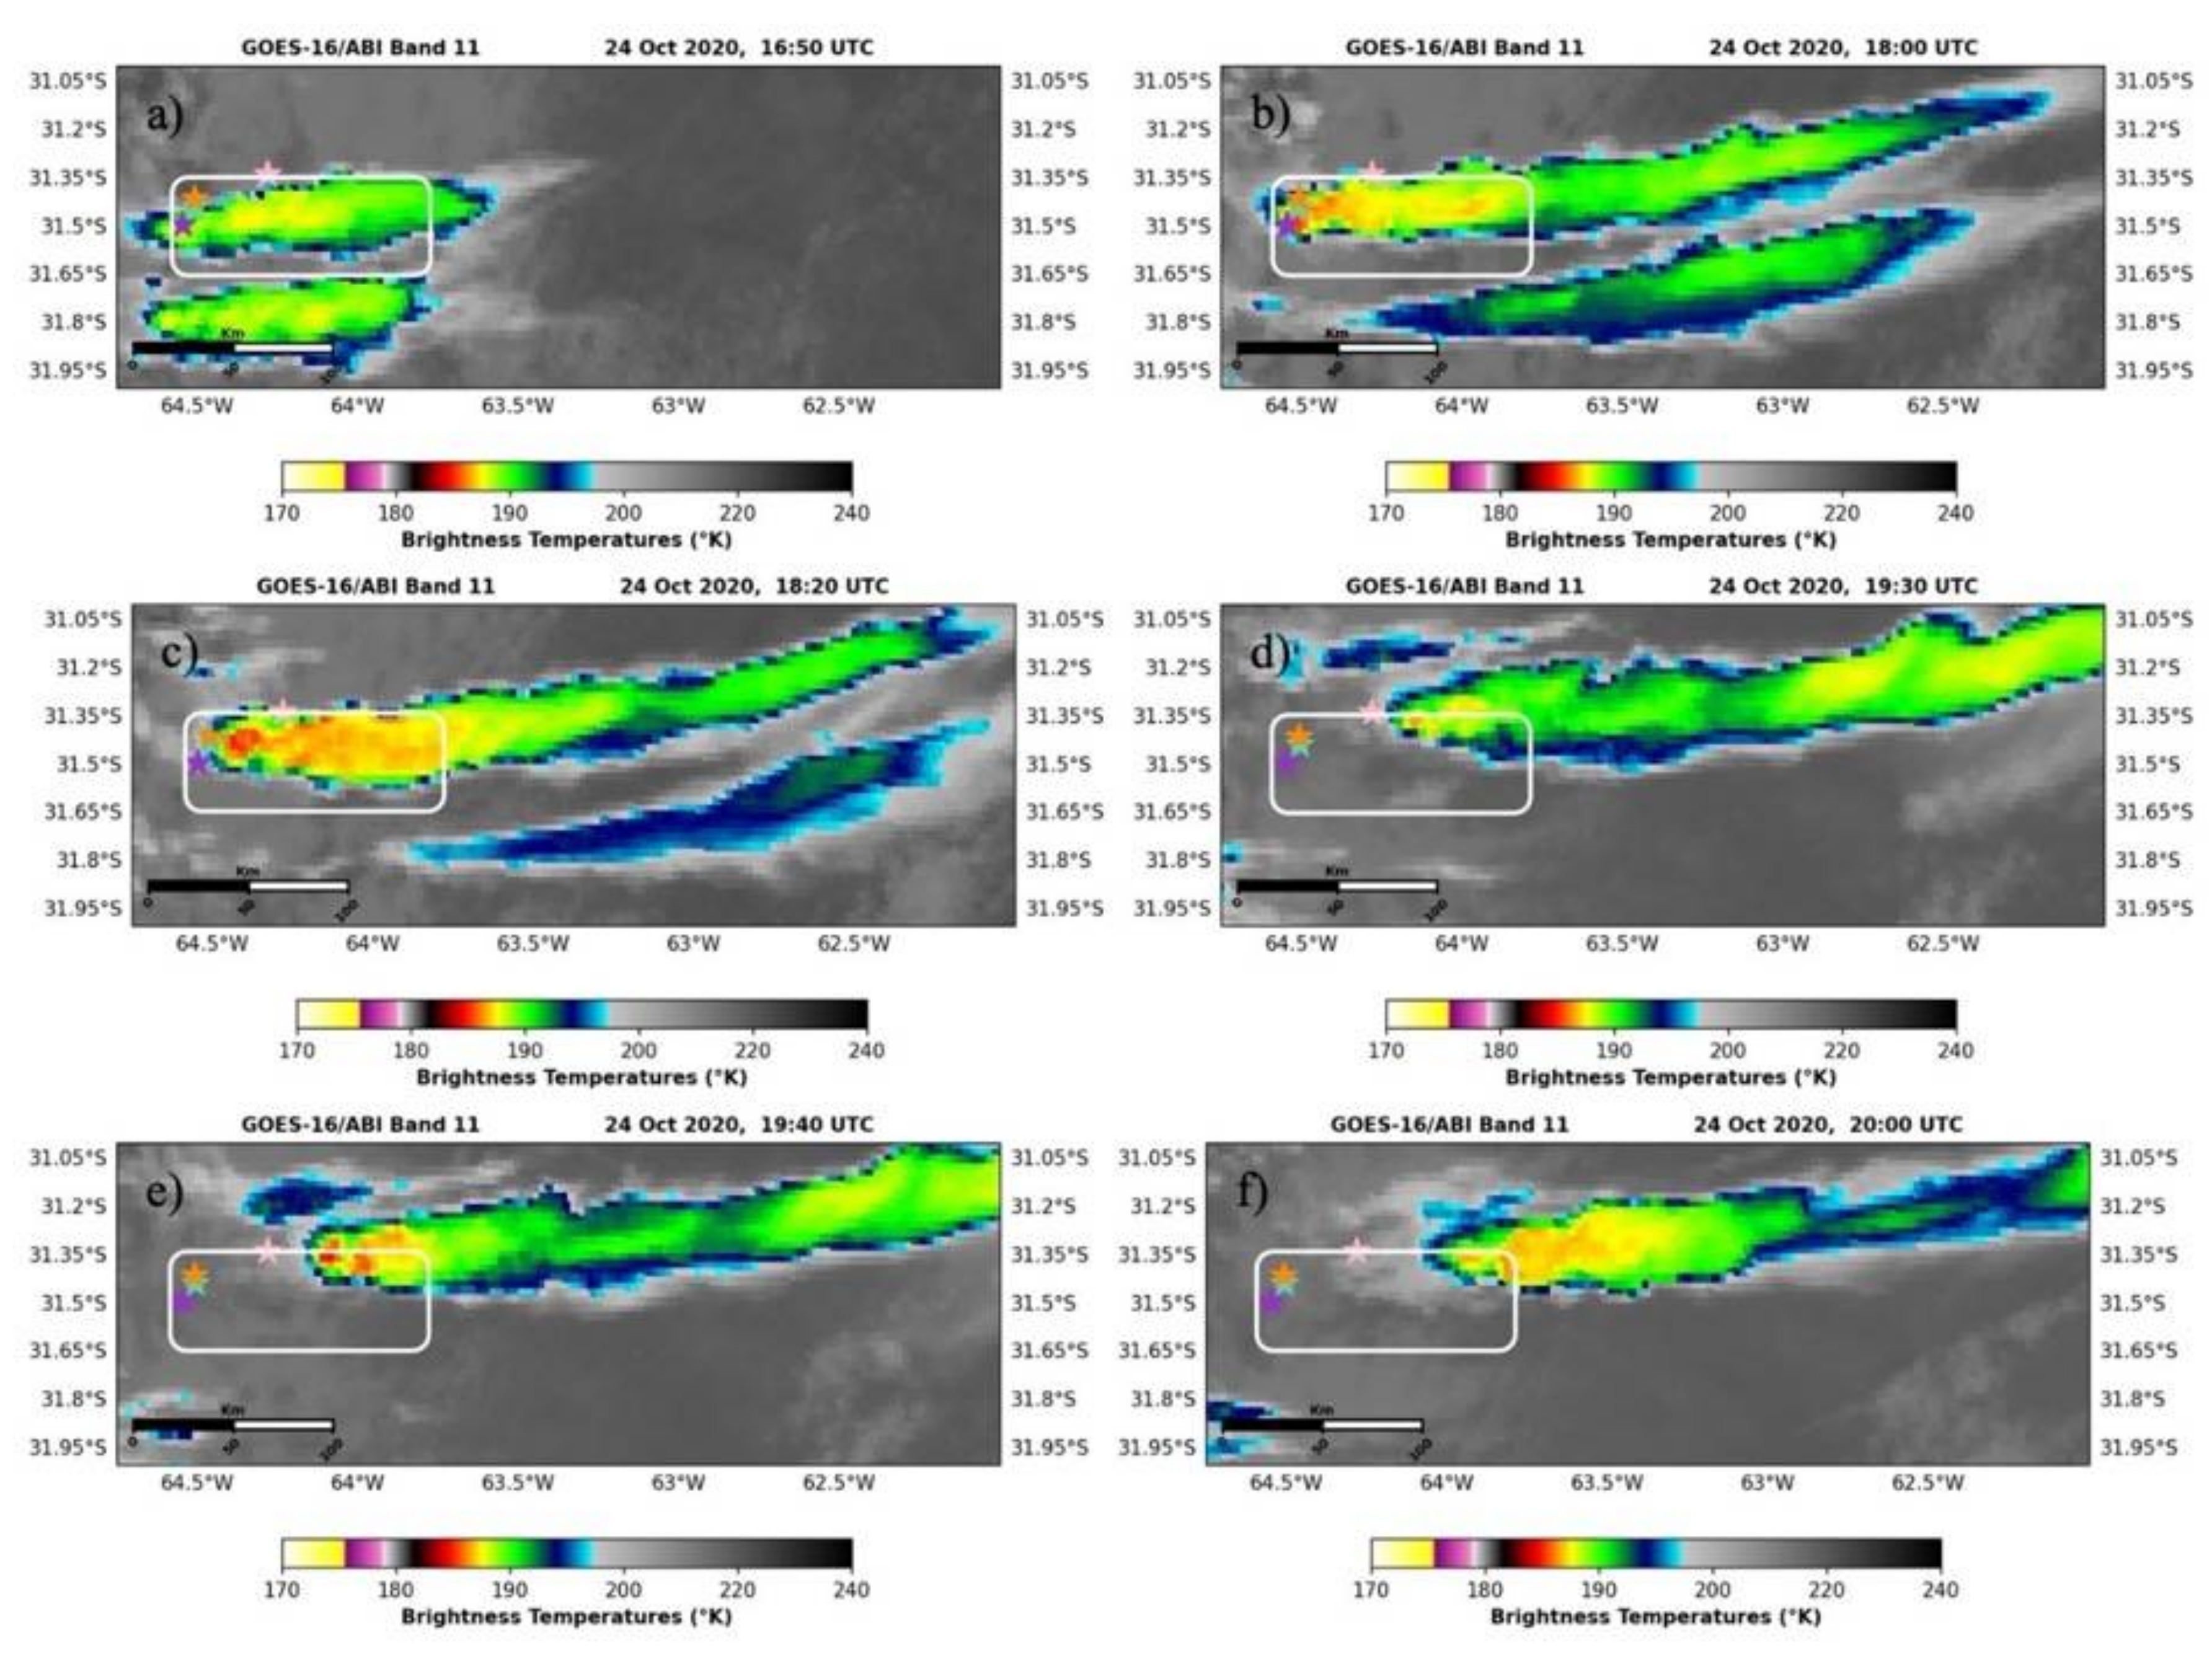
3.3.3. Temporal Trends in Satellite Data
4. Discussion
5. Conclusions
Author Contributions
Funding
Data Availability Statement
Acknowledgments
Conflicts of Interest
References
- Kumjian, M.R.; Lebo, Z.J.; Ward, A.M. Storms Producing Large Accumulations of Small Hail. J. Appl. Meteorol. Climatol. 2019, 58, 341–363. [Google Scholar] [CrossRef]
- Allen, J.T.; Tippett, M.K.; Kaheil, Y.; Sobel, A.H.; Lepore, C.; Nong, S.; Muehlbauer, A. An Extreme Value Model for U.S. Hail Size. Mon. Weather Rev. 2017, 145, 4501–4519. [Google Scholar] [CrossRef]
- Sander, J.; Eichner, J.F.; Faust, E.; Steuer, M. Rising Variability in Thunderstorm-Related U.S. Losses as a Reflection of Changes in Large-Scale Thunderstorm Forcing. Weather Clim. Soc. 2013, 5, 317–331. [Google Scholar] [CrossRef]
- Changnon, S.A. Temporal and Spatial Distributions of Damaging Hail in the Continental United States. Phys. Geogr. 2008, 29, 341–350. [Google Scholar] [CrossRef]
- Zipser, E.J.; Nesbitt, S.W.; Liu, C.; Yorty, D.P. Where Are the Most Intense Thunderstorms on Earth? Bull. Am. Meteorol. Soc. 2006, 1057–1071. [Google Scholar] [CrossRef]
- Rasmussen, K.L.; Zuluaga, M.D.; Houze, R.A., Jr. Severe Convection and Lightning in Subtropical South America. Geophys. Res. Lett. 2014, 41, 7359–7366. [Google Scholar] [CrossRef]
- Cecil, D.J.; Blankenship, C.B. Toward a Global Climatology of Severe Hailstorms as Estimated by Satellite Passive Microwave Imagers. J. Clim. 2012, 25, 687–703. [Google Scholar] [CrossRef]
- Johnson, A.W.; Sugden, K.E. Evaluation of Sounding-Derived Thermodynamic and Wind-Related Parameters Associated with Large Hail Events. Electron. J. Severe Storms Meteor. 2014, 9, 1–42. [Google Scholar]
- Jewell, R.; Brimelow, J. Evaluation of Alberta Hail Growth Model Using Severe Hail Proximity Soundings from the United States. Weather Forecast 2009, 24, 1592–1608. [Google Scholar] [CrossRef]
- Edwards, R.; Thomson, R.L. Nationwide Comparisons of Hail Size with WSR-88D Vertically Integrated Liquid Water and Derived Thermodynamic Sounding Data. Weather Forecast 1998, 13, 277–285. [Google Scholar] [CrossRef]
- Allen, J.T.; Giammanco, I.M.; Kumjian, M.R.; Jurgen Punge, H.; Zhang, Q.; Groenemeijer, P.; Kunz, M.; Ortega, K. Understanding Hail in the Earth System. Rev. Geophys. 2020, 58, e2019RG000665. [Google Scholar] [CrossRef]
- II, D.J.G.; Haupt, S.E.; Nychka, D.W.; Thompson, G. Interpretable Deep Learning for Spatial Analysis of Severe Hailstorms. Mon. Weather Rev. 2019, 147, 2827–2845. [Google Scholar] [CrossRef]
- Smith, B.T.; Thompson, R.L.; Grams, J.S.; Broyles, C.; Brooks, H.E. Convective Modes for Significant Severe Thunderstorms in the Contiguous United States. Part I: Storm Classification and Climatology. Weather Forecast 2012, 27, 1114–1135. [Google Scholar] [CrossRef]
- Bang, S.D.; Cecil, D.J. Constructing a Multifrequency Passive Microwave Hail Retrieval and Climatology in the GPM Domain. J. Appl. Meteorol. Climatol. 2019, 58, 1889–1904. [Google Scholar] [CrossRef]
- Bruick, Z.S.; Rassumen, K.L.; Cecil, D.J. Subtropical South American Hailstorm Characteristics and Environments. Mon. Weather Rev. 2019, 147, 4289–4304. [Google Scholar] [CrossRef]
- Ni, X.; Liu, C.; Cecil, D.J.; Zhang, Q. On the Detection of Hail Using Satellite Passive Microwave Radiometers and Precipitation Radar. J. Appl. Meteorol. Climatol. 2017, 56, 2693–2709. [Google Scholar] [CrossRef]
- Nesbitt, S.W.; Salio, P.V.; Ávila, E.; Bitzer, P.; Carey, L.; Chandrasekar, V.; Deierling, W.; Dominguez, F.; Dillon, M.E.; Garcia, C.M.; et al. A Storm Safari in Subtropical South America: Proyecto RELAMPAGO. Bull. Am. Meteorol. Soc. 2021, 102, E1621–E1644. [Google Scholar] [CrossRef]
- Arena, L.; Crespo, A. Recopilación de Estudios Primarios de Caracterización Cristalográfica de Granizos y de las Tormentas que los Originan; Universidad Nacional de Córdoba: Córdoba, Argentina, 2019. [Google Scholar]
- Mulholland, J.P.; Nesbitt, S.W.; Trapp, R.J.; Rasmussen, K.L.; Salio, P.V. Convective Storm Life Cycle and Environments near the Sierras de Córdoba, Argentina. Mon. Weather Rev. 2018, 146, 2541–2557. [Google Scholar] [CrossRef]
- Vidal, L. Convección Extrema Sobre Sudamérica: Estructura Interna, Ciclos de Vida e Influencia de la Topografía en la Iniciación. Ph.D. Thesis, Universidad de Buenos Aires, Buenos Aires, Argentina, 2014. [Google Scholar]
- Sasaki, C.R.S.; Rowe, A.K.; McMurdie, L.A.; Rasmussen, K.L. New Insights into the South American Low-Level Jet from RELAMPAGO Observations. Mon. Weather Rev. 2022, 150, 161. [Google Scholar] [CrossRef]
- Jones, C. Recent Changes in the South America Low-Level Jet. Npj Clim. Atmos. Sci. 2019, 2, 20. [Google Scholar] [CrossRef]
- Rasmussen, K.L.; Houze, R.A., Jr. Convective Initiation near the Andes in Subtropical South America. Mon. Weather Rev. 2016, 144, 2351–2374. [Google Scholar] [CrossRef]
- Salio, P.; Nicolini, M.; Saulo, A.C. Chaco Low-Level Jet Events Characterization during the Austral Summer Season. J. Geophys. Res. Atmos. 2002, 107, ACL 32-1–ACL 32-17. [Google Scholar] [CrossRef]
- Ribeiro, B.Z.; Machado, L.A.T.; Huamán Ch, J.H.; Biscaro, T.S.; Reitas, E.D.; Mozer, K.W.; Goodman, S.J. An Evaluation of the GOES-16 Rapid Scan for Nowcasting in Southeastern Brazil: Analysis of a Severe Hailstorm Case. Weather Forecast 2019, 34, 1829–1847. [Google Scholar] [CrossRef]
- Merino, A.; López, L.; Sánchez, J.L.; García-Ortega, E.; Cattani, E.; Levizzani, V. Daytime Identification of Summer Hailstorm Cells from MSG Data. Nat. Hazards Earth Syst. Sci. 2014, 14, 1017–1033. [Google Scholar] [CrossRef]
- Ravinder, A.; Reddy, P.K.; Prasad, N. Detection of Wavelengths for Hail Identification Using Satellite Imagery of Clouds; IEEE: Madrid, Spain, 2013; pp. 205–211. [Google Scholar]
- Bauer-Messmer, B.; Waldovel, A. Satellite Data Based Detection and Prediction of Hail. Atmos. Res. 1997, 43, 217–231. [Google Scholar] [CrossRef]
- Konduru, R.T.; Kishtawal, C.M.; Shah, S. A New Perspective on the Infrared Brightness Temperature Distribution of the Deep Convective Clouds. J. Earth Syst. Sci. 2013, 122, 1195–1206. [Google Scholar] [CrossRef][Green Version]
- Roca, R.; Ramanathan, V. Scale Dependence of Monsoonal Convective Systems over the Indian Ocean. J. Clim. 2000, 13, 1286–1298. [Google Scholar] [CrossRef]
- Müller, R.; Jerg, M.; Haussler, S.; Heizenreder, D. A Novel Approach for the Detection of Developing Thunderstorm Cells. Remote Sens. 2019, 11, 443. [Google Scholar] [CrossRef]
- Borque, P.; Vidal, L.; Rugna, M.; Lang, T.J.; Nicora, M.G.; Nesbitt, S.W. Distinctive Signals in 1-Min Observations of Overshooting Tops and Lightning Activity in a Severe Supercell Thunderstorm. J. Geophys. Res. Atmos. 2020, 125, e2020JD032856. [Google Scholar] [CrossRef]
- Kumjian, M.R.; Gutierrez, R.; Soderholm, J.S.; Nesbitt, S.W.; Maldonado, P.; Luna, L.M.; Marquis, J.; Bowley, K.A.; Imaz, M.A.; Salio, P. Gargantuan Hail in Argentina. Bull. Am. Meteorol. Soc. 2020, 101, E1241–E1258. [Google Scholar] [CrossRef]
- Arena, L.E. Granizos Gigantes de Córdoba-Argentina I. El Coloso Victoria; Universidad Nacional de Córdoba (UNC): Córdoba, Argentina, 2020. [Google Scholar]
- Mecikalski, J.R.; Bedka, K.M. Forecasting Convective Initiation by Monitoring the Evolution of Moving Cumulus in Daytime GOES Imagery. Mon. Weather Rev. 2006, 134, 49–78. [Google Scholar] [CrossRef]
- Roberts, R.D.; Rutledge, S. Nowcasting Storm Initiation and Growth Using GOES-8 and WSR-88D Data. Weather Forecast 2003, 18, 562–584. [Google Scholar] [CrossRef]
- Adler, R.F.; Fenn, D.D. Thunderstorm Vertical Velocities Estimated from Satellite Data. J. Atmos. Sci. 1979, 36, 1747–1754. [Google Scholar] [CrossRef]
- Ackerman, S.A.; Smith, W.L.; Revercomb, H.E.; Spinhirne, J.D. The 27–28 October 1986 FIRE IFO Cirrus Case Study: Spectral Properties of Cirrus Clouds in the 8–12 μM Window. Mon. Weather Rev. 1990, 118, 2377–2388. [Google Scholar] [CrossRef]
- Strabala, K.I.; Ackerman, S.A.; Menzel, W.P. Cloud Properties Inferred from 8–12-Μm Data. J. Appl. Meteorol. Climatol. 1994, 33, 212–229. [Google Scholar] [CrossRef]
- University of Wyoming. Upper Air Weather Maps. Available online: https://weather.uwyo.edu/upperair/uamap.shtml (accessed on 26 March 2022).
- University of Wyoming. Atmospheric Soundings. Available online: https://weather.uwyo.edu/upperair/sounding.html (accessed on 26 March 2022).
- NOAA Physical Sciences Laboratory. Daily Climate Composites. Available online: https://psl.noaa.gov/data/composites/day/ (accessed on 26 March 2022).
- NCAR Earth Observing Laboratory. RELAMPAGO Field Catalog. Available online: https://catalog.eol.ucar.edu/relampago (accessed on 26 March 2022).
- Piersante, J.; Schumacher, R.; Rasmussen, K. Comparison of Biases in Warm-Season WRF Forecasts in North and South America. Weather Forecast 2021, 36, 979–1101. [Google Scholar] [CrossRef]
- Montini, T.L.; Jones, C.; Carvalho, L.M.V. The South American Low-Level Jet: A New Climatology, Variability, and Changes. J. Geophys. Res. Atmos. 2019, 124, 1200–1218. [Google Scholar] [CrossRef]
- Vera, C.; Baez, J.; Douglas, M.; Emmanuel, C.B.; Marengo, J.; Meitin, J.; Nicolini, M.; Nogues-Paegle, J.; Paegle, J.; Penalba, O.; et al. The South American Low-Level Jet Experiment. Bull. Am. Meteorol. Soc. 2006, 87, 63–78. [Google Scholar] [CrossRef]
- Saulo, A.C.; Nicolini, M. The Atmospheric Conditions Preceding the Occurrence of a Strong Low Level Jets East of the Andes during January 1998; Diego Portales Convention Center Santiago: Santiago, Chile, 1999. [Google Scholar]
- Datos Argentina. Available online: https://datos.gob.ar/ (accessed on 26 March 2022).
- Bedka, K.; Murillo, E.M.; Homeyer, C.R.; Scarino, B.; Mersiovsky, H. The Above-Anvil Cirrus Plume: An Important Severe Weather Indicator in Visible and Infrared Satellite Imagery. Weather Forecast 2018, 33, 1159–1181. [Google Scholar] [CrossRef]
- Michaud, A.B.; Dore, J.E.; Leslie, D.; Lyons, W.B.; Sands, D.C.; Priscu, J.C. Biological Ice Nucleation Initiates Hailstone Formation. J. Geophys. Res. Atmos. 2014, 119, 12186–12197. [Google Scholar] [CrossRef]
- Beal, A.; Martins, L.D.; Martins, J.A.; Rudke, A.P.; de Almeida, D.S.; Costa, L.M.; Tarley, C.R.T. Evaluation of the Chemical Composition of Hailstones from Triple Border Paraná, Santa Catarina (Brazil) and Argentina. Atmos. Pollut. Res. 2021, 12, 184–192. [Google Scholar] [CrossRef]


| Date | Time of Hail Event (UTC) | Sample Size | Location | Coordinates | Information Source | Maximum Hail Size (cm) | |
|---|---|---|---|---|---|---|---|
| Sample Collected | Social Media/Local News | ||||||
| 8 February 2018 | 18:50 | None | Icho Cruz | −31.470844, −64.541380 | No | Yes | 5 |
| 19:20 | 48 | Calle San Lorenzo, VCP | −31.422844, −64.497452 | Yes | Yes | 17 | |
| 19:20 | Calle Tupungato, VCP | −31.430425, −64.499612 | Yes | Yes | 8 | ||
| 19:30 | Calle Tokio, VCP | −31.421580, −64.500763 | Yes | Yes | 4 | ||
| 19:45 | None | San Nicolás | −31.435851, −64.456595 | No | Yes | None | |
| 14 December 2018 | 02:20 | 1 | Villa del Dique | −32.201393, −64.452606 | Yes | Yes | 8 |
| 03:00 | 8 | Córdoba, Córdoba | −31.4201, −64.1888 | Yes | No | 1.3 | |
| 24 October 2020 | 18:20 | 4 | VCP | −31.434703, −64.504108 | Yes | Yes | 3 |
| 18:32 | San Antonio de Redondo | −31.492307, −64.544306 | No | Yes | 1.5 | ||
| 18:35 | VCP N | −31.411644, −64.506675 | Yes | No | 1.5 | ||
| 19:27 | None | Villa Allende | −31.335028, −64.279508 | No | Yes | 1.5 | |
Publisher’s Note: MDPI stays neutral with regard to jurisdictional claims in published maps and institutional affiliations. |
© 2022 by the authors. Licensee MDPI, Basel, Switzerland. This article is an open access article distributed under the terms and conditions of the Creative Commons Attribution (CC BY) license (https://creativecommons.org/licenses/by/4.0/).
Share and Cite
Bernal Ayala, A.C.; Rowe, A.K.; Arena, L.E.; Desai, A.R. Evaluation of Satellite-Derived Signatures for Three Verified Hailstorms in Central Argentina. Meteorology 2022, 1, 183-210. https://doi.org/10.3390/meteorology1020013
Bernal Ayala AC, Rowe AK, Arena LE, Desai AR. Evaluation of Satellite-Derived Signatures for Three Verified Hailstorms in Central Argentina. Meteorology. 2022; 1(2):183-210. https://doi.org/10.3390/meteorology1020013
Chicago/Turabian StyleBernal Ayala, Anthony C., Angela K. Rowe, Lucia E. Arena, and Ankur R. Desai. 2022. "Evaluation of Satellite-Derived Signatures for Three Verified Hailstorms in Central Argentina" Meteorology 1, no. 2: 183-210. https://doi.org/10.3390/meteorology1020013
APA StyleBernal Ayala, A. C., Rowe, A. K., Arena, L. E., & Desai, A. R. (2022). Evaluation of Satellite-Derived Signatures for Three Verified Hailstorms in Central Argentina. Meteorology, 1(2), 183-210. https://doi.org/10.3390/meteorology1020013