1. Introduction
In recent decades, there has been a continuous decrease in the track forecast error of tropical cyclones (TCs) [
1,
2,
3]. Consequently, according to Cangiolasi et al. [
3], improvements in TC track forecasting constitute one of the advances in Earth sciences in recent years. In contrast, intensity forecast errors have slowly decreased [
4]. In both cases, the decrease in tropical cyclone forecast errors has been driven by the development of numerical weather prediction models [
3,
5,
6]. Precisely, the outputs of the numerical prediction models are used by the National Hurricane Center (NHC) of the United States as guidance in support of its official TC forecasts over the NATL basin.
Based on the need to improve forecasts of intensity, the trajectory of TCs and their associated phenomena due to their social and economic impacts, the National Oceanic and Atmospheric Administration (NOAA) of the United States launched the Hurricane Forecast Improvement Project (HFIP) [
7] in 2008. One of the models within the HFIP framework that has shown a high ability to predict the intensity, trajectory and structure of TCs in the last decade is the Hurricane Weather Research and Forecasting Model (HWRF) [
6,
8], which has been operational at the National Centers for Environmental Prediction (NCEP) since 2007. The HWRF model is updated every year to improve its ability to predict TCs in all basins. As part of the HFIP project, the Hurricanes in a Multi-scale Ocean-coupled Nonhydrostatic (HMON) model has been operational at NCEP since 2017 [
8].
The HWRF and the HMON models are complex systems that require high computing resources. This requirement makes their implementation difficult in the national meteorological services in low-income countries for forecasting and research purposes. To resolve this limitation, Pérez-Alarcón et al. [
9] developed the Numerical Tools for Hurricane Forecast (NTHF) system. NTHF is based on the atmospheric component of the HWRF and has been operational at the Department of Meteorology of the Higher Institute of Technologies and Applied Sciences, University of Havana (InSTEC-UH), Cuba, since the 2019 TC season in the NATL basin.
Pérez-Alarcón et al. [
9] addressed that NTHF is skillful in track forecasting, especially for predicting intense hurricanes trajectories. In addition, NTHF proved to be able to forecast the intensity of TCs from a tropical depression to Category 3 hurricanes on the Saffir–Simpson scale between 36 and 120 forecast hours. Meanwhile, for intense hurricanes (Categories 4 and 5), the lowest errors were recorded between 72 and 108 forecast hours. Fernández-Alvarez et al. [
10] also pointed out that NTHF exhibited good performance in predicting the precipitation associated with TCs. A recent evaluation by Pérez-Alarcón et al. [
11] found that NTHF’s ability in the 2020 NATL TC season was higher than its average ability in the 2016–2019 period. In both evaluations [
9,
11], the limitations of NTHF for intensity forecasting were noted.
In this study, we focus on evaluating the performance of the NTHF system during the first five years (2016–2020) of operational runs for predicting the intensity and trajectory of TCs formed in the NATL basin.
NTHF Overview
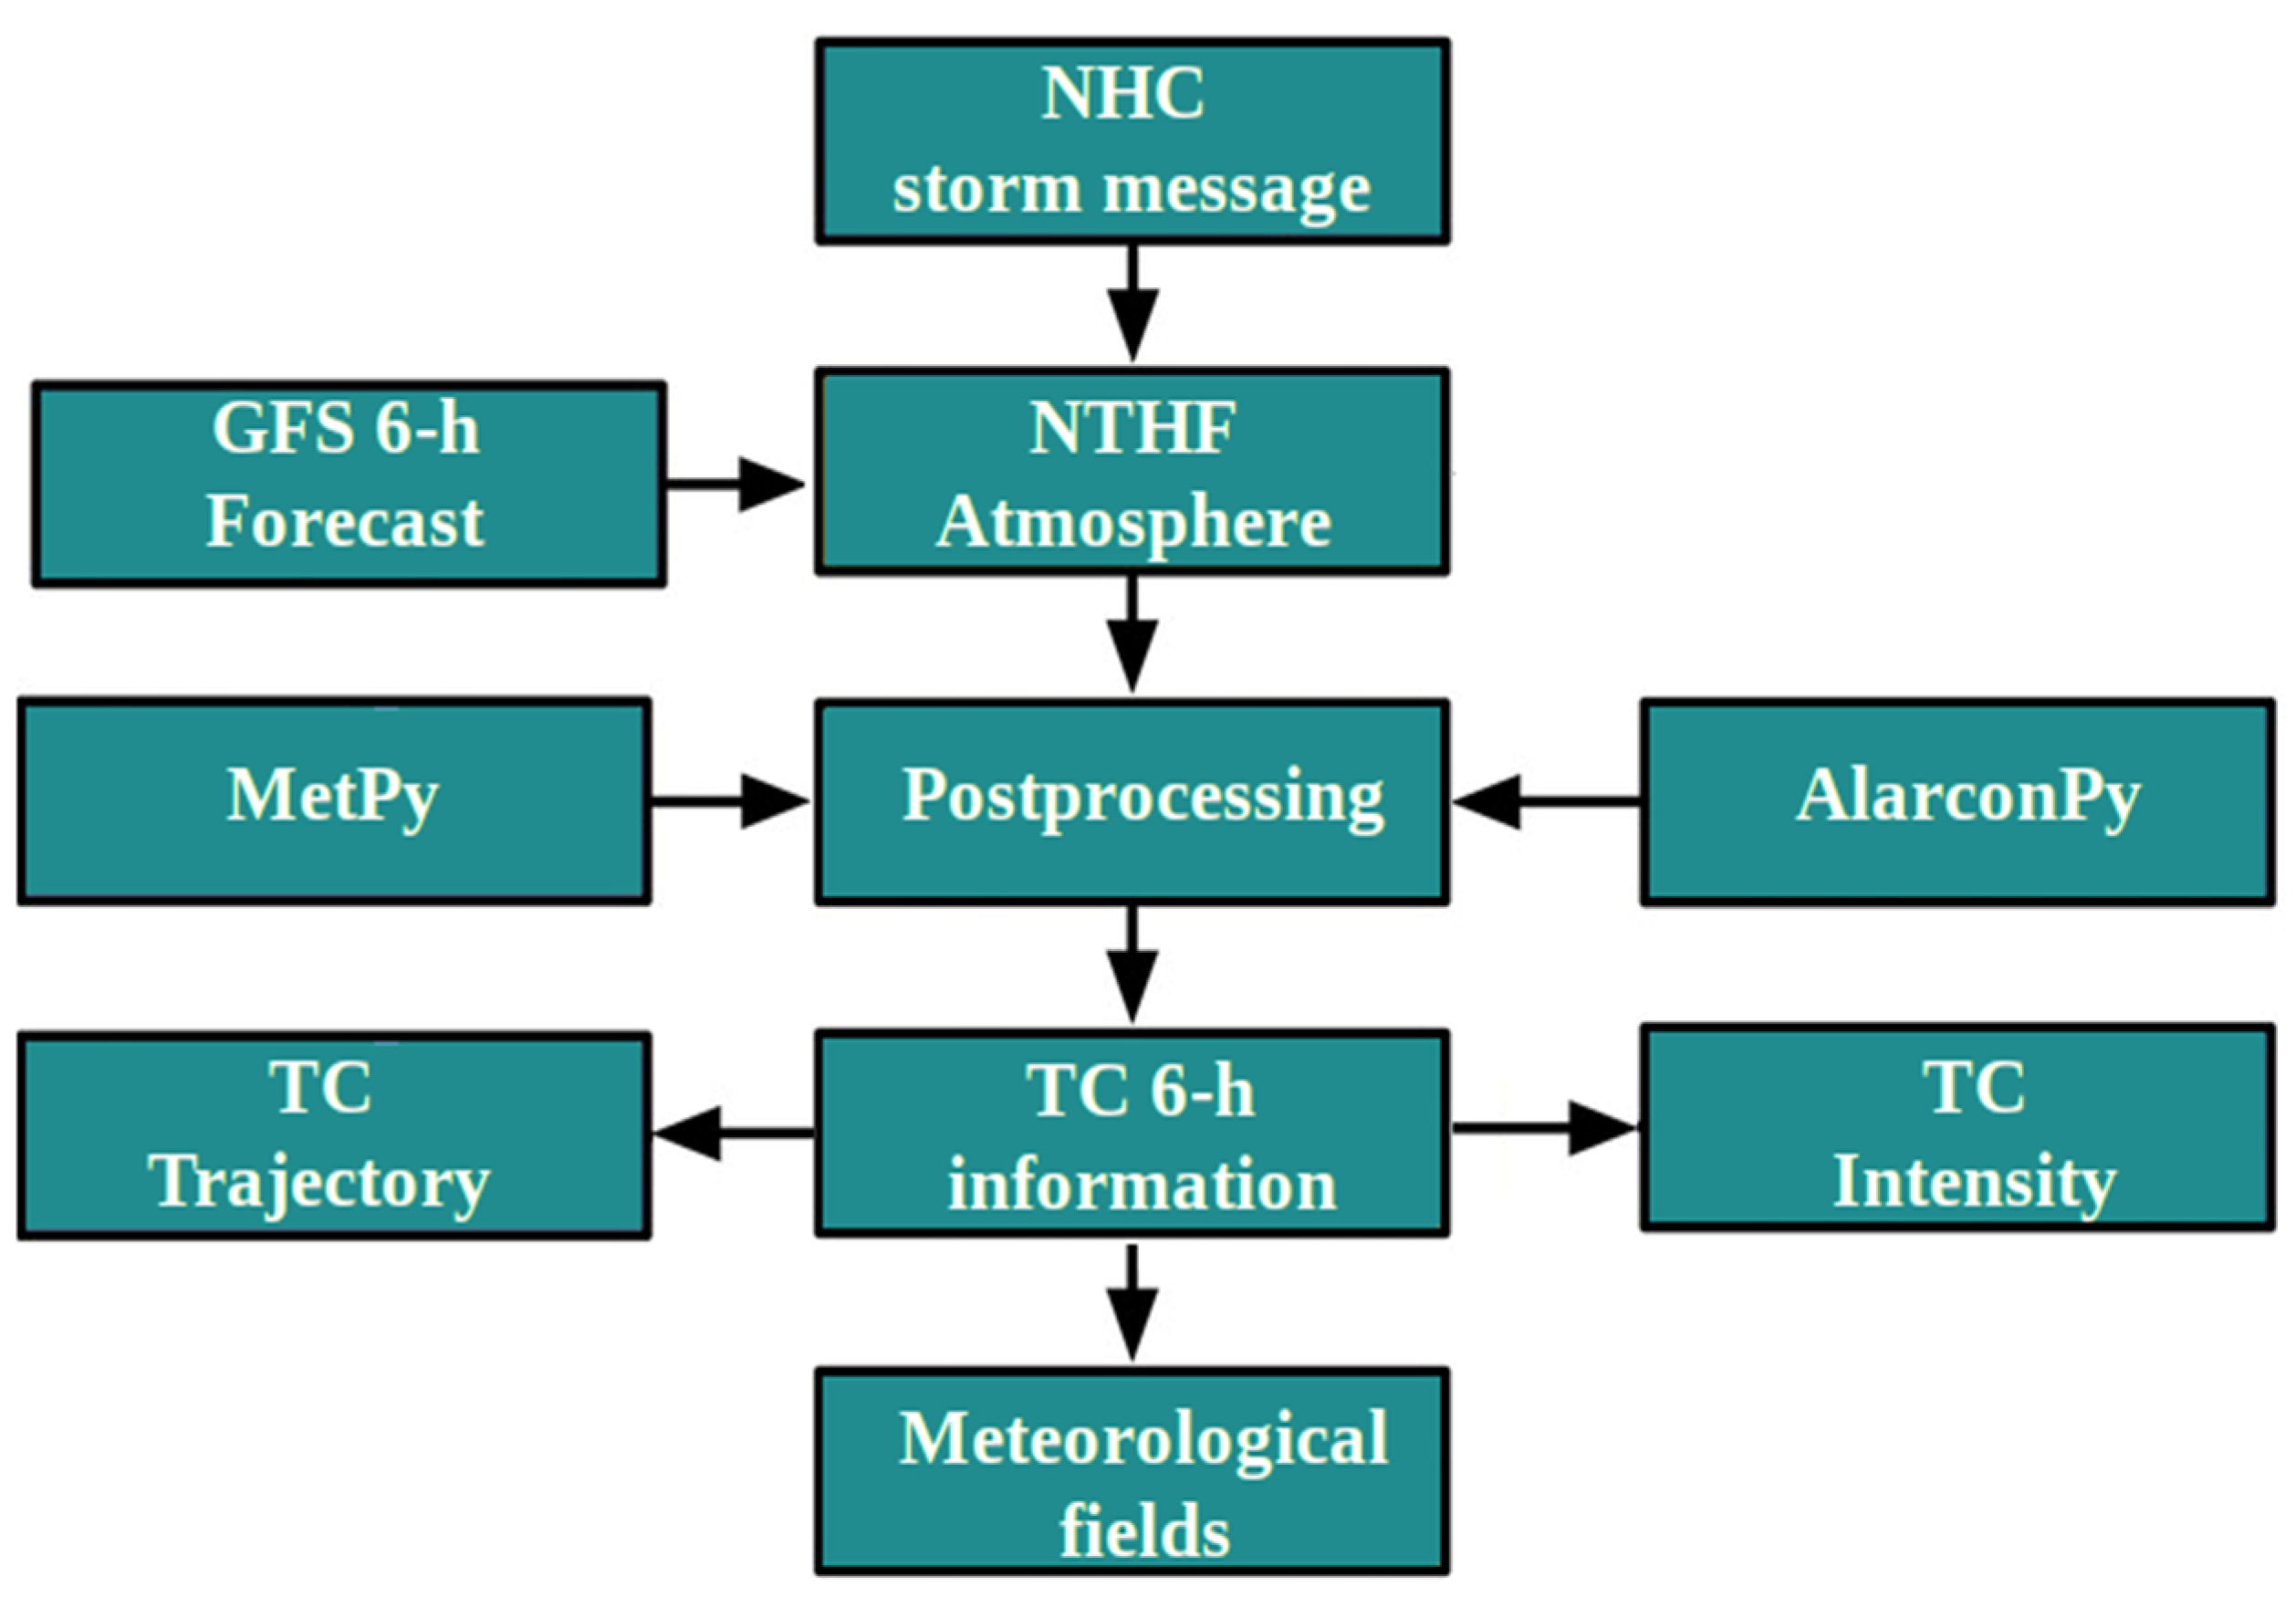
As noted above, NTHF is based on the atmospheric component of the HWRF system, the related physics of which was specifically developed for TC forecasting. Overall, NTHF uses the Weather Research and Forecasting infrastructure and its dynamic core Nonhydrostatic Mesoscale Model (NMM) [
12,
13]. It also includes computational algorithms that allow launching the system runs once the NHC considers that an atmospheric disturbance has the conditions to develop as a TC. Additionally, the Metpy [
14] and Alarconpy [
15] Python packages are used to post-process the NTHF outputs.
Figure 1 shows a schematic flow diagram of NTHF.
The model domains were configured with 32 vertical pressure-sigma hybrid levels [
16,
17] in the rotated latitude–longitude staggered Arakawa E-grid with 216 × 432 grid points in the (x,y) direction for the parent domain of 27 km (~0.18°) grid spacing, and 106 × 204 grid points for the innermost 9 km (~0.06°) grid. In addition, it includes a vortex-following moving nest; that is, the nest domain moves to follow the storm. The initial center locations of the parent and inner domains vary for each forecast cycle and are controlled by the location of the TC center at the beginning of the forecast period provided by the NHC.
The physics suite used in NTHF includes the Ferrier–Aligo scheme [
18] for microphysics, the Scale-Aware Simplified Arakawa–Schubert scheme [
19] for cumulus, HWRF surface-layer scheme, the Noah Land Surface Model, the HWRF Planetary Boundary Layer scheme and the RRTMG scheme for shortwave and longwave radiation. This physics configuration coincides with the NOAA’s HWRF system configuration described by Biswas et al. [
20] for its operational runs during the 2017 TC season.
NTHF is forced at 0000 and 1200 UTC with the Global Forecast System (GFS) model output at 0.25° horizontal grid spacing, and the runs covered a time window of 120 h of forecasting. Boundary conditions were updated every 6 h. For further details, see Pérez-Alarcón et al. [
9].
2. Materials and Methods
2.1. Data
For verification, the best track data in the Atlantic hurricane database (HURDAT2) [
21] provided by NHC was used, along with NTHF-generated tracker outputs. These datasets provide information every 6 h about TCs, including storm center, maximum sustained wind speed and minimum central pressure.
During the 2016–2020 period, the NATL basin registered 95 named storms (101 in total computing tropical depressions), of which 27 reached the hurricane category and 22 the major hurricane (Category 3+ on the Saffir–Simpson hurricane wind scale). TCs formed in 2016–2020 represent ~15.6% of the total TCs in the NATL basin from 1980 to 2020. It is worth noting that the 2017 (18 TCs), 2019 (20 TCs) and 2020 (31 TCs) TC seasons recorded more TCs than the average (~15.8) in the 1980–2020 period. Indeed, the 2020 season is the most active since 1851.
During the 2016–2020 period, there were 577 NTHF forecasts. This quantity is notably lower than the average official forecasts from the NHC in the same period (~1784). The low frequency of NTHF forecasts was mainly caused by flaws (e.g., loss of internet connection, loss of energy power) in the Benjamin cluster, which is the home for NTHF operational runs at the Department of Meteorology, InSTEC-UH.
Table 1 summarizes the number of available NTHF predictions in each forecast hour.
2.2. Methodology
To compute the NTHF ability, the best track archive provided by the NHC was used. In addition, to have a broader picture of the performance of NTHF, we separated the forecast into each TC intensity category at the time of NTHF initialization; that is, when initializing the model, for example, if the TC was a tropical storm, that forecast was counted in the tropical storm forecasts class.
Table 2 resumes the total number of forecasts for each TC category.
Although NTHF forecasts were performed for systems identified by the NHC as atmospheric disturbances likely to become in a TC (INVEST) and tropical systems, the results of this work follow the verification procedure of the NHC (
https://www.nhc.noaa.gov/verification, accessed on 5 January 2022). The NHC states that the position and intensity of the TC are only verified when a system is a TC at the initial forecast time and verification time. Additionally, we include verification for the minimum central pressure. From the simulated and observed variables, different statigraphs were applied to calculate the ability of NTHF, such as mean absolute error and bias and forecasting skills.
3. Results and Discussion
3.1. Verification of the TC Trajectory Forecast
To first have a general overview of the ability of NTHF for predicting the trajectory of the TCs in the 2016–2020 period during the NATL TC season,
Figure 2a illustrates the five-year statistics of the mean track forecast errors for NTHF and the official NHC forecast. Here, the mean absolute error is defined as the sample average of the differences between the predicted and the best track values for each available forecast hour throughout the study period.
As seen in
Figure 2a, NTHF track forecast errors grow roughly linearly with forecast hours, ranging from 41 km in the first 6 h to 356 km in the 120 h forecast. These quantities are almost similar to the NTHF track errors found by Pérez-Alarcón et al. [
9] in the 2016–2018 period. Additionally, the track errors of NTHF and NHC are similar during the first 36–48 forecast hours, although NTHF performed worst for all lead times. By a simple inspection of
Figure 2a, for a lead time of up to 60 h, the NTHF system exhibits a track forecast error ~10% higher than the NHC forecast error. However, from 60 to 72 h, the trajectory error is 30% higher than the NHC.
It is worth noting that the cases with relatively poor track forecasts (high range of [q1–q3] quartiles) could be linked to NTHF configuration deficiencies (e.g., a small outermost domain, no ocean coupling and no data assimilation).
Figure 2b shows the percentage of NTHF track forecasts having an error less than the specific value. For the 6 to 36 h, 95% of forecasts have an error less than 200 km. However, for the final forecast time (84 to 120 h), ~70–85% of the predictions have errors ranging from 200 km to 400 km.
In previous evaluations of the NTHF system [
9,
11], the authors pointed out that the higher forecast errors mainly occurred for TCs at tropical depression (TD) and tropical storm (TS) intensity categories. They argued that the vortex is slightly weak and not well-defined at these intensities. Therefore, the NTHF vortex tracking algorithm can track secondary vortices.
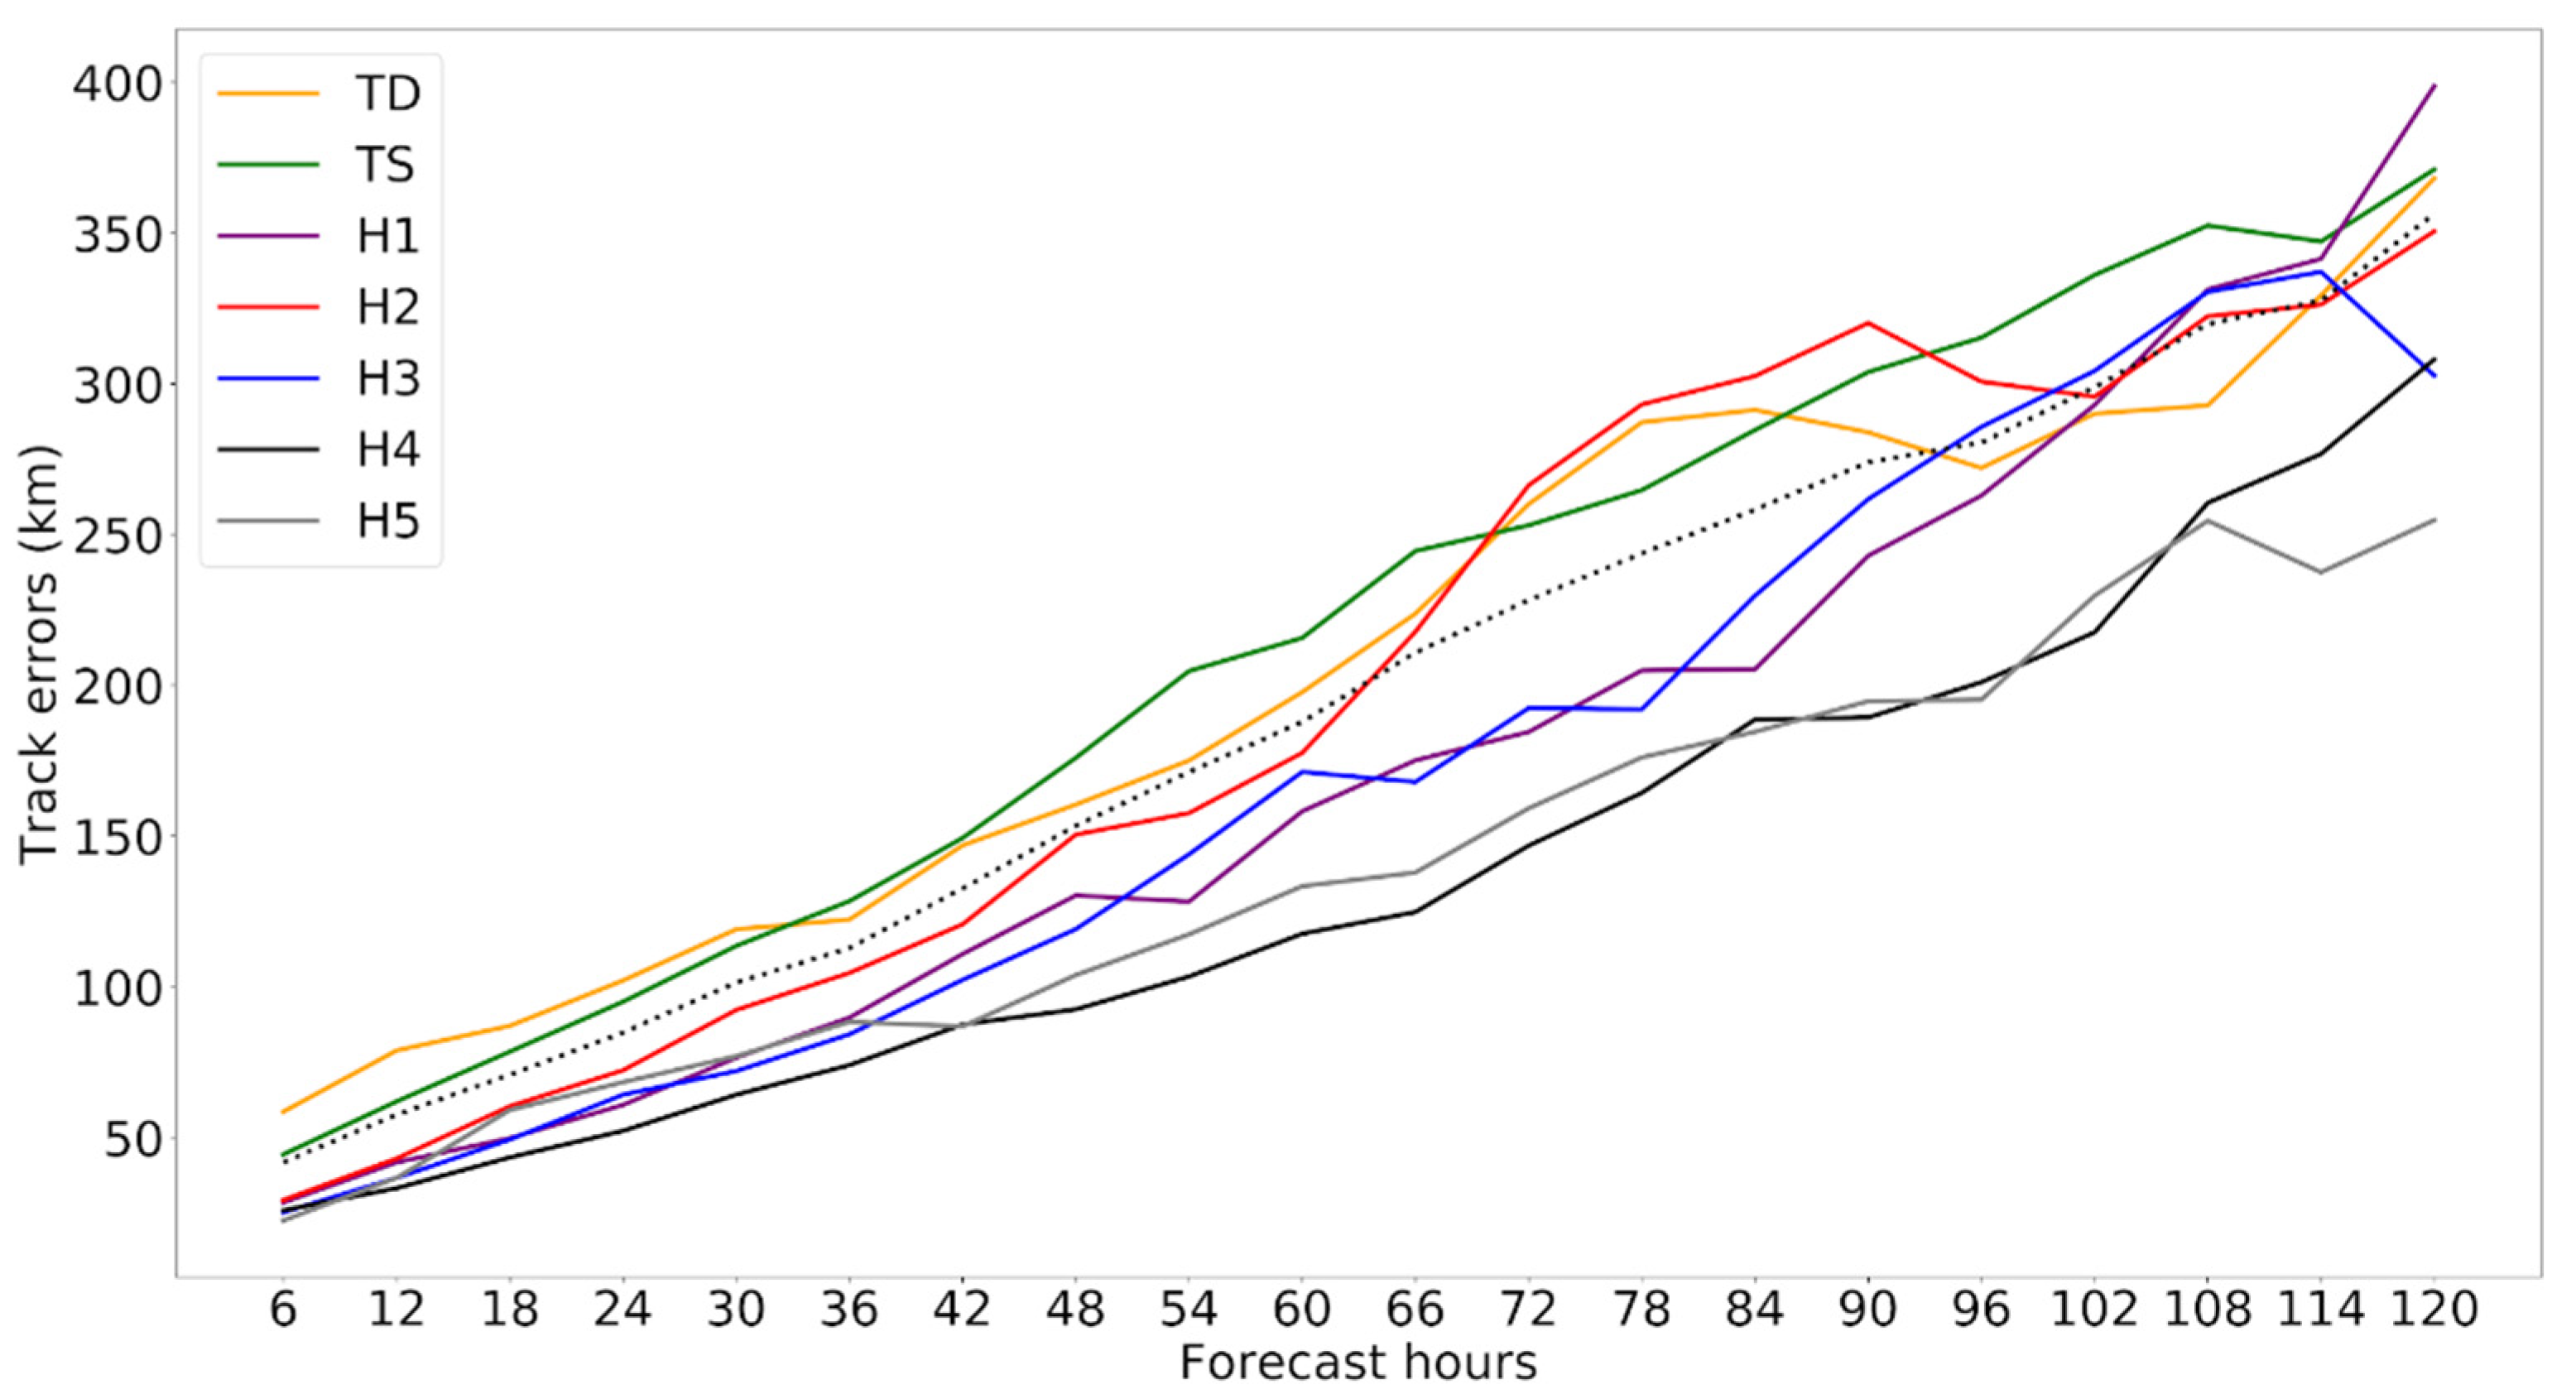
To gain a more complete picture of NTHF’s ability to forecast the TC trajectories at each intensity category and based on previous studies [
9,
11], we separately analyzed the forecast errors for each TC intensity category.
Figure 3 confirms that the largest track forecast errors for depressions and tropical storms are higher than the mean NTHF errors for all forecast hours. Meanwhile, NTHF can predict the pathway of Categories 4 and 5 hurricanes, with track errors less than 295 km at 120 h. Overall, NTHF is better for predicting the trajectory of hurricanes than for depressions and tropical storms. Note the increase in track error between the 66 and 90 forecast hours for systems that were Category 2 hurricanes on the Saffir–Simpson scale (H2) at NTHF initialization. This behavior was probably modulated by the fact that most of these systems weakened to a tropical storm or tropical depression after NTHF initialization. As mentioned above, NTHF has a low ability to predict the trajectory of weak TCs.
3.2. Verification of the TC Intensity Forecast
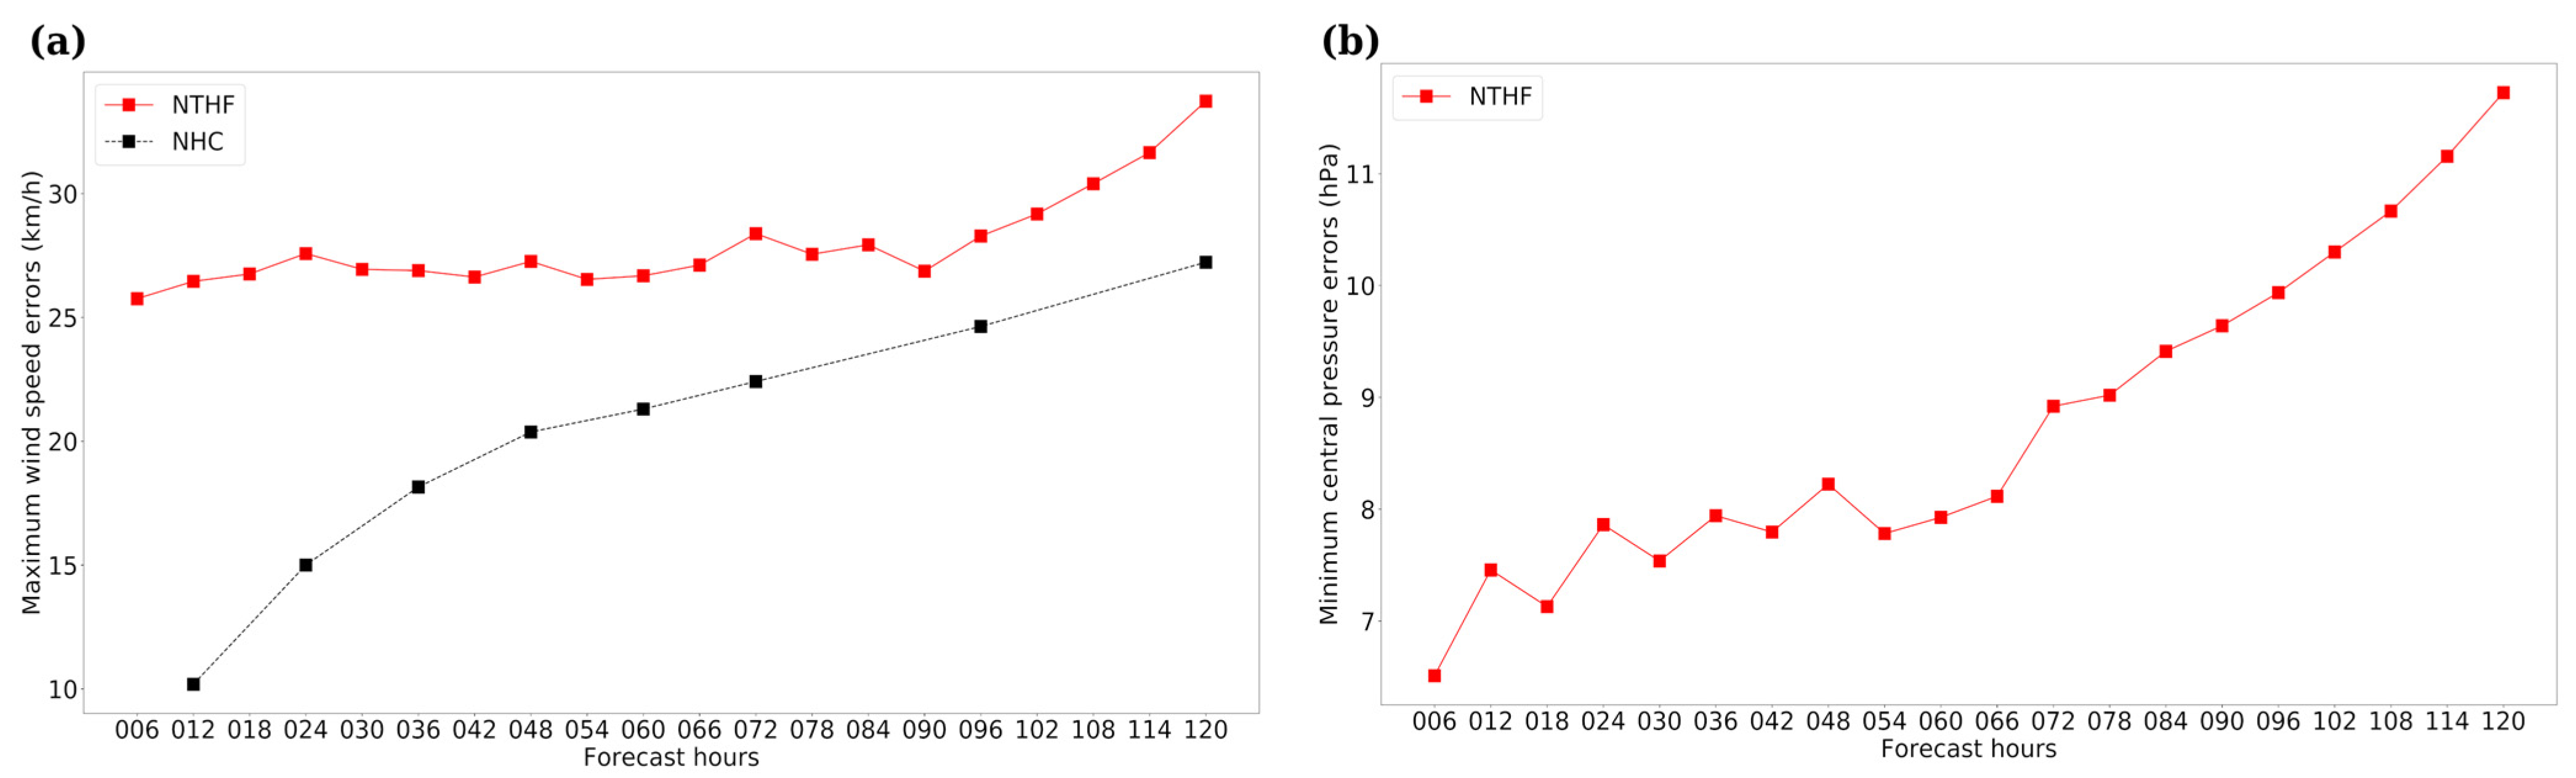
The composite errors of maximum wind speed and minimum central pressure prediction for all cyclones simulated by NTHF are plotted in
Figure 4. A comparison of the observed and simulated values of the maximum wind speed revealed that the mean absolute errors of NTHF are notably higher than the errors of the official forecast of NHC, as shown in
Figure 4a. While the official errors range from 10.2 km/h at 12 h to 27.2 km/h at 120 h, the NTHF errors in the maximum wind speed vary from 26.5 km/h at 12 h to 33.7 km/h at the end of the forecast period (120 h). In addition, one noticeable fact is the average absolute error in the minimum central pressure increases gradually from 7 hPa at 12 h to a value of 11.7 hPa at 120 h, which implies a 60% growth in 5 days, although maximum upsurge takes place after the 72 h, as revealed in
Figure 4b.
Note that the largest differences in NTHF and NHC errors in predicting the maximum wind speed are in the first 72 h of forecasts. This reveals deficiencies in the initialization of NTHF and low resolution of the inner domain to represent the complex dynamic processes involved in the intensification or weakening of TCS. This behavior was previously addressed by Pérez-Alarcón et al. [
9,
11].
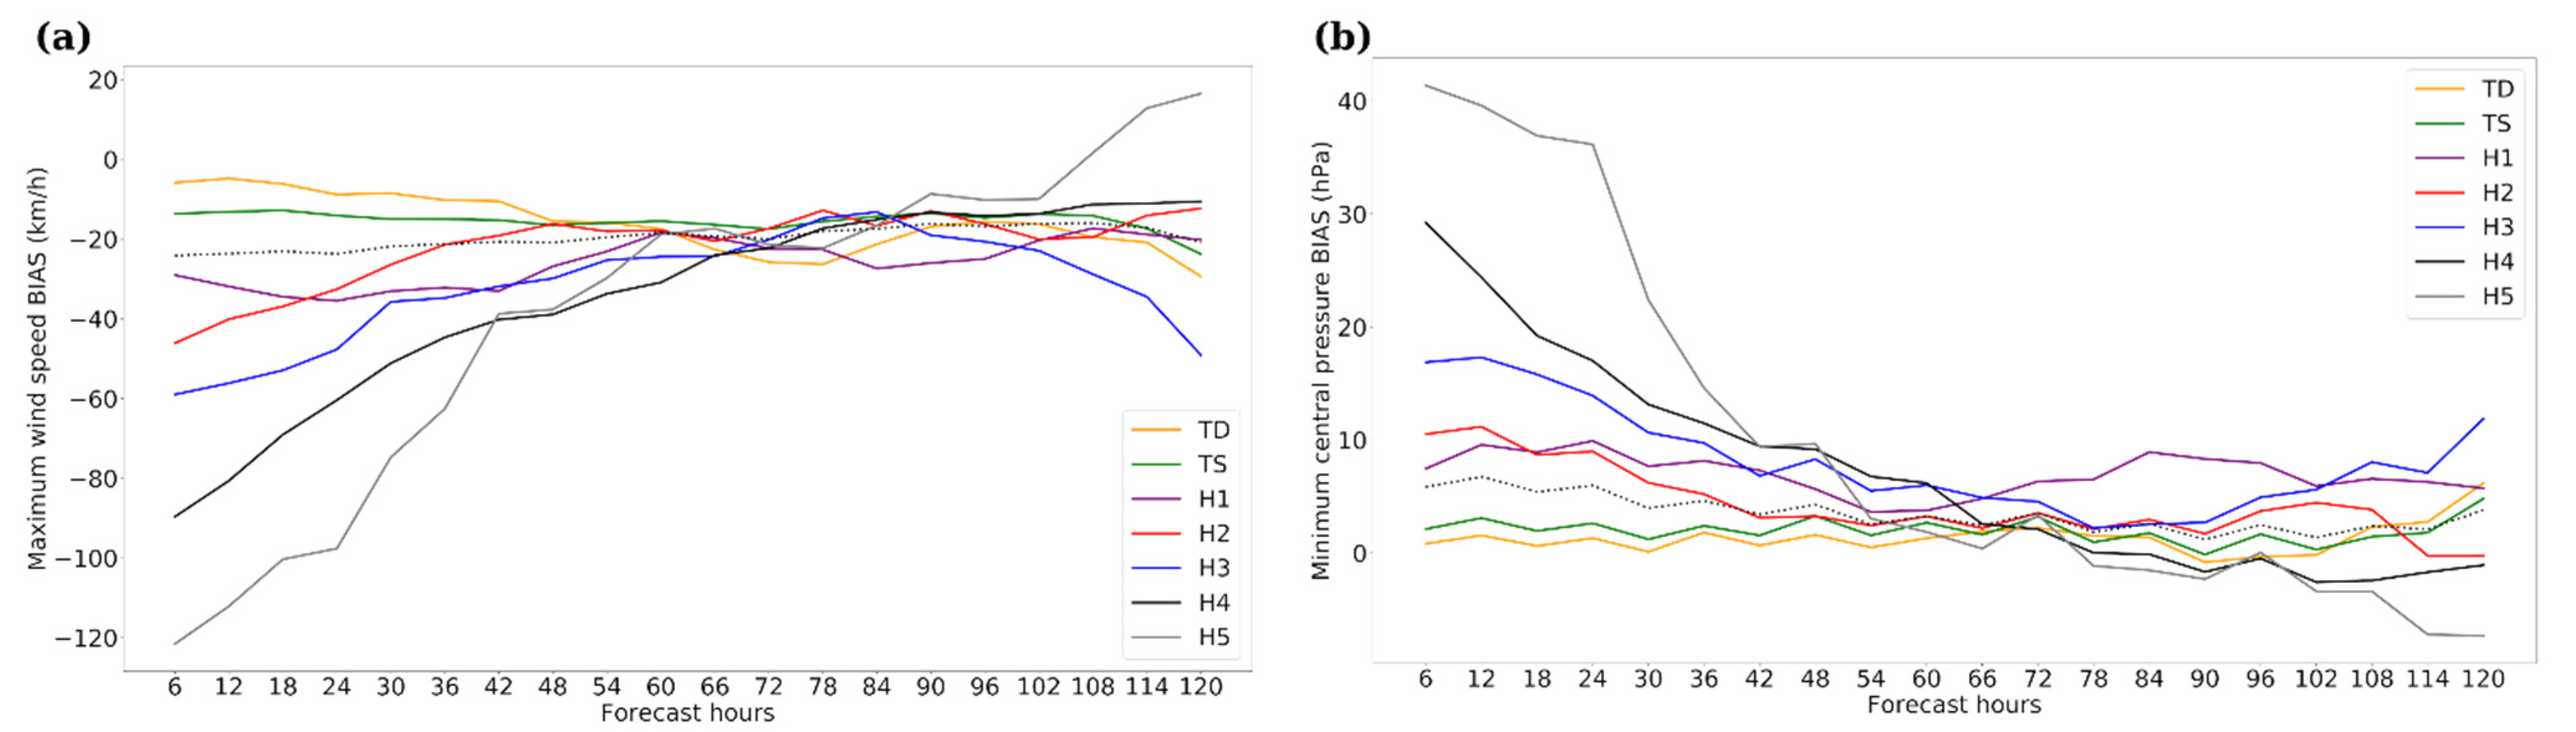
As for the trajectory, we computed the intensity errors for each TC intensity category. From
Figure 5, the operational NTHF system displayed a negative (positive) intensity BIAS for the maximum wind speed (minimum central pressure) in the NATL basin. The intensity BIAS is defined as the mean error of the maximum instantaneous 10 m winds and mean sea level pressure on the model grid [
6], retrieved from the 6-hourly NTHF outputs throughout the GFDL Vortex Tracker [
22].
The forecast hours close to the model initialization have the highest BIAS, while the BIAS became lower over the 5-day forecast period. The underintensification was very large for the majority of storms that exhibited high intensity at the time of the model initialization, such as the major hurricanes (Category 3+ on the Saffir–Simpson wind scale), reaching values of −120 km/h (10 hPa) to −60 km/h (40 hPa) for Category 5 hurricane in the first 48 forecast hours in the maximum wind speed (minimum central pressure). The storm underintensification can be attributed to several factors such as dynamics, physics or model initialization, as noted by Bernardet et al. [
6]. Based on
Figure 5, the absolute value of BIAS decreased in time throughout the forecast period, with lower errors in the third–fifth days of the forecast, which suggests that the model initialization is the principal driver for errors in the intensity forecast. Additionally, the low ability of NTHF for the intensity prediction can be attributed to the fact that the intense cyclones underwent different stages of intensification (rapid intensification or rapid weakening) within their lifespan, affecting the performance of the model.
4. Conclusions
The Numerical Tools for Hurricane Forecast (NTHF) has been run operationally since 2019 at the Department of Meteorology of the Higher Institute of Technologies and Applied Sciences, University of Havana (InSTEC), Cuba, to provide numerical guidance to InSTEC-UH and the Department of Forecast of the Institute of Meteorology of Cuba for tropical cyclone forecasting, and, as such, it requires continuous upgrades. Because of the limited computational resources available in InSTEC-UH, NTHF used only the atmospheric component of the NOAA’s Hurricane Weather and Forecasting (HWRF) model. This work evaluated the performance of the NTHF system in the first five years (2016–2020) of operational runs during the North Atlantic (NATL) tropical cyclone (TC) season.
The forecast accuracy was assessed through standard verification of 120 h of track and intensity predictions against the best track dataset of the National Hurricane Center (NHC). Comparisons to the forecast TC trajectories showed reasonable agreement between the predicted track and the trajectory described by TCs, although the NTHF errors were higher than the NHC errors in all forecast hours. On average, track forecast errors increased from 41 km at 12 h to 356 km at 120 h.
The largest forecast differences were typically found when comparing the observed and predicted TC intensity. For the maximum wind speed, NTHF underestimates the observed intensity by 26.5 km/h in the 12 h to 33.7 km/h in the 120 h of forecasting. Although NHTF is more skillful in predicting the minimum central pressure than the maximum wind speed, it overestimates the central pressure of the TCs from 7 hPa at 12 h to 11.7 hPa at 120 h.
Ongoing work is exploring the sensitivity of NTHF to a vortex location scheme in the initialization phase. Additionally, in future works, we aim to evaluate the ability of the NTHF system for predicting the precipitation associated with the 2021 NATL TCs that made landfall or moved close to the coastline in terms of rainfall patterns, average rainfall, rainfall volume and extreme amounts.
Author Contributions
A.P.-A. conceived the idea of the study; A.P.-A. and J.C.F.-A. processed the data and made the figures; A.P.-A. wrote the manuscript. All authors analyzed the results and revised the final version of the manuscript. All authors have read and agreed to the published version of the manuscript.
Funding
This research received no external funding.
Institutional Review Board Statement
Not applicable.
Informed Consent Statement
Not applicable.
Data Availability Statement
Acknowledgments
The authors acknowledge the availability of public datasets from the National Hurricane Center and the Global Forecasting System. The authors also thank to two anonymous reviewers for their comments and suggestions to improve the manuscript.
Conflicts of Interest
The authors declare no conflict of interest.
References
- McAdie, C.J.; Lawrence, M.B. Improvements to tropical cyclone track forecasting in the Atlantic basin, 1970–1998. Bull. Am. Meteorol. Soc. 2000, 81, 989–998. [Google Scholar] [CrossRef]
- Landsea, C.W.; Cangialosi, J.P. Have we reached the limits of predictability for tropical cyclone track forecasting? Bull. Am. Meteorol. Soc. 2018, 99, 2237–2243. [Google Scholar] [CrossRef] [Green Version]
- Cangialosi, J.P.; Blake, E.; DeMaria, M.; Penny, A.; Latto, A.; Rappaport, E.; Tallapragada, V. Recent Progress in Tropical Cyclone Intensity Forecasting at the National Hurricane Center. Weather Forecast. 2020, 35, 1913–1922. [Google Scholar] [CrossRef]
- Otkin, J.A.; Lewis, W.E.; Lenzen, A.J.; McNoldy, B.D.; Majumdar, S.J. Assessing the Accuracy of the Cloud and Water Vapor Fields in the Hurricane WRF (HWRF) Model Using Satellite Infrared Brightness Temperatures. Mon. Weather Rev. 2017, 145, 2027–2046. [Google Scholar] [CrossRef]
- Goerss, J.S. Prediction of consensus tropical cyclone track forecast error. Mon. Weather Rev. 2007, 135, 1985–1993. [Google Scholar] [CrossRef]
- Bernardet, L.; Tallapragada, V.; Bao, S.; Trahan, S.; Kwon, Y.; Liu, Q.; Tong, M.; Biswas, M.; Brown, T.; Stark, D.; et al. Community Support and Transition of Research to Operations for the Hurricane Weather Research and Forecasting Model. Bull. Am. Meteorol. Soc. 2015, 96, 953–960. [Google Scholar] [CrossRef]
- Gall, R.; Franklin, J.L.; Marks, F.; Rappaport, E.N.; Toepfer, F. The Hurricane Forecast Improvement Project. Bull. Am. Meteorol. Soc. 2013, 94, 329–343. [Google Scholar] [CrossRef]
- Mehra, A.; Tallapragada, V.; Zhang, Z.; Liu, B.; Lin, S.; Wang, W.; Kimb, H.-S. Advancing the State of the Art in Operational Tropical Cyclone Forecasting at NCEP. Trop. Cyclone Res. Rev. 2018, 7, 51–56. [Google Scholar] [CrossRef]
- Pérez-Alarcón, A.; Fernández-Alvarez, J.C.; Rodírguez-Díaz, O.; Batista-Leyva, A.J.; Pérez-Suárez, R. System for numerical forecast of intensity and trajectory of tropical cyclones in the North Atlantic basin. Rev. Cub. Meteorol. 2021, 27. Available online: http://rcm.insmet.cu/index.php/rcm/article/view/552/1037 (accessed on 3 February 2022).
- Fernández-Alvarez, J.C.; Pérez-Alarcón, A.; Batista-Leyva, A.J.; Díaz-Rodríguez, O. Evaluation of Precipitation Forecast of System: Numerical Tools for Hurricane Forecast. Adv. Meteorol. 2020, 2020, 8815949. [Google Scholar] [CrossRef]
- Pérez-Alarcón, A.; Fernández-Alvarez, J.C.; Batista-Leyva, A.J. Performance Evaluation of Numerical Tools for Hurricane Forecast (NTHF) System during 2020 North Atlantic Tropical Cyclones Season. Environ. Sci. Proc. 2021, 8, 22. [Google Scholar] [CrossRef]
- Janjic, Z. A nonhydrostatic model based on a new approach. Meteorol. Atmos. Phys. 2003, 82, 271–285. [Google Scholar] [CrossRef]
- Janjic, Z.; Gerrity, J.P., Jr.; Nickovic, S. An alternative approach to nonhydrostatic modeling. Mon. Weather Rev. 2001, 129, 1164–1178. [Google Scholar] [CrossRef]
- May, R.; Arms, S.; Marsh, P.; Bruning, E.; Leeman, J. Metpy: A Python Package for Meteorological Data; Unidata: Boulder, CO, USA, 2020. [Google Scholar] [CrossRef]
- Pérez-Alarcón, A.; Fernández-Alvarez, J.C. Alarconpy: A Python Package for Meteorologists; Zenodo: Geneva, Switzerland, 2021. [Google Scholar] [CrossRef]
- Sangster, W.E. A method of representing the horizontal pressure force without reduction of station pressures to sea level. J. Meteorol. 1960, 17, 166–176. [Google Scholar] [CrossRef] [Green Version]
- Arakawa, A.; Lamb, V.R. Computational design of the basic dynamical processes of the UCLA general circulation model. In Methods in Computational Physics; Chang, J., Ed.; Academic Press: Cambridge, MA, USA, 1997; Volume 17, pp. 173–265. [Google Scholar]
- Aligo, E.; Ferrier, B.; Thompson, G.; Carley, J.R.; Rogers, E.; Dimego, J. The New-Ferrier-Aligo Microphysics in the NCEP 3-km NAM Nest. In Proceedings of the 97th AMS Annual Meeting, Seattle, WA, USA, 21–26 January 2017. [Google Scholar]
- Han, J.; Wang, W.; Kwon, Y.; Hong, S.; Tallapragada, V.; Yang, F. Updates in the NCEP GFS Cumulus Convection Schemes with Scale and Aerosol Awareness. Weather Forecast. 2017, 32, 1989–2004. [Google Scholar] [CrossRef]
- Biswas, M.K.; Bernardet, L.; Abarca, S.; Ginis, I.; Grell, E.; Kalina, E.; Kwon, Y.; Liu, B.; Liu, Q.; Marchok, T.; et al. Hurricane Weather Research and Forecasting (HWRF) Model: 2017 Scientific Documentation; NCAR Technical Note NCAR/TN-544+STR; NCAR: Boulder, MO, USA, 2017. [Google Scholar] [CrossRef]
- Landsea, C.W.; Franklin, J.L. Atlantic Hurricane Database Uncertainty and Presentation of a New Database Format. Mon. Weather Rev. 2013, 141, 3576–3592. [Google Scholar] [CrossRef]
- Marchok, T. Important factors in the tracking of tropical cyclones in operational models. J. Appl. Meteorol. Climatol. 2021, 60, 1265–1284. [Google Scholar] [CrossRef]
| Publisher’s Note: MDPI stays neutral with regard to jurisdictional claims in published maps and institutional affiliations. |
© 2022 by the authors. Licensee MDPI, Basel, Switzerland. This article is an open access article distributed under the terms and conditions of the Creative Commons Attribution (CC BY) license (https://creativecommons.org/licenses/by/4.0/).


