Article

Biogas Purification by Intensified Absorption in a Micromixer

1
Université de Lorraine, CNRS, LRGP, F-54000 Nancy, France
2
State Key Joint Laboratory of Environment Simulation and Pollution Control, School of Environment, Tsinghua University, Beijing 100084, China
*
Author to whom correspondence should be addressed.
Methane 2025, 4(3), 14; https://doi.org/10.3390/methane4030014
Submission received: 12 May 2025 / Revised: 6 June 2025 / Accepted: 23 June 2025 / Published: 25 June 2025

Abstract

Biogas is a renewable energy source produced by anaerobic digestion of organic waste. It can be upgraded to bio-methane by removing carbon dioxide, water and impurities. The present work focuses on carbon dioxide removal using both physical and chemical absorption in a micromixer. The absorption efficiency in the micromixer was studied under various conditions of co-current gas–liquid flow. With physical absorption, 25% of carbon dioxide could be removed from the biogas stream (with a liquid flowrate of 40 mL/min and a gas flowrate of 25 mL/min). In absorption with a chemical reaction, up to 88% of the carbon dioxide was eliminated with a catalyst concentration of 77.4 mol·m−3. In both cases, the space time was below 3 s. Liquid-side mass transfer coefficients as large as 3.5 s−1 were achieved, which is at least two orders of magnitude higher than those reported in conventional absorbers.

1. Introduction

Biogas produced by anaerobic treatment of wastewater is an interesting energy resource from an environmental and economic point of view. The process of anaerobic digestion yields a gas composed 55–70% of methane and 30–45% of carbon dioxide along with impurities such as hydrogen sulfide. It can be burned on site to provide heat or electricity, but there are other added-value uses. For example, biogas can be injected into the natural gas grid for transport, provided that the methane content reaches 96%. Numerous separation methods can be used to eliminate the carbon dioxide [1]: physical or chemical absorption, adsorption, membrane separation, etc. In the case of absorption in aqueous phases, hydrogen sulfide is removed as well [2,3,4].
The current study is devoted to the intensified absorption of carbon dioxide in water through the use of a micromixer as an efficient gas–liquid contactor. Gas–liquid micromixers have received some interest since they are able to develop extremely large interfacial areas: (1) The first approach consists of using the internal structure of the micromixer to generate interfacial area. For example, in a falling-film reactor [5,6,7], thin liquid films are spread on a microstructured plate containing vertical groves under the effect of wetting and gravity. The gas flows over the stabilized liquid films co- or counter-currently with a very high interfacial area. In mesh reactors [8,9], a perforated plate is placed between the gas and the liquid. The pore size can be as low as 5 µm and the open area as high as 40%. (2) In another approach, an injection device is used to disperse one phase into another. A simple example of this kind of system is a T-junction or a Y-junction coupled to a microchannel. Chen et al. [10] studied the absorption of CO2 into water and a buffer solution in a single 667 µm diameter microchannel. Yue et al. [11] later extended their work to a parallel microchannel contactor. They reported that the liquid-side volumetric mass transfer coefficient kLa can be two orders of magnitude higher than in conventional gas–liquid contactors. Sobieszuk et al. [12] used a chemical method to measure the interfacial area of a slug flow in a 400 µm circular microchannel. Their results were in reasonable agreement with those determined using high-speed photography and image analysis software to measure the size of the bubbles (interfacial area around 9000 m2/m3). Compared to packing columns used for CO2 removal, micromixers also have other advantages such as lower pressure drop and better surface wetting control.
The gas–liquid flow patterns in microchannels differ from those observed in larger channels because of the importance of wall effects and surface phenomena, which means that common flow pattern maps generally do not apply. To check this point, Wang et al. [13] investigated the pressure drop and the mass transfer performance in gas–liquid flows through microchannels with different surface wettability. The results show that kLa was generally higher in hydrophobic microchannels than in hydrophilic ones. Finally, Ganapathy et al. [14] carried out the absorption of CO2 into aqueous diethanolamine in microchannels with hydraulic diameters ranging from 254 to 762 µm. They proved that both the absorption efficiency and the volumetric mass transfer coefficient kLa increase with the decrease in the channel diameter. Since Reynolds numbers are usually low in microstructured reactors, flows are generally in the laminar regime. Therefore, mixing is mainly achieved by molecular diffusion. In order to improve the mixing efficiency, several types of micromixers have been proposed: interdigital micromixers [15], split-and-recombine micromixers [16] or chaotic micromixers [17]. These so-called static mixers already have numerous applications at the macro scale in process industries [18], including CO2 scrubbing. As gas–liquid reactors, they offer many advantages such as high mixing efficiencies, great interfacial area or plug-flow behavior. The micromixer used in the present work was previously described in the literature for the mixing of liquids [19] or organic synthesis [20]. The objective of this study is the characterization of the gas–liquid mass transfer performance of a micromixer in view of upgrading biogas to bio-methane.

2. Results and Discussions

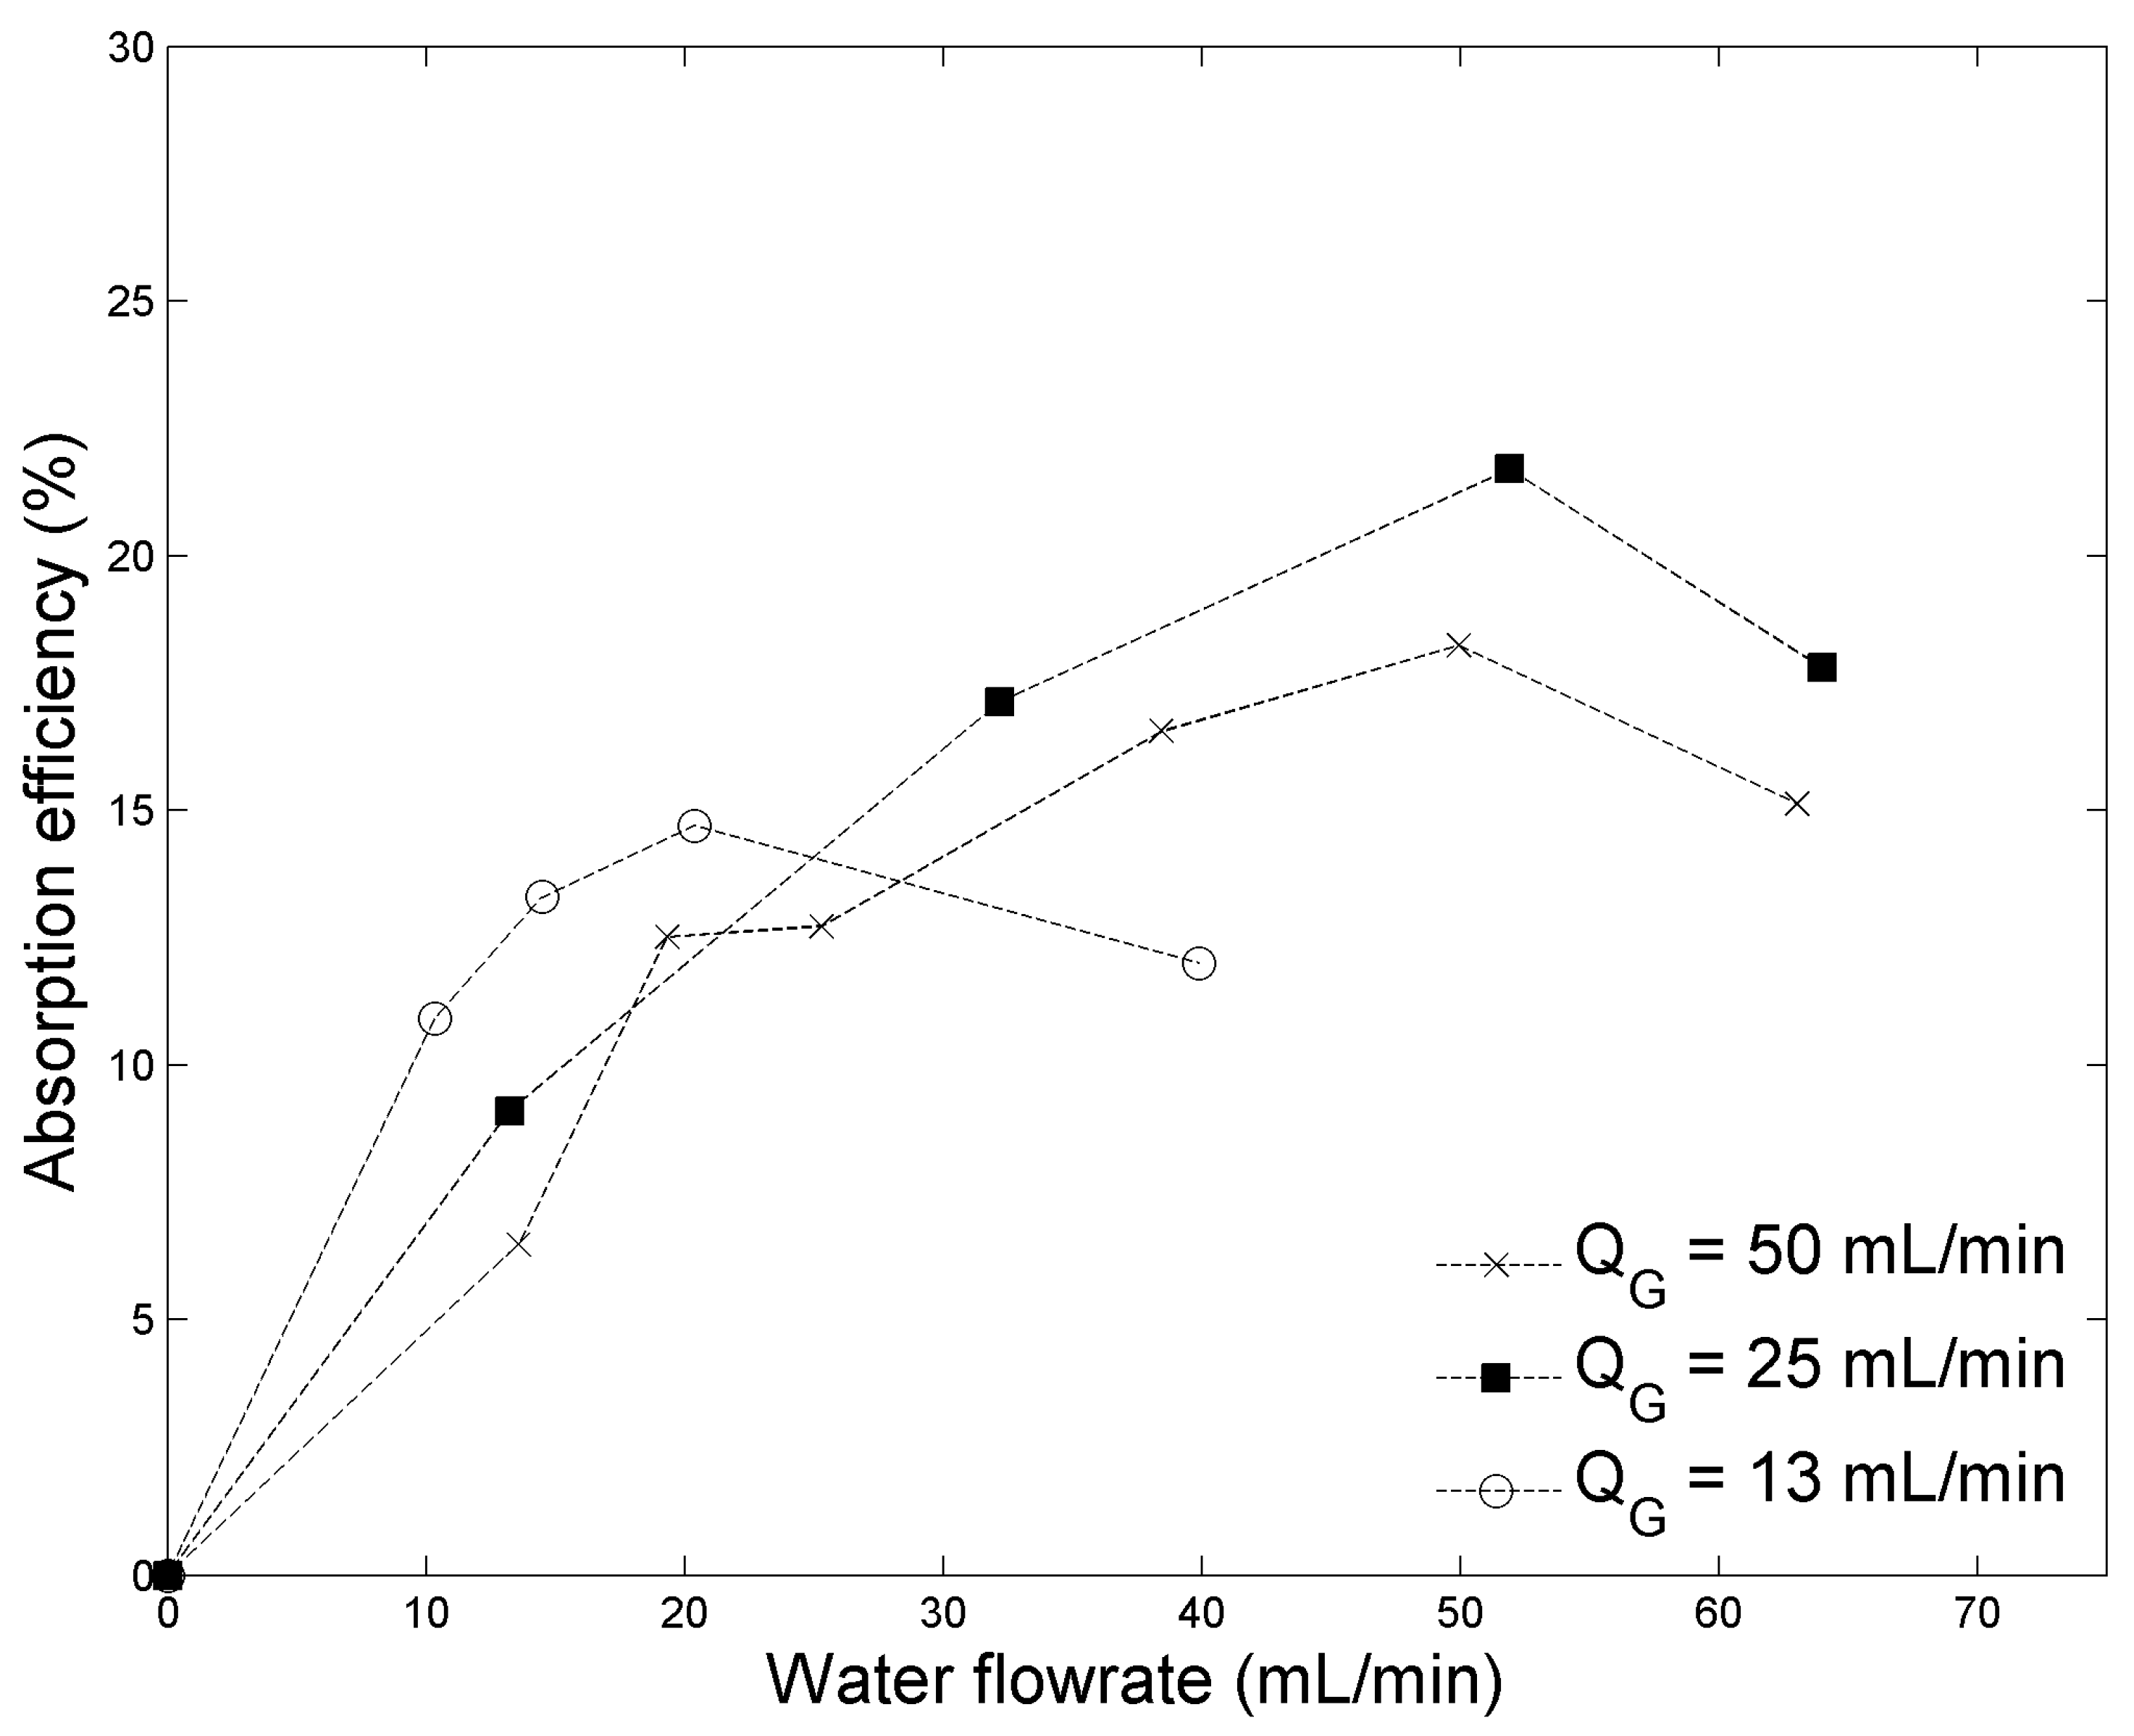
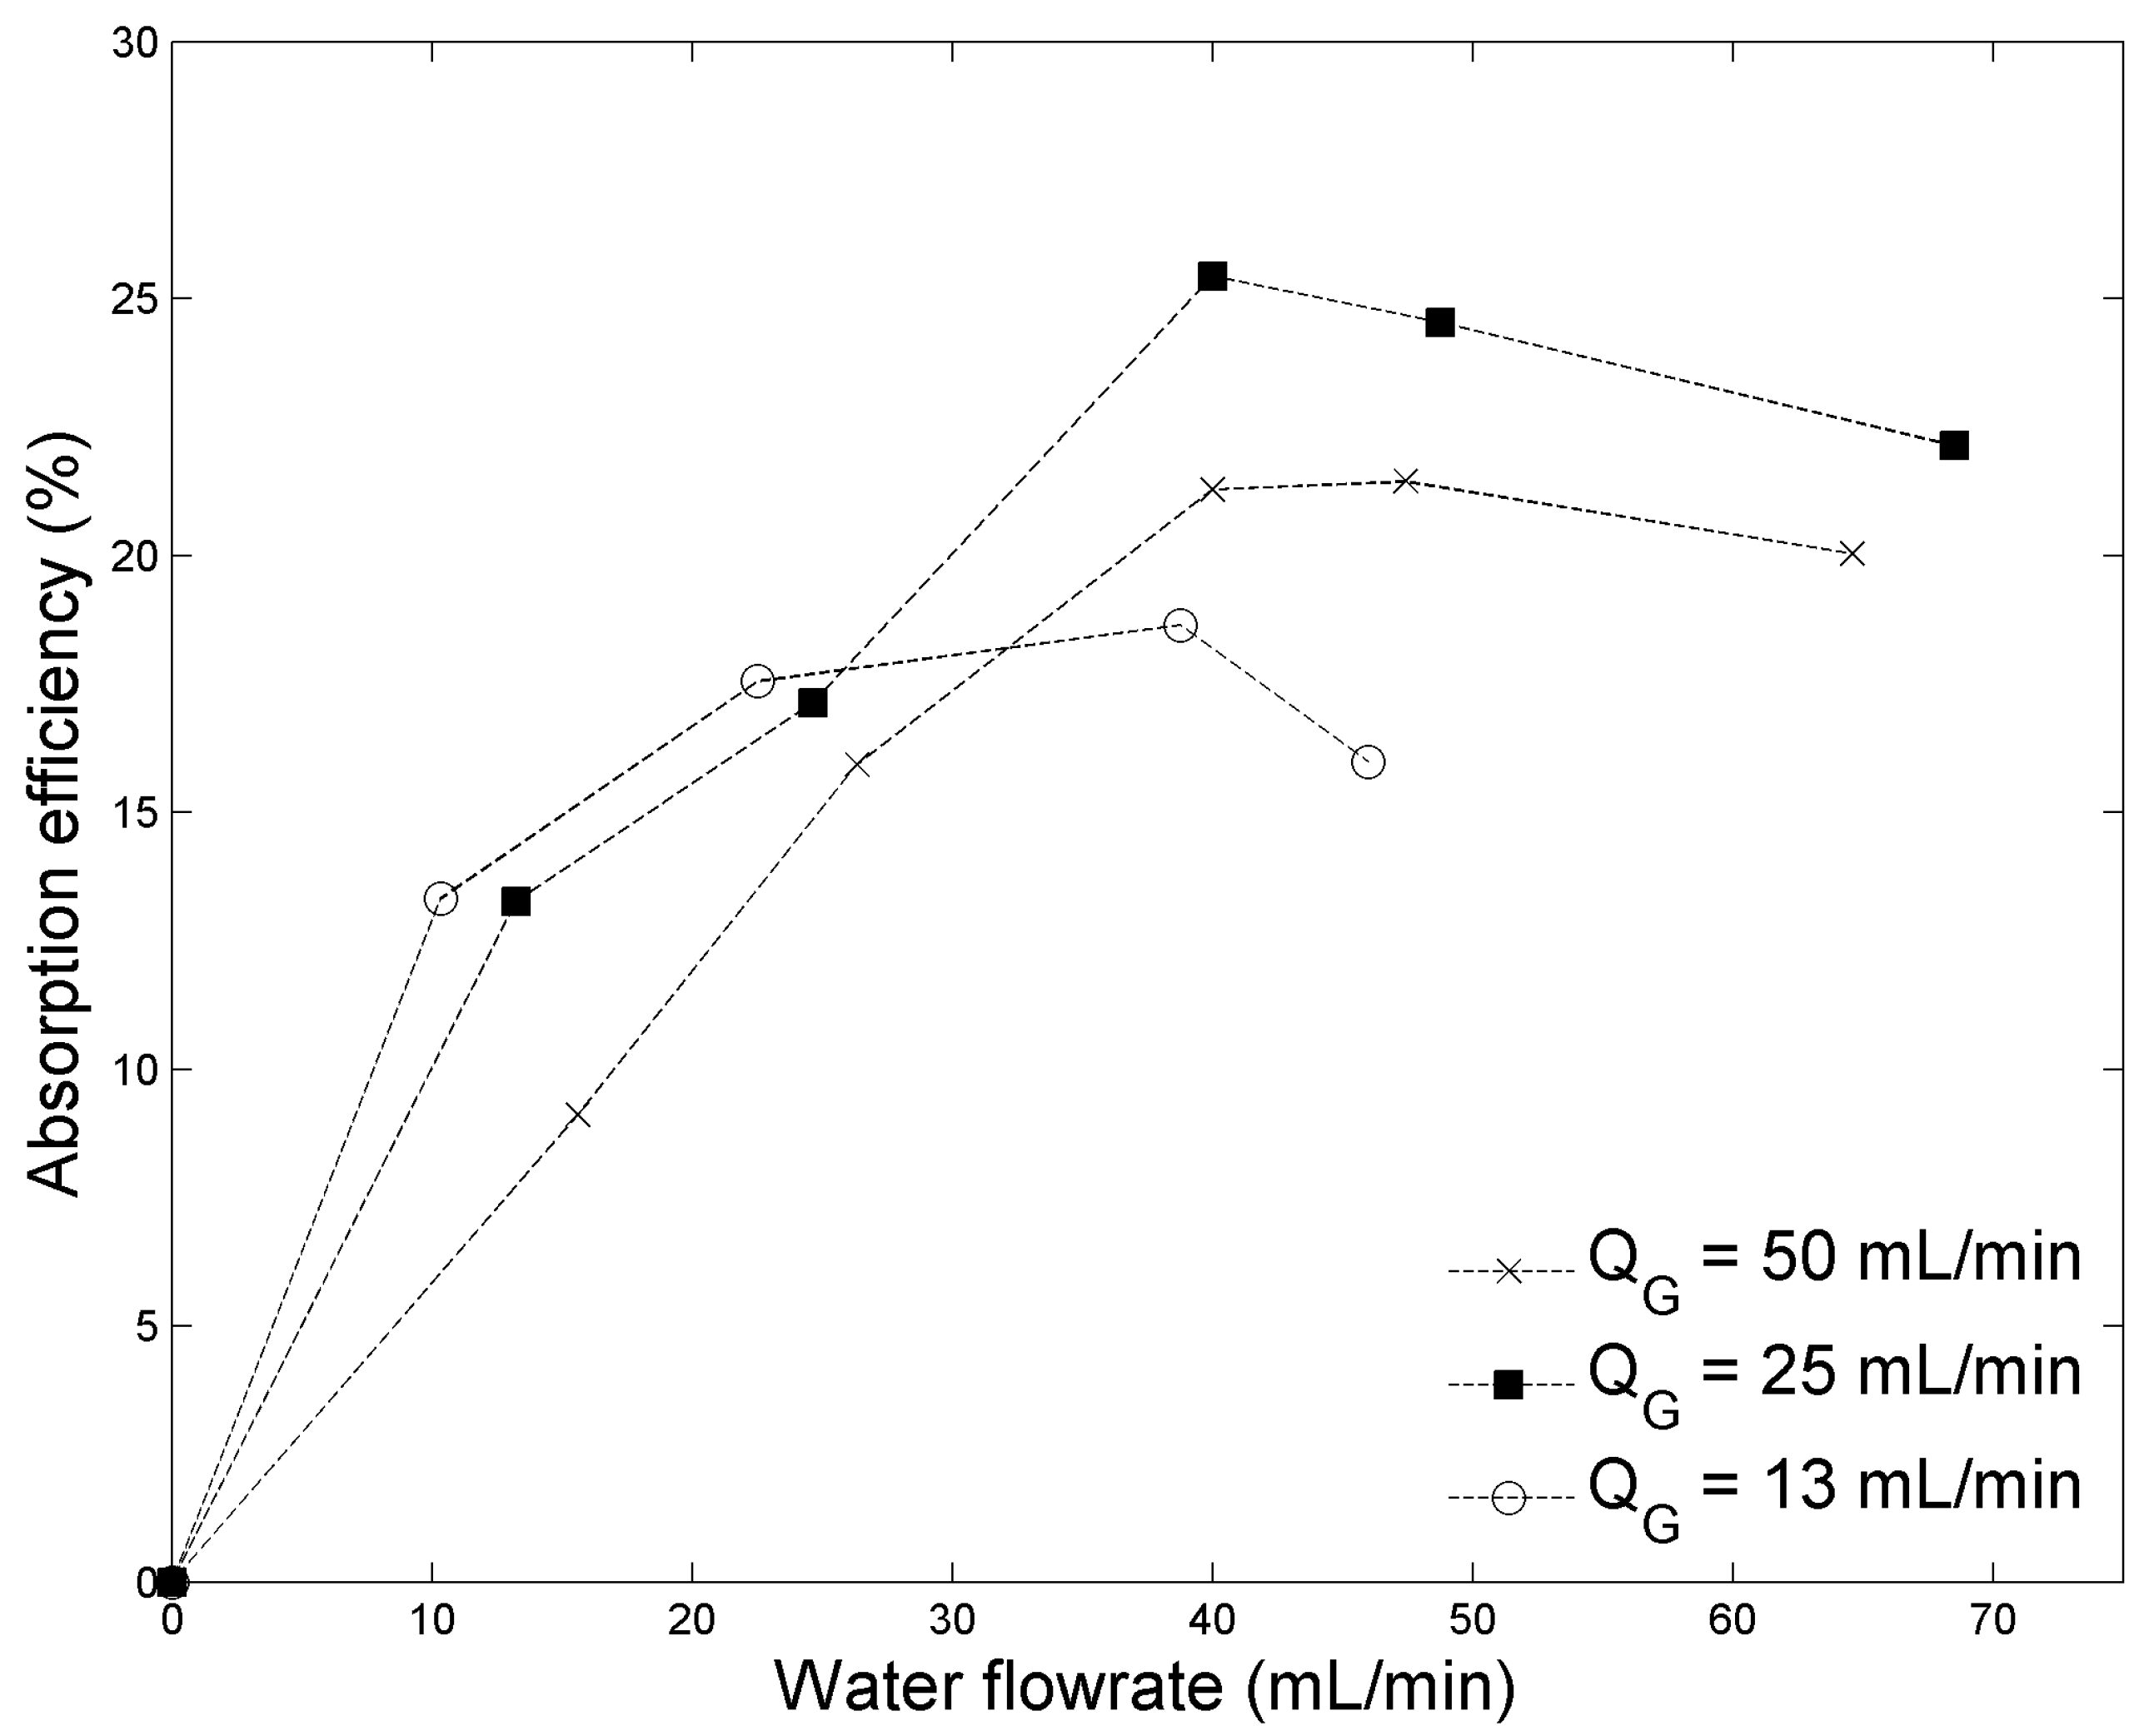
2.1. Absorption Efficiency

Preliminary experiments showed that the inlet biogas composition displayed a negligible effect on the absorption efficiency. Thus, for simplicity reasons, all the experiments were performed with equimolar CH4/CO2 mixtures.
In configuration 1, the absorption efficiency was measured for various gas and liquid flowrates (Figure 1). For each gas flowrate, the absorption efficiency shows a maximum at different liquid flowrates. At the lowest investigated gas flowrate, the maximum is around QL = 20 mL/min. It is noteworthy that under these operating conditions, precise measurements are tough to achieve as the gas coming out of the reactor is likely to be diluted into the gas initially present in the separator. For gas flowrates of 25 and 50 mL/min, the maximum is obtained for QL = 50 mL/min. A relative experimental error of 3% applies to the entire data set in this work.
When QL is increased, the gas inlet pressure rises consecutively (cf. Figure 2) and so does the solubility of CO2 in the liquid according to Henry’s law. For liquid flowrates below 50 mL/min, the increase in the absorption efficiency can be partially explained by the increase in the gas solubility. When QL is higher than 50 mL/min, the space time of the gas becomes so short that the efficiency is limited even if the mass transfer rate is important.
Absorption experiments were also performed in configuration 2 in order to benefit from the dispersion created by the micromixer. Figure 3 reveals that the absorption did occur in the tube, especially for high liquid flowrates. A maximum is also observed in this configuration for QL between 40 and 50 mL/min. This behavior can be explained by direct observation of the dispersion. The interfacial area was determined using a high-speed Phantom v711 camera (Vision Research, Homewood, AL, USA) and the image analysis software ImageJ V1.62 (NIH, Bethesda, MD, USA) based on the size of the bubbles. From the images shown in Figure 4, it can be noticed that the micromixer produces small bubbles that coalesce quickly into large ones. This is a reliable indication of the quality of the dispersion in the micromixer. For low liquid flowrates, bubbles are large (sometimes slug flow can be observed), which explains the low absorption efficiency observed under these conditions. In some cases, gas and liquid flow alternatively through the micromixer, which means there is no contact inside between both phases. For intermediate QL, bubbles are smaller, allowing the achievement of a very high interfacial area. Finally, for high liquid flowrates, the low gas hold-up and space time counterbalance the positive effect of small bubbles’ size on the interfacial area. The direct observation of the gas–liquid flows inside the micromixer was impossible owing to its opaque structure. Ideally, monitoring the generation of bubbles within a transparent micromixer of the same structure would be greatly useful to gain insight into a cause-and-effect relationship for bubbles’ size at the exit of the micromixer.

2.2. Mass Transfer Coefficients

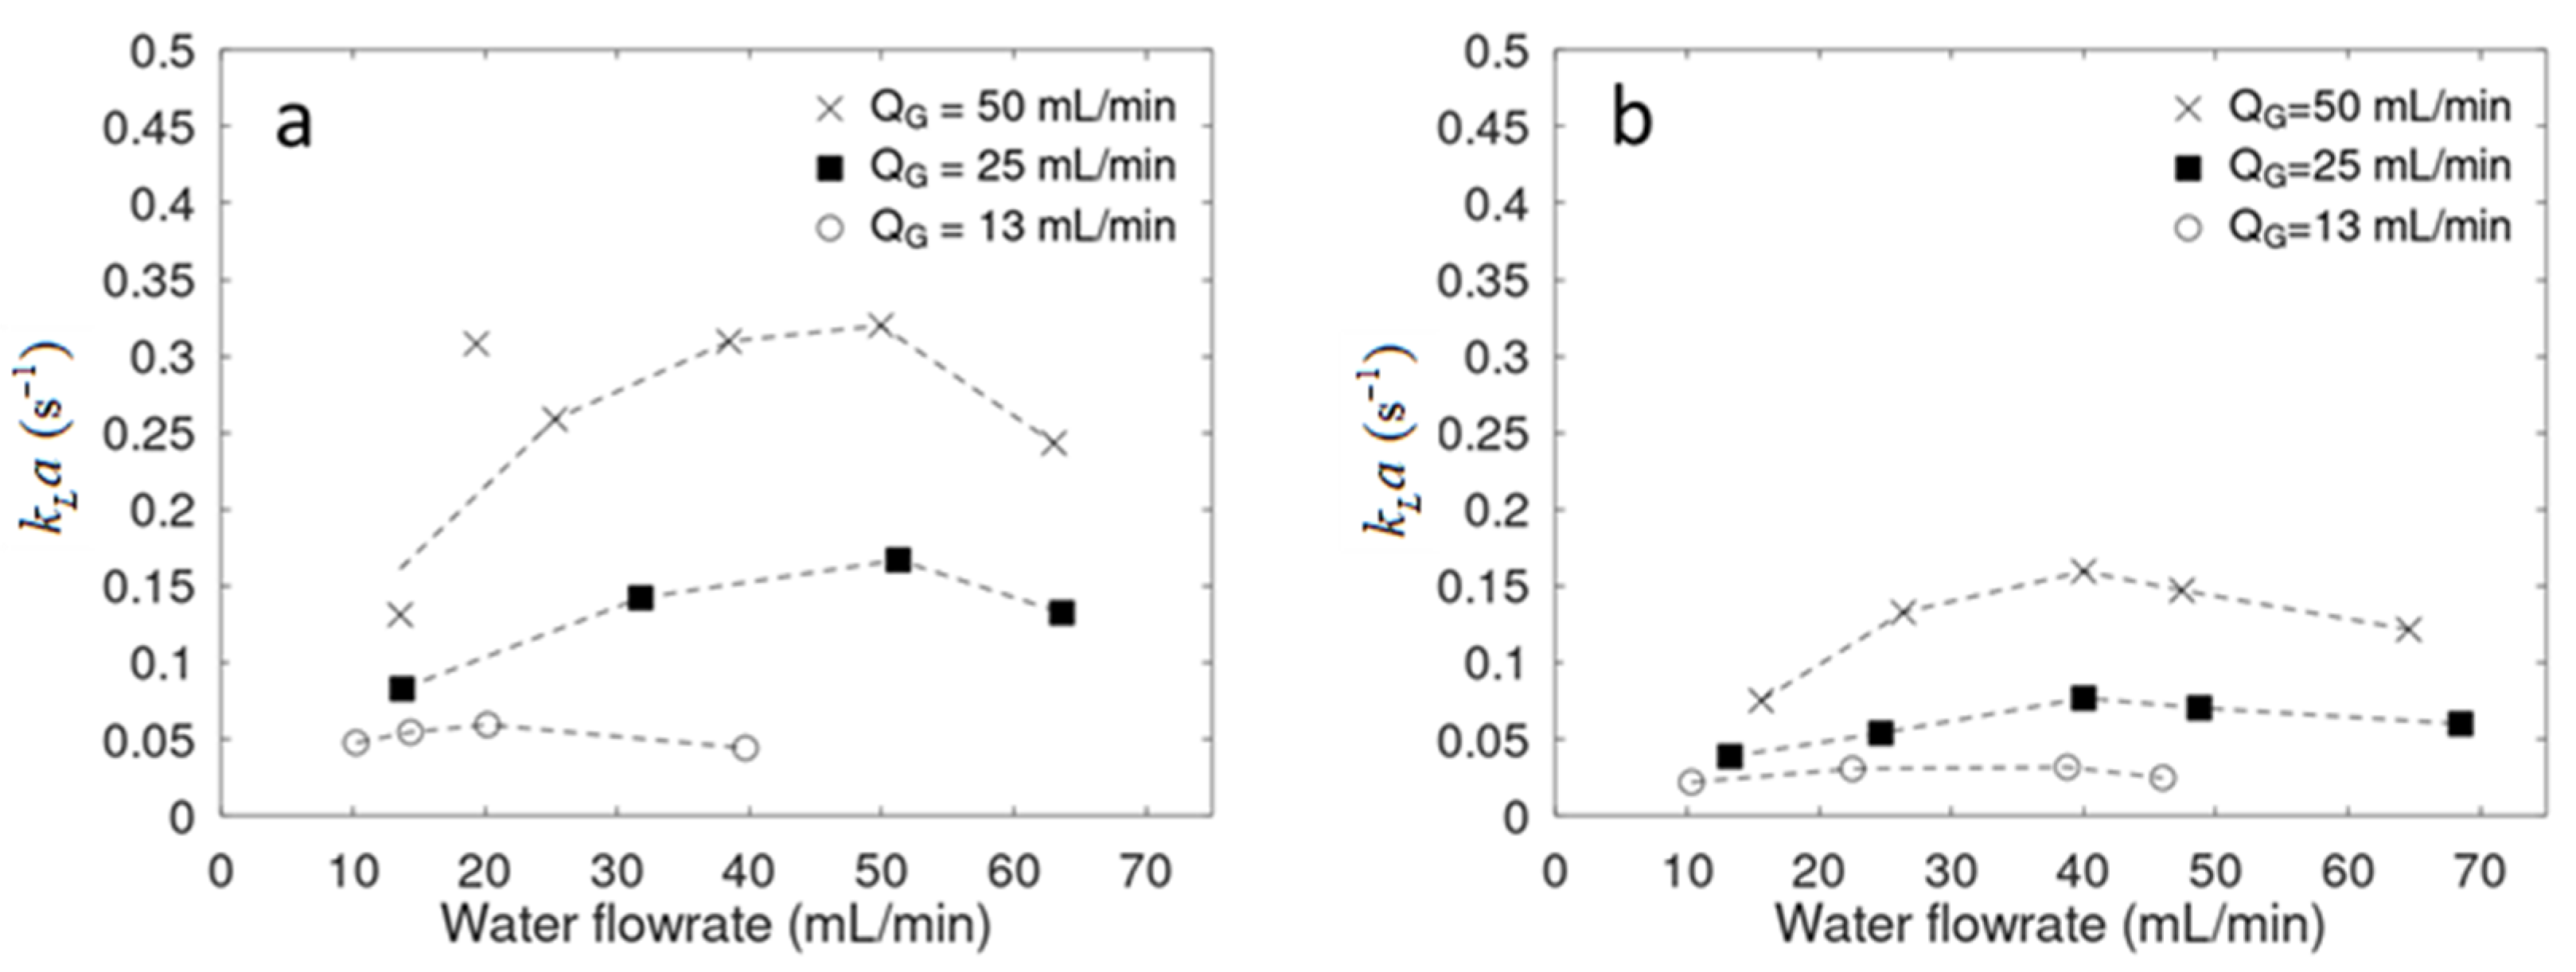
2.2.1. Physical Absorption

The kLa values calculated from the physical absorption experiments are displayed in Figure 5. In configuration 1 (Figure 5a), they range from 0.05 to 0.3 s−1. These results reveal that the mass transfer intensity is higher when the gas flowrate is important, as it was reported elsewhere [14]. The same trend is observed in configuration 2 (Figure 5b), with kLa values ranging from 0.02 to 0.16 s−1. Because of bubble coalescence and the lower level of mixing in the tube, the mass transfer intensity is reduced.
The kLa values determined are global and include the performance of the whole system: the micromixer (MM), the gas–liquid separator and the link between these two elements. In configuration 1, this link is a tube (16 cm long and 3 mm of internal diameter), which is referred to as T16. In configuration 2, the link is composed of the same T16 tube plus the 30 cm long observation tube (T30). As explained in Section 3.2, the absorption in the separator can be neglected. The contribution is measured in terms of (kLa)conf1 and (kLa)conf2 according to the scheme shown in Figure 6. The space times τ were calculated as the ratio of the volume of the element to the total volumetric flowrate, and the various contributions are linked [21] according to the following equations:
k L a c o n f 1 τ c o n f 1 = k L a M M τ M M + k L a T 16 τ T 16
k L a c o n f 2 τ c o n f 2 = k L a c o n f 1 τ c o n f 1 + k L a T 30 τ T 30
The value of k L a T 30 was estimated from Equation (2) to 0.08 s−1, which is similar to the results reported in the literature [22,23]. The flow in T16 was fully developed since these flow conditions had already been reached in T30 (both tubes have the same diameter). Therefore, it may be reasonably assumed that k L a values in both tubes are the same. The contribution of the micromixer k L a M M   was then estimated to 3.5 s−1 from Equation (1). The details of the calculation are reported in Table 1. This device achieved such important mass transfer performance as a result of very good mixing efficiency and of a high interfacial area. In summary, physical absorption allows us to remove up to 25% of carbon dioxide from the biogas stream.

2.2.2. Chemical Absorption

The chemical absorption measurements were carried out under the following conditions: QG = 50 mL/min and QL = 40 mL/min. The reaction kinetics were varied by changing the concentration of catalyst sodium hypochlorite (NaOCl) to enhance the normally slow reaction rate in Equation (10). The results are summarized in Table 2. Using the mass transfer model described in Section 3.3.2 below, the parameters kL and a were used to fit these data sets.
In configuration 1, kL = 6.02 × 10⁻⁴ m·s −1 and a = 802 m−1 (kLa = 0.48 s−1). The kLa value is slightly higher than that obtained by physical absorption. The diffusivity of carbon dioxide in the carbonate solution is higher than in water, which could imply that the liquid-side mass transfer coefficient kL is higher as well. However, the influence of the solvent on the interfacial area is more complicated to assess. In configuration 2, kL = 2.26 × 10⁻⁴ m·s −1 and a = 599 m−1 (kLa = 0.14 s−1), which is in good agreement with the value obtained by physical absorption. Both the interfacial area and the liquid-side mass transfer coefficient are smaller than in configuration 1. Along the tube joining the micromixer to the gas–liquid separator, bubble coalescence leads to a decrease in the interfacial area. The reduction in kL can be explained by a poor mixing in the tube. In the end, the absorption performance was only slightly better than in configuration 1, even though the gas–liquid contact zone was multiplied by 2.75 between both configurations. This confirms that the mass transfer efficiency is far more important in the first one, the micromixer being the most active element in the system. These values are comparable to those reported in the literature (Table 3). The absorption performance obtained by Ganapathy et al. [14] could be attributed to both the aqueous diethanolamine (DEA) used and the increased area per unit volume offered by particularly small microchannels, whose diameter is inferior to 762 µm. The presence of a potential liquid film on a microchannel’s wall could then significantly improve the absorption efficiency. Nevertheless, the scale up of micromixer to upgrade large biogas flows is a challenge, even though strategies of numbering-up can be applied.
In the present work, absorption with chemical reaction can eliminate as high as 88% of the carbon dioxide from the biogas stream.

3. Materials and Methods

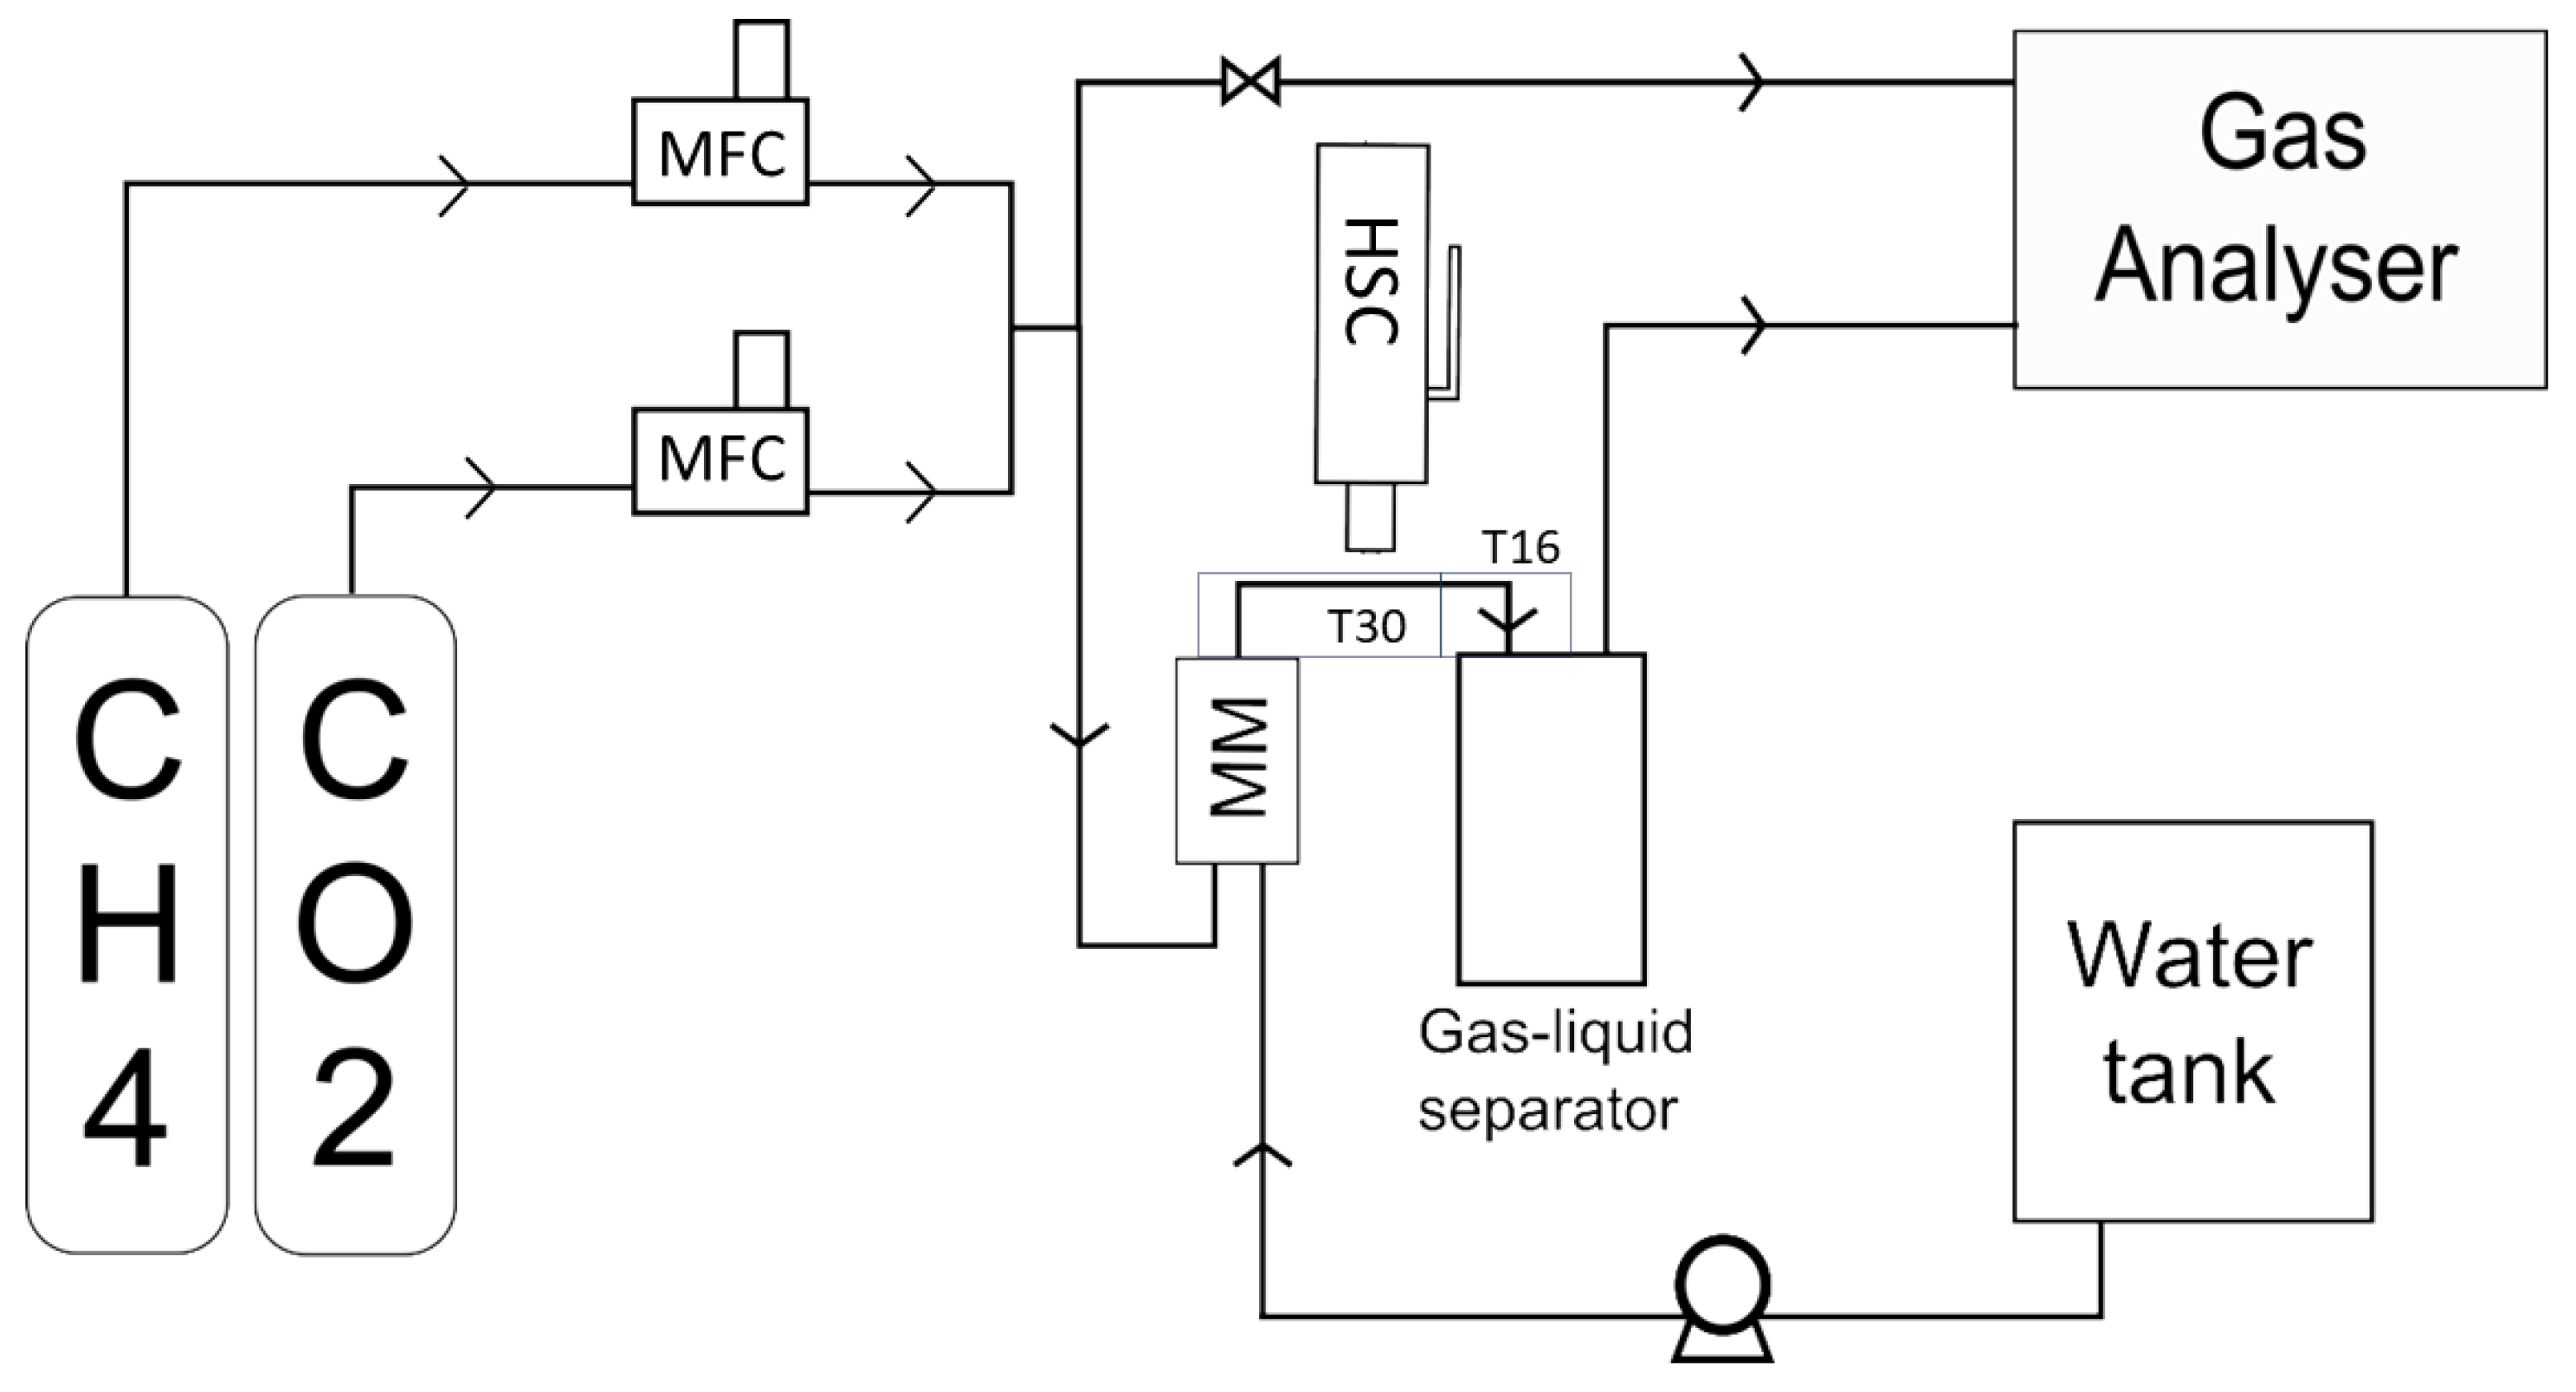
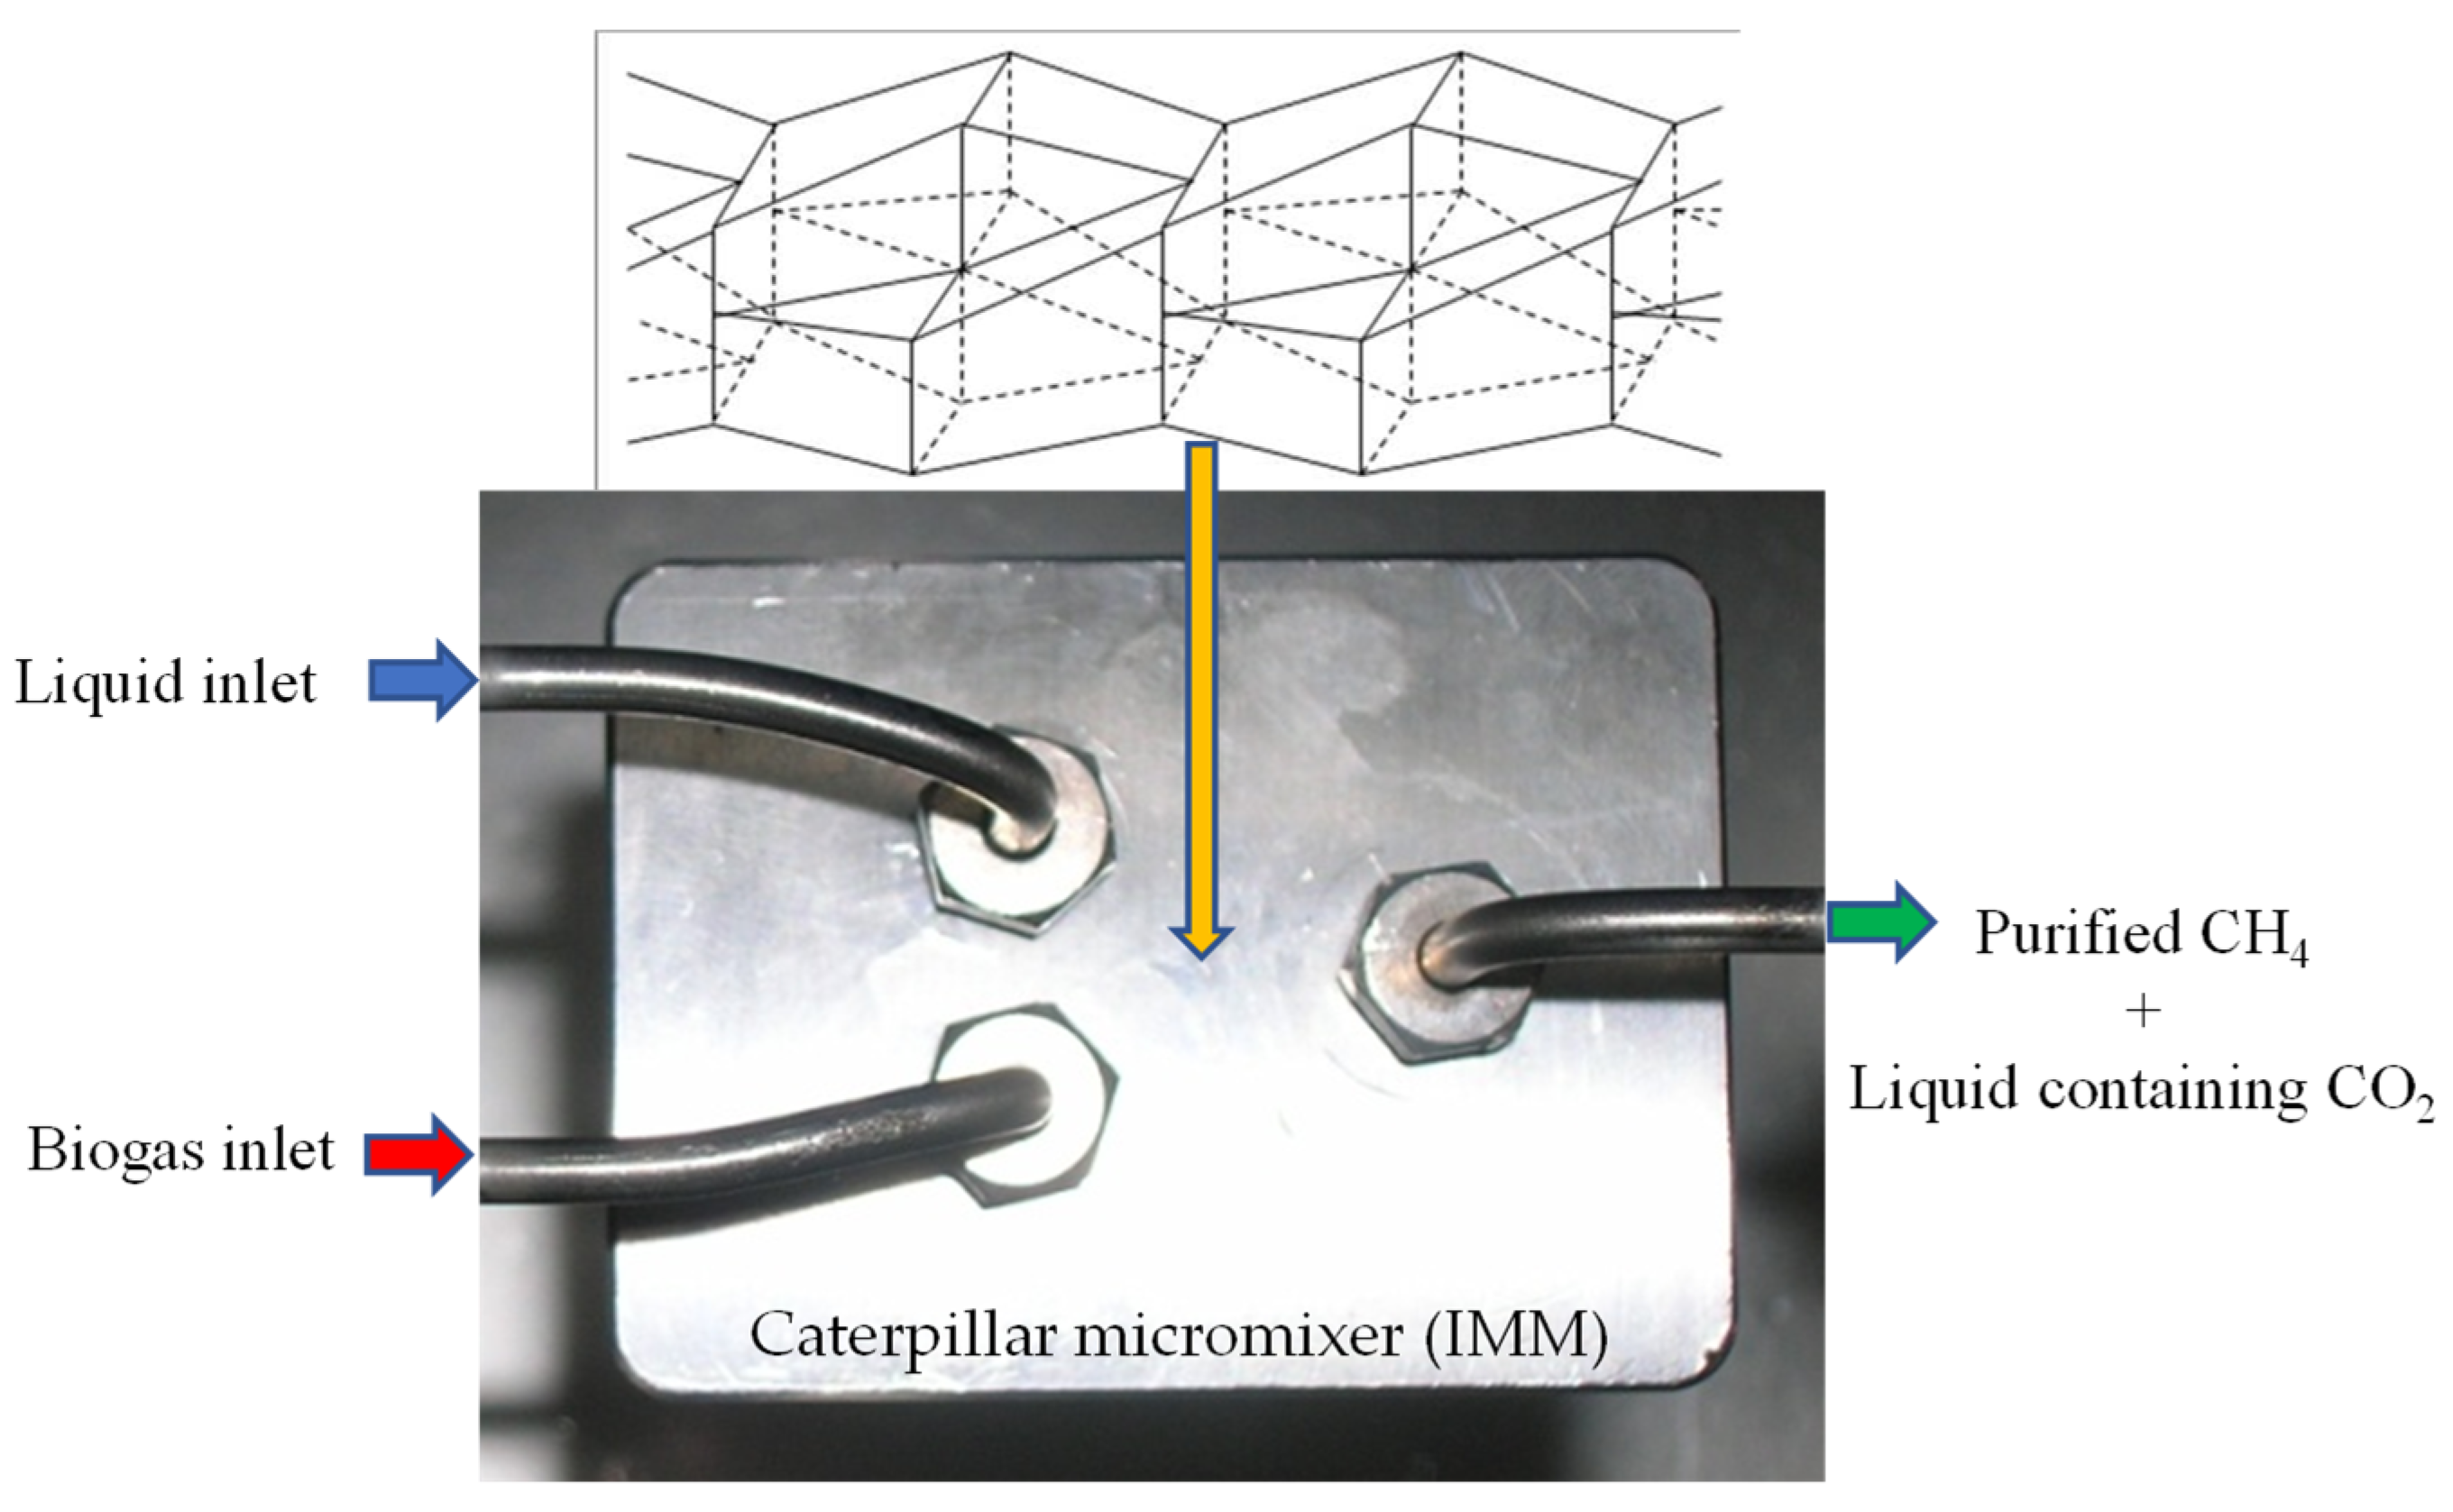
3.1. Experimental Set-Up

Figure 7 shows a schematic representation of the experimental set-up. It comprised two feed sections, a micromixer and an analysis section. The first feed section was designed to mix pure methane and carbon dioxide (from two grade-3.5 gas bottles) of desired composition by means of two mass flow regulators SLA5850 (Brooks, Greenville, PA, USA). The second feed section was used to supply the liquid with a gear pump. The used liquid was de-ionized water. The liquid flow rate was measured by weighting the mass in the tank between the beginning and the end of the experiment. The outlet stream was fed to a closed glass cylinder, which served as a gas–liquid separator. The outlet gas composition was evaluated by a Micro GC 490 micro gas chromatograph equipped with a COX column and a TCD detector (Agilent, Les Ulis, France). A by-pass could be used to lead the initial gas mixture directly to the analyzer and check the composition of the inlet gas mixture.
The micromixer used in this work was a Caterpillar micromixer manufactured by IMM (Institut fur Mikrotechnik Mainz GmBH, Mainz, Germany). This device is a static micromixer designed for multi-lamination. It is made of stainless steel and contains 8 mixing elements in series. The channels have a hydraulic diameter of 1.2 mm for a total length of 19.2 mm (Figure 8). The pressure drop for a single-phase flow or bubble/droplet distributions for two-phase flows were experimentally investigated in our previous works, such as Carrier et al. [19]. However, no more details on the patented internal structures can be given here. The flow is split in each mixing element and recombined in the following element. It can withstand pressures up to 30 bars and temperatures up to 200 °C. In this work, it was operated at room temperature (around 25 °C) under pressures from 1 to 2 bar. The pressure was measured at the inlet of gas and at the inlet of liquid.

3.2. Definition of Absorption Efficiency

The performance of the pilot facility was evaluated according to Equation (3).
η = y C O 2 i n y C O 2 o u t y C O 2 i n
where y C O 2 i n and y C O 2 o u t are the molar fractions of CO2 at the inlet and the outlet of the set-up, respectively. In this global definition, the contributions of the different parts of the experimental facility are combined. Absorption phenomena occurred wherever gas contacted liquid; therefore, 3 distinct sections had to be taken into account: the micromixer, the tube leading to the separator and the separator itself. Absorption phenomena in the separator were considered negligible since the liquid phase was stagnant. This point was confirmed experimentally: gas flowing alone in the separator containing liquid underwent no significant change in concentration. The specific contributions of the micromixer and of the tube to the total absorption efficiency were compared using two distinct configurations.
In configuration 1 (Figure 9a), the gas–liquid mixture exited the micromixer directly into the gas–liquid separator. The total volume of the gas–liquid contact zone (the micromixer and a connection tube of 3 mm I.D. and 16 cm long) was 1.21 × 10⁻⁶ m3. In configuration 2 (Figure 9b), a transparent plastic tube was added at the outlet of the micromixer. This tube allowed the observation of gas–liquid dispersion as well as a more precise quantification of the mass transfer, as discussed in Section 2.2. All other elements were kept identical with respect to configuration 1. The total volume of the gas–liquid contact zone in this configuration was 3.25 × 10⁻⁶ m3.

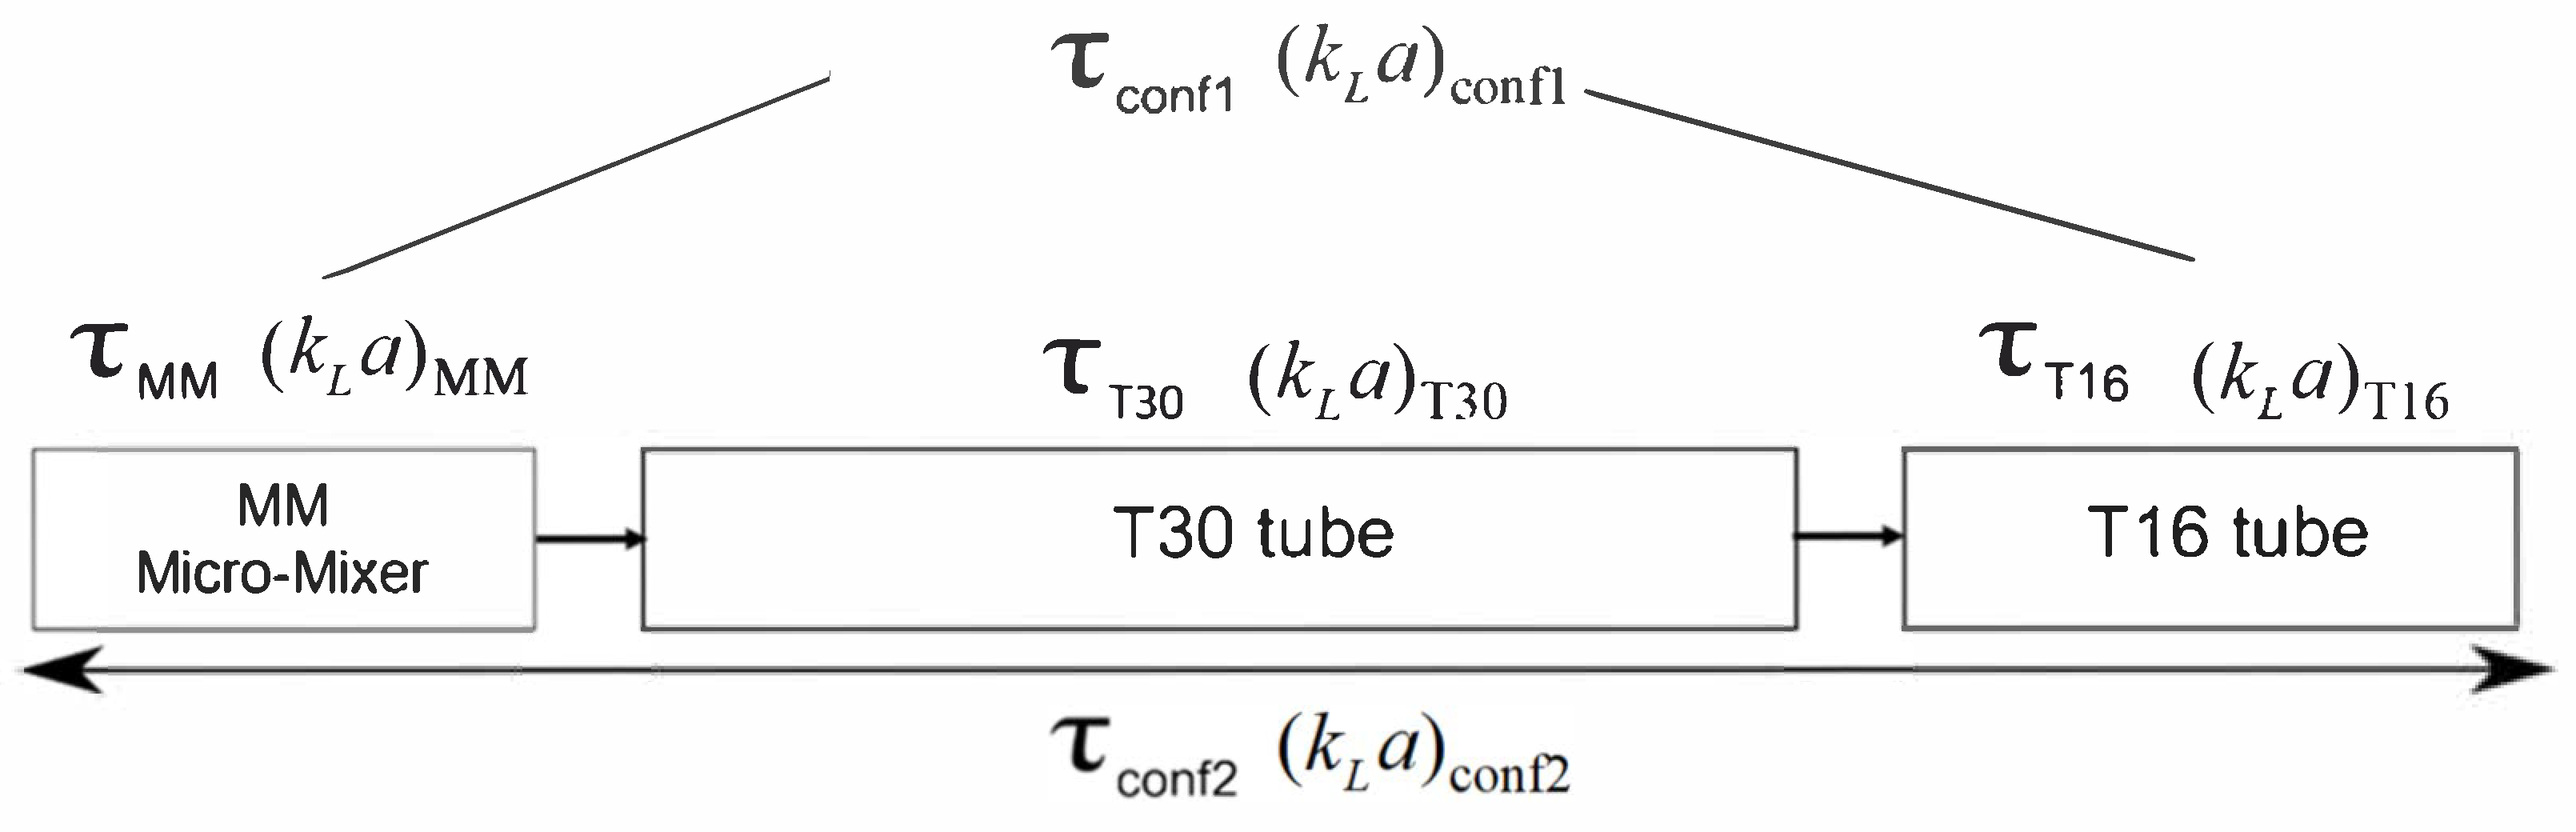
3.3. Mass Transfer Model

The mass transfer coefficient kLa was determined using the mass transfer model described below. Two cases were studied: physical absorption and absorption with a chemical reaction. The absorption of methane was neglected.
The steady-state differential mass balances in the micromixer (considered as a plug-flow reactor) can be expressed as follows:
F C O 2 V d V + R d V L = 0
F C H 4 V d V = 0
where Fi is the molar flow rate (mol·s−1) of species i, R is the absorption rate per unit of liquid volume (mol·m−3·s−1), V (m3) is the reactor volume used as a coordinate for the model and d V L (m3) is the differential liquid volume.
Under the hypothesis of ideal gases and uniform pressure and temperature, the following expression can be obtained:
Q i P R p g T 1 y C O 2 e y C O 2 1 y C O 2 2 d y C O 2 = R ε d V
where ε is the liquid fraction, calculated as the ratio of the liquid volumetric flowrate to the total volumetric flowrate, Q i (m3·s−1) is the inlet biogas flow rate, P is the total pressure (Pa), T is the temperature (K) and R g (J·K−1·mol−1) is the ideal gas constant.

3.3.1. Physical Absorption Schemes

For physical absorption, the absorption rate can be described as in Equation (7):
R = k L a ( C C O 2 , L i C C O 2 , L )
where C C O 2 , L i and C C O 2 , L are the molar concentrations of CO2 (mol·m−3) in the liquid phase at the gas–liquid interface and in the bulk of the liquid, respectively.
If the gas-side transfer resistance can be neglected [27], the interfacial concentration can be calculated using Henry’s law (Equation (8)):
C C O 2 , L i = P y C O 2 H
where H (mol·m−3·Pa−1) is Henry’s constant. The bulk concentration can be determined by a mass balance on dissolved carbon dioxide, as shown in Equation (9):
d C C O 2 , L d V = R ε Q L
Differential equation 9 was numerically solved by Euler’s method along with Equations (8) and (9). A comparison with the experimental data allowed us to then compute the mass transfer coefficient k L a involved in Equation (7). It is worth noting that the estimation of the value of k L a depends mainly on the experimental data, whose relative error was around 3%.

3.3.2. Chemical Absorption Schemes

The system used for the chemical absorption experiments was a 0.5 M KHCO3/0.5 M K2CO3 buffer. This system was described in detail in the work of Cents [28] and Sobieszuk et al. [12]. Three reactions were involved, with their rate constants k or equilibrium constant K as follows:
k H 2 O     ( s 1 ) :                 C O 2 + H 2 O = H C O 3 + H +
k H O   ( m 3 · m o l 1 · s 1 ) :               C O 2 + H O = H C O 3
K c a r b :             H C O 3 = C O 3 2 + H +
The rate of reaction (10) is very slow, as revealed by Danckwerts and Sharma [29], but it can be catalyzed by a number of agents, among which is sodium hypochlorite: the catalytic rate constant is written as kc  ( m 3 · m o l 1 · s 1 )   and the catalyst concentration is written as C C   ( m o l · m 3 ) . Its rate is given by
r H 2 O = k H 2 O + k C C C C C O 2 , L
Reaction (11) is a second order reaction. Its rate is given by
r H O = k H O c C H O C C O 2 , L
where C H O   ( m o l · m 3 ) is the hydroxyl anion concentration.
Equilibrium (Equation (12)) allows the calculation of the hydroxyl anion concentration:
c H O = K W C C O 3 2 K c a r b C H C O 3 = K W K c a r b
where K W is the dissociation constant of water, C C O 3 2   ( m o l · m 3 ) is the carbonate concentration and C H C O 3   ( m o l · m 3 ) is the hydrogen carbonate concentration. The overall reaction rate can therefore be calculated as follows:
r C O 2 = k H 2 O + k c C c + k H O K W K c a r b C C O 2 = k a p p C C O 2
In this equation C C O 2   ( m o l · m 3 ) represents the carbon dioxide concentration.
The solubility and diffusivity of carbon dioxide in the buffer were determined, respectively, from the work of Weisenberger and Schumpe [30] and Joosten and Danckwerts [31]. The physico-chemical parameters we used are gathered in Table 4.
The kinetic constants k H 2 O , kc and k H O were determined, respectively, from the work of Pinsent and Roughton [32], Benadda et al. [33] and Pohorecki and Moniuk [34]. Finally, Danckwerts’ surface renewal model [35] establishes the following absorption rate for a pseudo-first-order reaction with negligible bulk concentration:
R = k L 1 + k a p p D k L 2   C C O 2 i a
The value of kapp could be modified by varying the sodium hypochlorite concentration ( C c ). Using this expression of the absorption rate in Equation (6), the parameters kL and a were used to fit the experimental results.

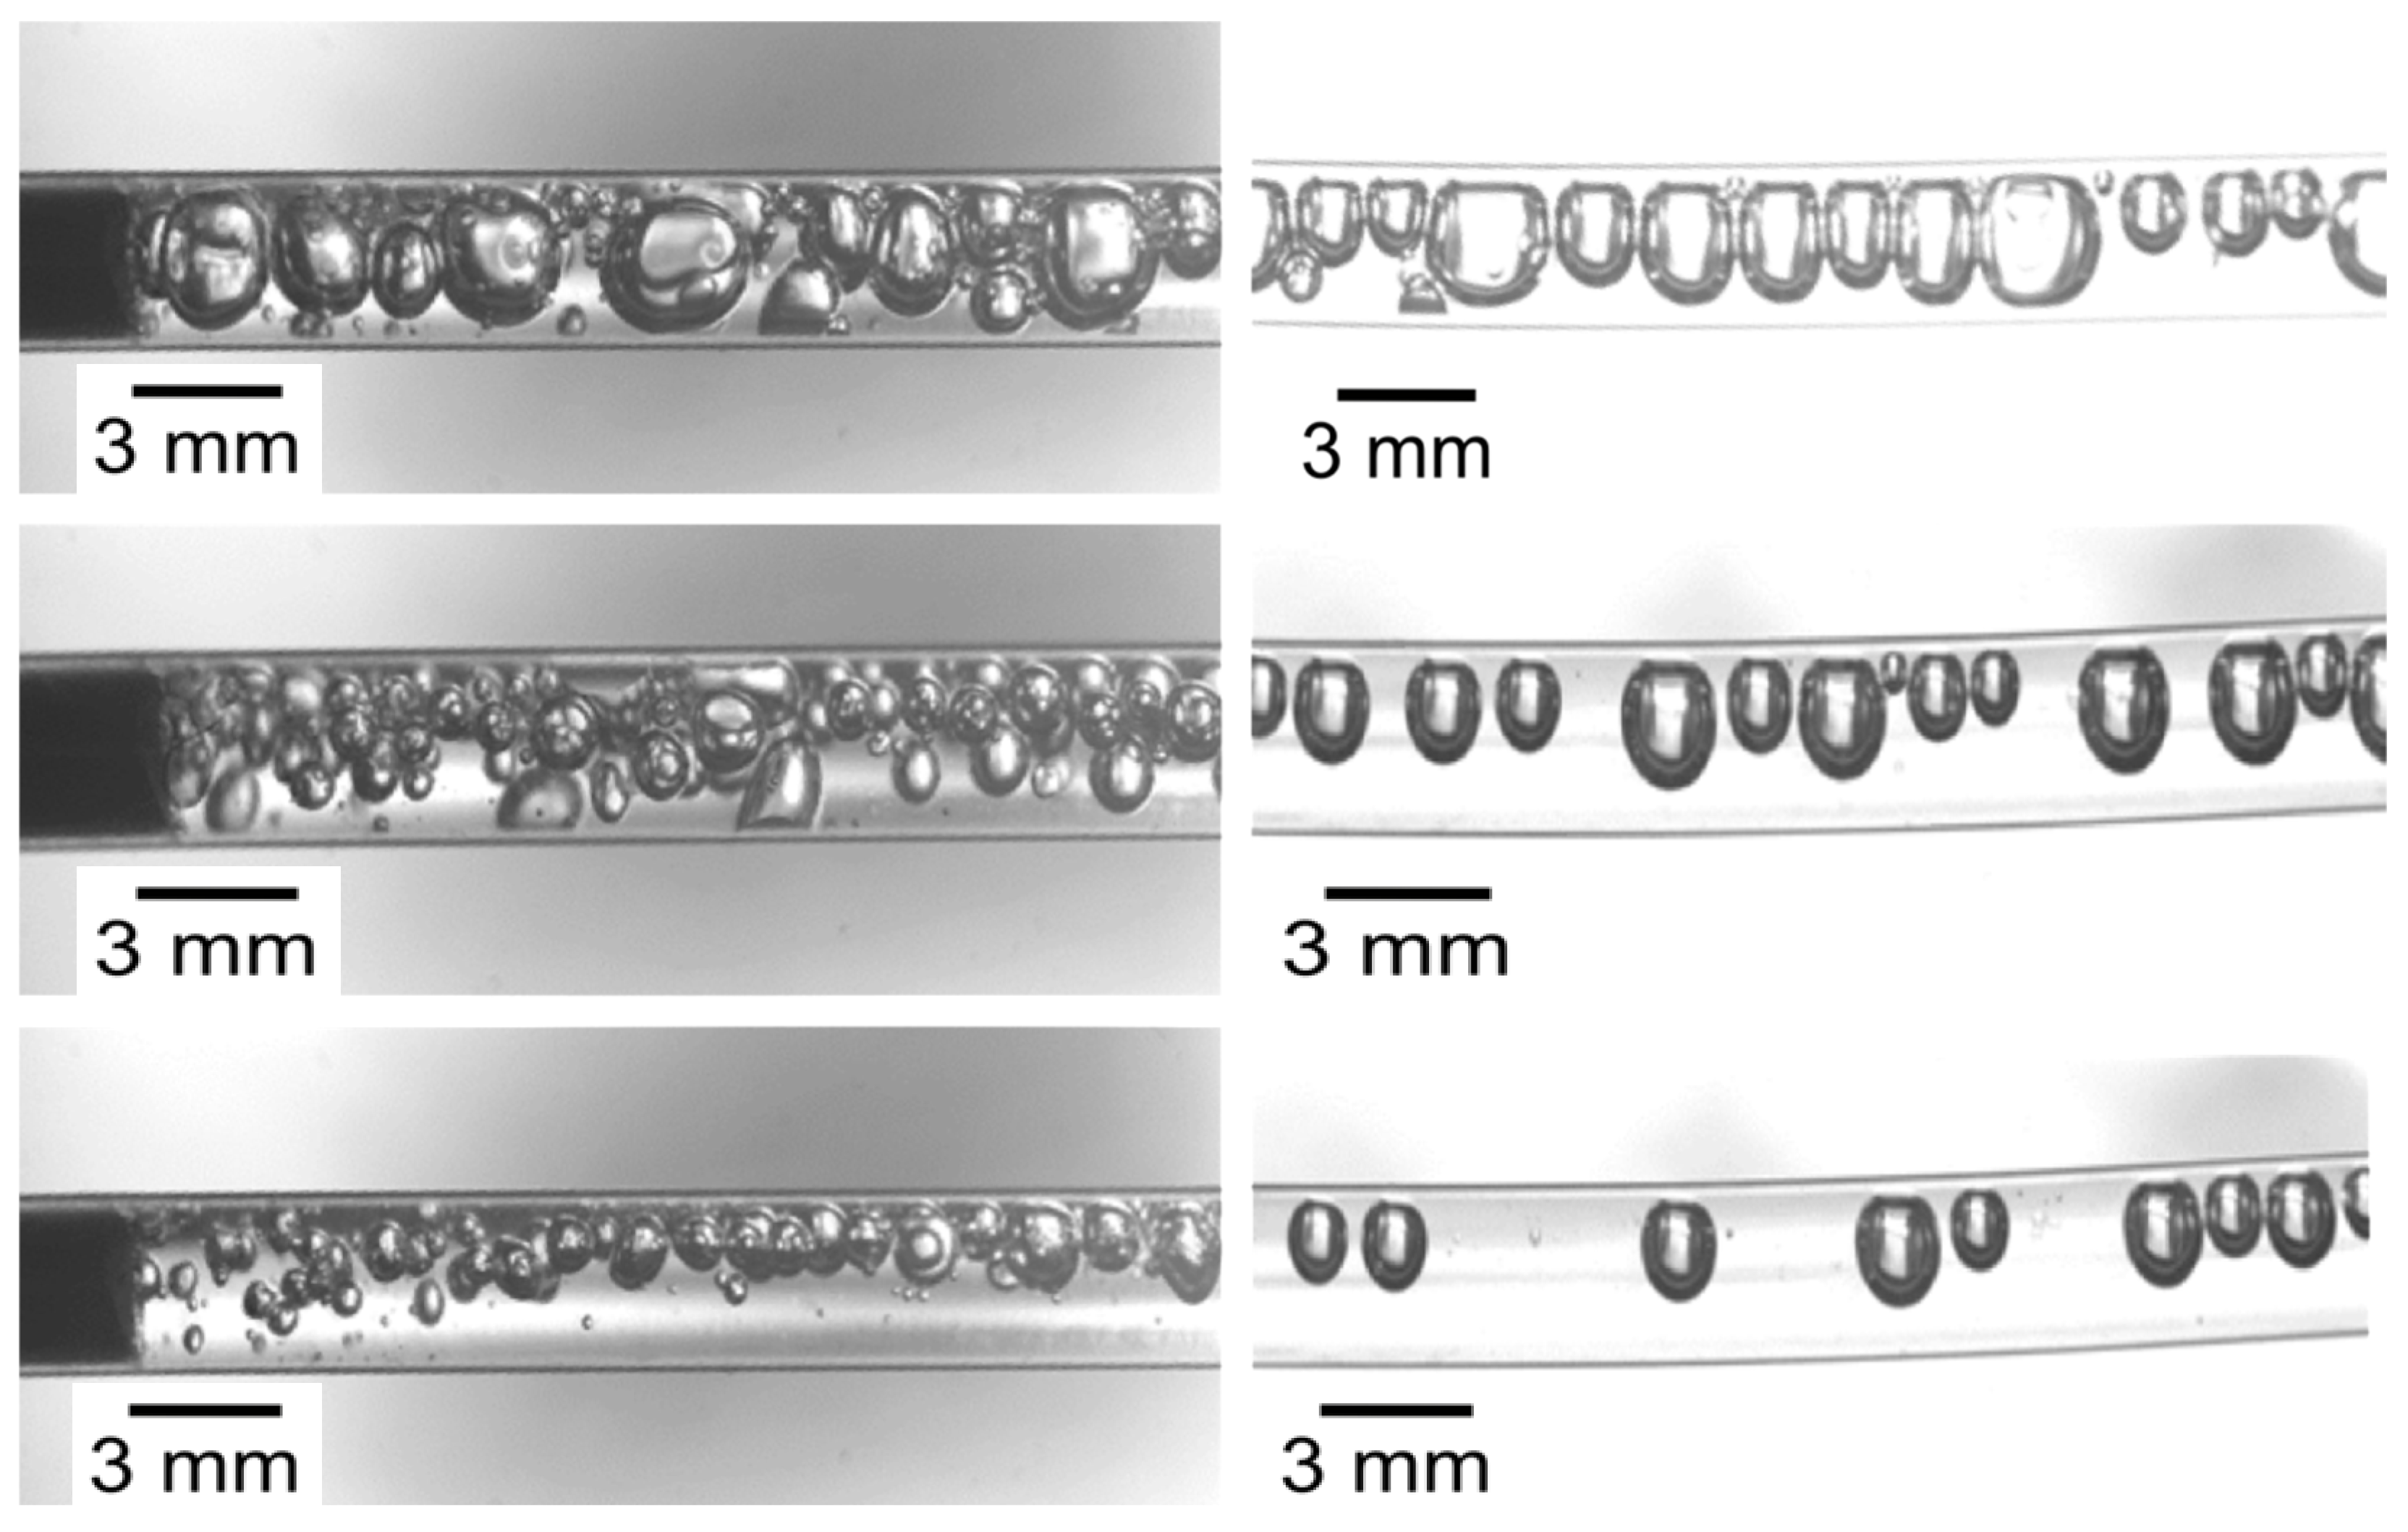
3.4. Multiphase Hydrodynamics

The direct observation of the flow inside the micromixer was not possible owing to its opaque structure. Nevertheless, the multiphase flow could be seen in the transparent plastic tube leading from the micromixer to the separator. Due to the rapid coalescence of the bubbles, the flow was probably different from that inside the micromixer. However, such observations were useful to gain information about the quality of the dispersion and to correlate it to the absorption process. The images were captured with a high-speed camera, the Phantom v711 (Vision Research, USA).

4. Conclusions

The present study investigated the physical and chemical absorption of carbon dioxide in a micromixer. The experimental results revealed that high CO2 removal efficiency could be achieved under short space times. This is the manifestation of high mass transfer efficiency, with kLa as high as 3.5 s−1 in the micromixer, which is about two orders of magnitude higher than those reported in conventional absorbers [35]. The study of the gas–liquid flow was helpful to establish a straightforward relationship between the mass transfer performance and the flow patterns when the gas and liquid flowrates were varied. Physical absorption in water is probably the simplest method for biogas upgrading, as it is also the most commonly used. Under the assumption of the pseudo-first-order reaction with exponential scaling and the absorption kinetics determined in this work, a total of six identical micromixers operating in series would be necessary to upgrade the biogas from 60% to 95% CH4 content by absorption in water. An increase in the operating pressure would have a positive effect on the mass transfer efficiency but would raise supplementary technical issues. On the other hand, absorption with chemical reaction offers better efficiency; however, it involves additional costs due to chemical purchasing and solvent regeneration.

Author Contributions

Conceptualization, T.N.W. and H.Z.L.; methodology, T.N.W., S.D., J.W. and H.Z.L.; validation, T.N.W., S.D., J.W. and H.Z.L.; formal analysis, T.N.W., S.D. and H.Z.L.; investigation, T.N.W., S.D., J.W. and H.Z.L.; resources, J.W. and H.Z.L.; data curation, T.N.W. and H.Z.L.; writing—original draft preparation, T.N.W. and H.Z.L.; writing—review and editing, T.N.W. and H.Z.L.; supervision, J.W. and H.Z.L.; project administration, J.W. and H.Z.L.; funding acquisition, J.W. and H.Z.L. All authors have read and agreed to the published version of the manuscript.

Funding

The financial assistance provided by the French Agence Nationale de la Recherche (ANR-10-INTB-0906 PROMET) and by the Natural Science Foundation of China (51061130555) to this joint project is gratefully acknowledged.

Institutional Review Board Statement

Not applicable.

Informed Consent Statement

Not applicable.

Data Availability Statement

Related data could be made available upon request.

Conflicts of Interest

The authors declare no conflicts of interest.

Abbreviation

MMmicromixer

References

  1. Aghel, B.; Behaein, S.; Wongwises, S.; Shadloo, M.S. A review of recent progress in biogas upgrading: With emphasis on carbon capture. Biomass Bioenergy 2022, 160, 106422. [Google Scholar] [CrossRef]
  2. Wu, H.; Liao, J.; Chen, X.; Ren, X.; Zhou, J.; Jiang, M. Decarbonization of simulated biogas with microchannel mixer by pressurized water scrubbing. J. Clean. Prod. 2024, 457, 142230. [Google Scholar] [CrossRef]
  3. Chalermthai, P.; Akkarawatkhoosith, N.; Kaewchada, A.; Jaree, A. Carbon dioxide Removal via Absorption using Artificial Seawater in a Microchannel for the Case of CO2-Rich Gas. Chem. Eng. Process.-Process Intensif. 2022, 175, 108928. [Google Scholar] [CrossRef]
  4. Ryckebosch, E.; Drouillon, M.; Vervaeren, H. Techniques for transformation of biogas to biomethane. Biomass Bioenergy 2011, 35, 1633–1645. [Google Scholar] [CrossRef]
  5. Zhang, F.; Guo, L.; Ding, Y.; Zhu, X.; Liao, Q. Flow pattern and CO2 absorption in a falling film reactor with mixed aqueous solution of ionic liquid and MEA. Appl. Therm. Eng. 2018, 138, 583–590. [Google Scholar] [CrossRef]
  6. Zhang, H.; Chen, G.; Yue, J.; Yuan, Q. Hydrodynamics and mass transfer of gas–liquid flow in a falling film microreactor. AIChE J. 2009, 55, 1110–1120. [Google Scholar] [CrossRef]
  7. Zanfir, M.; Gavriilidis, A.; Wille, C.; Hessel, V. Carbon Dioxide Absorption in a Falling Film Microstructured Reactor:  Experiments and Modeling. Ind. Eng. Chem. Res. 2005, 44, 1742–1751. [Google Scholar] [CrossRef]
  8. Sun, X.Y.; Gavriilidis, A. Experimental Evaluation of a Micromesh Gas/Liquid Reactor for Catalytic Asymmetric Transfer Hydrogenation. Chem. Eng. Technol. 2009, 32, 1318–1325. [Google Scholar] [CrossRef]
  9. Constantinou, A.; Gavriilidis, A. CO2 absorption in a microstructured mesh reactor. Ind. Eng. Chem. Res. 2010, 49, 1041–1049. [Google Scholar] [CrossRef]
  10. Chen, G.; Yue, J.; Yuan, Q. Gas-Liquid Microreaction Technology: Recent Developments and Future Challenges. Chin. J. Chem. Eng. 2008, 16, 663–669. [Google Scholar] [CrossRef]
  11. Yue, J.; Boichot, R.; Luo, L.; Gonthier, Y.; Chen, G.; Yuan, Q. Flow distribution and mass transfer in a parallel microchannel contactor integrated with constructal distributors. AIChE J. 2010, 56, 298–317. [Google Scholar] [CrossRef]
  12. Sobieszuk, P.; Pohorecki, R.; Cygański, P.; Grzelka, J. Determination of the interfacial area and mass transfer coefficients in the Taylor gas–liquid flow in a microchannel. Chem. Eng. Sci. 2011, 66, 6048–6056. [Google Scholar] [CrossRef]
  13. Wang, X.; Yong, Y.; Yang, C.; Mao, Z.S.; Li, D. Investigation on pressure drop characteristic and mass transfer performance of gas–liquid flow in micro-channels. Microfluid. Nanofluidics 2014, 16, 413–423. [Google Scholar] [CrossRef]
  14. Ganapathy, H.; Shooshtari, A.; Dessiatoun, S.; Ohadi, M.M.; Alshehhi, M. Hydrodynamics and mass transfer performance of a microreactor for enhanced gas separation processes. Chem. Eng. J. 2015, 266, 258–270. [Google Scholar] [CrossRef]
  15. Hessel, V.; Hardt, S.; Löwe, H.; Schönfeld, F. Laminar mixing in different interdigital micromixers: I. Experimental characterization. AIChE J. 2003, 49, 566–577. [Google Scholar] [CrossRef]
  16. Schönfeld, F.; Hessel, V.; Hofmann, C. An optimised split-and-recombine micro-mixer with uniform “chaotic” mixing. Lab Chip 2004, 4, 65–69. [Google Scholar] [CrossRef]
  17. Zhang, H.; Li, X.; Chuai, R.; Zhang, Y. Chaotic Micromixer Based on 3D Horseshoe Transformation. Micromachines 2019, 10, 398. [Google Scholar] [CrossRef]
  18. Ghanem, A.; Lemenand, T.; Della Valle, D.; Peerhossaini, H. Static mixers: Mechanisms, applications, and characterization methods—A review. Chem. Eng. Res. Des. 2014, 92, 205–228. [Google Scholar] [CrossRef]
  19. Carrier, O.; Funfschilling, D.; Debas, H.; Poncin, S.; Löb, P.; Li, H.Z. Pressure drop in a split-and-recombine caterpillar micromixer in case of newtonian and non-newtonian fluids. AIChE J. 2013, 59, 2679–2685. [Google Scholar] [CrossRef]
  20. Choe, J.; Seo, J.H.; Kwon, Y.; Song, K.H. Lithium–halogen exchange reaction using microreaction technology. Chem. Eng. J. 2008, 135, S17–S20. [Google Scholar] [CrossRef]
  21. Kashid, M.N.; Renken, A.; Kiwi-Minsker, L. Gas–liquid and liquid–liquid mass transfer in microstructured reactors. Chem. Eng. Sci. 2011, 66, 3876–3897. [Google Scholar] [CrossRef]
  22. Vandu, C.O.; Liu, H.; Krishna, R. Mass transfer from Taylor bubbles rising in single capillaries. Chem. Eng. Sci. 2005, 60, 6430–6437. [Google Scholar] [CrossRef]
  23. Berčič, G.; Pintar, A. The role of gas bubbles and liquid slug lengths on mass transport in the Taylor flow through capillaries. Chem. Eng. Sci. 1997, 52, 3709–3719. [Google Scholar]
  24. Yue, J.; Chen, G.; Yuan, Q.; Luo, L.; Gonthier, Y. Hydrodynamics and mass transfer characteristics in gas–liquid flow through a rectangular microchannel. Chem. Eng. Sci. 2007, 62, 2096–2108. [Google Scholar] [CrossRef]
  25. Roudet, M.; Loubière, K.; Gourdon, C.; Cabassud, M. Hydrodynamic and mass transfer in inertial gas–liquid flow regimes through straight and meandering millimetric square channels. Chem. Eng. Sci. 2011, 66, 2974–2990. [Google Scholar] [CrossRef]
  26. Tan, J.; Lu, Y.C.; Xu, J.H.; Luo, G.S. Mass transfer performance of gas–liquid segmented flow in microchannels. Chem. Eng. J. 2012, 181–182, 229–235. [Google Scholar] [CrossRef]
  27. Nock, W.J.; Walker, M.; Kapoor, R.; Heaven, S. Modeling the Water Scrubbing Process and Energy Requirements for CO2 Capture to Upgrade Biogas to Biomethane. Ind. Eng. Chem. Res. 2014, 53, 12783–12792. [Google Scholar] [CrossRef]
  28. Cents, A.H.G. Mass Transfer and Hydrodynamics in Stirred Gas-Liquid-Liquid Contactors. Ph.D. Thesis, Universiteit Twente, Enschede, The Netherlands, 2003. [Google Scholar]
  29. Danckwerts, P.V.; Sharma, M.M. The absorption of carbon dioxide into solutions of alkalis and amines (with some notes on hydrogen sulphide and carbonyl sulphide). Chem. Eng. 1966, CE8, 244–278. [Google Scholar]
  30. Weisenberger, S.; Schumpe, A. Estimation of gas solubilities in salt solutions at temperatures from 273 K to 363 K. AIChE J. 1996, 42, 298–300. [Google Scholar] [CrossRef]
  31. Joosten, G.E.H.; Danckwerts, P.V. Solubility and diffusivity of nitrous oxide in equimolar potassium carbonate-potassium bicarbonate solutions at 25.deg. and 1 atm. J. Chem. Eng. Data 1972, 17, 452–454. [Google Scholar] [CrossRef]
  32. Pinsent, B.R.W.; Roughton, F.J.W. The kinetics of combination of carbon dioxide with water and hydroxide ions. Trans. Faraday Soc. 1951, 47, 263–269. [Google Scholar] [CrossRef]
  33. Benadda, B.; Prost, M.; Ismaily, S.; Bressat, R.; Otterbein, M. Validation of the gas-lift capillary bubble column as a simulation device for a reactor by the study of CO2 absorption in Na2CO3/NaHCO3 solutions. Chem. Eng. Process. Process Intensif. 1994, 33, 55–59. [Google Scholar] [CrossRef]
  34. Pohorecki, R.; Moniuk, W. Kinetics of reaction between carbon dioxide and hydroxyl ions in aqueous electrolyte solutions. Chem. Eng. Sci. 1988, 43, 1677–1684. [Google Scholar] [CrossRef]
  35. Danckwerts, P.V. Gas-Liquid Reactions; McGraw-Hill Book Co.: New York, NY, USA, 1970. [Google Scholar]
Figure 1. Absorption efficiency as a function of water flowrate in the configuration 1.
Methane 04 00014 g001
Figure 2. Pressure at the gas inlet as a function of the water flowrate.
Methane 04 00014 g002
Figure 3. Absorption efficiency as a function of water flowrate in configuration 2.
Methane 04 00014 g003
Figure 4. Images of the gas–liquid dispersion at the outlet of the micromixer (left) and at the end of the tube (right), for QG = 50 mL/min and QL = 20 mL/min (top), QL = 40 mL/min (middle) and QL = 60 mL/min (bottom).
Methane 04 00014 g004
Figure 5. kLa as a function of the water flowrate in (a) configuration 1 and (b) configuration 2.
Methane 04 00014 g005
Figure 6. Illustration of the major contributions to the mass transfer. The subscripts for k L a and τ represent the various parts of the system.
Methane 04 00014 g006
Figure 7. Schematic representation of the experimental set-up (MFC: mass flow regulator; MM: micromixer; HSC: high-speed camera, Phantom v711 (Vision Research, USA); T30: 30 cm long observation tube; T16: 16 cm long connection tube).
Methane 04 00014 g007
Figure 8. Presentation of the Caterpillar micromixer (IMM: Institut fur Mikrotechnik Mainz GmBH, Germany) as well as the schematic illustration of two mixing elements in series.
Methane 04 00014 g008
Figure 9. Pictures of the experimental set-up: (a) configuration 1 and (b) configuration 2. A more detailed and close view of the MM can be found in Figure 8.
Methane 04 00014 g009
Table 1. Parameters for the calculation of the various contributions to the mass transfer. QG = 50 mL/min and QL = 40 mL/min.
ElementVolume (m3) τ (s) k L a τ k L a (s−1)
Config. 23.3 × 10−62.20.350.16
Config. 11.2 × 10−60.810.240.3
T302.1 × 10−61.40.110.078
T161.1 × 10−60.750.0590.078
MM7.9 × 10−80.0520.183.5
Table 2. Conditions for the chemical absorption experiments.
ConfigurationCNaOCl (mol·m−3)kapp (s−1)Outlet yCO2Absorption Efficiency (%)
120.531.60.12076
140.262.00.13074
159.191.30.08783
177.41190.05988
210.316.00.15968
220.531.60.13173
230.447.00.08084
240.262.00.05988
Table 3. Mass transfer coefficients and interfacial area in the literature.
AuteurGasSystemkL × 10−4 (m·s−1)a (m−1)kLa (s−1)
Vandu et al. [22]AirCapillaries d = 1, 2, 3 mm//0.08–0.8
Berčič and Pintar [23]CH4Capillaries d = 1.5, 2.5, 3.1 mm//0.006–0.3
Yue et al. [24]CO2Rectangular micro-channel dH = 667 µm5–153000–90000.2–21
Sobieszuk et al. [12]CO2Circular microchannel d = 0.4 mm//2–6
Roudet et al. [25]AirSquare microchannel dH = 2 mm1–5200–16000.05–0.7
Tan et al. [26]CO2Rectangular micro-channel 0.4 × 0.5 mm1–7//
Ganapathy et al. [14]CO2Circular microchannel d = 254, 508, 762 µm90–3004500–15,00025–400
This studyCO2Microstructrured static micromixer dH = 1, 2 mm26000.14
Table 4. Physico-chemical parameters at 20 °C.
ParameterValueUnit
k H 2 O 0.02s−1
k C 1.54m3·mol−1·s−1
k H O 2.16m3·mol−1·s−1
D1.48 × 10−9m2·s−1
H3.83 × 10−4mol·m−3·Pa−1
Disclaimer/Publisher’s Note: The statements, opinions and data contained in all publications are solely those of the individual author(s) and contributor(s) and not of MDPI and/or the editor(s). MDPI and/or the editor(s) disclaim responsibility for any injury to people or property resulting from any ideas, methods, instructions or products referred to in the content.

