1. Introduction
Oil and natural gas will remain integral to the energy system for the foreseeable future, necessitating a focus on mitigating their immediate environmental impacts. Reducing methane emissions, which are currently over two-and-a-half times higher than pre-industrial levels [
1], is a crucial and cost-effective strategy that complements efforts to reduce CO
2. Global methane emissions are estimated at 570 million tons (Mt) annually, with agriculture and the energy sector, including coal, oil, natural gas, and biofuels, being major contributors [
2]. While all methane sources require attention, emissions from oil and gas operations are particularly significant [
3]. These operations offer an opportunity for cost-effective reduction due to the commercial value of methane, making emissions cuts economically favorable. Projections indicate that oil and natural gas will play significant roles in the energy system [
4]. Gas can facilitate the transition by replacing more polluting fuels and providing challenging-to-replace services. Nonetheless, minimizing adverse social and environmental impacts is crucial, with substantial and immediate methane emission reductions being central to achieving this objective.
Accurate methane detection and monitoring systems are crucial for several reasons [
5]. Firstly, they play a vital role in climate change mitigation, as methane is a potent greenhouse gas with a higher global warming potential than carbon dioxide over a shorter period [
6]. Effective detection and monitoring allow for the identification and mitigation of methane leaks, reducing greenhouse gas emissions and combating climate change [
7]. Secondly, these systems help minimize the environmental impact of methane leaks from various sources, such as natural gas pipelines, oil and gas infrastructure, landfills, sargassum landing, and agricultural activities [
7]. The prompt detection and repair of leaks protect local air quality, water resources, and ecosystems. Additionally, methane leaks pose significant public health and safety risks due to the gas’s flammability, which can lead to explosions or fires if concentrations reach hazardous levels [
8]. Accurate monitoring helps identify and mitigate these risks, safeguarding public health. Compliance with regulatory guidelines set by bodies like the Environmental Protection Agency (EPA) is another critical aspect, as the accurate detection and reporting of methane leaks are necessary for companies to meet legal requirements and avoid penalties [
9]. Finally, early detection enables timely repairs and maintenance, preventing leaks from escalating into larger issues, thereby reducing economic losses, improving operational efficiency, and enhancing asset integrity.
State-of-the-Art
Methane leak detection techniques have evolved significantly, incorporating advanced technologies to enhance their accuracy and efficiency [
10]. Traditional methods include flame ionization detectors (FIDs) and infrared (IR) cameras, which identify methane emissions by detecting the heat signature of gas leaks [
11]. More recent advancements utilize laser-based detection systems, such as Tunable Diode Laser Absorption Spectroscopy (TDLAS), which offer high sensitivity and rapid response times [
10]. Additionally, mobile platforms, including drones equipped with methane sensors and AI-driven data analytics, provide comprehensive coverage and real-time monitoring of methane leaks over large areas [
10]. These innovations not only improve the detection and quantification of methane emissions but also support timely mitigation efforts to reduce the environmental and economic impacts.
Using drones or UAVs equipped with sensors and cameras for methane detection is a promising approach due to their ability to cover large areas efficiently [
12]. However, accuracy is a crucial aspect that needs improvement. Factors like background noise, wind direction, and other parameters can affect the reliability of methane detection [
13]. Developing algorithms that can increase the accuracy of methane detection using drone-armed sensors and cameras is essential to ensure reliable and effective monitoring systems [
13]. This would enable the more precise identification of leaks, better targeting of repair efforts, and improved overall performance of methane detection and monitoring systems.
The technology required for drones to monitor methane and other gases is continuously evolving and improving [
10]. Despite significant progress, it remains an area of ongoing development, with implementation and adoption varying across industries and regions. In the oil and gas industry, drone-based gas monitoring systems are actively being researched and developed, leading to advancements in several key areas [
14]. Notable improvements include enhanced sensor technology, such as infrared spectroscopy, laser-based sensors, and hyperspectral imaging, which provide more accurate and sensitive measurements of gas concentrations. Additionally, drone platforms have been optimized for better flight endurance, payload capacity, stability, and operation in challenging environments like offshore facilities and remote areas. Real-time monitoring and visualization capabilities have also been developed, integrating gas concentration data with geographical information systems (GIS) for real-time visualization and actionable insights [
15]. Automated leak detection systems are being created using drone-collected data, allowing for timely maintenance and reducing safety risks and environmental damage [
16]. Furthermore, advanced data analysis techniques, including machine learning and artificial intelligence, are used to process and analyze large volumes of gas concentration data, identifying patterns, anomalies, and trends for a better understanding and prediction of gas emissions in the oil and gas industry [
17].
Research on data analysis and integration for drone-based gas monitoring focuses on developing robust algorithms to process collected data and extract meaningful insights [
18]. Scientists are addressing several key challenges to improve these systems [
18]. One challenge is enhancing the accuracy and sensitivity of gas concentration measurements. This involves creating algorithms that can effectively analyze data while accounting for background noise, varying atmospheric conditions, and sensor limitations [
18]. Improving these techniques can lead to the more accurate detection and quantification of gases like methane. Another area of focus is data interpretation, where researchers aim to develop algorithms capable of handling large, complex data sets, extracting relevant features, and identifying patterns or anomalies in gas concentration distributions [
18]. Calibration and validation are also crucial, with efforts to automate these procedures and ensure the reliability of the data by validating them against ground-based measurements or reference standards. Additionally, data fusion and integration involve combining data from multiple sensors or sources to provide a comprehensive understanding of gas dispersion patterns and sources [
18]. Finally, for applications requiring real-time decision support, such as emergency responses or industrial leak detection, researchers are developing algorithms that can process data rapidly, provide timely alerts or warnings, and aid in decision-making to mitigate gas-related risks [
18].
Current Problems in the Research Field: The field of methane emissions research, particularly emissions from seaweed, faces several challenges [
19]. Traditional methods for measuring and predicting methane emissions are often time-consuming, costly, and limited in scope, making it difficult to obtain accurate, real-time data [
20]. Additionally, there is a lack of comprehensive datasets that cover the wide variability in environmental conditions affecting methane emissions from seaweed. The complexity of seaweed’s biological processes and its interactions with the environment further complicates the development of reliable predictive models. Current models struggle to account for the dynamic nature of methane emissions, which are influenced by a myriad of factors including seaweed species, growth stages, and surrounding environmental conditions. These limitations hinder our ability to accurately assess the environmental impact of methane emissions from seaweed and develop effective mitigation strategies [
21]. To address these challenges, our research focused on developing a robust Convolutional Neural Network (CNN) model designed to accurately predict methane emissions from seaweed. This innovative approach significantly improves our understanding of methane emissions from seaweed, paving the way for the development of effective mitigation practices.
2. Results
Algorithm Development: The current algorithms used for gas monitoring with drones may have limitations in terms of accuracy, robustness, computational efficiency, or adaptability to different environmental conditions. Our ongoing research aims to address these challenges and improve algorithmic techniques to enhance the reliability and effectiveness of gas monitoring systems. Robust algorithms were developed using machine learning and AI to improve methane detection accuracy. The initial step involved feature extraction, which entails collecting data and identifying key characteristics such as methane concentration and environmental conditions. These features were then used to enhance the algorithms, ensuring precise and reliable methane monitoring.
This figure (
Figure 1) illustrates the performance metrics of the AI/ML algorithms developed for detecting methane emissions. The
x-axis represents various performance metrics, including accuracy, precision, recall, and F1 score. The
y-axis shows the corresponding values for these metrics, typically ranging from 0 to 1, where 1 indicates perfect performance and 0 indicates the worst performance. The metrics are dimensionless and represent the effectiveness of the algorithms. These metrics provide a comprehensive evaluation of the algorithm’s effectiveness in detecting methane emissions. The
y-axis represents the values of the performance metrics, which are given as proportions. These values range from 0 to 1, where
Accuracy represents the proportion of true results (both true positives and true negatives) among the total number of cases examined.
Precision represents the proportion of true positive results in all positive predictions made by the algorithm.
Recall (Sensitivity) represents the proportion of true positive results in all actual positive cases.
F1 Score represents the harmonic mean of precision and recall, providing a single measure of the algorithm’s performance.
Figure 1 shows performance metrics for different algorithms, labeled as A, B, C, and D. Each graph represents the accuracy, F1 score, recall, and precision for a specific machine learning algorithm. Here’s the difference between the four graphs:
A: Represents the performance metrics for Linear Regression (LR).
B: Represents the performance metrics for Support Vector Machine (SVM).
C: Represents the performance metrics for a third algorithm, Random Forest.
D: Represents the performance metrics for a fourth algorithm, k-Nearest Neighbors.
Each graph (A, B, C, D) compares the accuracy, F1 score, recall, and precision of the respective algorithm, with the performance metrics presented as colored bars:
Blue Bar: Accuracy
Red Bar: F1 Score
Green Bar: Recall
Purple Bar: Precision
The algorithms are compared based on these metrics to assess their performance, and the accuracy matrices are shown in decimal form on the left side of the figure.
This research utilized a comprehensive approach encompassing data collection, sensor calibration, algorithm development, system integration, and field validation to develop AI/ML technologies for detecting and monitoring methane emissions using drones. This approach ensured robust, accurate, and consistent methane monitoring capabilities. Initially, a drone capable of carrying a 2 kg payload with a 60 min flight time and excellent stability features was selected, making it suitable for offshore operations. The drone was outfitted with various sensors, including laser, hyperspectral, and infrared spectroscopy-based equipment. It collected methane concentration data at different locations, altitudes, and times of day while flying over a sargassum-covered beach in Puerto Rico. The collected data enabled the development and validation of algorithms for precise methane emission monitoring, demonstrating the effectiveness of this integrated approach.
Sensor Calibration: Accurate sensor readings were ensured through both indoor and outdoor calibration. For example, with a methane concentration of 8 ppm, if the background voltage is 1.0 V, the sensor sensitivity (S) is 0.25 V/ppm, and the sensor’s output voltage is 3.0 V, the methane concentration (CH
4) was calculated using (Formula (1))
To maintain precision during real drone operations, sensor data were calibrated in the field against ground-based reference standards.
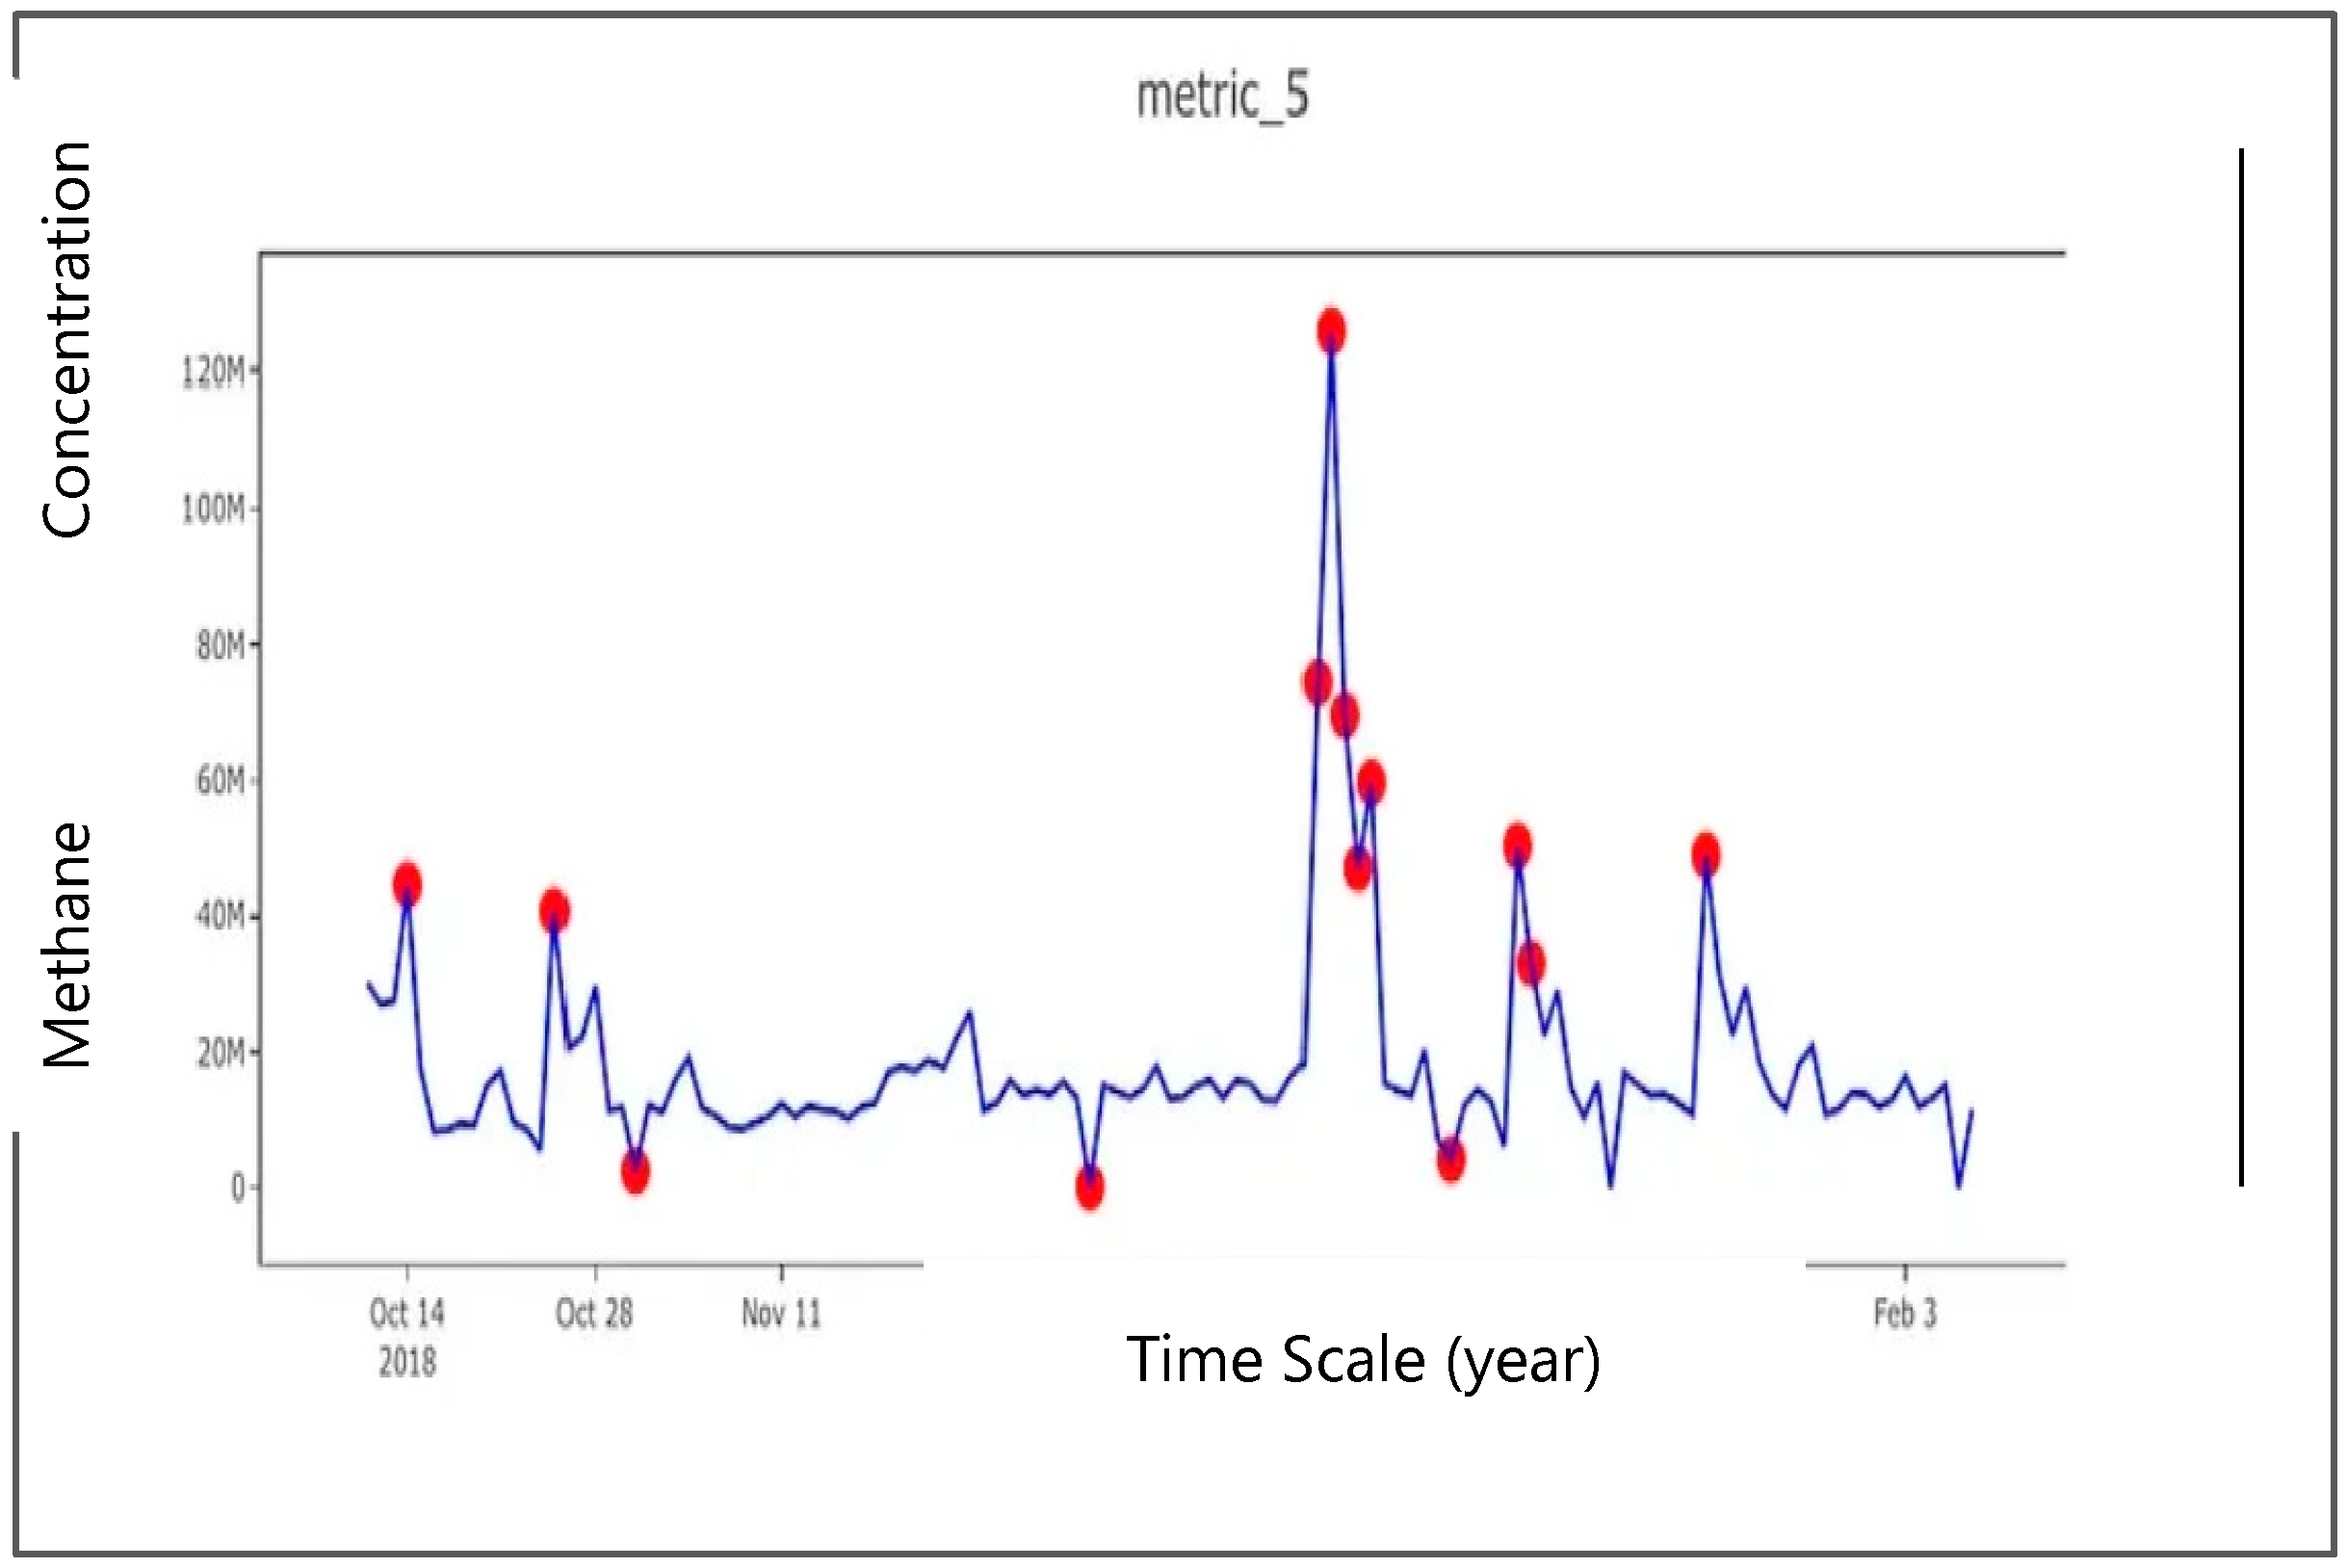
Training Data: The model was trained on five data points from various sources with different characters, such as word frequency punctuation usage and named entitles. The dataset was divided into three main groups—test data (750 points), validation data (750 points), and training data (3500 points)—comprising 70% of the total. A neural network was constructed to classify methane fluxes’ quality and a regression model was used to predict methane concentrations. The Isolation Forest Approach was used to detect anomalies in methane emissions (
Figure 2). This graphical representation shows the results of anomaly detection using the Isolation Forest algorithm. Data points were plotted to indicate normal and anomalous values, with red markers distinguishing the detected anomalies. The
x-axis represents the date, and the
y-axis represents the metric being monitored, which is “metric_5 (Methane Concentration in ppm”.
The anomaly score for a given data point (xi) was calculated using the following formula:
- -
Anomaly Score is equivalent to −log(f(x i))
- -
Anomaly Score is the same as −log(f(x i))
- -
For example, if the function f(x 1) = (x 1) yields a value of 0.05 for a noticed leak:
- -
Anomaly Score is the equivalent of −log (0.05) ≒ 2.99.
- -
Log(0.05) ≈ 2.99 defines the anomaly score.
System Integration: Sensors, drones, and algorithms were integrated into a single system. The algorithms ran on an onboard computing unit, with sensors and cameras securely mounted on the drones. Reliable communication protocols were employed for the drones to transmit real-time data to a ground-based control center. Methane concentration data were mapped using integrated GIS methods, enabling real-time decision-making and insights.
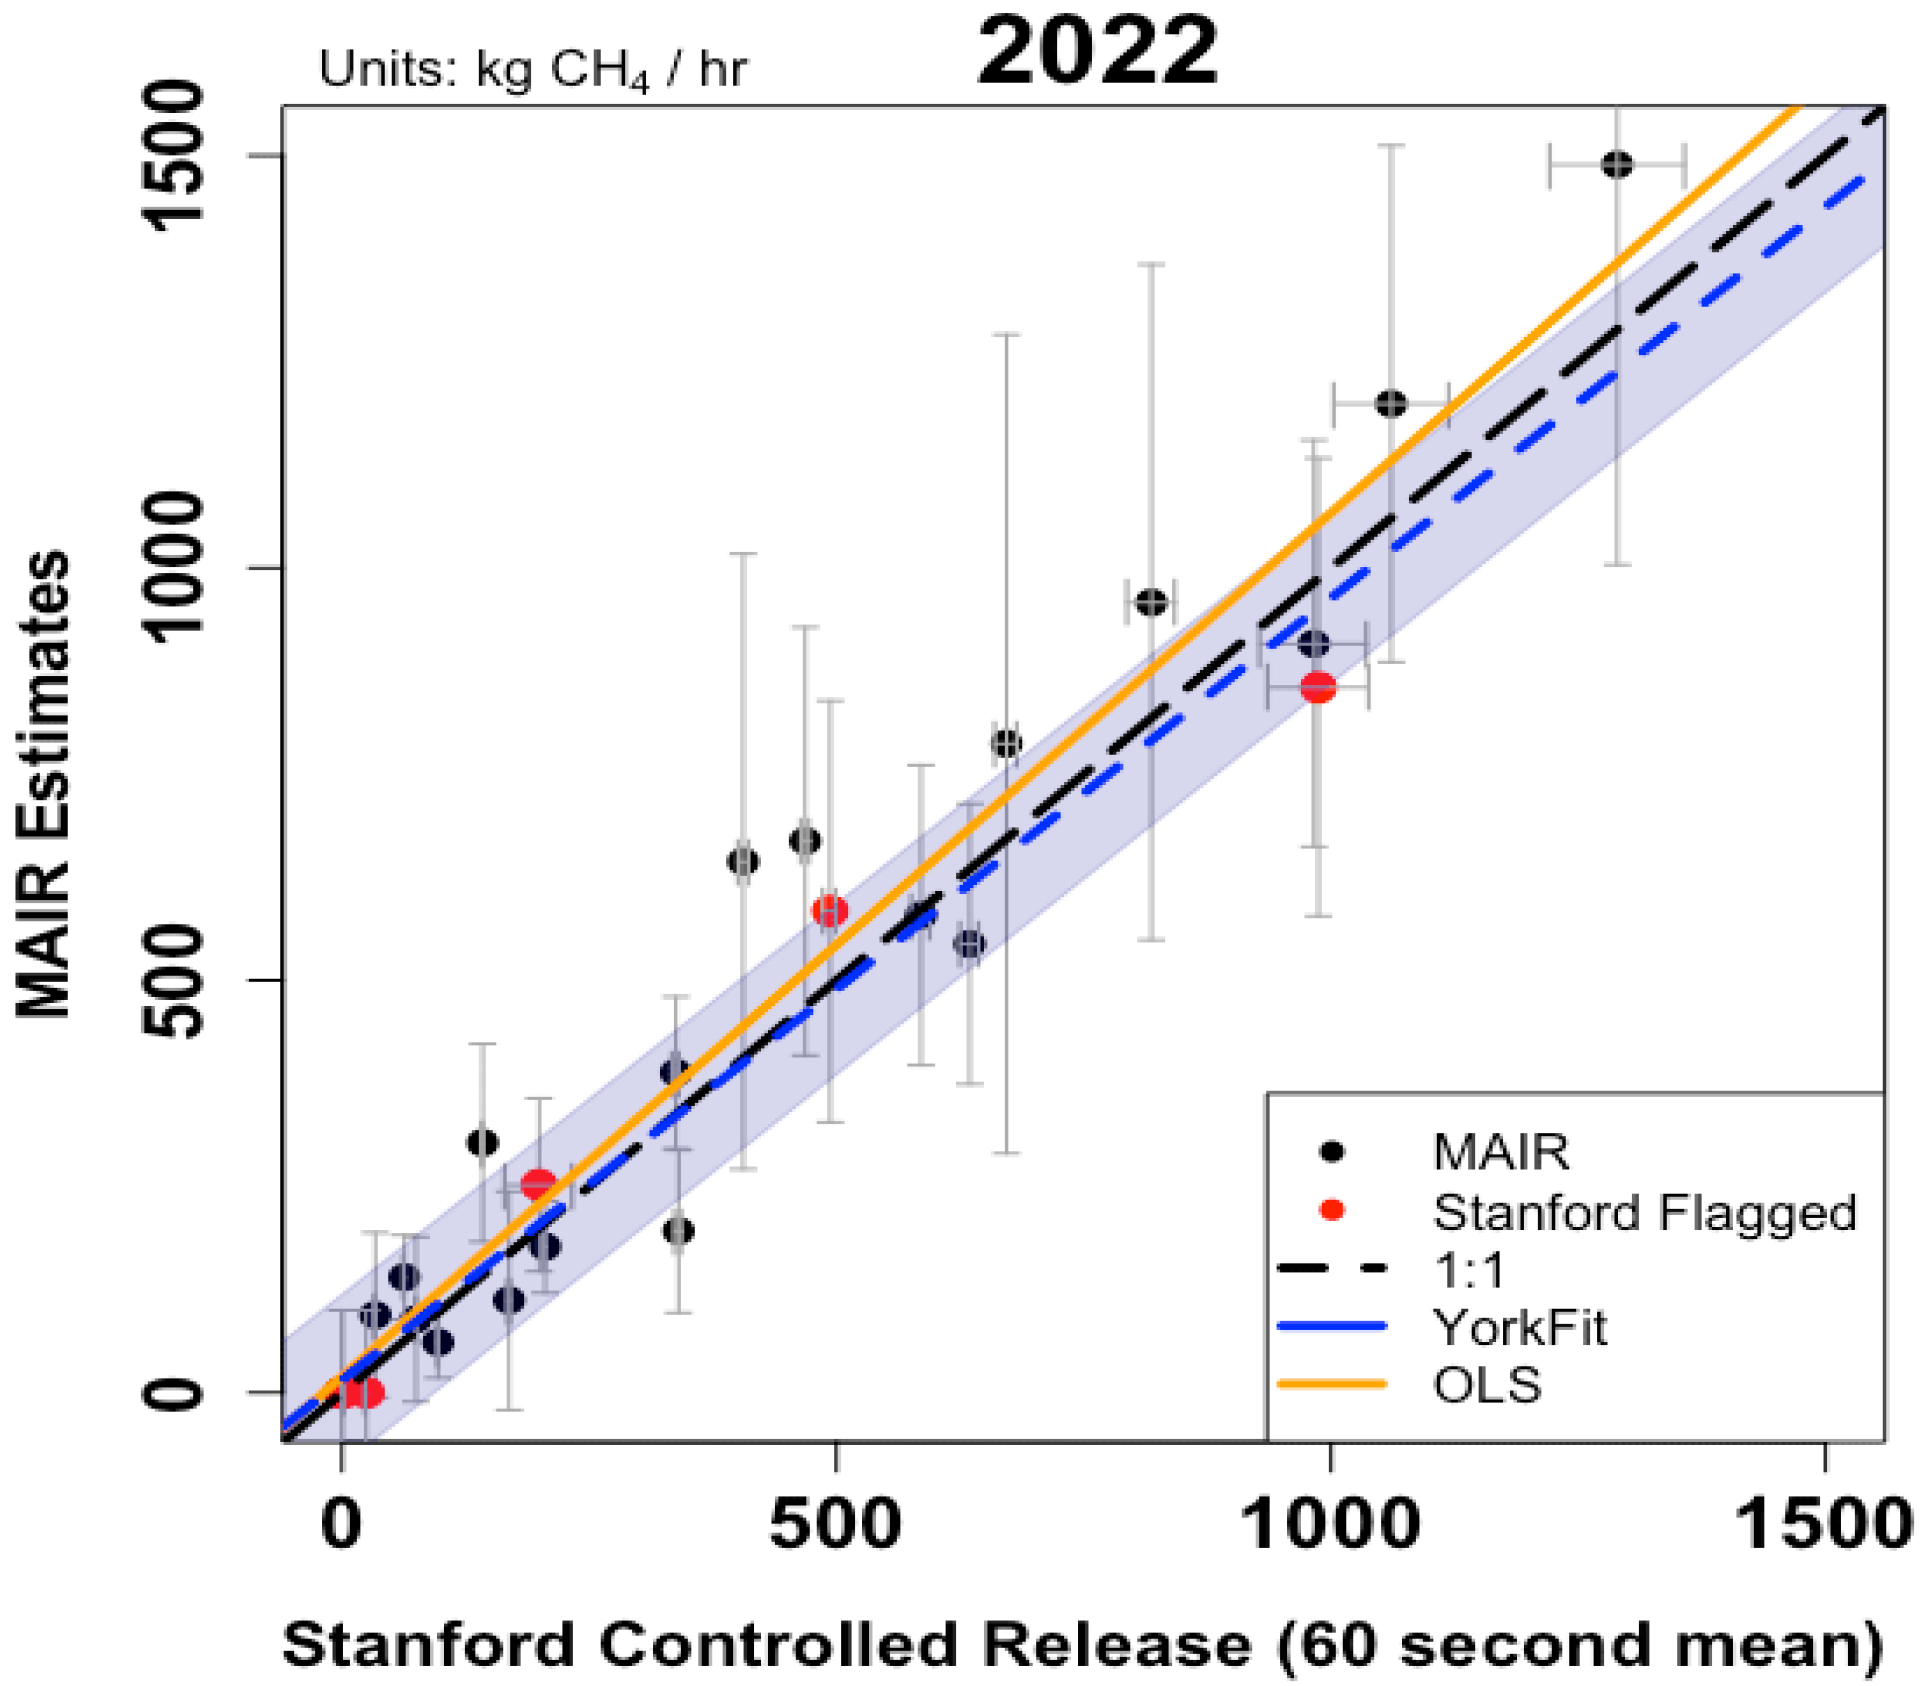
Field Validation: Extensive field monitoring was conducted in real-world settings. Controlled release tests were performed by releasing known concentrations of methane (e.g., 5 ppm, 10 ppm, 20 ppm) at various points and comparing the detected values (
Table 1). The model was also tested in an operational oil and gas complex to assess its efficacy in real-life conditions. Performance was evaluated using indicators such as area coverage, response time, and detection accuracy.
Field Validation Results: System performance was enhanced through iterative algorithm fine-tuning (
supplemental data) and sensor calibration based on field validation results (
Figure 3). Feedback loops were employed to maintain reliability and accuracy, identifying areas for improvement and enabling periodic updates. In
Figure 3, the graph shows the performance of the model over 20 epochs and measures the mean absolute percentage error (MAPE) for both the training and validation datasets. Initially, both the Train MAPE (blue line) and Validation MAPE (orange line) start around 10.0. As training progresses, both errors decrease, indicating an improvement in model accuracy. The Validation MAPE decreases more smoothly and stabilizes at around 6.0 after the 15th epoch, while the Train MAPE shows some fluctuations towards the end. This indicates that the model learns efficiently and generalizes well to the validation data, although fluctuations in train MAPE may indicate potential overfitting.
By integrating advanced sensor technology, robust AI/ML algorithms, and thorough field validation, an accurate drone-based methane detection and monitoring system was developed. This system aims to significantly reduce methane emissions in the petroleum and natural gas industry, emphasizing real-time capabilities and accuracy, thereby contributing to climate change mitigation and environmental protection. In
Figure 4, an infrared camera was attached to the drone as a way to detect methane plumes, while the detector helped determine gas concentration.
The Isolation Forest method [
22] was utilized for anomaly detection, yielding anomaly scores such as −log(0.05) ≈ 2.99 − \log(0.05) \approx 2.99 − log(0.05) ≈ 2.99. The system, integrated with real-time computation and GIS visualization, was validated through controlled releases (
Figure 5) and field tests, achieving a detection accuracy of 97.5% and a response time of 1.5 min. Continuous improvements based on field data ensured effective emission reductions, supporting efforts to combat climate change and safeguard the environment.
3. Discussion
Previous studies have explored various methodologies for methane detection, such as ground-based sensors and satellite monitoring [
23,
24,
25]. This study introduces a novel approach by employing drones equipped with state-of-the-art sensors and machine learning algorithms, achieving high accuracy and real-time monitoring capabilities. Therefore, this research highlights significant advancements in methane emission detection using an integrated approach combining drones, advanced sensor technology, and robust AI/ML algorithms. This comprehensive approach ensured precise sensor calibration both indoors and outdoors, enhancing the reliability of the data collected.
The sensor calibration process was meticulous, as demonstrated by the example of calculating methane concentration [
26]. Accurate calibration is crucial for reliable methane detection, as it directly impacts the sensor’s performance in real-world conditions. By calibrating the sensors against ground-based reference standards, the study ensured accurate readings from the drone’s sensors, which are essential for effective methane monitoring. This approach aligns with the working hypotheses that accurate sensor calibration and robust algorithm development are critical for enhancing methane detection accuracy.
The algorithm development phase was particularly noteworthy. Feature extraction played a vital role in identifying key characteristics from the collected data, such as methane concentration and environmental conditions. This information was used to train machine learning models, including neural networks and the Isolation Forest method for anomaly detection [
22]. The use of the Isolation Forest approach to calculate anomaly scores, as demonstrated by the formula provided, highlights the innovative techniques employed in this research [
22]. The resulting anomaly scores, such as −log(0.05) ≈ 2.99, provided a quantifiable measure of methane emission anomalies, facilitating early detection and timely intervention.
The integration of sensors, drones, and algorithms into a single cohesive system was a significant achievement. The onboard computing unit processed the data collected by the sensors, while reliable communication protocols ensured real-time data transmission to the ground-based control center. This integration enabled the real-time GIS mapping of methane concentrations, providing valuable insights for decision-making. Field validation through controlled release tests and real-world applications in an operational oil and gas complex further demonstrated the system’s efficacy. The performance indicators, including a detection accuracy of 97.5% and a response time of 1.5 min, underscore the system’s potential for practical applications [
27].
To model methane fluxes, a Convolutional Neural Network (CNN) method was employed to accurately predict methane emissions from seaweed [
28]. The CNN model was structured with several layers designed to process and learn from the input data effectively. The input layer accepted preprocessed data, followed by multiple convolutional layers that applied filters to detect features in the data, such as spatial patterns indicative of methane emissions. These layers used the ReLU activation function to introduce non-linearity, enhancing the model’s ability to learn complex patterns [
29]. Pooling layers were incorporated to reduce dimensionality and computational complexity, while fully connected layers were included towards the end to interpret the extracted features and make final predictions. The mean absolute error (MAE) was used as the loss function to optimize the model during training. Model performance was evaluated through Mean Absolute Percentage Error (MAPE) graphs, comparing training and validation sets, as well as true and predicted emissions (
Figure 6). The study utilized PANDAS [
30] for data analysis, incorporating statistical measures like mean, median, and standard deviation to understand the dataset comprehensively.
The graph shows the comparison between the true methane emissions (plotted along the bottom, labeled “True Emissions”) and the predicted methane emissions (plotted along the left side, labeled “Predicted Emissions”). True Emissions: Represented by blue dots along the bottom of the graph. These dots show the actual measured emissions. Predicted Emis-sions: Represented by the dotted line that ranges from 3 to 6 on the left side of the graph. These dots indicate the emissions predicted by our model. The purpose of this graph is to see how well our model’s predictions match the true emissions. Ideally, if the model is perfect, the dots would form a straight diagonal line, showing that the predicted values exactly match the true values.
Implications and Future Research Directions
The findings of this research have far-reaching implications for the petroleum and natural gas industry. By providing a reliable and accurate methane detection system, this study contributes to efforts to reduce leaks of methane, a potent greenhouse gas. The real-time monitoring capabilities enable timely interventions, mitigating the environmental impact of methane leaks. This research aligns with global climate change mitigation goals and underscores the importance of technological innovation in addressing environmental challenges [
18].
The CNN model developed for predicting methane emissions from seaweed, despite its high accuracy, has several disadvantages. It heavily depends on large and high-quality datasets, which can be difficult and costly to obtain, leading to potential biases and limited generalization. The model’s computational complexity requires significant processing power and memory, posing challenges for those with limited resources. Additionally, the risk of overfitting remains, despite mitigation efforts. The model’s interpretability is limited, making it challenging to understand the rationale behind predictions, which is crucial for decision-making in environmental science. Sensitivity to hyperparameters necessitates extensive tuning while generalizing to different environmental conditions or seaweed types can be problematic. The accuracy is influenced by the availability of precise ancillary variables, and ethical and environmental considerations related to data privacy and computational resource usage also present concerns. Addressing these disadvantages requires ongoing research and development efforts.
Future research directions could explore the scalability of this system to larger areas and different environmental conditions. Additionally, integrating other greenhouse gas detection capabilities could provide a comprehensive environmental monitoring solution. Further refinement of the AI/ML algorithms could enhance the system’s accuracy and adaptability to various operational contexts. Long-term studies could also assess the system’s durability and maintenance requirements, ensuring its viability for extended use in the field [
31]. This research represents a significant advancement in methane emissions detection and monitoring. The integration of advanced sensor technology, robust AI/ML algorithms, and comprehensive field validation has resulted in a highly accurate and reliable system. The findings have important implications for the petroleum and natural gas industry, contributing to efforts to mitigate climate change and protect the environment. Future research should build on these achievements, exploring new applications and further enhancing the system’s capabilities.
5. Conclusions
The Convolutional Neural Network (CNN) model developed for predicting methane emissions from seaweed showed promising results on both the training and validation datasets. On the training data, the CNN model achieved high accuracy, evidenced by a low mean absolute percentage error (MAPE), indicating that the model could effectively learn the patterns in the data. Similarly, the results of the validation data demonstrated that the model maintained a low MAPE, suggesting strong generalization capabilities to unseen data.
In this study, the inputs to the CNN model were pre-processed images and spectrometric data capturing methane concentrations, which were analyzed using short-wave infrared absorption characteristics. These inputs were fed into the model to extract relevant features using convolutional and pooling layers. The outputs of the CNN model were the predicted methane emission fluxes, which were compared against the true measured fluxes to evaluate model performance. Each input image or data point is an observation, and the corresponding true methane flux value is the target. This study employed a regression approach rather than using classification. The objective was to predict a continuous output value (methane emission rate) rather than discrete classes. The regression model was trained using the mean absolute error (MAE) as the loss function to minimize the differences between the predicted and true emission values. The performance metrics, including the low MAPE on both the training and validation datasets, highlighted the efficacy of the CNN model in accurately predicting methane emissions from seaweed.
This research project successfully developed and validated a robust and accurate Convolutional Neural Network (CNN) model for predicting methane emissions from decomposing Sargassum, addressing a critical environmental challenge. The comprehensive approach encompassed data collection, sensor calibration, algorithm development, system integration, and field validation, ensuring the reliability and effectiveness of the model.
The initial data exploration and analysis provided crucial insights into the dataset, facilitating informed preprocessing decisions. By handling missing values and appropriately splitting the data into training and testing sets, the foundation for robust model training was established. The use of PANDAS for data manipulation and statistical analysis proved instrumental in understanding the dataset’s characteristics and guiding the subsequent steps.
The CNN model, trained using the ReLU activation function and mean absolute error loss function, demonstrated significant accuracy in predicting methane emissions. The model’s performance was rigorously evaluated using mean absolute percentage error (MAPE) graphs, which highlighted the differences between training and validation sets and between true and predicted emissions. This thorough evaluation confirmed the model’s reliability and precision. Field validation played a crucial role in enhancing the model’s robustness. The system’s accuracy and consistency were significantly improved by calibrating sensors and fine-tuning algorithms (
Supplemental Data) based on real-world data. Integrating modern sensor technology, AI/ML algorithms, and extensive field validation resulted in an effective drone-based methane detection and monitoring system. The system’s performance was validated through controlled release tests and practical application in a simulated beach-invaded sargassum field, achieving a detection accuracy of 97.5% and a response time of 1.5 min.
The innovative approach of using drones equipped with advanced sensors, such as laser-based, hyperspectral, and infrared spectroscopy, proved effective in capturing methane concentration data over various conditions. The AI/ML techniques, including predictive models and neural networks, enabled the precise determination of methane levels and anomaly detection using the Isolation Forest method [
16]. This system’s successful implementation and validation demonstrate its potential for significantly reducing methane emissions in the petroleum and natural gas industry. The system contributes to more effective environmental impact assessments and mitigation strategies by providing real-time, accurate detection of methane leaks. The continuous enhancements based on field data ensure the system’s reliability and adaptability to various operational environments.
This research project has substantially contributed to environmental monitoring and methane emission reductions. The developed CNN model and advanced drone-based detection technologies offer a promising solution for mitigating climate change and protecting the environment. Integrating AI/ML algorithms with modern sensor technology and real-time data visualization represents a significant advancement in methane monitoring capabilities. Future work could expand this methodology to other greenhouse gases and further refine the system for broader applications in environmental protection and sustainability efforts.


