
Rapid Screening of Methane-Reducing Compounds for Deployment via Water with a Commercial Livestock Supplement Using In Vitro and FTIR-ATR Analyses

 ,
,  , ,
, ,  , ,
, ,  and
and 
Abstract
1. Introduction
2. Results
2.1. FTIR Analysis of Methane-Reducing Compound Solubility/Stability in Aqueous Solution with uPRO
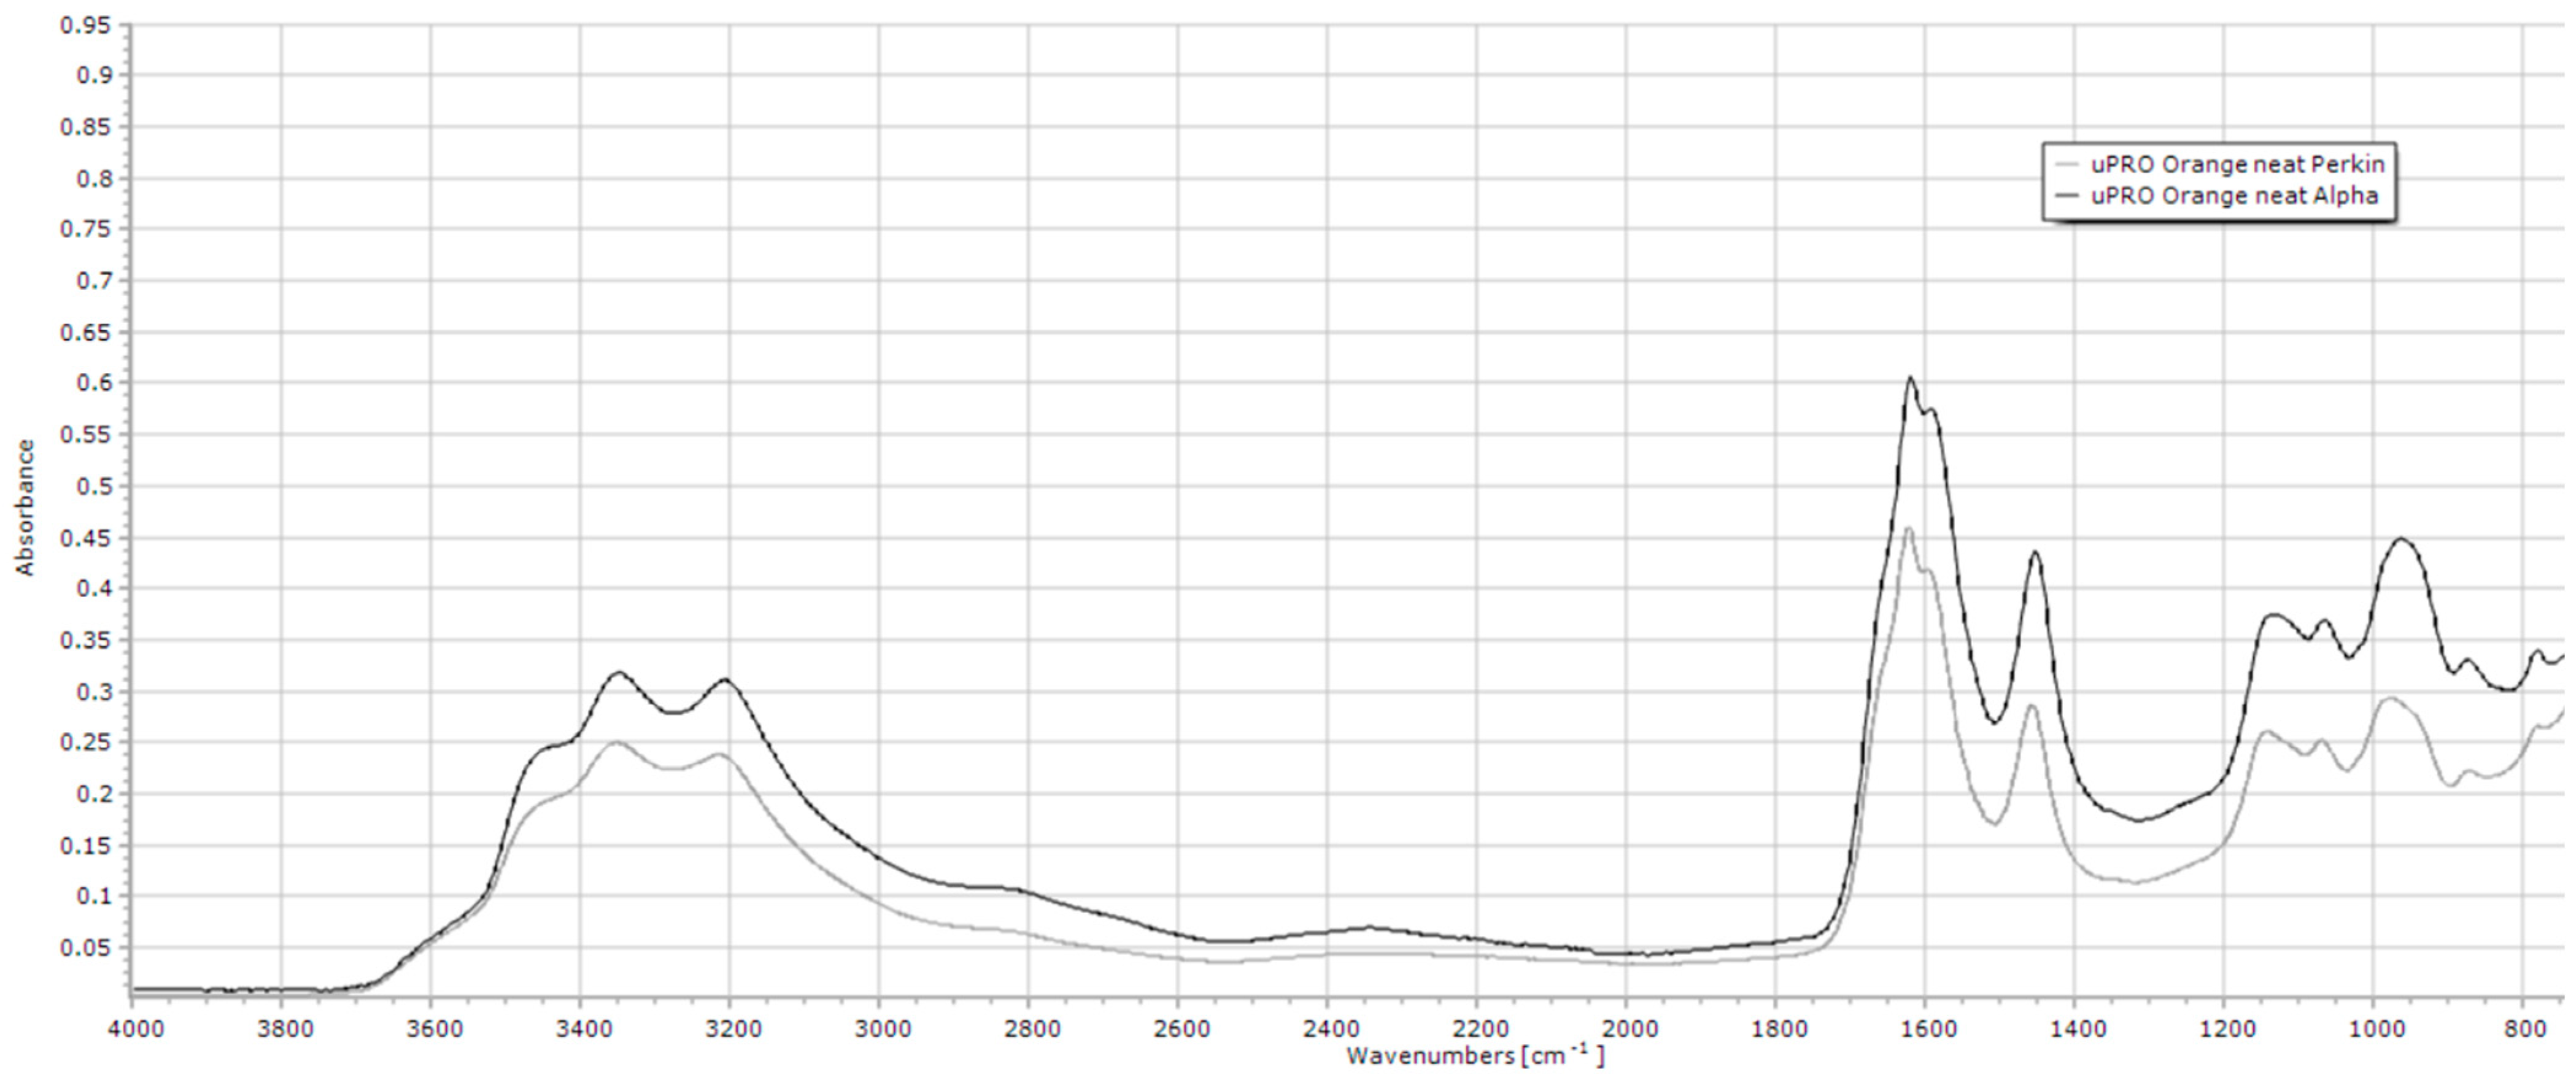
2.1.1. uPRO
2.1.2. Agolin Ruminant L (Agolin)
2.1.3. Beeocitrix+
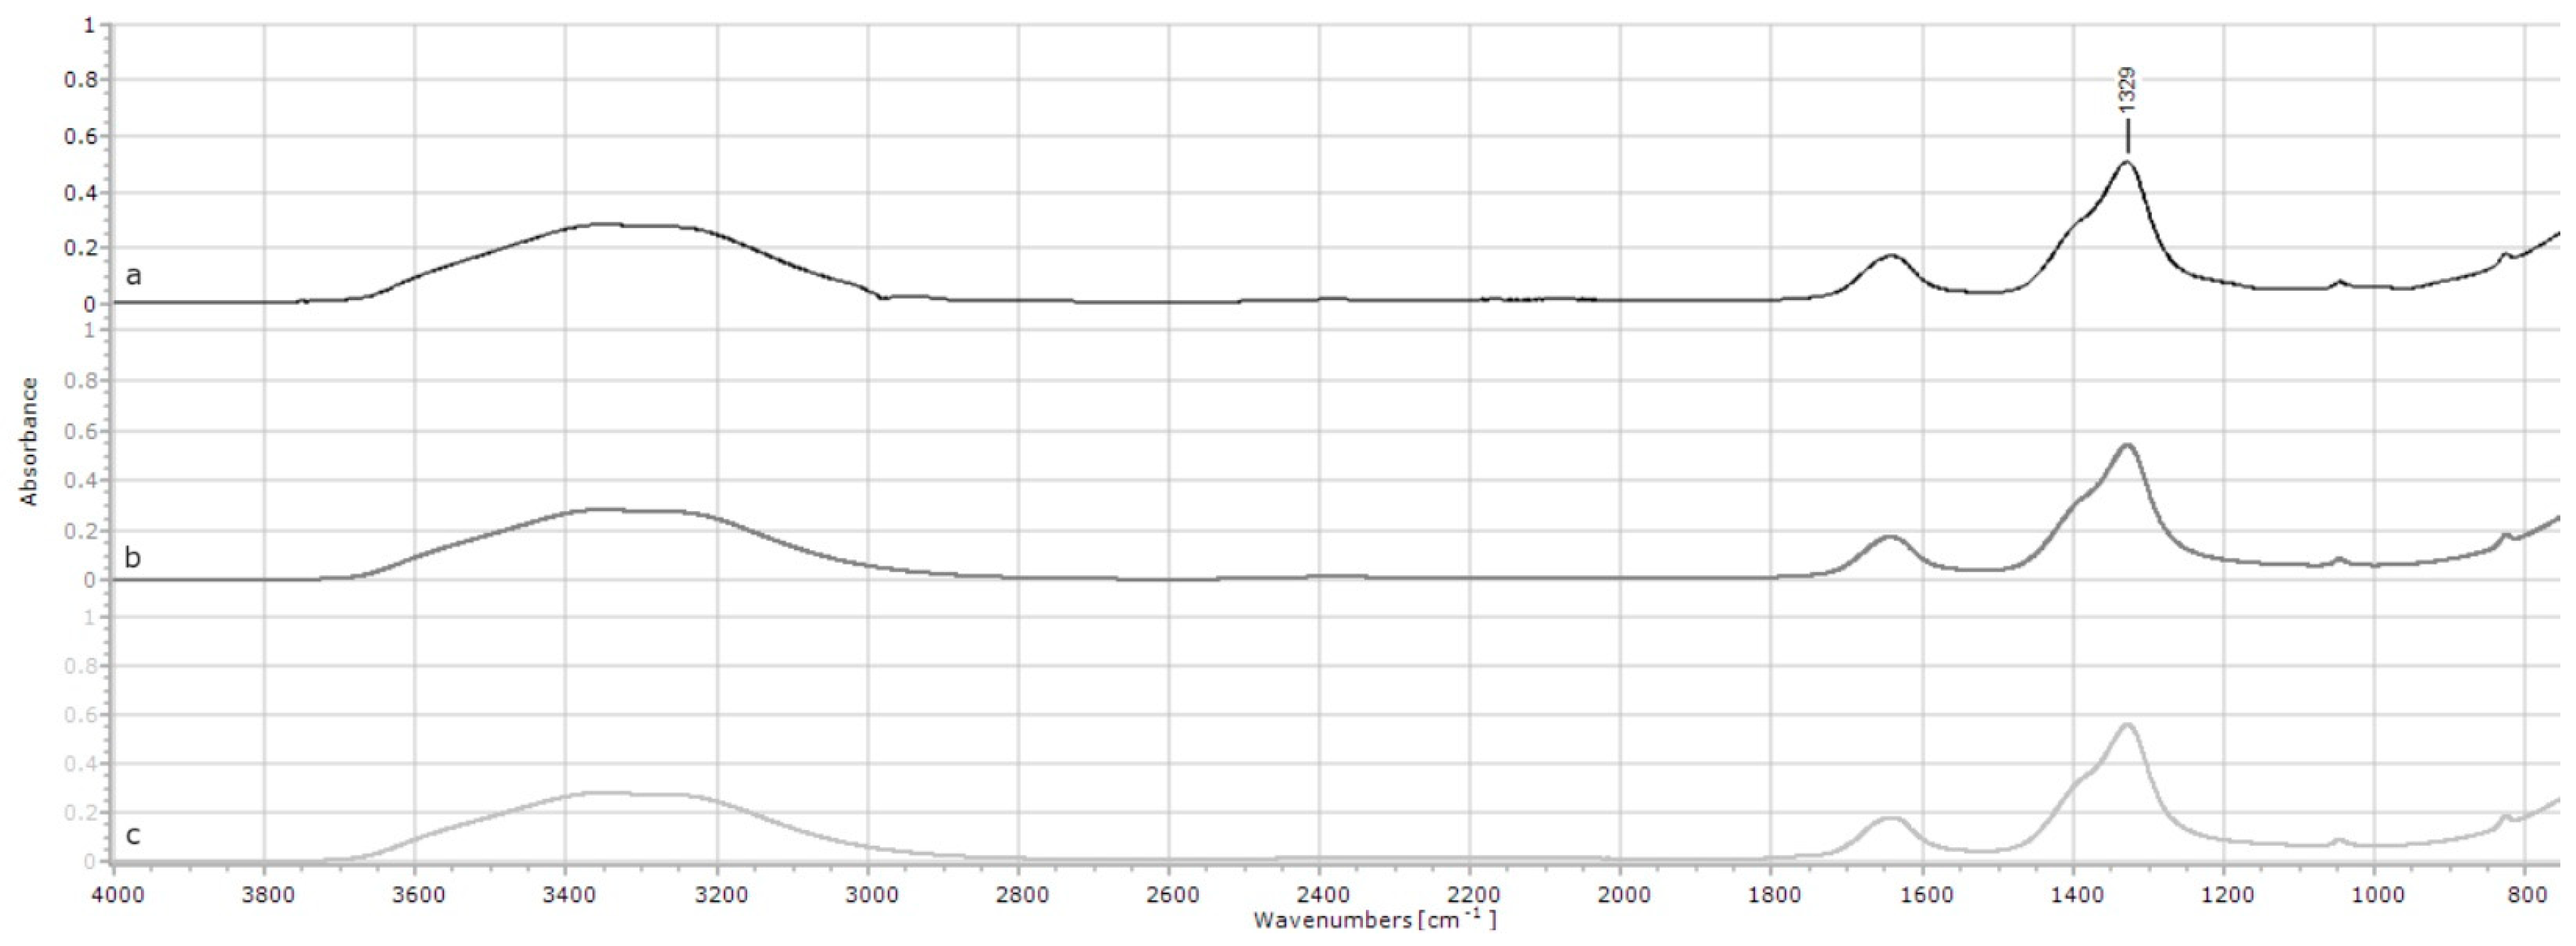
2.1.4. Nitrates
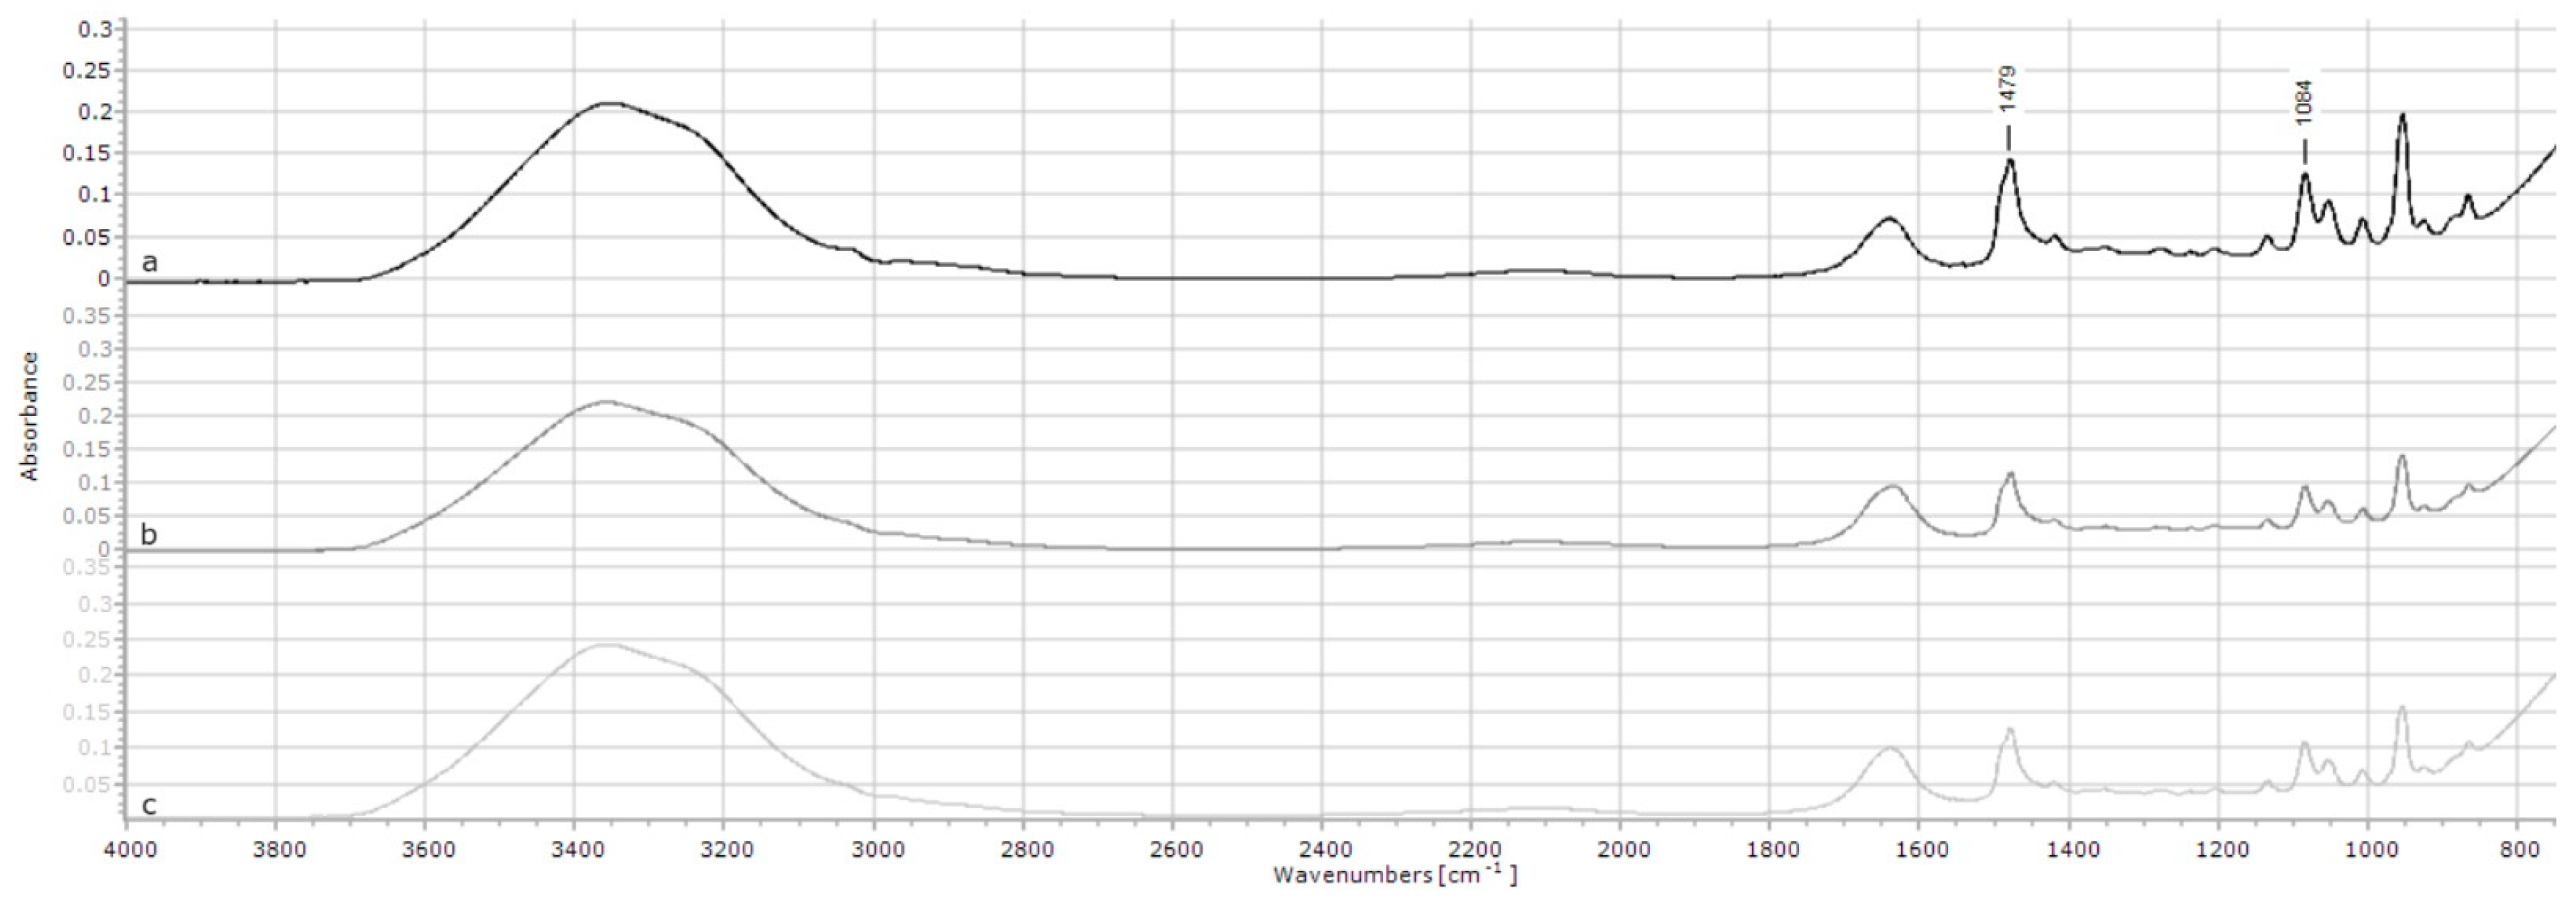
2.1.5. Choline Chloride
2.1.6. Saponin
2.1.7. SilvaFeed
2.1.8. Tartaric Acid
2.2. pH Values of Prepared Solutions
2.3. In Vitro Apparent Dry Matter Digestibility and Gas Production
3. Discussion
3.1. FTIR Analysis
3.2. Water Supplementation of MRCs and In Vitro Analysis
4. Materials and Methods
4.1. uPRO ORANGE® Supplement
4.2. Selected Compounds
4.3. Feed Substrate
4.4. Solubility and Stability Testing Using FTIR-ATR
4.4.1. FTIR Spectroscopy and Measurement of Neat MRC Spectra
4.4.2. FTIR Sample Preparation for Combinations of uPRO and MRC Baselines and Treatments
4.5. pH Values of Prepared Solutions
4.6. Nitrogen Content
4.7. Neutral Detergent Fibre (NDF)
4.8. In Vitro Apparent Digestibility, Total Gas, and Total Methane Assessment
4.8.1. Feed Substrate Preparation
4.8.2. Rumen Collection
4.8.3. In Vitro Fermentation Experimental Design
4.8.4. In Vitro Fermentation Total Gas Production
4.8.5. In Vitro Fermentation Methane Production
4.8.6. In Vitro Apparent Digestibility
4.9. Statistical Analysis
5. Conclusions
6. Patents
Author Contributions
Funding
Institutional Review Board Statement
Informed Consent Statement
Data Availability Statement
Acknowledgments
Conflicts of Interest
Appendix A


References
- Gerber, J.; Steinfeld, H.; Henderson, B.; Mottet, A.; Opio, C.; Dijkman, J.; Tempio, G. Tackling Climate Change through Livestock: A Global Assessment of Emissions and Mitigation Opportunities; Food and Agriculture Organization of the United Nations (FAO): Rome, Italy, 2013. [Google Scholar]
- Beauchemin, K.A.; Ungerfeld, E.M.; Eckard, R.J.; Wang, M. Fifty years of research on rumen methanogenesis: Lessons learned and future challenges for mitigation. Animal 2020, 14, S2–S16. [Google Scholar] [CrossRef] [PubMed]
- Palangi, V.; Lackner, M. Management of enteric methane emissions in ruminants using feed additives: A review. Animals 2022, 12, 3452. [Google Scholar] [CrossRef] [PubMed]
- Króliczewska, B.; Pecka-Kiełb, E.; Bujok, J. Strategies used to reduce methane emissions from ruminants: Controversies and issues. Agriculture 2023, 13, 602. [Google Scholar] [CrossRef]
- Honan, M.; Feng, X.; Tricarico, J.M.; Kebreab, E. Feed additives as a strategic approach to reduce enteric methane production in cattle: Modes of action, effectiveness and safety. Anim. Prod. Sci. 2022, 62, 1303–1317. [Google Scholar] [CrossRef]
- Cortner, O.; Garrett, R.D.; Valentim, J.F. Perceptions of integrated crop-livestock systems for sustainable intensifcation in the Brazilian Amazon. Land. Use Policy 2019, 82, 841–853. [Google Scholar] [CrossRef]
- McAllister, T.A.; Stanford, K.; Chaves, A.V.; Evans, R.; de Souza Figueiredo, E.E.; Ribeiro, G. Nutrition, feeding and management of beef cattle in intensive and extensive production systems. In Animal Agriculture; Academic Press: Cambridge, MA, USA, 2020; pp. 75–98. [Google Scholar]
- Ahlberg, C.M.; Allwardt, K.; Broocks, A.; Bruno, K.; McPhillips, L.; Taylor, A.; Krehbiel, C.R.; Calvo-Lorenzo, M.S.; Richards, C.J.; Place, S.E.; et al. Environmental effects on water intake and water intake prediction in growing beef cattle. J. Anim. Sci. 2018, 96, 4368–4384. [Google Scholar] [CrossRef] [PubMed]
- Romanzini, E.; McCollum, V.; Mcilveen, S.; da Silva, K.D.; de Souza, W.L.; Bernardes, A.; Costa, D.F.A. Drinking Behaviour of Beef Cattle Subject to Water Medication in Various Environmental Conditions. Ruminants 2024, 4, 213–226. [Google Scholar] [CrossRef]
- Storm, E.; Ørskov, E.R. The nutritive value of rumen micro-organisms in ruminants: 1. Large-scale isolation and chemical composition of rumen micro-organisms. Br. J. Nutr. 1983, 50, 463–470. [Google Scholar] [CrossRef]
- Ungerfeld, E.M. Opportunities and hurdles to the adoption and enhanced efficacy of feed additives towards pronounced mitigation of enteric methane emissions from ruminant livestock. Methane 2022, 1, 262–285. [Google Scholar] [CrossRef]
- Johnson, J.B.; Batley, R.J.; Mani, J.S.; Naiker, M. How Low Can It Go? ATR-FTIR Characterization of Compounds Isolated from Ginger at the Nanogram Level. Eng. Proc. 2023, 56, 80. [Google Scholar] [CrossRef]
- Beauchemin, K.A.; Ungerfeld, E.M.; Abdalla, A.L.; Alvarez, C.; Arndt, C.; Becquet, P.; Benchaar, C.; Berndt, A.; Mauricio, R.M.; McAllister, T.A.; et al. Current enteric methane mitigation options. J. Dairy. Sci. 2022, 105, 9297–9326. [Google Scholar] [CrossRef] [PubMed]
- Lee, C.; Beauchemin, K.A. A review of feeding supplementary nitrate to ruminant animals: Nitrate toxicity, methane emissions, and production performance. Can. J. Anim. Sci. 2014, 94, 557–570. [Google Scholar] [CrossRef]
- Manivannan, M.; Rajendran, S. Investigation of inhibitive action of urea-Zn2+ system in the corrosion control of carbon steel in sea water. Int. J. Eng. Sci. Technol. 2011, 3, 8048–8060. [Google Scholar]
- Bi, S.; Barinelli, V.; Sobkowicz, M.J. Degradable controlled release fertilizer composite prepared via extrusion: Fabrication, characterization, and release mechanisms. Polymers 2020, 12, 301. [Google Scholar] [CrossRef] [PubMed]
- Kadam, S.S.; Mesbah, A.; Van der Windt, E.; Kramer, H.J. Rapid online calibration for ATR-FTIR spectroscopy during batch crystallization of ammonium sulphate in a semi-industrial scale crystallizer. Chem. Eng. Res. Des. 2011, 89, 995–1005. [Google Scholar] [CrossRef]
- Ortiz-Tafoya, M.C.; Tecante, A. Physicochemical characterization of sodium stearoyl lactylate (SSL), polyoxyethylene sorbitan monolaurate (Tween 20) and κ-carrageenan. Data Brief. 2018, 19, 642–650. [Google Scholar] [CrossRef] [PubMed]
- Rodríguez-López, M.I.; Mercader-Ros, M.T.; Lucas-Abellán, C.; Pellicer, J.A.; Pérez-Garrido, A.; Pérez-Sánchez, H.; Yáñez-Gascón, M.J.; Gabaldón, J.A.; Núñez-Delicado, E. Comprehensive characterization of linalool-HP-β-cyclodextrin inclusion complexes. Molecules 2020, 25, 5069. [Google Scholar] [CrossRef]
- Jabir, M.S.; Taha, A.A.; Sahib, U.I. Antioxidant activity of linalool. Eng. Technol. J. 2018, 36, 64–67. [Google Scholar] [CrossRef]
- Wany, A.; Kumar, A.; Nallapeta, S.; Jha, S.; Nigam, V.K.; Pandey, D.M. Extraction and characterization of essential oil components based on geraniol and citronellol from Java citronella (Cymbopogon winterianus Jowitt). Plant Growth Regul. 2014, 73, 133–145. [Google Scholar] [CrossRef]
- Makuch, E.; Nowak, A.; Günther, A.; Pełech, R.; Kucharski, Ł.; Duchnik, W.; Klimowicz, A. Enhancement of the antioxidant and skin permeation properties of eugenol by the esterification of eugenol to new derivatives. AMB Express 2020, 10, 1–15. [Google Scholar] [CrossRef]
- Mahapatra, P.; Kumari, A.; Kumar, G.V.; Banerjee, R.; Nag, A. Kinetics of solvent-free geranyl acetate synthesis by Rhizopus oligosporus NRRL 5905 lipase immobilized on to cross-linked silica. Biocatal. Biotransform. 2009, 27, 124–130. [Google Scholar] [CrossRef]
- Baranska, M.; Schulz, H.; Reitzenstein, S.; Uhlemann, U.; Strehle, M.A.; Krüger, H.; Quilitzsch, R.; Foley, W.; Popp, J. Vibrational spectroscopic studies to acquire a quality control method of Eucalyptus essential oils. Biopolymers 2005, 78, 237–248. [Google Scholar] [CrossRef]
- Jia, Z.; Wang, X.; Thevenet, F.; Rousseau, A. Dynamic probing of plasma-catalytic surface processes: Oxidation of toluene on CeO2. Plasma Process. Polym. 2017, 14, 1600114. [Google Scholar] [CrossRef]
- Jovanović, V.; Ristić, I.; Miletić, A.; Cakić, S.; Tanasić, J.; Budinski-Simendić, J. Synthesis of biodegradable polyester based on renewable resources. Bull. Nat. Sci. Res. 2019, 9, 12–18. [Google Scholar] [CrossRef]
- Svečnjak, L.; Marijanović, Z.; Okińczyc, P.; Marek Kuś, P.; Jerković, I. Mediterranean propolis from the adriatic sea islands as a source of natural antioxidants: Comprehensive chemical biodiversity determined by GC-MS, FTIR-ATR, UHPLC-DAD-QqTOF-MS, DPPH and FRAP assay. Antioxidants 2020, 9, 337. [Google Scholar] [CrossRef]
- Li, X.; Dong, J.; Xiao, H.; Lu, Y.; Hu, Y.; Zhang, Y. FTIR-ATR in situ observation on the efflorescence and deliquescence processes of Mg (NO3) 2 aerosols. Sci. China Ser. B Chem. 2008, 51, 128–137. [Google Scholar] [CrossRef]
- Trivedi, M.; Branton, A.; Trivedi, D.; Nayak, G.; Bairwa, K.; Jana, S. Spectroscopic characterization of disodium hydrogen orthophosphate and sodium nitrate after biofield treatment. Chromatogr. Se Technol. 2015, 6, 5. [Google Scholar] [CrossRef]
- Zhu, S.; Li, H.; Zhu, W.; Jiang, W.; Wang, C.; Wu, P.; Zhang, Q.; Li, H. Vibrational analysis and formation mechanism of typical deep eutectic solvents: An experimental and theoretical study. J. Mol. Graph. Model. 2016, 68, 158–175. [Google Scholar] [CrossRef] [PubMed]
- Du, C.; Zhao, B.; Chen, X.B.; Birbilis, N.; Yang, H. Effect of water presence on choline chloride-2urea ionic liquid and coating platings from the hydrated ionic liquid. Sci. Res. 2016, 6, 29225. [Google Scholar] [CrossRef]
- Almutairi, M.S.; Ali, M. Direct detection of saponins in crude extracts of soapnuts by FTIR. Nat. Prod. Res. 2015, 29, 1271–1275. [Google Scholar] [CrossRef]
- dos Santos Grasel, F.; Ferrão, M.F.; Wolf, C.R. Development of methodology for identification the nature of the polyphenolic extracts by FTIR associated with multivariate analysis. Spectrochim Acta Part A Mol. Biomol. Spectrosc. 2016, 153, 94–101. [Google Scholar] [CrossRef] [PubMed]
- Souri, S.M.; Eidi, E.; Kassaee, M.Z. Efficient Suzuki coupling over novel magnetic nanoparticle: Fe3O4/L-(+)-tartaric acid/Pd (0). Mol. Divers. 2023, 27, 1469–1479. [Google Scholar] [CrossRef] [PubMed]
- McLennan, S.R.; Hirst, D.J.; Shepherd, R.K.; McGuigan, K.R. A comparison of various methods of feeding supplements of urea, sulfur and molasses to weaner heifers during the dry season in northern Queensland. Aust. J. Exp. Agric. 1991, 31, 153–158. [Google Scholar] [CrossRef]
- Martins, L.F.; Cueva, S.F.; Lage, C.F.A.; Ramin, M.; Silvestre, T.; Tricarico, J.; Hristov, A.N. A meta-analysis of methane-mitigation potential of feed additives evaluated in vitro. J. Dairy. Sci. 2024, 107, 288–300. [Google Scholar] [CrossRef] [PubMed]
- Tomkins, N.; Parker, A.J.; Hepworth, G.; Callaghan, M.J. Nitrate supplementation has marginal effects on enteric methane production from Bos indicus steers fed Flinders grass (Iseilema s) hay, but elevates blood methaemoglobin concentrations. Anim. Prod. Sci. 2016, 58, 262–270. [Google Scholar] [CrossRef]
- Sirohi, S.K.; Pandey, P.; Goel, N.; Mohini, M.; Kundu, S.S. Effect of tartaric acid addition on rumen fermentation, methane production and digestibility in different diets containing wheat straw in vitro. Online J. Anim. Feed. Res. 2012, 2, 308–313. [Google Scholar]
- Reis, L.G.; Chaves, A.V.; Williams, S.R.O.; Moate, J. Comparison of enantiomers of organic acids for their effects on methane production in vitro. Anim. Prod. Sci. 2014, 54, 1345–1349. [Google Scholar] [CrossRef]
- Battelli, M.; Colombini, S.; Parma, P.; Galassi, G.; Crovetto, G.M.; Spanghero, M.; Pravettoni, D.; Zanzani, S.A.; Manfredi, M.T.; Rapetti, L. In vitro effects of different levels of quebracho and chestnut tannins on rumen methane production, fermentation parameters, and microbiota. Front. Vet. Sci. 2023, 10, 1178288. [Google Scholar] [CrossRef]
- Foggi, G.; Terranova, M.; Conte, G.; Mantino, A.; Amelchanka, S.L.; Kreuzer, M.; Mele, M. In vitro screening of the ruminal methane and ammonia mitigating potential of mixtures of either chestnut or quebracho tannins with blends of essential oils as feed additives. Ital. J. Anim. Sci. 2022, 21, 1520–1532. [Google Scholar] [CrossRef]
- Li, Y.; Kreuzer, M.; Clayssen, Q.; Ebert, M.O.; Ruscheweyh, H.J.; Sunagawa, S.; Kunz, C.; Attwood, G.; Amelchanka, S.; Terranova, M. The rumen microbiome inhibits methane formation through dietary choline supplementation. Sci. Res. 2021, 11, 21761. [Google Scholar] [CrossRef]
- Belanche, A.; Newbold, C.J.; Morgavi, D.; Bach, A.; Zweifel, B.; Yáñez-Ruiz, D.R. A meta-analysis describing the effects of the essential oils blend agolin ruminant on performance, rumen fermentation and methane emissions in dairy cows. Animals 2020, 10, 620. [Google Scholar] [CrossRef] [PubMed]
- Miller, G.A.; Bowen, J.M.; Dewhurst, R.J.; Zweifel, B.; Spengler, K.; Duthie, C.A. Enteric Methane Emissions from Dairy–Beef Steers Supplemented with the Essential Oil Blend Agolin Ruminant. Animals 2023, 13, 1826. [Google Scholar] [CrossRef] [PubMed]
- Carrazco, A.V.; Peterson, C.B.; Zhao, Y.; Pan, Y.; McGlone, J.J.; DePeters, E.J.; Mitloehner, F.M. The impact of essential oil feed supplementation on enteric gas emissions and production parameters from dairy cattle. Sustainability 2020, 12, 10347. [Google Scholar] [CrossRef]
- Bach, A.; Elcoso, G.; Escartín, M.; Spengler, K.; Jouve, A. Modulation of milking performance, methane emissions, and rumen microbiome on dairy cows by dietary supplementation of a blend of essential oils. Animal 2023, 17, 100825. [Google Scholar] [CrossRef] [PubMed]
- Silvestre, T.; Martins, L.F.; Cueva, S.F.; Wasson, D.E.; Stepanchenko, N.; Räisänen, S.E.; Sommai, S.; Hile, M.L.; Hristov, A.N. Lactational performance, rumen fermentation, nutrient use efficiency, enteric methane emissions, and manure greenhouse gas-emitting potential in dairy cows fed a blend of essential oils. J. Dairy Sci. 2023, 106, 7661–7674. [Google Scholar] [CrossRef] [PubMed]
- Batley, R.J.; Johnson, J.B.; Mani, J.S.; Broszczak, D.A.; Naiker, M. Finding alternative uses for Australian rosella (Hibiscus sabdariffa) byproducts: Nutritional potential and in vitro digestibility studies. Anim. Prod. Sci. 2022, 62, 581–589. [Google Scholar] [CrossRef]
- Kinley, R.D.; de Nys, R.; Vucko, M.J.; Machado, L.; Tomkins, N.W. The red macroalgae Asparagopsis taxiformis is a potent natural antimethanogenic that reduces methane production during in vitro fermentation with rumen fluid. Anim. Prod. Sci. 2016, 56, 282–289. [Google Scholar] [CrossRef]

| Compound | Key Peak Wavenumber (cm−1) | Key Peak Wavenumber Absorbances | SEM | p-Value | ||
|---|---|---|---|---|---|---|
| Neat 1 | Baseline 2 | Treatments 3 | ||||
| Agolin | 2925 | 0.12 | 0.12 | 0.13 | 0.01 | <0.001 |
| 2860 | 0.13 | 0.11 | 0.12 | 0.02 | 0.02 | |
| 1730 | 0.06 | 0.05 | 0.06 | 0.02 | 0.02 | |
| 1100 | 0.25 | 0.24 | 0.28 | 0.08 | <0.001 | |
| Calcium nitrate | 1334 | 0.44 | 0.45 | 0.49 | 0.01 | 0.003 |
| Magnesium nitrate | 1329 | 0.51 | 0.55 | 0.56 | 0.12 | 0.046 |
| Potassium nitrate | 1346 | 0.27 | 0.25 | 0.30 | 0.01 | <0.001 |
| Sodium nitrate | 1344 | 0.42 | 0.35 | 0.47 | 0.02 | <0.001 |
| Choline chloride | 1479 | 0.14 | 0.12 | 0.13 | 0.001 | <0.001 |
| 1084 | 0.13 | 0.10 | 0.11 | 0.002 | <0.001 | |
| SilvaFeed | 1612 | 0.14 | 0.23 | 0.24 | 0.01 | 0.044 |
| 1519 | 0.09 | 0.10 | 0.10 | 0.004 | 0.684 | |
| 1450 | 0.11 | 0.15 | 0.15 | 0.004 | 0.885 | |
| Tartaric acid | 1714 | 0.56 | 0.55 | 0.54 | 0.01 | 0.358 |
| 1124 | 0.56 | 0.53 | 0.57 | 0.01 | 0.272 | |
| 1078 | 0.60 | 0.59 | 0.58 | 0.01 | 0.184 | |
| Compound | Final pH (Neutral Water) | Final pH (Neutral Water + uPRO) | Final pH (Water pH 5.5 + uPRO) | Final pH (Water pH 8.5 + uPRO) |
|---|---|---|---|---|
| Agolin | 3.44 | 2.68 | 2.97 | 2.93 |
| Beeocitrix+ | 8.93 | 5.67 | 5.73 | 5.84 |
| Silvafeed | 4.63 | 2.96 | 2.93 | 2.99 |
| Saponin | 4.41 | 2.75 | 2.77 | 2.83 |
| Magnesium nitrate | 5.01 | 2.24 | 2.14 | 2.21 |
| Sodium nitrate | 4.85 | 2.41 | 2.39 | 2.41 |
| Potassium nitrate | 4.98 | 2.64 | 2.64 | 2.65 |
| Calcium nitrate | 5.25 | 2.26 | 2.25 | 2.28 |
| Tartaric acid | 2.09 | 1.69 | 1.76 | 1.78 |
| Choline chloride | 6.44 | 2.45 | 2.46 | 2.45 |
| Additive | IVDMD (%) | Variance to Control (%) | p-Value |
|---|---|---|---|
| Choline chloride | 69.07 ± 5.4 | 3.8 | 0.4305 |
| Agolin | 68.52 ± 2.4 | 3.3 | 0.2338 |
| Tartaric acid | 67.80 ± 0.4 | 2.55 | 0.1230 |
| Sodium nitrate | 64.69 ± 0.7 | 0.49 | 0.4559 |
| SilvaFeed | 64.92 ± 1.1 | −0.32 | 0.8168 |
| Calcium nitrate | 31.49 ± 0.4 | −32.7 | 0.0015 |
| Additive | Total Gas Production (mL/g DM) | Variance to Control (mL/g DM) | p-Value |
|---|---|---|---|
| Choline chloride | 185.73 ± 7.1 | 92.9 | 0.0029 |
| SilvaFeed | 80.30 ± 5.9 | −0.32 | 0.0953 |
| Tartaric acid | 87.11 ± 2.8 | −5.7 | 0.1085 |
| Agolin | 72.99 ± 2.5 | −19.9 | 0.0086 |
| Sodium nitrate | 68.09 ± 5.8 | −30.5 | 0.0291 |
| Calcium nitrate | 0.00 ± 2.0 | −104.0 | 0.0012 |
| Additive | Methane Production (mL/g DM) | Variance to Control (mL/g DM) | p-Value |
|---|---|---|---|
| Calcium nitrate | 0.00 ± 0.0 | −10.0 | 0.0646 |
| Sodium nitrate | 5.42 ± 1.3 | −4.6 | 0.2461 |
| Agolin | 8.17 ± 0.1 | −1.5 | 0.3752 |
| SilvaFeed | 9.24 ± 1.7 | −0.4 | 0.8379 |
| Tartaric acid | 9.24 ± 1.7 | 0.2 | 0.8905 |
| Choline chloride | 31.93 ± 2.0 | 22.3 | 0.0075 |
| Additive | Methane: Total Gas | Variance to Control | p-Value |
|---|---|---|---|
| Calcium nitrate | 0.00 ± 0.0 | −10.3 | 0.0790 |
| Sodium nitrate | 7.91 ± 1.2 | −2.3 | 0.5408 |
| Agolin | 11.2 ± 0.2 | 0.8 | 0.6120 |
| Tartaric acid | 11.33 ± 0.7 | 0.9 | 0.5800 |
| SilvaFeed | 11.46 ± 1.3 | 1.1 | 0.5809 |
| Choline chloride | 17.18 ± 0.4 | 6.8 | 0.0391 |
| Variable | Rhodes Grass |
|---|---|
| Dry matter (g/kg) | 951 ± 0.002 |
| Organic matter (g/kg DM) | 931 ± 0.0008 |
| Crude protein (g/kg DM) | 53 ± 0.17 |
| Neutral detergent fibre (% as fed) | 69.9 ± 0.035 |
| Additive | Concentration |
|---|---|
| Nitrates | 100 g/L |
| Agolin | 10 mL/L |
| SilvaFeed | 10 mL/L |
| Choline chloride | 100 g/L |
| Tartaric acid | 100 g/L |
| Additive | Concentration 1 |
|---|---|
| Sodium nitrate | 2 g NO3/L |
| Calcium nitrate | 4 g NO3/L |
| Agolin | 30 mg/L |
| SilvaFeed | 1.7 mL/L |
| Choline chloride | 27.92 g/L |
| Tartaric acid | 15 mg/L |
Disclaimer/Publisher’s Note: The statements, opinions and data contained in all publications are solely those of the individual author(s) and contributor(s) and not of MDPI and/or the editor(s). MDPI and/or the editor(s) disclaim responsibility for any injury to people or property resulting from any ideas, methods, instructions or products referred to in the content. |
© 2024 by the authors. Licensee MDPI, Basel, Switzerland. This article is an open access article distributed under the terms and conditions of the Creative Commons Attribution (CC BY) license (https://creativecommons.org/licenses/by/4.0/).
Share and Cite
Batley, R.J.; Romanzini, E.P.; Johnson, J.B.; de Souza, W.L.; Naiker, M.; Trotter, M.G.; Quigley, S.P.; de Souza Congio, G.F.; Costa, D.F.A. Rapid Screening of Methane-Reducing Compounds for Deployment via Water with a Commercial Livestock Supplement Using In Vitro and FTIR-ATR Analyses. Methane 2024, 3, 437-455. https://doi.org/10.3390/methane3030025
Batley RJ, Romanzini EP, Johnson JB, de Souza WL, Naiker M, Trotter MG, Quigley SP, de Souza Congio GF, Costa DFA. Rapid Screening of Methane-Reducing Compounds for Deployment via Water with a Commercial Livestock Supplement Using In Vitro and FTIR-ATR Analyses. Methane. 2024; 3(3):437-455. https://doi.org/10.3390/methane3030025
Chicago/Turabian StyleBatley, Ryan J., Elieder Prates Romanzini, Joel B. Johnson, William Luiz de Souza, Mani Naiker, Mark G. Trotter, Simon P. Quigley, Guilhermo Francklin de Souza Congio, and Diogo Fleury Azevedo Costa. 2024. "Rapid Screening of Methane-Reducing Compounds for Deployment via Water with a Commercial Livestock Supplement Using In Vitro and FTIR-ATR Analyses" Methane 3, no. 3: 437-455. https://doi.org/10.3390/methane3030025
APA StyleBatley, R. J., Romanzini, E. P., Johnson, J. B., de Souza, W. L., Naiker, M., Trotter, M. G., Quigley, S. P., de Souza Congio, G. F., & Costa, D. F. A. (2024). Rapid Screening of Methane-Reducing Compounds for Deployment via Water with a Commercial Livestock Supplement Using In Vitro and FTIR-ATR Analyses. Methane, 3(3), 437-455. https://doi.org/10.3390/methane3030025