Article

Photoperiod Regulates Aerobic Methane Emissions by Altering Plant Growth and Physiological Processes

Department of Biology, Mount Saint Vincent University, 166 Bedford Highway, Halifax, NS B3M 2J6, Canada
*
Author to whom correspondence should be addressed.
Methane 2024, 3(3), 380-396; https://doi.org/10.3390/methane3030021
Submission received: 28 April 2024 / Revised: 2 June 2024 / Accepted: 17 June 2024 / Published: 28 June 2024

Abstract

:
Previous studies have shown that light quality and quantity affect methane emissions from plants. However, the role of photoperiod in plant-derived methane has not been addressed. We studied the effects of two photoperiods—long-day (16 h light/8 h dark), and short-day (8 h light/16 h dark)—on growth and methane emissions of lettuce (a long-day plant), mung bean (a short-day plant), and tomato (a day-neutral plant) under a temperature regime of 22/18 °C. All species were grown under both light durations. First, seeds were germinated in Petri dishes for one week, then plants were transferred to pots and randomly assigned to one of the two experimental conditions. Under each condition, twelve plants were grown for 21 days; at that time, plant growth and physiological traits, including plant dry mass, growth index, photosynthesis, chlorophyll fluorescence, total chlorophyll, nitrogen balance index, flavonoids, and anthocyanin, were measured. Lettuce plants under the short-day photoperiod had the highest methane emissions. Long-day plants that were exposed to short-day conditions and short-day plants that were exposed to long-day conditions were stressed; day-neutral plants were also stressed under short days (p < 0.05). All three species had decreased total dry mass under short-day conditions, most likely because of decreased photosynthesis and increased transpiration and stomatal conductance. Methane emission was positively correlated with shoot/root mass ratio, nonphotochemical quenching and anthocyanin; but was negatively correlated with stem height, dry mass, photosynthesis, water-use efficiency, total chlorophyll, and flavonoids (p < 0.05). This study revealed that, besides light intensity and quality, light duration can also affect methane emissions from plants.

1. Introduction

Methane (CH4) is a powerful greenhouse gas, contributing to one third of anthropogenic global warming [1]; its atmospheric concentrations reached 1932.23 ppb in December 2023 [2]. Methane has both natural and anthropogenic sources [3] and can be generated under both anaerobic and aerobic conditions [4]. It has been reported that all living organisms can produce methane [5,6]. Aerobically-produced methane in plants was reported for the first time in 2006 [7]. Since its discovery, different precursors have been suggested for aerobically-produced methane in plants; they include pectin [7,8,9], lignin, cellulose [10], epicuticular wax [11], methionine [12] and other amino acids [13,14]. Recently, it was suggested that all living organisms probably have a common mechanism of methane synthesis through the interaction of reactive oxygen species (ROS), iron and methyl donors [5]. Environmental factors that affect plant-derived methane include temperature [7,8,14], ultraviolet-B radiation [11,15,16,17], water [16,18,19], carbon dioxide [18], and light [7,20]. Few studies have investigated the effects of light quality (spectral composition) and quantity (intensity and photoperiod) on methane synthesis in plants [3,14,21]. It has been shown that supplemental blue light [3,21] and lower light intensity with low red/far-red ratio [3] increase methane emission from plants, but higher light intensity decreases it [14]. However, no studies have considered light duration (photoperiod) yet.
Light is an important environmental factor with dual roles in plants: as source of energy for photosynthesis, and as source of information for photomorphogenesis and photoperiodism [22]. Light is crucial for the growth and development of plants [23,24]. Light quality and quantity have a wide array of effects on plant physiological and biochemical processes, and the effects may differ among plant species [25,26]. Light duration can also affect plant growth and development [27,28]. Photoperiodism is considered as one of the complex and important aspects of plant–environment interactions [29]. Plants evolved sensitive mechanisms to measure light duration, and through photoperiod sensing, plants can synchronize developmental processes and alleviate the effects of environmental stresses [30]. Developmental processes, which are affected by photoperiod, can share similar genes and gene regulatory networks [31]. Plant adaptation to the daylength changes are called photoperiodic responses that are regulated by an endogenous timekeeping system, known as circadian clock, and specific signaling pathways [32,33]. Based on photoperiodic response, there are three types of plants: long-day plants in which the response is induced when the photoperiod exceeds the critical daylength, short-day plants in which the response is induced when the photoperiod is shorter than the critical daylength, and day-neutral plants that are independent of photoperiod [34,35]. Different mechanisms are involved in plant responses to photoperiod, including detection of light signal in leaf, entrainment of circadian rhythms, and a mobile signal production that is transmitted throughout the plant [34]. Long days generally increase plant dry mass by promoting leaf expansion and total photosynthetic area [28]. For example, lettuce (Lactuca sativa L.) plants have higher growth when grown under lower photosynthetic photon flux density (PPFD) and longer photoperiods than grown under higher PPFD and shorter photoperiods [36].
Light duration affects plant physiological processes [24,30] and may alter methane emissions from plants. Plants with adaptation to different photoperiod should differ in methane emissions, but this has not been explored. We, therefore, were interested in examining the effects light duration on methane emissions from plants, using long-day, short-day and day-neutral plants. We hypothesized that exposure of plants that are adapted to a specific photoperiod to a contrasting photoperiod causes stress and leads to increased methane emissions. The objectives of this study were (i) to examine methane emissions from a long-day, a short-day and a day-neutral plant, (ii) to measure growth and physiological traits of these plants, and (iii) to determine the relationship between methane and other plant traits.

2. Results

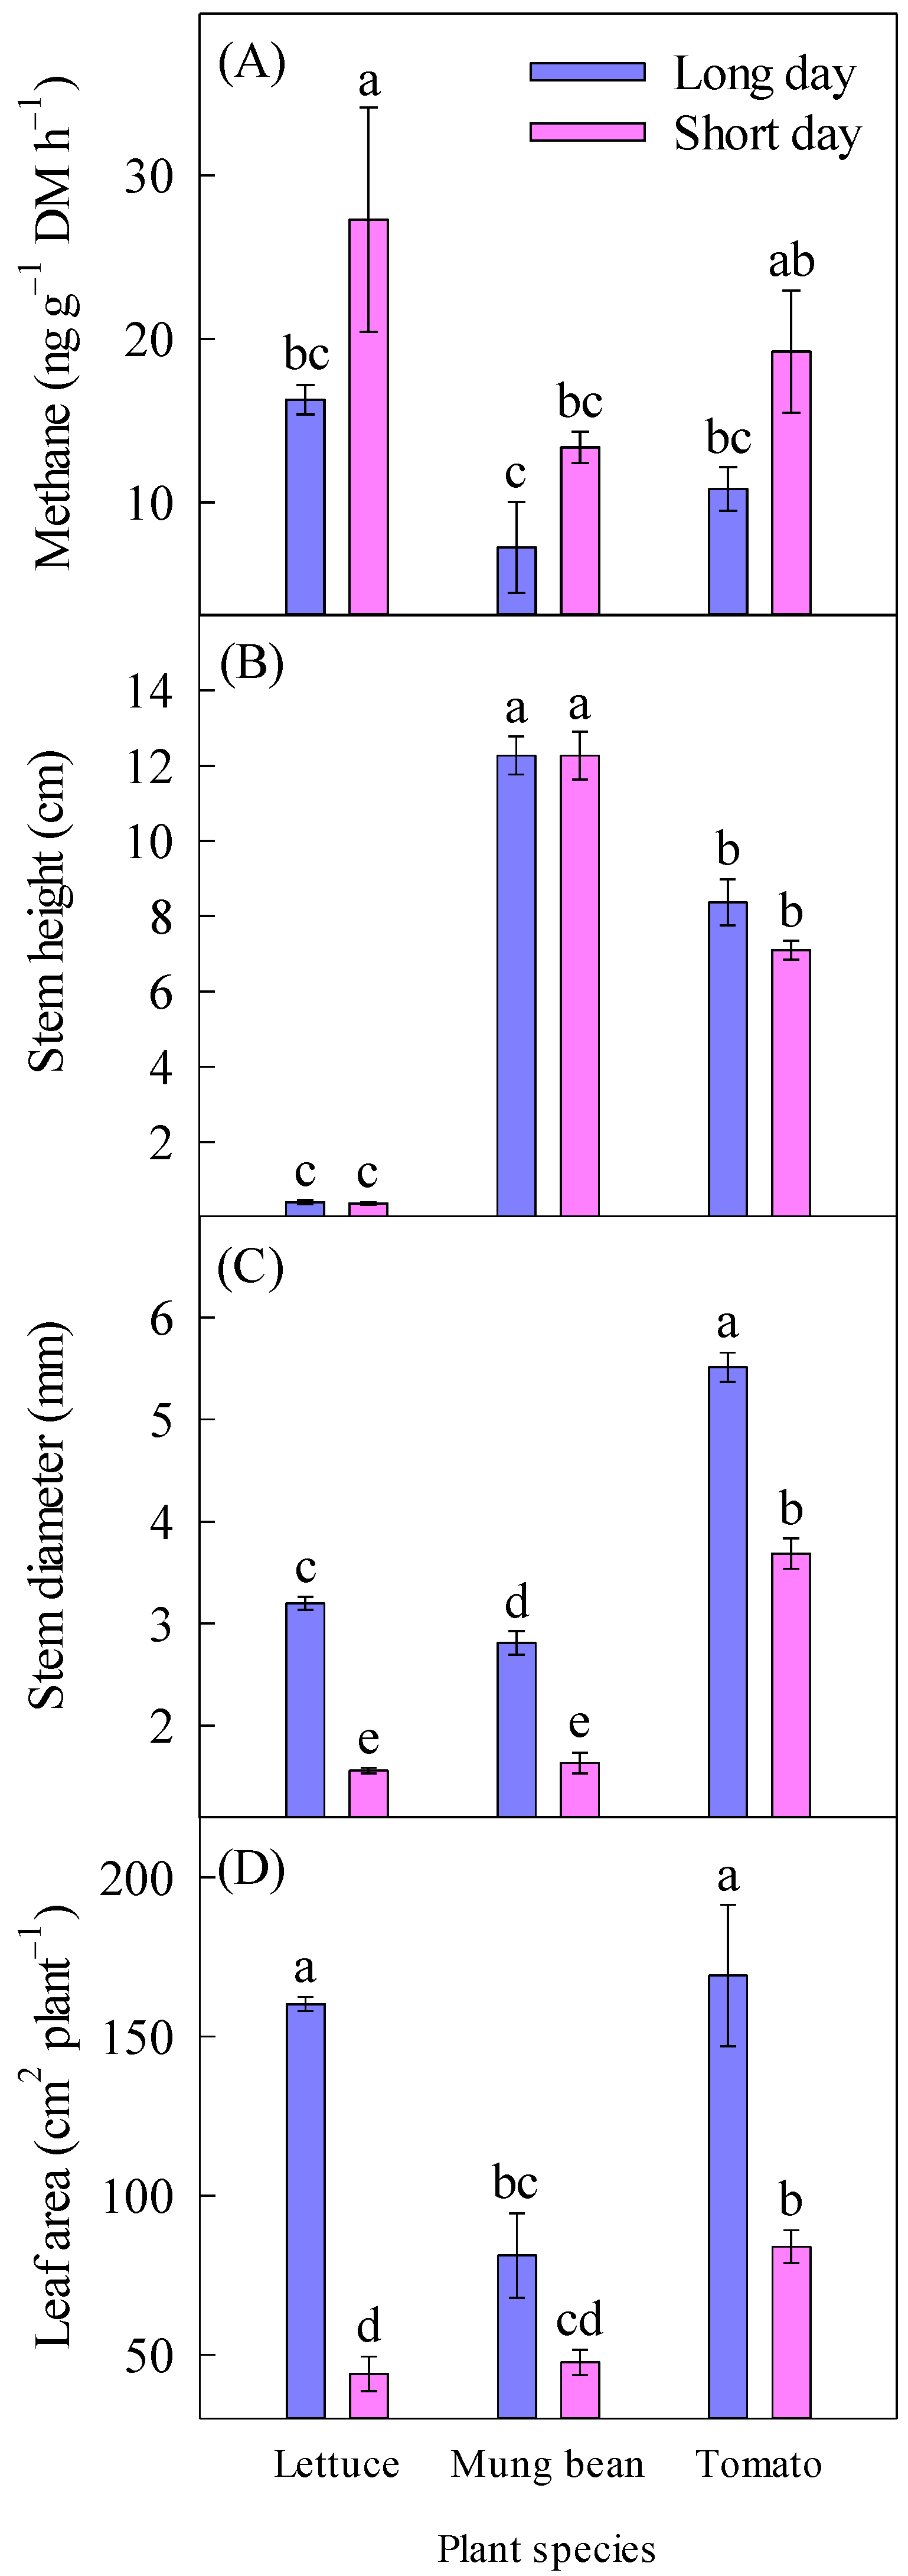
2.1. Methane Emission

Overall, plants under short photoperiod had increased methane emissions, which were highest from lettuce and lowest from mung bean and had a reverse relationship with plant growth (Table 1; Figure 1). Methane emission rates were significantly affected by photoperiod and plant species (p < 0.05; Table 2). Methane emission was highest from the short-day-grown lettuce plants, whereas it was lowest from the long-day-grown mung bean plants (Figure 2).

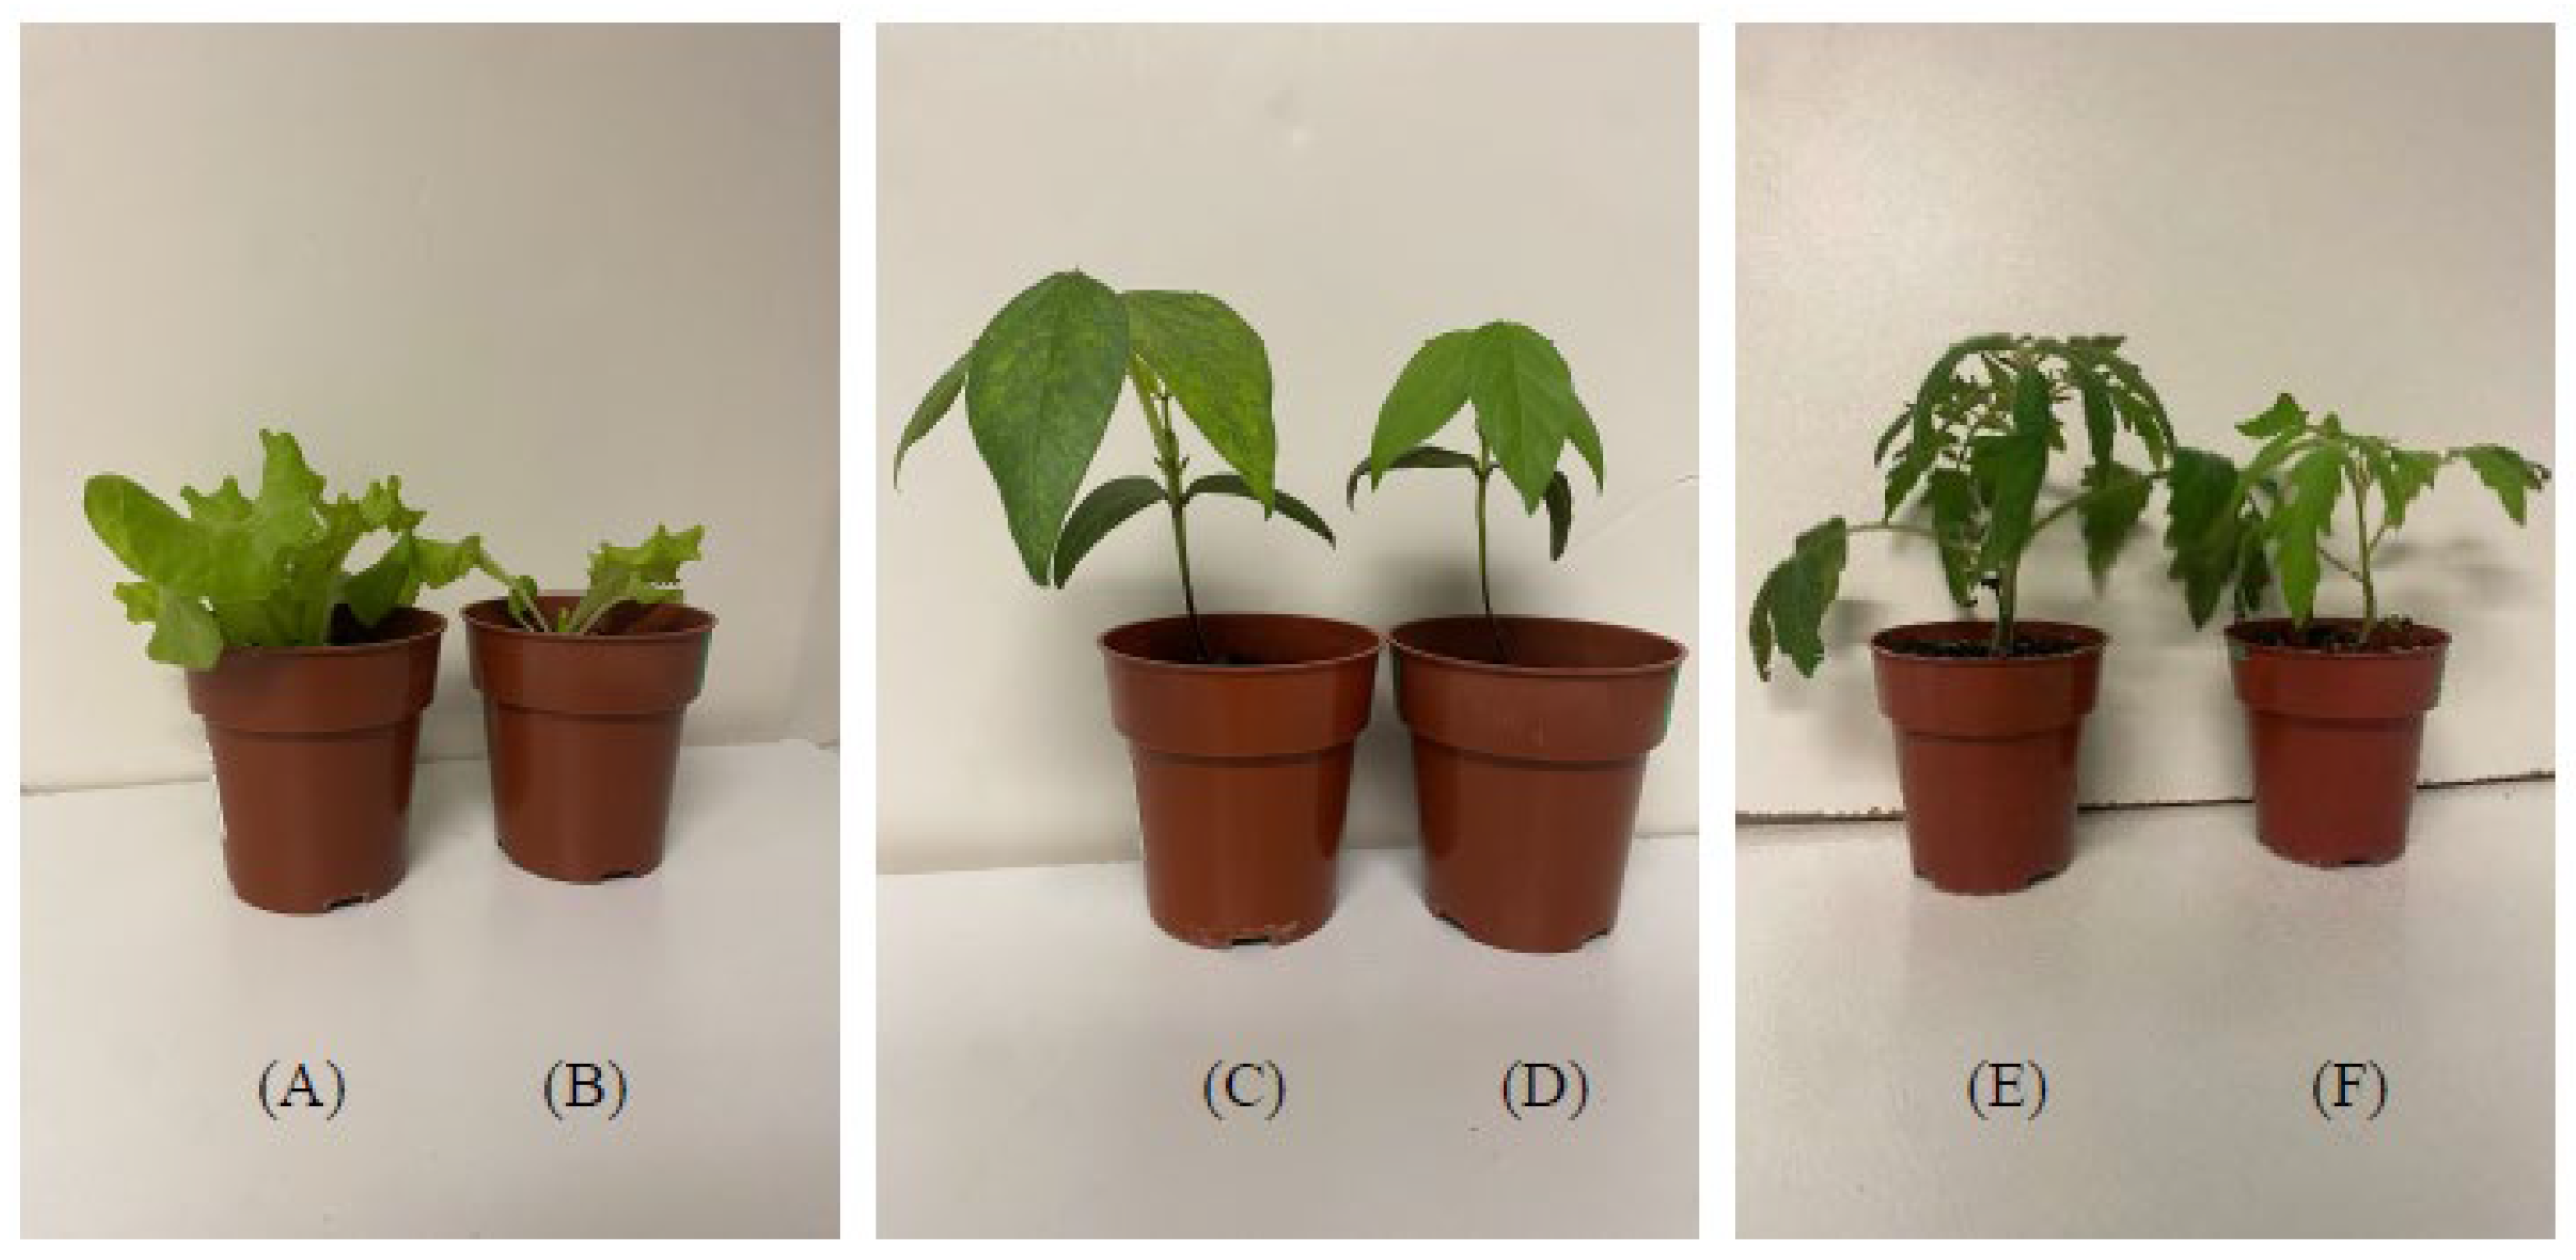
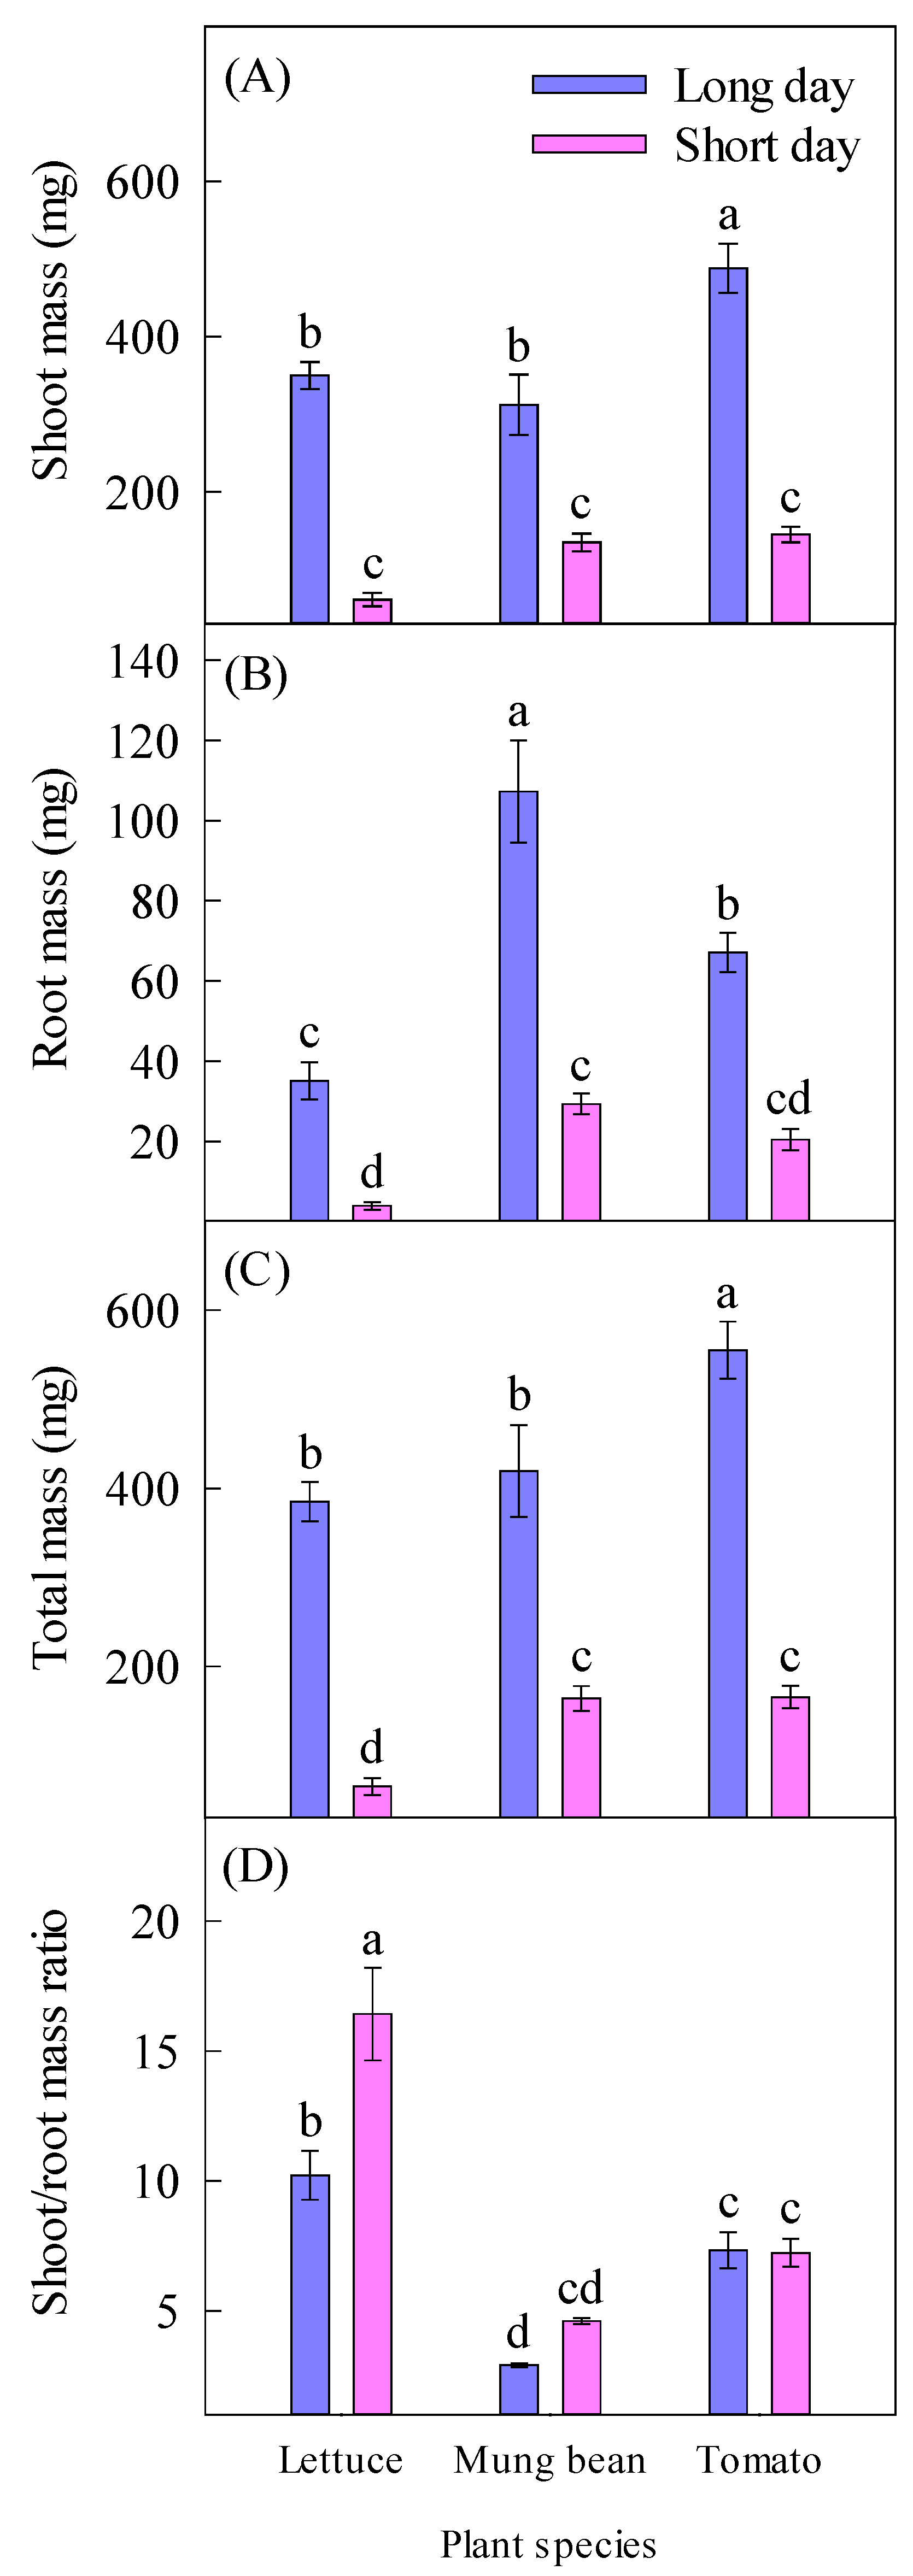
2.2. Plant Growth and Dry Mass
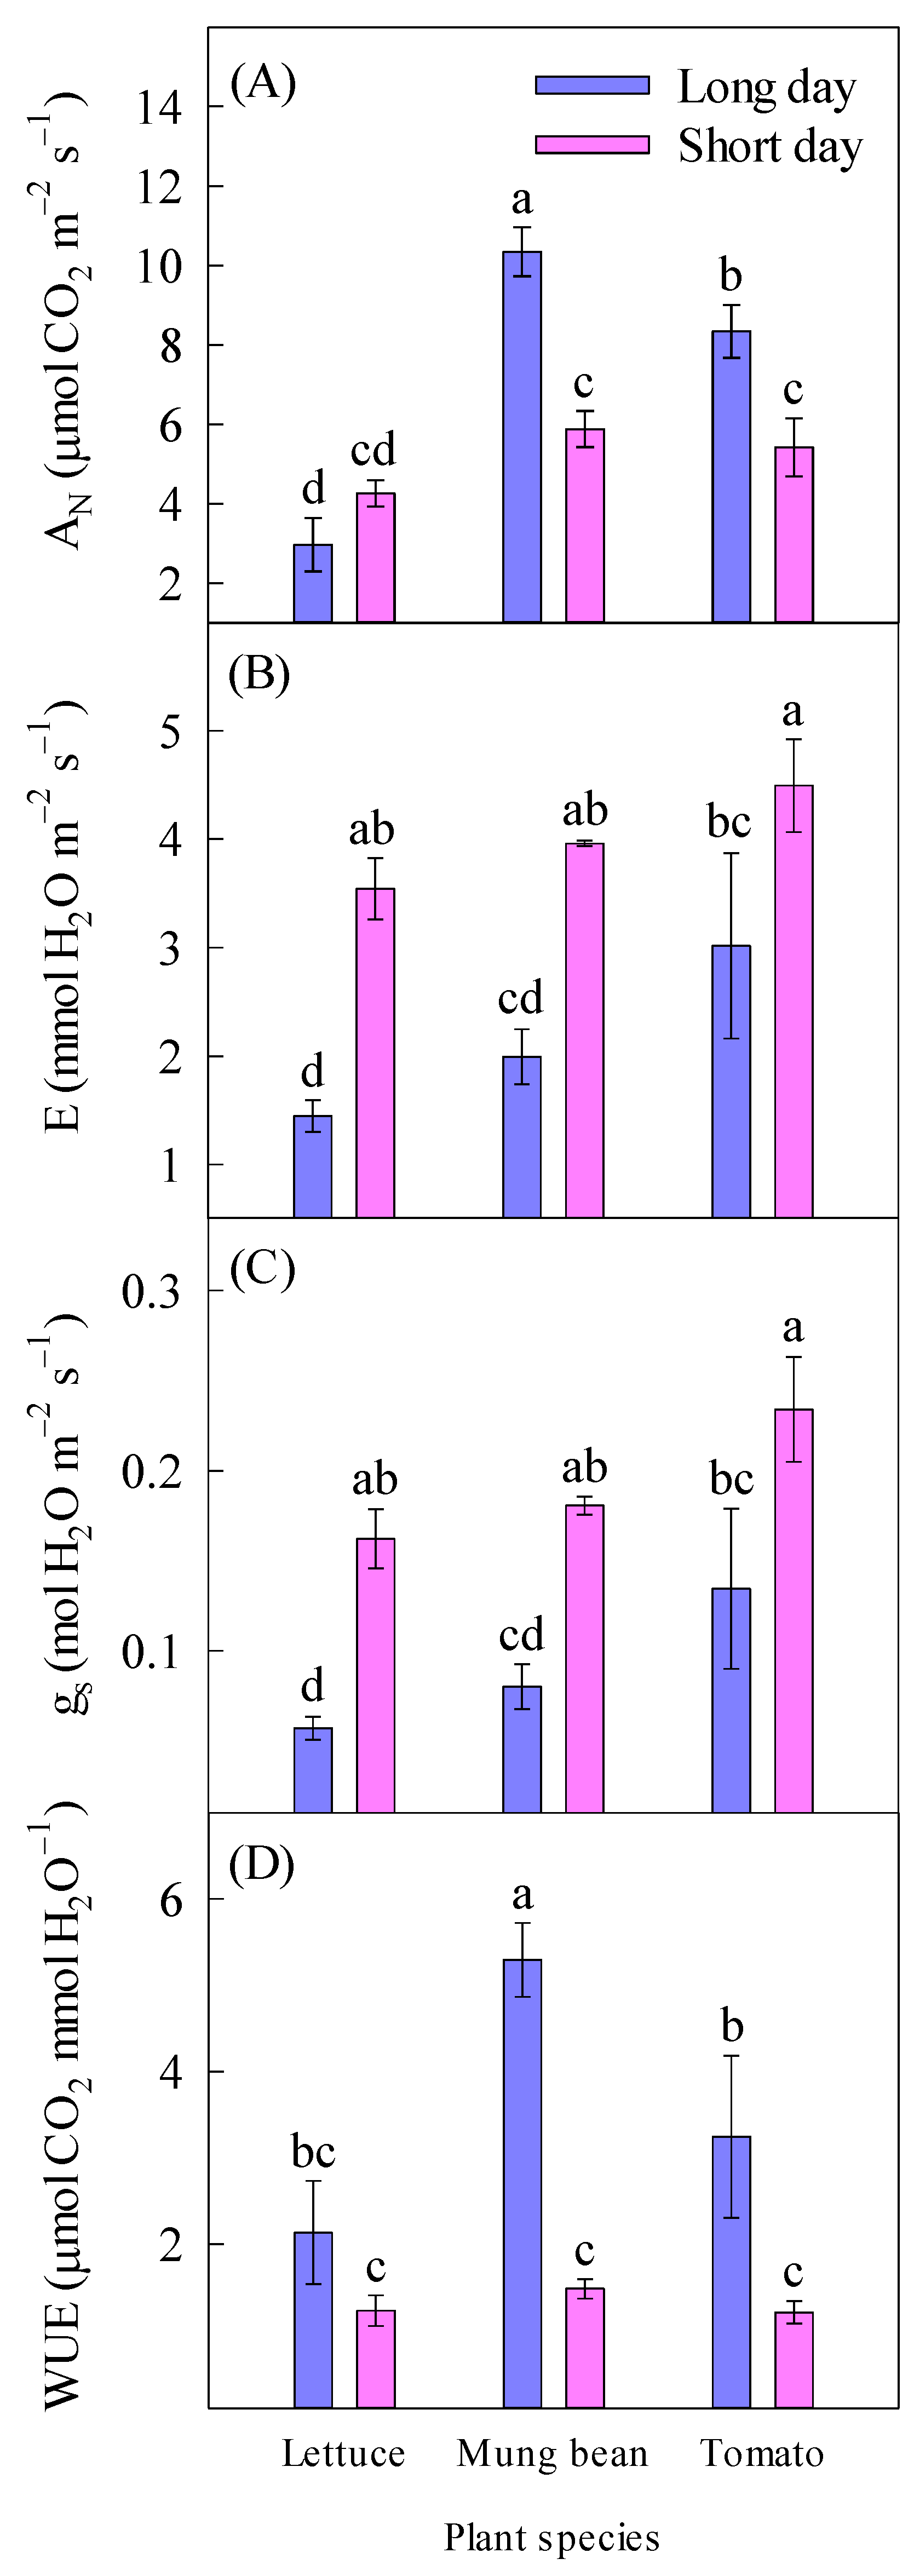
The short-day-grown plants were relatively shorter than the long-day-grown plants, although not significantly. Mung bean plants were tallest followed by tomato and lettuce plants (Table 1; Figure 1). Plant height was significantly affected by species (p < 0.05; Table 2). The mung bean plants were tallest, whereas the lettuce plants were shortest (Figure 2). Plants that were exposed to short light duration had thinner stems compared to plants that were exposed to long light duration. In general, tomato plants had thicker stems than the other two species (Table 1). Stem diameter was significantly affected by light duration, plant species and the interaction of these factors (p < 0.05; Table 2). The long-day-grown tomato plants had thickest stems, whereas the short-day-grown lettuce and mung bean plants had thinnest stems (Figure 2). The short-day-grown plants also had smaller leaves than the long-day-grown plants; tomato plants had largest leaves, but mung bean plants had the smallest leaves (Table 1). Leaf area was significantly affected by light duration, plant species and their interaction (p < 0.05; Table 2). The long-day-grown lettuce and tomato plants had the largest leaves, whereas the short-day-grown lettuce and mung bean plants had the smallest leaves (Figure 2).
Plants that were exposed to short light duration had smaller shoot, root, and total mass. Mung bean plants had the largest root mass, but lettuce plants had the smallest root mass (Table 1). Shoot, root, and total mass were significantly affected by light duration and plant species, and shoot mass by the interaction of these factors (p < 0.05; Table 2). The long-day-grown tomato plants had the largest shoot and total mass, whereas the short-day-grown lettuce plants had the smallest shoot, root, and total mass. However, there were no significant differences in shoot mass among the short-day-grown plants of the three species. The long-day-grown mung bean plants had the largest root mass, whereas the short-day-grown lettuce plants had the smallest root mass (Figure 3).
The short-day-grown plants had relatively higher shoot/root mass ratio compared to the long-day-grown plants, although not significantly. Lettuce plants had the highest shoot/root mass ratio followed by tomato and mung bean (Table 1). Shoot/root mass ratio was significantly affected by light duration, plant species and their interaction (p < 0.05; Table 2). Shoot/root mass ratio was highest in the short-day-grown lettuce plants, but lowest in the long-day-grown mung bean plants; however, no significant difference was found between the long-day-grown and the short-day-grown mung bean plants (Figure 3).

2.3. Gas Exchange

Plants that were exposed to short duration of light had higher transpiration and stomatal conductance, but lower water-use efficiency, and relatively lower net CO2 assimilation. Lettuce plants had significantly lower net CO2 assimilation than the other two species (p < 0.05; Table 1). All components of gas exchange were significantly affected by light duration and plant species. Net CO2 assimilation and water-use efficiency were also affected by the interaction of light duration and plant species (p < 0.05; Table 2). Net CO2 assimilation was highest in the long-day-grown mung bean plants, but lowest in the long-day-grown lettuce plants; transpiration and stomatal conductance were highest in the short-day-grown tomato plants, but lowest in the long-day-grown lettuce plants, and water-use efficiency was highest in the long-day-grown mung bean plants, but lowest in the short-day-grown tomato plants. However, the short-day-grown plants of the three species were not significantly different in water-use efficiency (Figure 4).

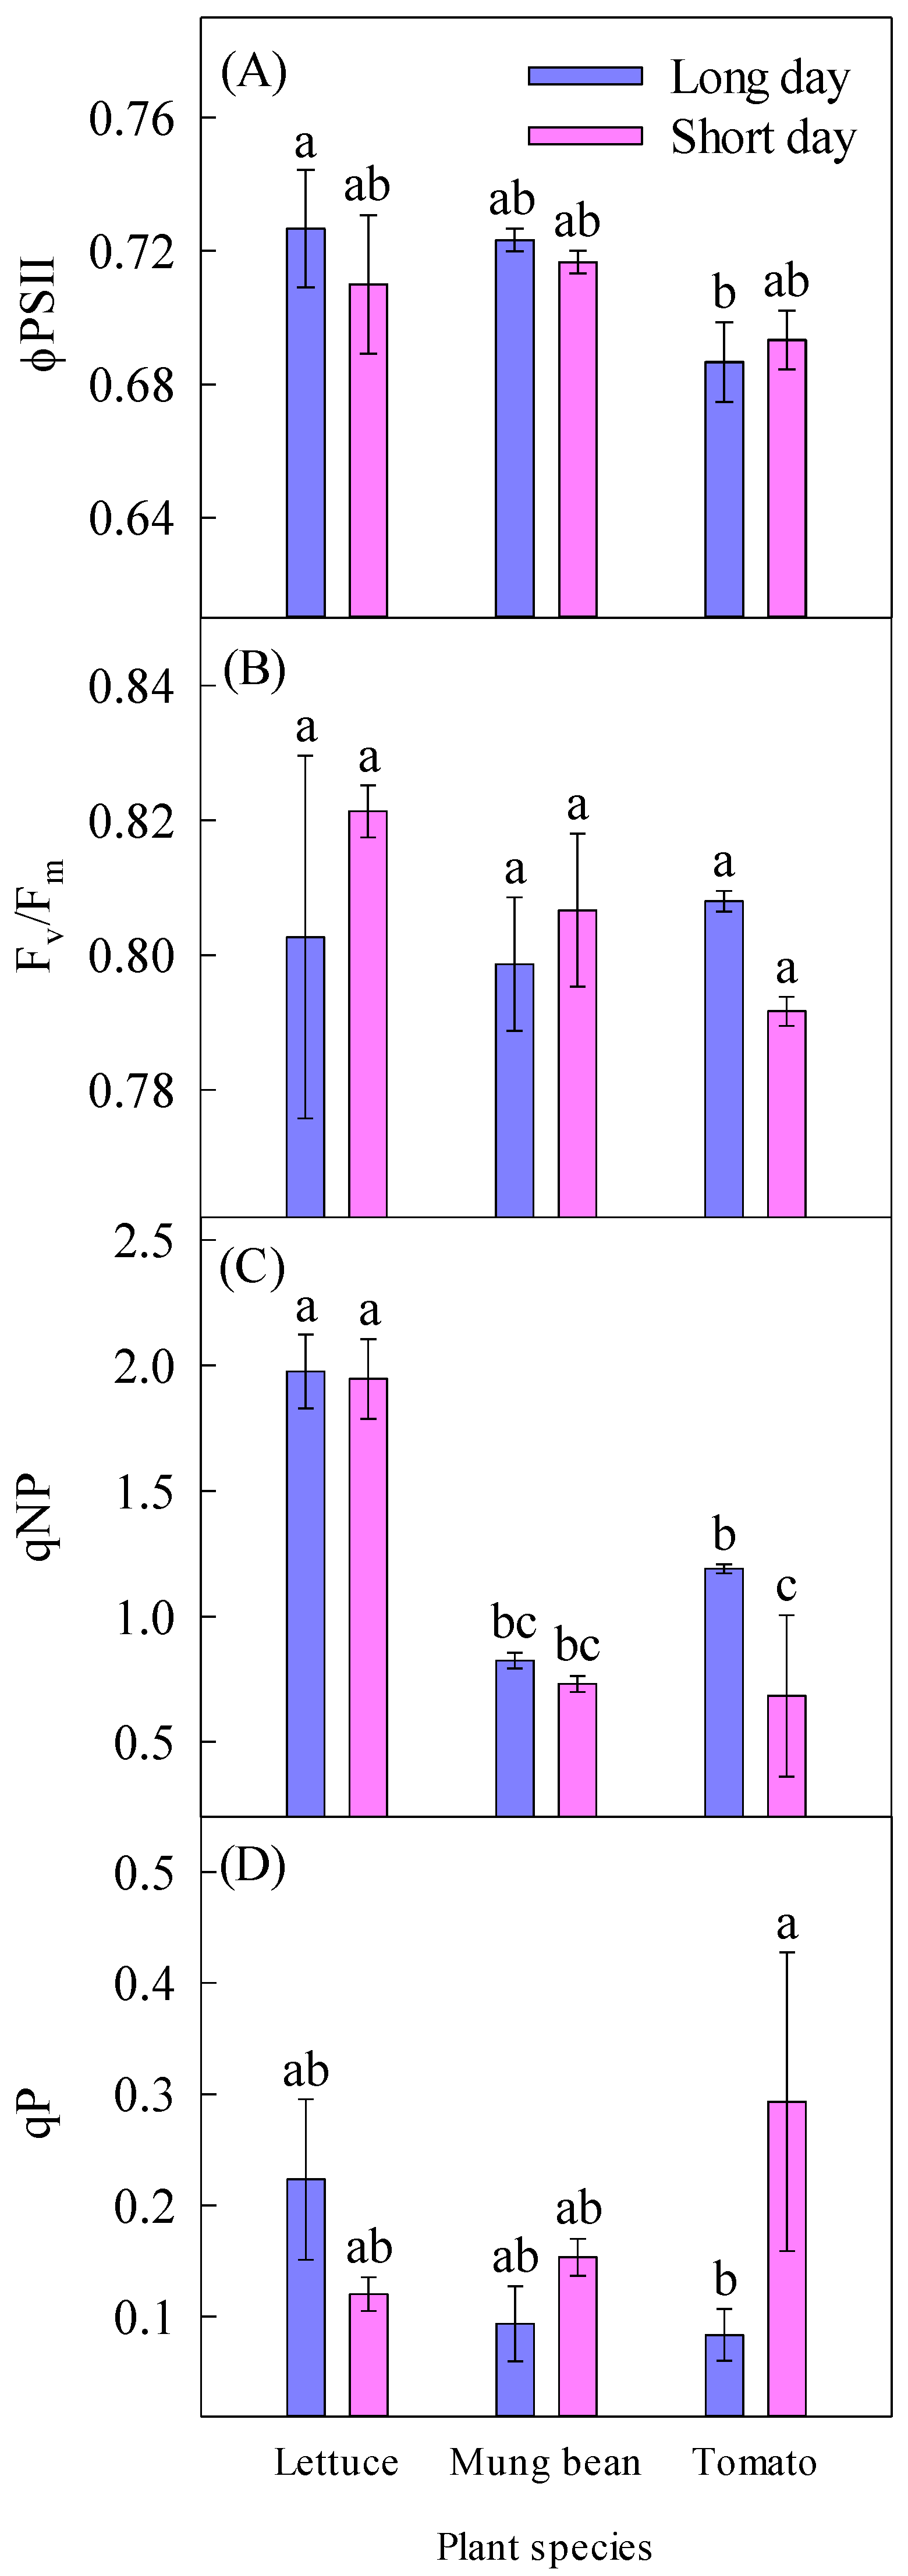
2.4. Chlorophyll Fluorescence

Plants that were exposed to long and short durations of light did not differ in chlorophyll fluorescence. In terms of plant species, tomato plants had lower effective quantum yield of PSII than the other two species, whereas lettuce plants had higher nonphotochemical quenching than the other species (Table 1). Nonphotochemical quenching, but not other components of chlorophyll fluorescence, was significantly affected by plant species (p < 0.05; Table 2). Effective quantum yield of PSII of the long-day-grown lettuce plants was significantly higher than that of the long-day-grown tomato plants; nonphotochemical quenching was highest in the long-day-grown lettuce plants, but lowest in the short-day-grown tomato plants, although there was no significant difference in nonphotochemical quenching between the long-day grown and the short-day-grown lettuce plants. Photochemical quenching was highest in the short-day-grown tomato plants, but lowest in the long-day-grown plants of the same species; however, the tomato plants did not significantly differ in photochemical quenching from the other two species regardless of light duration (Figure 5).

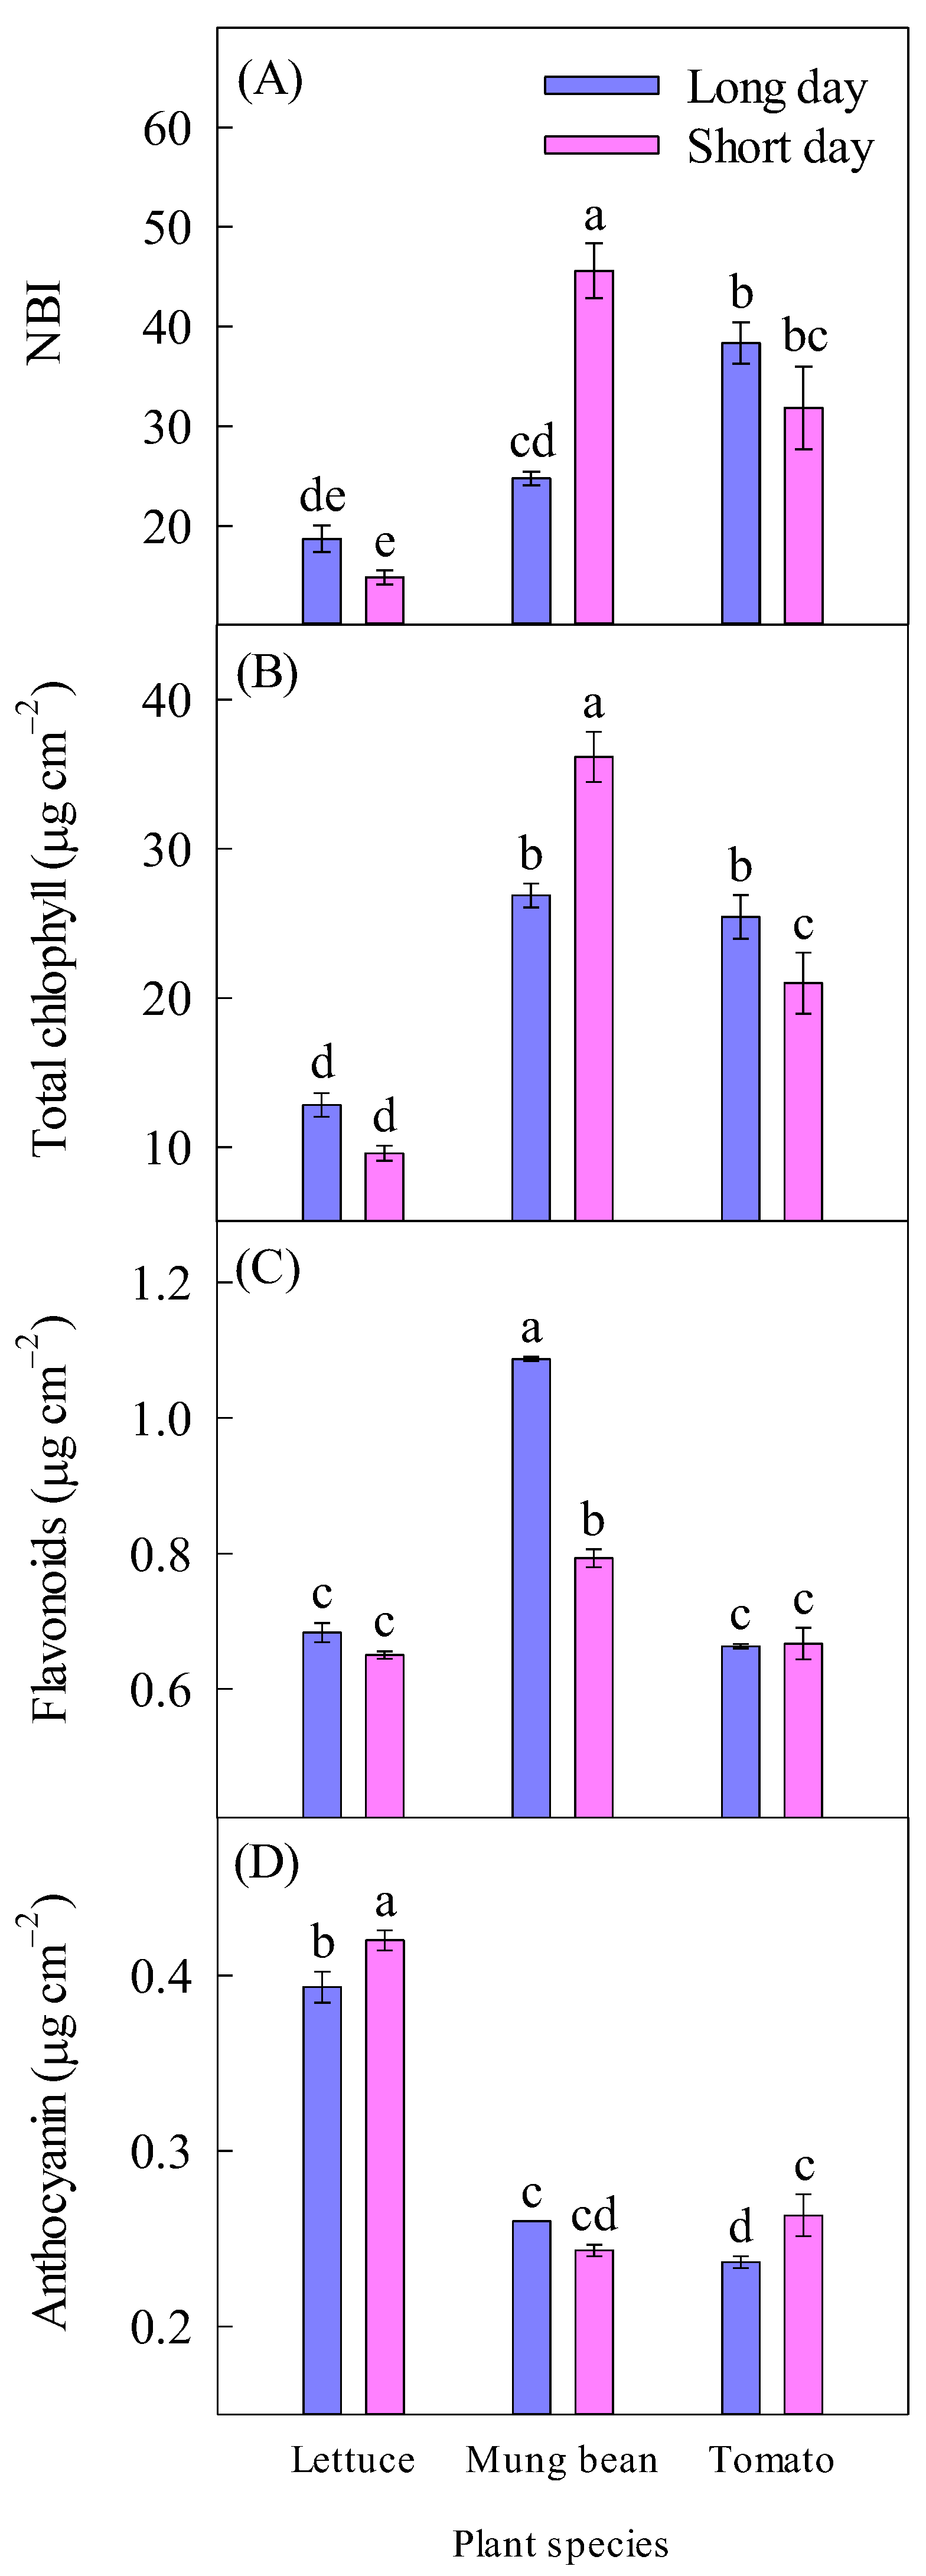
2.5. Nitrogen Balance Index, Chlorophyll, Flavonoids, and Anthocyanin

Plants did not differ in nitrogen balance index, total chlorophyll, flavonoids, and anthocyanin regarding light durations. In terms of plant species, lettuce had lower nitrogen balance index than the other two species; mung bean had highest total chlorophyll followed by tomato and lettuce; mung bean also had higher flavonoids than the other two species, and lettuce had higher anthocyanin compared to mung bean and tomato (Table 1). Nitrogen balance index, total chlorophyll, flavonoids, and anthocyanin were significantly affected by species; flavonoids and anthocyanin were also affected by light duration, and all these traits were significantly affected by the interaction of light duration and species (p < 0.05; Table 2). Nitrogen balance index and total chlorophyll were highest in the short-day-grown mung bean plants, but lowest in the short-day-grown lettuce plants; however, in lettuce, there was no significant difference in nitrogen balance index and total chlorophyll between the two light durations. Flavonoids were highest in the long-day-grown mung bean plants, but lowest in the short-day-grown lettuce plants, although the long-day-grown and the short-day-grown lettuce plants did not differ in flavonoids, and anthocyanin was highest in the short-day-grown lettuce plants, but lowest in the long-day-grown tomato plants (Figure 6).

2.6. Relationship between Methane and Other Plant Traits

Pearson’s correlation analysis revealed many significant relationships between different measured plant traits. For instance, methane emission was positively correlated with nonphotochemical quenching, anthocyanin, and shoot/root mass ratio, but negatively correlated with stem height, shoot mass, root mass, total mass, net CO2 assimilation, water-use efficiency, total chlorophyll, and flavonoids (p < 0.05; Table 3).

3. Discussion

In this study, we examined the effects of photoperiod on methane emissions from long-day (lettuce), short-day (mung bean), and day-neutral (tomato) plants. All these species were exposed to long and short durations of light to determine if changes in photoperiod cause any effects on plant-derived methane emissions. This study revealed that short duration of light increased methane emission, which was highest from the short-day-grown lettuce plants (Figure 2). This indicates that long-day plants, such as lettuce, when exposed to short days, will be stressed, and release more methane (Table 1; Figure 1, Figure 2 and Figure 3). The negative relationship between methane and plant growth and biomass supports this claim (Table 3). Earlier studies have shown that stressed plants release more methane compared to non-stressed plants [37,38], which was the case in canola (Brassica napus L.) [14,18] and pea (Pisum sativum L.) [19]. Our study also shows that plants generally release more methane when exposed to short days regardless of their adaptation to specific photoperiod.
In this study, overall, short duration of light adversely affected all components of gas exchange by increasing transpiration and stomatal conductance and decreasing net CO2assimilation and water-use efficiency (Table 1; Figure 4). These also show that plants that were exposed to short days were stressed and, in turn, had increased methane emissions. The negative relationships between methane and net CO2 assimilation, and methane and water-use efficiency are indicative of increased methane by stress. It is already known that stressed plants have decreased photosynthesis [39,40]. We have previously shown that, in canola, higher temperature and water stress decrease net CO2 assimilation, but increase methane emissions [18].
In the current study, although light duration did not significantly affect chlorophyll fluorescence, there were differences in the effective quantum yield of PSII and nonphotochemical quenching among plant species (Table 1 and Table 2; Figure 5). Higher nonphotochemical quenching in lettuce than in the other two species indicates that this species was more stressed than the others and dissipated excess light energy as heat to protect plant from photodamage [41]. A positive relationship between methane and nonphotochemical quenching is evidence of such phenomenon (Table 3). Indeed, the photosynthetic apparatus of stressed plants cannot function well to perform photosynthesis [39,42], and this is true for the light- and temperature-stressed canola plants [14].
In our study, lower total chlorophyll, and nitrogen balance index, but higher anthocyanin, in lettuce compared to the other two species again shows that this species was more stressed than the other two species (Table 1; Figure 6), producing more methane. In lettuce, decreased chlorophyll might have negatively affected rubisco and, in turn, photosynthesis [39,40]. It is also possible that decreased chlorophyll negatively affected the production of methylated amino acids, which have been shown to play as precursor of methane synthesis in plants [12,13,14]. Higher anthocyanin in lettuce than in the other two species also shows that, in this species, metabolites are used more for protection than for growth and development [43,44]. A negative relationship between methane and total chlorophyll, and a positive relationship between methane and anthocyanin, support the role of these chemical compounds in methane synthesis in plants (Table 3). In the tomato plants, total chlorophyll and flavonoids were lower, but methane emission was relatively higher, than in the mung bean plants, indicating that stress in the former plant species has led to increased methane production. Although tomato plants are considered day-neutral plants in terms of flowering, they perform better (e.g., net CO2 assimilation) when exposed to long days than to short days and emit relatively more methane under short days (Figure 4). In this study, plants under short duration of light had relatively lower flavonoids, although not significantly, than plants under long duration of light (Table 1). An inverse relationship between methane and flavonoids (Table 3) suggests that the stressed plants had decreased flavonoids, but increased methane emissions, which was true for lettuce and tomato, compared to mung bean (Table 1). A previous study has shown that, in canola, blue light stress increases methane emission, which is accompanied by decreased plant biomass, gas exchange, and flavonoids, but by increased wax, and some amino acids [13]. It is likely that short-day-grown plants were stressed, and, because of lower flavonoids, there might have been damage in photosynthetic apparatus [45,46], leading to increased methane emissions. The protective role of flavonoids against ROS, which negatively affects plant cells [47], has already been documented [46,48,49].

4. Materials and Methods

4.1. Plant Material and Growth Conditions

In this study, we used three plant species with adaptation to different photoperiods—lettuce (long-day plant), mung bean (short-day plant), and tomato (day-neutral plant). Fifty seeds of lettuce (Lactuca sativa L.; Grand Rapids, Halifax Seed, Halifax, NS, Canada), mung bean (Vigna radiata (L.) R. Wilczek; MB4091, Mumm’s Sprouting Seeds Ltd., Parkside, SK, Canada), and tomato (Solanum lycopersicum L.; Scotia, Halifax Seed, Halifax, NS, Canada) were germinated in each of three Petri dishes (10 cm × 1.5 cm). Petri dishes, lined with one-layer of blue filter paper (Anchor Paper Co., St. Paul, MN, USA), in a growth chamber (model PGR15, Conviron, Winnipeg, MB, Canada), were set to 22/18 °C on a 16 h photoperiod. Then, the seedlings were planted in pots, containing a mixture of Perlite, Vermiculite, and peat moss (1:1:2 by volume) with ~35 pellets of slow-release fertilizer (N-P-K, 14-14-14 plus micronutrients; Chisso-Asahi Fertilizer Co., Tokyo, Japan). Plants were left to acclimate for three days before being randomly assigned and placed under two light durations—long day (16 h light/8 h dark), and short day (8 h light/16 h dark), using two double tiered growth chambers (model: ATC26, Conviron, Winnipeg, MB). In the growth chambers, light was supplied by a mixture of cool white fluorescent lamps (MasterTL-D-58W/840, Philips, Amsterdam, NL, The Netherlands) and incandescent bulbs (Luminus, Conglom Inc., Saint-Laurent, QC, Canada). The photosynthetic photon flux density (PPFD) was 300 µmol photons m−2s−1, measured with a LI-250A radiometer/photometer (LI-COR Biosciences, Lincoln, NE, USA) at the shoot apex. There were six experimental treatments, each with 12 plants from each species; the plants were grown for 21 days under the experimental conditions. The pots were rotated bi-weekly to reduce potential positional effects. From each treatment, three plants were randomly selected to measure biomass, while the remaining plants were used for other measurements. Three independent experiments were conducted to ensure accuracy of the results.

4.2. Measurement of Aerobic Methane Emission

Methane emissions were measured following a method essentially described in [3]. From each treatment, three leaf samples of each species were excised and incubated under their unique growth conditions for 2 h within 3 mL syringes, flushed with methane-free air. An earlier study revealed that a 2-h incubation period at 22 °C is suitable for the measurement of methane emission. From each syringe, 1 mL of gas was collected and injected manually into a gas chromatograph-flame ionization detector system (model: Agilent 7820A/G4350B, Santa Clara, CA, USA) stocked with a capillary column (Carboxen 1006 PLOT, 30 m × 0.53 mm ID, Supelco, Bellefonte, PA, USA). The injector and detector temperatures were set at 200 and 230 °C, respectively. Helium was used as a carrier gas at 10 mL min−1. Methane was eluted with the following programmed temperature gradient: 1 min isothermal heating at 35 °C followed by a 24 °C min−1 oven ramp to 225 °C until the end of the 9 min run. Methane was identified by the retention time of the analyte (~2.6 min), using external standard (Air Liquide, Dartmouth, NS, Canada), and quantified based on standard curve derived from the injection of three replications of 5, 10, and 25 µL of standard methane gas. Linear regression analysis was applied on data to generate an equation (y = a + bx) in which the y was replaced by the methane value (mL h−1), which was then converted to ng h−1. The rates of methane emission (ng g−1DM (dry mass) h−1) were calculated based on leaf dry mass by drying the samples at 60 °C for 72 h.

4.3. Measurement of Growth and Dry Mass

Following three weeks of growth under experimental conditions, three plants were randomly selected and harvested from each photoperiodic treatment of each species to determine plant growth (stem height and diameter, and leaf area) and biomass (shoot, root, and total dry mass) traits. Prior to harvesting, stem diameter was measured with a Digimatic caliper (Mitutoyo Corp., Kanagawa, Japan), and stem height was measured with a ruler. To obtain dry mass of plant organs, they were dried for up to 120 h at 60° C in a forced-air Fisher Isotemp® Premium oven (model: 750 F, Fisher Scientific, Nepean, ON, Canada). Fresh and dry masses were measured with an analytical balance (model: ED224s, Sartorius, Goettingen, Germany), while leaf area was measured using a ΔT leaf area meter (Delta-T Devices, Cambridge, UK). The growth index SRR (shoot dry mass: root dry mass) was also calculated [3].

4.4. Measurement of Gas Exchange

From each treatment, three fully-expanded leaves of three plants from each species were used to measure net CO2 assimilation (AN, µmol CO2 m−2 s−1), transpiration (E, mmol H2O m−2 s−1) and stomatal conductance (gs, mol m−2 s−1) with a LI-COR portable photosynthesis system (model: 6400XT, LI-COR Inc., Lincoln, NE, USA). Before measurements, the photosynthesis system was calibrated with 400 µmol mol−1 of CO2 with flow rate of 400 mL s−1 [3]. The instantaneous water-use efficiency (WUE, µmol CO2 mmol−1 H2O) was calculated by dividing AN by E [50].

4.5. Measurement of Chlorophyll Fluorescence

From each treatment, three fully-grown leaves of three plants from each species were randomly selected to measure chlorophyll fluorescence with a portable fluorometer (model: FluorPen FP 100, Photon Systems Instruments, Drasov, Czech Republic). The effective quantum yield of PSII (ϕPSII) was measured in light-adapted leaves. Then, leaves were dark-adapted within a fluorometer clamp for 30 min and the maximum quantum yield of PSII (Fv/Fm), non-photochemical quenching (qNP) and photochemical quenching (qP) were measured [51]. The saturating light pulse was delivered for one second at 2100 µmol photons m−2 s−1 [52].

4.6. Measurement of Nitrogen Balance Index, Total Chlorophyll, Flavonoids, and Anthocyanin

From each treatment, three fully-grown leaves of three plants from each species were used to measure nitrogen balance index (NBI), total chlorophyll, flavonoids, and anthocyanin with a Dualex Scientific® (Dualex Scientific, Force-A, Orsay Cedex, Paris, France). This device measures optical absorbance and determines the plant traits by measuring the light that is delivered to and emitted back from leaves. NBI is calculated by dividing total chlorophyll by flavonoids. The amounts of total chlorophyll, flavonoids and anthocyanin are reported as µg cm−2 [52].

4.7. Data Analysis

Effects of photoperiod, plant species and the interactions of these factors on methane emissions, plant growth and physiological traits were determined by means of analysis of variance (ANOVA). Differences between and among treatments were determined using Fisher’s Least Significant Difference test at the 5% confidence level. Pearson’s correlation analysis was used to determine the relationship between methane and other plant traits, using Minitab® 2021.2.0 Statistical Software [53]. Experiments were conducted three times (trials) and in each independent trial, each trait had at least three biological replications. All data are reported as mean ± SEM (standard error of the mean).

5. Conclusions

This study revealed that short light duration increases plant-derived methane, which varies with species. Regardless of adaptation to a specific photoperiod, plants that are exposed to short days emit more methane than plants exposed to long days. When plants that are adapted to long days are exposed to short days, they emit significantly more methane than the same plant species exposed to long days. This novel finding should be considered regarding methane emissions from plants in the future. The use of other plants with specific adaptation to light duration will shed more light on the effects of photoperiod on methane synthesis in plants.

Author Contributions

M.M.Q.: Conceptualization, methodology, resources, formal analysis, investigation, writing—original draft, writing—review and editing, supervision, project administration, funding acquisition. K.B.: Writing—original draft, writing—review and editing, formal analysis, investigation. All authors have read and agreed to the published version of the manuscript.

Funding

This work was financially supported by Natural Sciences and Engineering Research Council (NSERC) of Canada through a Discovery grant and by Mount Saint Vincent University through an Internal Research grant to MMQ. Leaders Opportunity Fund from Canadian Foundation for Innovation (CFI), Nova Scotia Research and Innovation Trust (NSRIT) and Mount Saint Vincent University to MMQ and an NSERC USRA to KB are greatly acknowledged.

Institutional Review Board Statement

Not applicable.

Informed Consent Statement

Not applicable.

Data Availability Statement

The data presented in this study are available from the corresponding author on request.

Acknowledgments

We thank BrettYoung Seeds for the supply of canola seeds.

Conflicts of Interest

The authors declare no conflicts of interest.

References

  1. Masson-Delmotte, V.; Zhai, P.; Pirani, A.; Connors, S.L.; Péan, C.; Berger, S.; Caud, N.; Chen, Y.; Goldfarb, L.; Gomis, M.I.; et al. (Eds.) Climate Change 2021: The Physical Science Basis. Contribution of Working Group I to the Sixth Assessment Report of the Intergovernmental Panel on Climate Change; Cambridge University Press: Cambridge, UK; New York, NY, USA, 2021; 2391p. [Google Scholar]
  2. Lan, X.; Thoning, K.W.; Dlugokencky, E.J. Trends in Globally-Averaged CH4, N2O, and SF6 Determined from NOAA Global Monitoring Laboratory Measurements; Version 2024-04. Available online: https://gml.noaa.gov/ccgg/trends_doi.html (accessed on 22 April 2024).
  3. Martel, A.B.; Qaderi, M.M. Light Quality and Quantity Regulate Aerobic Methane Emissions from Plants. Physiol. Plant. 2017, 159, 313–328. [Google Scholar] [CrossRef] [PubMed]
  4. Reay, D.; Smith, P.; van Amstel, A. (Eds.) Methane and Climate Change; Earthscan Ltd.: London, UK, 2010; 261p. [Google Scholar]
  5. Ernst, L.; Steinfeld, B.; Barayeu, U.; Klintzsch, T.; Kurth, M.; Grimm, D.; Dick, T.P.; Rebelein, J.G.; Bischofs, I.B.; Keppler, F. Methane Formation Driven by Reactive Oxygen Species Across all Living Organisms. Nature 2022, 603, 482–487. [Google Scholar] [CrossRef] [PubMed]
  6. Schroll, M.; Lenhart, K.; Bender, T.; Hötten, P.; Rudolph, A.; Sörensen, S.; Keppler, F. Fungal Methane Production Controlled by Oxygen Levels and Temperature. Methane 2024, 3, 257–275. [Google Scholar] [CrossRef]
  7. Keppler, F.; Hamilton, J.T.G.; Braß, M.; Röckmann, T. Methane Emissions from Terrestrial Plants under Aerobic Conditions. Nature 2006, 439, 187–191. [Google Scholar] [CrossRef] [PubMed]
  8. Bruhn, D.; Mikkelsen, T.N.; Øbro, J.; Willats, W.G.T.; Ambus, P. Effects of Temperature, Ultraviolet Radiation and Pectin Methyl Esterase on Aerobic Methane Release from Plant Material. Plant Biol. 2009, 11, 43–48. [Google Scholar] [CrossRef] [PubMed]
  9. Messenger, D.J.; McLeod, A.R.; Fry, S.C. The Role of Ultraviolet Radiation, Photosensitizers, Reactive Oxygen Species and Ester Groups in Mechanisms of Methane Formation from Pectin. Plant Cell Environ. 2009, 32, 1–9. [Google Scholar] [CrossRef] [PubMed]
  10. Vigano, I.; Röckmann, T.; Holzinger, R.; Van Dijk, A.; Keppler, F.; Greule, M.; Brand, W.A.; Geilmann, H.; Van Weelden, H. The Stable Isotope Signature of Methane Emitted from Plant Material under UV Irradiation. Atmos. Environ. 2009, 43, 5637–5646. [Google Scholar] [CrossRef]
  11. Bruhn, D.; Mikkelsen, T.N.; Rolsted, M.M.M.; Egsgaard, H.; Ambus, P. Leaf Surface Wax is a Source of Plant Methane Formation under UV Radiation and in the Presence of Oxygen. Plant Biol. 2014, 16, 512–516. [Google Scholar] [CrossRef] [PubMed]
  12. Lenhart, K.; Althoff, F.; Greule, M.; Keppler, F. Technical Note: Methionine, a Precursor of Methane in Living Plants. Biogeosciences 2015, 12, 1907–1914. [Google Scholar] [CrossRef]
  13. Martel, A.B.; Qaderi, M.M. Unravelling the Effects of Blue Light on Aerobic Methane Emissions from Canola. J. Plant Physiol. 2019, 233, 12–19. [Google Scholar] [CrossRef]
  14. Martel, A.B.; Taylor, A.E.; Qaderi, M.M. Individual and Interactive Effects of Temperature and Light Intensity on Canola Growth, Physiological Characteristics and Methane Emissions. Plant Physiol. Biochem. 2020, 157, 160–168. [Google Scholar] [CrossRef] [PubMed]
  15. McLeod, A.R.; Fry, S.C.; Loake, G.J.; Messenger, D.J.; Reay, D.S.; Smith, K.A.; Yun, B.W. Ultraviolet Radiation Drives Methane Emissions from Terrestrial Plant Pectins. New Phytol. 2008, 180, 124–132. [Google Scholar] [CrossRef] [PubMed]
  16. Qaderi, M.M.; Reid, D.M. Methane Emissions from Six Crop Species Exposed to Three Components of Global Climate Change: Temperature, Ultraviolet-B Radiation and Water Stress. Physiol. Plant. 2009, 137, 139–147. [Google Scholar] [CrossRef] [PubMed]
  17. Abdulmajeed, A.M.; Qaderi, M.M. Intrashoot Variation in Aerobic Methane Emissions from Pea Plants Exposed to Multiple Abiotic Stresses. Acta Physiol. Plant. 2017, 39, 124. [Google Scholar] [CrossRef]
  18. Qaderi, M.M.; Reid, D.M. Stressed Crops Emit More Methane Despite the Mitigating Effects of Elevated Carbon Dioxide. Funct. Plant Biol. 2011, 38, 97–105. [Google Scholar] [CrossRef]
  19. Abdulmajeed, A.M.; Qaderi, M.M. Methane Emissions from Reproductive Organs of Pea Plants Exposed to Multiple Abiotic Factors. Theor. Exp. Plant Physiol. 2020, 32, 79–87. [Google Scholar] [CrossRef]
  20. Qaderi, M.M.; Reid, D.M. Aerobic Methane Emissions from Stinkweed (Thlaspi arvense) Capsules. Plant Signal. Behav. 2014, 9, e970095. [Google Scholar] [CrossRef] [PubMed]
  21. Creelman, C.-R.L.; Qaderi, M.M. Independent Effects of Blue Light and Abscisic Acid on Methane Emissions from Canola Plants Grown under Sterile Conditions. Theor. Exp. Plant Physiol. 2021, 33, 271–280. [Google Scholar] [CrossRef]
  22. Hopkins, W.G.; Hüner, N.P.A. Introduction to Plant Physiology, 4th ed.; John Wiley & Sons, Inc.: Hoboken, NJ, USA, 2009; 503p. [Google Scholar]
  23. Jones, H.G. Plants and Microclimate: A Quantitative Approach to Environmental Plant Physiology, 3rd ed.; Cambridge University Press: Cambridge, UK, 2014; 407p. [Google Scholar]
  24. Paradiso, R.; Proietti, S. Light-Quality Manipulation to Control Plant Growth and Photomorphogenesis in Greenhouse Horticulture: The State of the Art and the Opportunities of Modern LED Systems. J. Plant Growth Regul. 2022, 41, 742–780. [Google Scholar] [CrossRef]
  25. Jung, E.S.; Lee, S.; Lim, S.-H.; Ha, S.-H.; Liu, K.-H.; Lee, C.H. Metabolite Profiling of the Short-Term Responses of Rice Leaves (Oryza sativa cv. Ilmi) Cultivated under Different LED Lights and its Correlations with Antioxidant Activities. Plant Sci. 2013, 210, 61–69. [Google Scholar] [CrossRef]
  26. Qaderi, M.M.; Godin, V.J.; Reid, D.M. Single and Combined Effects of Temperature and Red:Far-Red Light Ratio on Evening Primrose (Oenothera biennis). Botany 2015, 93, 475–483. [Google Scholar] [CrossRef]
  27. Hay, R.K.M. The Influence of Photoperiod on the Dry Matter Production of Grasses and Cereals. New Phytol. 1990, 116, 233–254. [Google Scholar] [CrossRef]
  28. Adams, S.R.; Langton, F.A. Photoperiod and Plant Growth: A Review. J. Hortic. Sci. Biotech. 2005, 80, 2–10. [Google Scholar] [CrossRef]
  29. Wu, Z.; Skjelvåg, A.O.; Baadshaug, O.H. Quantification of Photoperiodic Effects on Growth of Phleum pratense. Ann. Bot. 2004, 94, 535–543. [Google Scholar] [CrossRef] [PubMed]
  30. Roeber, V.M.; Schmülling, T.; Cortleven, A. The Photoperiod: Handling and Causing Stress in Plants. Front. Plant Sci. 2022, 12, 781988. [Google Scholar] [CrossRef] [PubMed]
  31. Osnato, M.; Cota, I.; Nebhnani, P.; Cereijo, U.; Pelaz, S. Photoperiod Control of Plant Growth: Flowering Time Genes Beyond Flowering. Front. Plant Sci. 2022, 12, 805635. [Google Scholar] [CrossRef] [PubMed]
  32. Shim, J.S.; Imaizumi, T. Circadian Clock and Photoperiodic Response in Arabidopsis: From Seasonal Flowering to Redox Homeostasis. Biochemistry 2015, 54, 157–170. [Google Scholar] [CrossRef] [PubMed]
  33. Sanchez, S.E.; Rugnone, M.L.; Kay, S.A. Light Perception: A Matter of Time. Mol. Plant 2020, 13, 363–385. [Google Scholar] [CrossRef] [PubMed]
  34. Jackson, S.D. Plant Responses to Photoperiod. New Phytol. 2009, 181, 517–531. [Google Scholar] [CrossRef]
  35. Nakamichi, N. Adaptation to the Local Environment by Modifications of the Photoperiod Response in Crops. Plant Cell Physiol. 2015, 56, 594–604. [Google Scholar] [CrossRef]
  36. Kelly, N.; Choe, D.; Meng, Q.; Runkle, E.S. Promotion of Lettuce Growth under an Increasing Daily Light Integral Depends on the Combination of the Photosynthetic Photon Flux Density and Photoperiod. Sci. Hortic. 2020, 272, 109565. [Google Scholar] [CrossRef]
  37. Boros, M.; Keppler, F. Methane Production and Bioactivity—A Link to Oxido-Reductive Stress. Front. Physiol. 2019, 10, 1244. [Google Scholar] [CrossRef] [PubMed]
  38. Covey, K.R.; Megonigal, J.P. Methane Production and Emissions in Trees and Forests. New Phytol. 2019, 222, 35–51. [Google Scholar] [CrossRef]
  39. Sherin, G.; Raj Aswathi, K.P.; Puthur, J.T. Photosynthetic Functions in Plants Subjected to Stresses are Positively Influenced by Priming. Plant Stress 2022, 4, 100079. [Google Scholar] [CrossRef]
  40. Chauhan, J.; Prathibha, M.D.; Singh, P.; Choyal, P.; Mishra, U.N.; Saha, D.; Kumar, R.; Anuragi, H.; Pandey, S.; Bose, B.; et al. Plant Photosynthesis under Abiotic Stresses: Damages, Adaptive, and Signaling Mechanisms. Plant Stress 2023, 10, 100296. [Google Scholar] [CrossRef]
  41. Ruban, A.V. Nonphotochemical Chlorophyll Fluorescence Quenching: Mechanism and Effectiveness in Protecting Plants from Photodamage. Plant Physiol. 2016, 170, 1903–1916. [Google Scholar] [CrossRef] [PubMed]
  42. Song, Y.; Feng, L.; Alyafei, M.A.M.; Jaleel, A.; Ren, M. Function of Chloroplasts in Plant Stress Responses. Int. J. Mol. Sci. 2021, 22, 13464. [Google Scholar] [CrossRef] [PubMed]
  43. Steyn, W.J.; Wand, S.J.E.; Holcroft, D.M.; Jacobs, G. Anthocyanins in Vegetative Tissues: A Proposed Unified Function in Photoprotection. New Phytol. 2002, 155, 349–361. [Google Scholar] [CrossRef] [PubMed]
  44. Zhao, S.; Blum, J.A.; Ma, F.; Wang, Y.; Borejsza-Wysocka, E.; Ma, F.; Cheng, L.; Li, P. Anthocyanin Accumulation Provides Protection Against High Light Stress While Reducing Photosynthesis in Apple Leaves. Int. J. Mol. Sci. 2022, 23, 12616. [Google Scholar] [CrossRef]
  45. Yamashita, A.; Nijo, N.; Pospíšil, P.; Morita, N.; Takenaka, D.; Aminaka, R.; Yamamoto, Y.; Yamamoto, Y. Quality Control of Photosystem II Reactive Oxygen Species are Responsible for the Damage to Photosystem II under Moderate Heat Stress. J. Biol. Chem. 2008, 283, 28380–28391. [Google Scholar] [CrossRef]
  46. Shomali, A.; Das, S.; Arif, N.; Sarraf, M.; Zahra, N.; Yadav, V.; Aliniaeifard, S.; Chauhan, D.K.; Hasanuzzaman, M. Diverse Physiological Roles of Flavonoids in Plant Environmental Stress Responses and Tolerance. Plants 2022, 11, 3158. [Google Scholar] [CrossRef] [PubMed]
  47. Sharma, P.; Jha, A.B.; Dubey, R.S.; Pessarakli, M. Reactive Oxygen Species, Oxidative Damage, and Antioxidative Defense Mechanism in Plants under Stressful Conditions. J. Bot. 2012, 2012, 217037. [Google Scholar] [CrossRef]
  48. Zhishen, J.; Mengcheng, T.; Jianming, W. The Determination of Flavonoid Contents in Mulberry and Their Scavenging Effects on Superoxide Radicals. Food Chem. 1999, 64, 555–559. [Google Scholar] [CrossRef]
  49. Falcone Ferreyra, M.L.; Rius, S.P.; Casati, P. Flavonoids: Biosynthesis, Biological Functions, and Biotechnological Applications. Front. Plant Sci. 2012, 3, 222. [Google Scholar] [CrossRef] [PubMed]
  50. Lambers, H.; Oliveira, R.S. Plant Physiological Ecology, 3rd ed.; Springer Nature AG: Cham, Switzerland, 2019; 736p. [Google Scholar]
  51. Baker, N.R. Chlorophyll Fluorescence: A Probe of Photosynthesis in Vivo. Annu. Rev. Plant Biol. 2008, 59, 89–113. [Google Scholar] [CrossRef]
  52. Martel, A.B.; Qaderi, M.M. Exogenous Ethylene Increases Methane Emissions from Canola by Adversely Affecting Plant Growth and Physiological Processes. Botany 2021, 99, 421–431. [Google Scholar] [CrossRef]
  53. Minitab Inc. Minitab® 2021 Statistical Software, Version 2021.2.0; Minitab Inc.: State College, PA, USA, 2021.
Figure 1. One-month-old lettuce (Lactuca sativa), mung bean (Vigna radiata) and tomato (Solanum lycopersicum) plants that were grown under two photoperiods (long day, 16 h light/8 h dark; short day, 8 h light/16 h dark) and a temperature regime of 22/18 °C in controlled-environment growth chambers. (A,B) lettuce, (C,D) mung bean, and (E,F) tomato; (A,C,E) plants under long-day photoperiod, and (B,D,F) plants under short-day photoperiod.
Methane 03 00021 g001
Figure 2. Effects of photoperiod on methane emission and growth of lettuce, mung bean and tomato plants: (A) methane, (B) stem height, (C) stem diameter, and (D) leaf area. Data are means ± SEM of three replicated experiments. Bars surmounted by different letters within each panel are significantly different (Fisher’s LSD test, p < 0.05).
Methane 03 00021 g002
Figure 3. Effects of photoperiod on dry mass of lettuce, mung bean and tomato plants: (A) shoot mass, (B) root mass, (C) total mass, and (D) shoot/root mass ratio. Data are means ± SEM of three replicated experiments. Bars surmounted by different letters within each panel are significantly different (Fisher’s LSD test, p < 0.05).
Methane 03 00021 g003
Figure 4. Effects of photoperiod on gas exchange of lettuce, mung bean and tomato plants: (A) net CO2 assimilation, (B) transpiration, (C) stomatal conductance, and (D) water-use efficiency. Data are means ± SEM of three replicated experiments. Bars surmounted by different letters within each panel are significantly different (Fisher’s LSD test, p < 0.05).
Methane 03 00021 g004
Figure 5. Effects of photoperiod on chlorophyll fluorescence of lettuce, mung bean and tomato plants: (A) effective quantum yield of PSII, (B) maximum quantum yield of PSII, (C) nonphotochemical quenching, and (D) photochemical quenching. Data are means ± SEM of three replicated experiments. Bars surmounted by different letters within each panel are significantly different (Fisher’s LSD test, p < 0.05).
Methane 03 00021 g005
Figure 6. Effects of photoperiod on nitrogen balance index, total chlorophyll, flavonoids and anthocyanin of lettuce, mung bean and tomato plants; (A) nitrogen balance index, (B) total chlorophyll, (C) flavonoids, and (D) anthocyanin. Data are means ± SEM of three replicated experiments. Bars surmounted by different letters within each panel are significantly different (Fisher’s LSD test, p < 0.05).
Methane 03 00021 g006
Table 1. Effects of light duration and species on methane, growth, and physiological traits of lettuce, mung bean and tomato plants.
Trait Light Duration Plant Species
LongShortLettuceMung BeanTomato
Methane (ng g−1 DM h−1) 11.5 ± 1.61 b20.0 ± 3.04 a 21.8 ± 3.95 a10.3 ± 1.90 b15.0 ± 2.59 ab
Stem height (cm) 7.01 ± 1.76 a6.58 ± 1.73 a 0.38 ± 0.03 c12.3 ± 0.36 a7.73 ± 0.41 b
Stem diameter (mm) 3.84 ± 0.42 a2.29 ± 0.35 b 2.38 ± 0.37 b2.22 ± 0.27 b4.60 ± 0.42 a
Leaf area (cm2 plant−1) 137 ± 15.9 a58.5 ± 6.84 b 102 ± 26.1 ab64.4 ± 9.73 b127 ± 21.6 a
Shoot mass (mg) 383 ± 30.8 a114 ± 14.1 b 206 ± 65.1 a224 ± 43.6 a317 ± 78.1 a
Root mass (mg) 69.8 ± 11.2 a17.9 ± 3.88 b 19.5 ± 7.28 b68.3 ± 18.4 a43.8 ± 10.7 ab
Total mass (mg) 453 ± 32.0 a132 ± 17.7 b 225 ± 72.3 a292 ± 61.9 a360 ± 88.4 a
Shoot/root mass ratio 6.82 ± 1.11 a9.42 ± 1.87 a 13.3 ± 1.65 a3.75 ± 0.38 c7.28 ± 0.39 b
AN (µmol CO2 m−2 s−1) 7.21 ± 1.15 a5.19 ± 0.36 a 3.61 ± 0.44 b8.11 ± 1.05 a6.88 ± 0.79 a
E (mmol H2O m−2 s−1) 2.15 ± 0.35 b4.00 ± 0.20 a 2.49 ± 0.49 a2.98 ± 0.45 a3.75 ± 0.54 a
gs (mol m−2 s−1) 0.09 ± 0.02 b0.19 ± 0.01 a 0.11 ± 0.02 a0.13 ± 0.02 a0.18 ± 0.03 a
WUE (µmol CO2 mmol H2O−1) 3.56 ± 0.58 a1.31 ± 0.08 b 1.68 ± 0.34 a3.39 ± 0.87 a2.23 ± 0.62 a
ϕPSII 0.71 ± 0.01 a0.71 ± 0.01 a 0.72 ± 0.01 a0.72 ± 0.00 a0.69 ± 0.01 b
Fv/Fm 0.80 ± 0.01 a0.81 ± 0.00 a 0.81 ± 0.01 a0.80 ± 0.01 a0.80 ± 0.00 a
qNP 1.33 ± 0.18 a1.12 ± 0.23 a 1.96 ± 0.10 a0.78 ± 0.03 b0.94 ± 0.18 b
qP 0.13 ± 0.03 a0.19 ± 0.05 a 0.17 ± 0.04 a0.12 ± 0.02 a0.19 ± 0.08 a
Nitrogen balance index 27.3 ± 2.99 a30.8 ± 4.68 a 16.8 ± 1.10 b35.2 ± 4.83 a35.1 ± 2.54 a
Total chlorophyll (µg cm−2) 21.7 ± 2.29 a22.3 ± 3.92 a 11.2 ± 0.83 c31.5 ± 2.24 a23.2 ± 1.50 b
Flavonoids (µg cm−2) 0.81 ± 0.07 a0.70 ± 0.02 a 0.67 ± 0.01 b0.94 ± 0.07 a0.66 ± 0.01 b
Anthocyanin (µg cm−2) 0.30 ± 0.02 a0.31 ± 0.03 a 0.41 ± 0.01 a0.25 ± 0.00 b0.25 ± 0.01 b
Plants were grown under two light durations (long-day, 16 h light/8 h dark, and short-day, 8 h light/16 h dark; 22/18 °C) for three weeks after one week of initial growth. Data are means ± SEM of three replicated experiments. Means followed by different letters within rows and traits are significantly different (Fisher’s LSD test, p < 0.05); SRR, shoot to root mass ratio; AN, net CO2 assimilation; E, transpiration; gs, stomatal conductance, WUE, water-use efficiency; ϕPSII, effective quantum yield of PSII; Fv/Fm, maximum quantum yield of PSII; qNP, nonphotochemical quenching; qP, photochemical quenching; NBI, nitrogen balance index.
Table 2. Analysis of variance (F value) for light duration and species, and their interactive effects on methane, growth, and physiological traits of lettuce, mung bean and tomato plants.
Sourced.f.Greenhouse GasPlant Growth
MethaneStem HeightStem DiameterLeaf Area
Light duration (L)19.01 *1.53305 ***74.2 ***
Species (S)25.52 *392 ***301 ***15.8 ***
L × S20.251.424.76 *7.02 ***
Sourced.f.Dry massGrowth index
ShootRootTotalSRR
Light duration (L)1208 ***201 ***201 ***12.5 ***
Species (S)213.6 **11.9 **11.9 **57.8 ***
L × S26.80 *2.932.936.53 *
Sourced.f.Gas exchange
ANEgsWUE
Light duration (L)117.6 **28.4 ***28.0 ***30.7 ***
Species (S)230.7 ***4.49 *5.35 *6.16 *
L × S212.6 **0.300.014.35 *
Sourced.f.Chlorophyll fluorescence
ϕPSIIFv/FmqNPqP
Light duration (L)10.280.112.591.09
Species (S)23.450.5032.4 ***0.54
L × S20.420.991.312.89
Sourced.f.Growth indicatorPhotosynthetic pigmentProtective compound
NBITotal chlorophyllFlavonoidsAnthocyanin
Light duration (L)13.420.25106 ***4.84 *
Species (S)242.1 ***117 ***304 ***350 ***
L × S221.3 ***16.2 ***79.4 ***6.76 *
Plants were grown under two light durations (long-day, 16 h light/8 h dark, and short-day, 8 h light/16 h dark; 22/18 °C) for three weeks after one week of initial growth. Significance values: * p < 0.05; ** p < 0.01; *** p < 0.001; SRR, shoot to root mass ratio; AN, net CO2 assimilation; E, transpiration; gs, stomatal conductance, WUE, water-use efficiency; ϕPSII, effective quantum yield of PSII; Fv/Fm, maximum quantum yield of PSII; qNP, nonphotochemical quenching; qP, photochemical quenching; NBI, nitrogen balance index.
Table 3. Pearson’s correlation coefficient between methane emission and other traits of lettuce, mung bean and tomato plants. Only significant correlations are shown. Plants were grown under two light durations (long-day, 16 h light/8 h dark, and short-day, 8 h light/16 h dark; 22/18 °C) for three weeks after one week of initial growth. Significance values: * p < 0.05; ** p < 0.01.
TraitMethaneTraitMethane
Nonphotochemical quenching0.48 *Stem height−0.60 **
Anthocyanin0.61 **Shoot mass−0.54 *
Shoot/root mass ratio0.70 **Root mass−0.70 **
Total mass−0.60 **
Net CO2 assimilation−0.66 **
Water-use efficiency−0.57 *
Total chlorophyll−0.57 *
Flavonoids−0.51 *
Disclaimer/Publisher’s Note: The statements, opinions and data contained in all publications are solely those of the individual author(s) and contributor(s) and not of MDPI and/or the editor(s). MDPI and/or the editor(s) disclaim responsibility for any injury to people or property resulting from any ideas, methods, instructions or products referred to in the content.

