Article

Pathways toward Climate-Neutral Red Meat Production †

by
Bradley Ridoutt
1,2
1
Agriculture and Food, Commonwealth Scientific and Industrial Research Organisation (CSIRO), Private Bag 10, Clayton South, VIC 3169, Australia
2
Department of Agricultural Economics, University of the Free State, Bloemfontein 9300, South Africa
Presented at an OECD workshop Food and Feed for the Future, Lyon, France, 1 September 2023.
Methane 2024, 3(3), 397-409; https://doi.org/10.3390/methane3030022
Submission received: 13 May 2024 / Revised: 10 June 2024 / Accepted: 21 June 2024 / Published: 3 July 2024

Abstract

:
Ruminant livestock industries can support the climate stabilization ambitions of the Paris Agreement through interventions that reduce GHG emissions (predominantly biogenic methane) and sequester carbon in landscapes. This study explored pathways for the Australian red meat industry (grazing, feedlot finishing, and domestic processing) to become climate neutral, whereby the radiative forcing (RF) footprint is plateaued and there is no additional forcing contribution. Emissions timeseries (CO2, N2O, CH4) were compiled for 1990 to 2020 and projected to 2030 under a business-as-usual scenario (including an 18% increase in sheep and 13% increase in beef cattle) and with a range of production system and vegetation management interventions. The RF footprint peaked in 2018 at 7.13 mW/m2 and decreased to 7.07 mW/m2 in 2020. With the future expansion of the herd/flock and under business-as-usual conditions, the RF footprint is projected to increase by 2.8% by 2030. However, with a combination of interventions, production has the potential to increase with a decreasing RF footprint, a condition that can be described as climate neutral. The Australian red meat industry has made an historical contribution to global RF increase. However, with ongoing RF management, it is possible to increase food production within climate-neutral limits.

1. Introduction

The primary consensus for action to combat global climate change is the Paris Agreement [1], where Article 2 describes the ambitious goal of limiting global mean temperature rise to 1.5 °C above pre-industrial levels (well below 2 °C) to significantly reduce risks and impacts. With respect to this goal, the Intergovernmental Panel on Climate Change (IPCC) states that “Stabilizing the climate will require strong, rapid, and sustained reductions in greenhouse gas emissions, and reaching net zero CO2 emissions” [2]. This requirement to achieve net zero CO2 emissions stems from the long-term impacts of these emissions, potentially lasting millennia [3,4]. The IPCC also states that “Limiting other greenhouse gases and air pollutants, especially methane, could have benefits both for health and the climate” [2]. By comparison, methane emissions have a relatively short atmospheric lifetime, in the order of 12 years [5], meaning that, in the case of biogenic methane, a steady emissions profile over time can be consistent with climate stabilization [6].
The differences between greenhouse gases, in terms of atmospheric lifetime and strength of greenhouse effect, complicate the development of multi-gas climate action strategies. Equivalence between different types of GHG emissions can be established using climate metrics (such as the 100-year global warming potential; GWP100), with results typically reported as CO2-equivalent emissions. However, it is well known that there is no absolute equivalence in climate impact [7,8,9]. Each climate metric uses a different basis for comparison, for example, by estimating the relative impact at a certain future point in time, or over a chosen interval in time. Critically, depending on the climate metric chosen, the relative importance of different GHGs varies. The issue for ruminant livestock industries is that while there are substantial opportunities for CO2 sequestration in landscapes [10,11], GHG emissions are substantially non-CO2. As such, there has been much recent interest in GHG assessment methods and metrics that can be used to inform climate action consistent with the Paris Agreement’s climate stabilization goal [12].
For ruminant livestock industries, two main alternatives to the traditional 100-year global warming potential have emerged in recent years: the GWP* climate metric [13,14,15,16,17,18,19] and the radiative forcing (RF) footprint [20,21,22]. The GWP* climate metric is similar in many ways to GWP100 except that pulses of long-lived emissions are evaluated alongside permanent rates of change of short-lived GHG emissions, such as methane. Through this approach, GWP* results are more easily interpreted in relation to future warming than when pulses of short- and long-lived GHG emissions are combined [23,24]. The other approach, the RF footprint, is based on the same IPCC-derived equations as GWP100. However, the RF footprint reports present radiative forcing from current year emissions together with the radiative forcing from historical emissions remaining in the atmosphere. As such, it presents what might be described as a radiative forcing balance sheet, providing greater transparency regarding climate impacts over time. Climate neutral (in contrast to the terms carbon neutral and GHG neutral; [25]) is a term that has been applied when a system makes no net contribution to additional temperature increase or no net contribution to increase in radiative forcing [12,21,26]. This study explores pathways for the Australian red meat industry to reach climate neutrality using the RF footprint approach. Insofar as it is known, this is the first study of this kind using this novel approach.

2. Methods

2.1. Timeseries of GHG Emissions

Disaggregated timeseries of GHG emissions (CO2, N2O, and CH4), covering cattle production (including feedlot finishing), sheep meat production, goat production, and domestic red meat processing, were compiled for the years 1990 to 2020. These data were primarily sourced from the Australian Greenhouse Emissions Information System [27] that contains the GHG emissions data used to support Australia’s national reporting under the UNFCCC. Detailed descriptions of the methods used to compile the national inventory are available [28,29]. These data covered emissions from enteric fermentation, manure management, agricultural soils, and liming and urea applications, along with land use and land use change. Other sources were used to determine emissions related to energy use on farms [30,31] and in feedlots [32]. Emissions related to red meat processing were obtained from industry benchmarking studies [33]. Concerning the national sheep flock, a protein mass allocation was used to partition emissions between wool and meat production [30]. In Australia, only a very small proportion of the national flock are dairy sheep. Other details of the methodology, including the approach used to allocate emissions between cattle and sheep, are described in [34]. These emission timeseries were subsequently extrapolated proportionally to 2030 using forecasts for livestock numbers and production supplied by the industry (Table 1). In summary, sheep and lamb numbers were forecast to increase almost 18% from 2020 to 2030. For beef cattle, the forecast increase was almost 13%.

2.2. Mitigation and Sequestration Interventions

In consultation with industry, a list of GHG mitigation and sequestration interventions was compiled (Table 2). These interventions are at various stages of technological development and adoption. Only interventions with a realistic potential for implementation prior to 2030 were considered, in line with the time horizon of the study. The interventions included feed additives, forage crops, breeding for lower enteric methane emissions, and improved herd/flock management. Vegetation management interventions were also considered, including trees on farms, soil carbon storage, and savannah burning management. For production system interventions, estimates of efficacy and adoption were obtained from recent reviews [35,36,37,38], with the aim of reflecting what might be reasonably possible in production environments as compared to controlled trial conditions. For example, in vitro studies simulating rumen digestion have demonstrated up to 99% reduction in methane formation by Asparagopsis macroalgae [39,40,41], and controlled feeding experiments have also shown very large reductions in some situations [42,43]. However, this level of efficacy might not be achieved consistently over a range of production situations and a more conservative estimate of 49% was used for modelling [37]. For vegetation management, the assumed adoption rates were based on published industry targets [44,45]. An approximate S-shaped adoption curve was assumed.

2.3. Quantifying Radiative Forcing (RF) Footprints
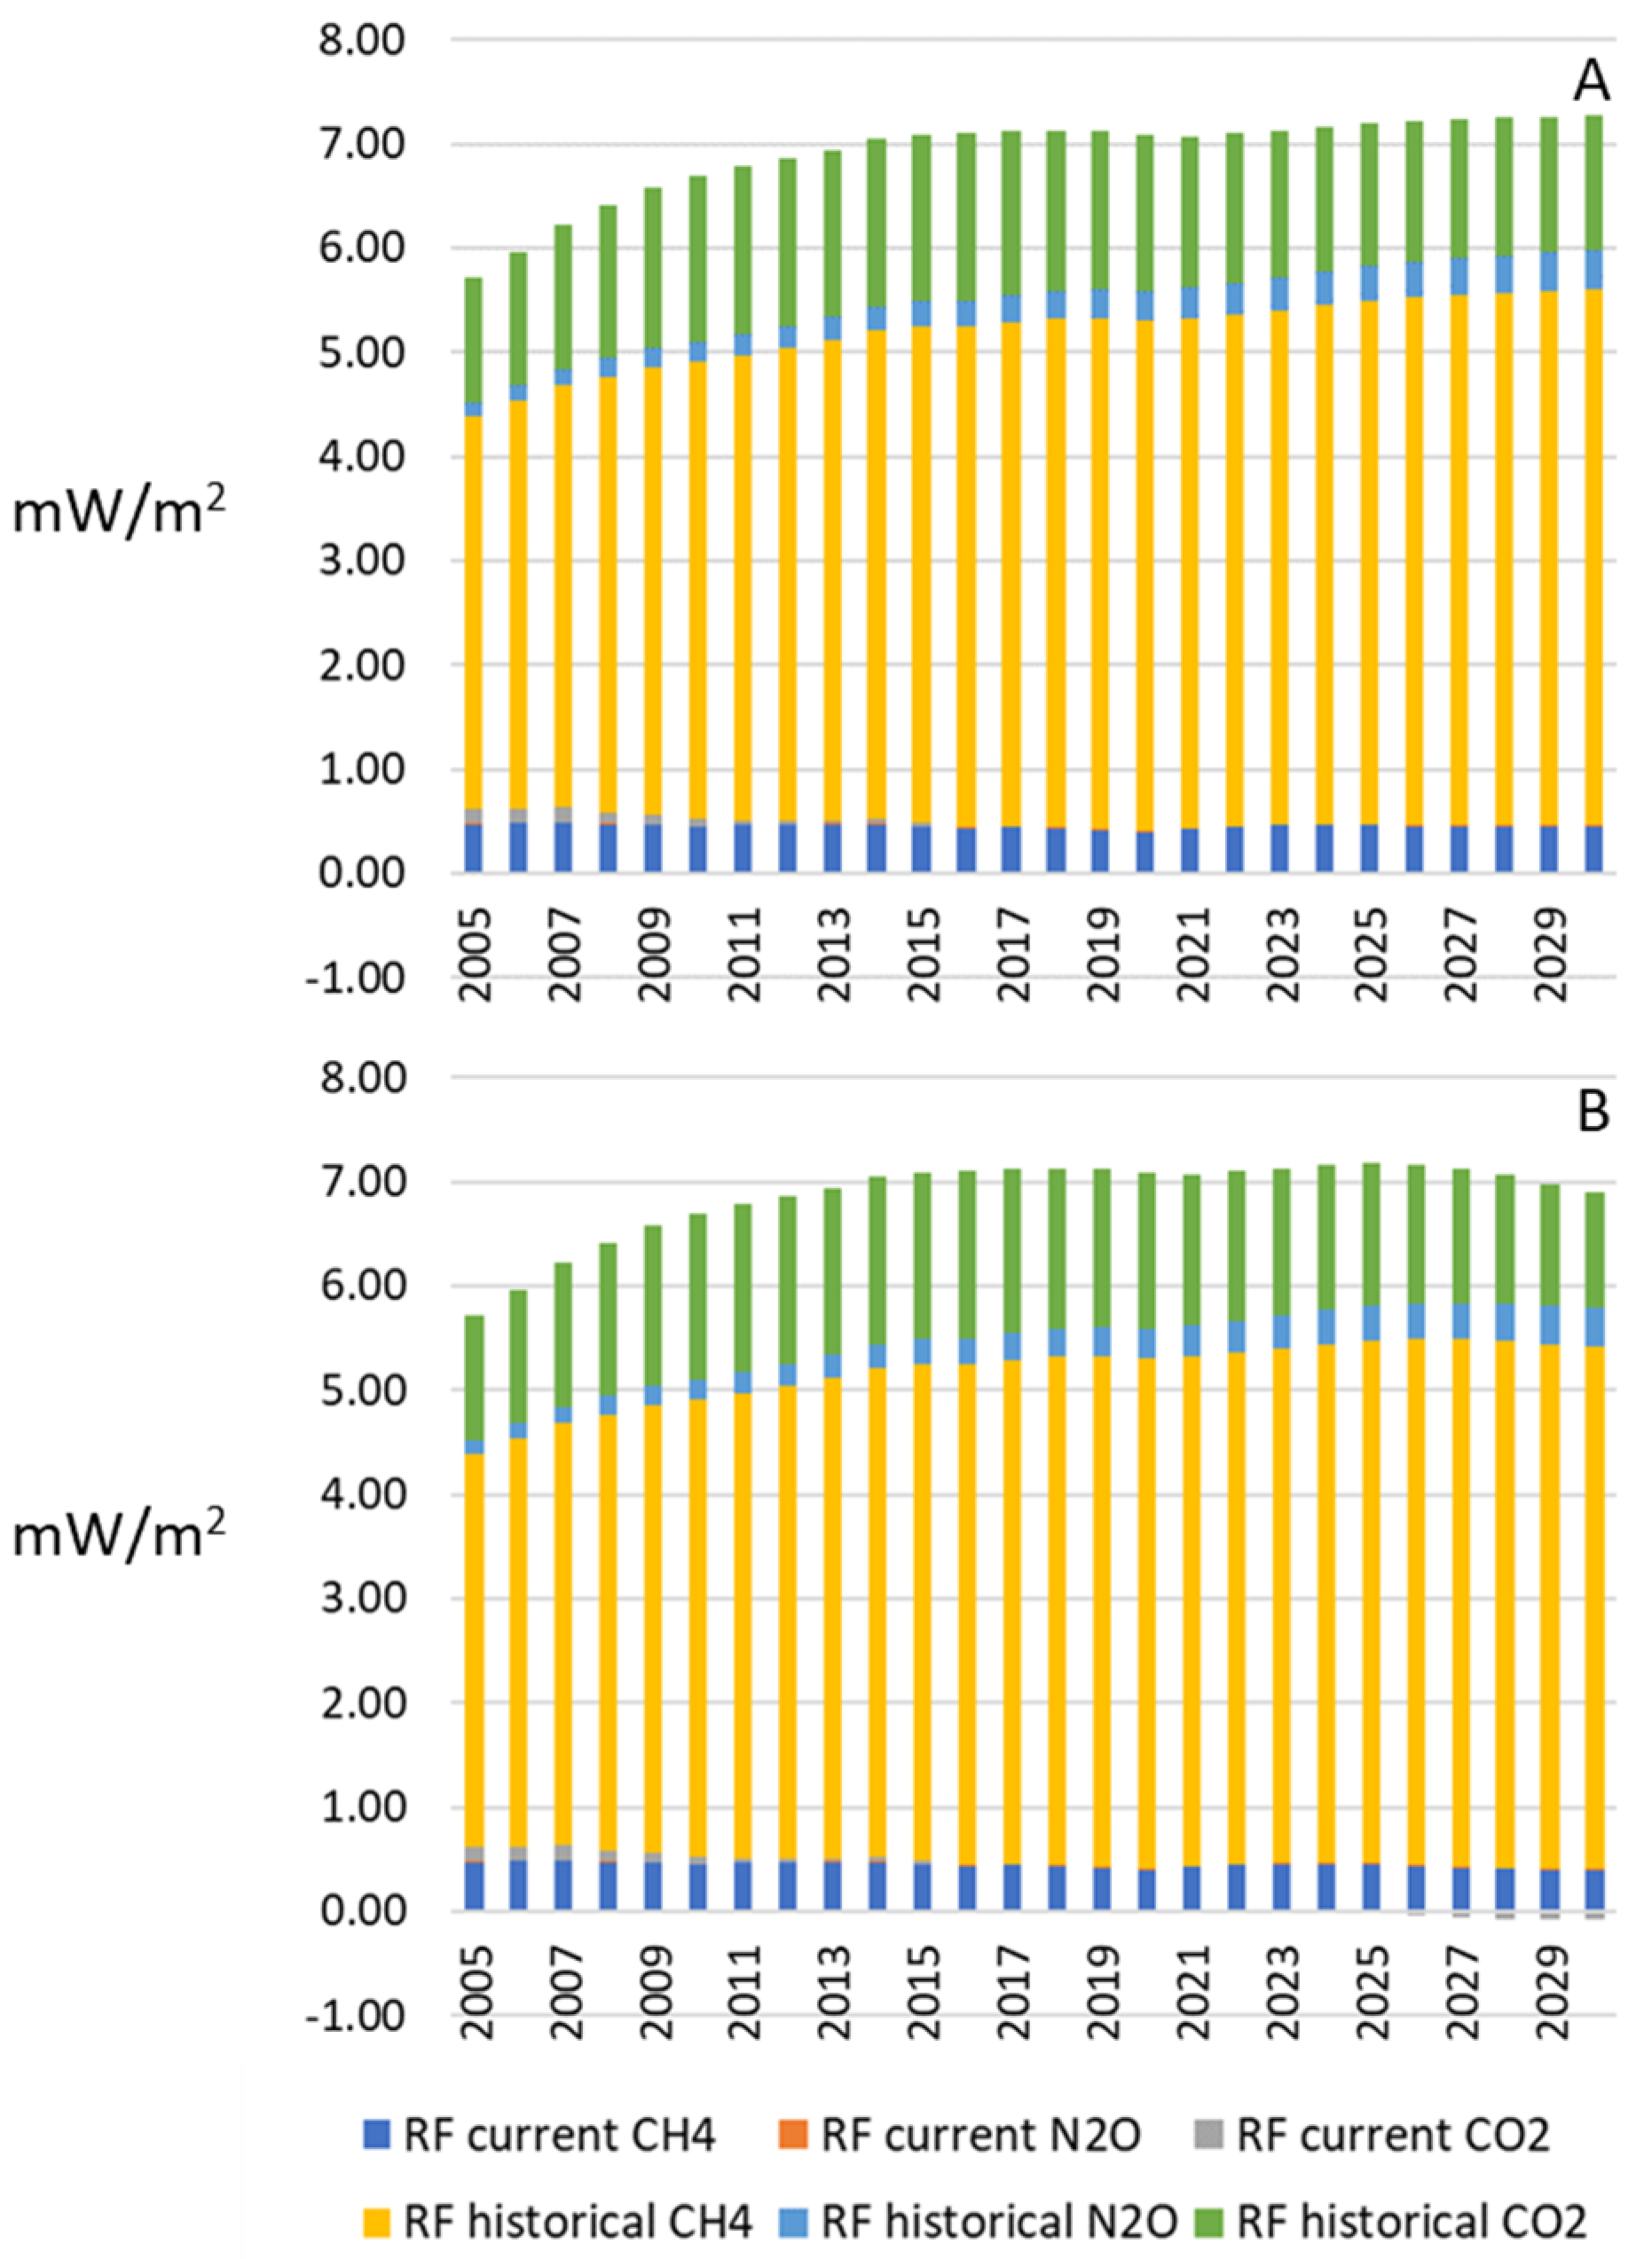
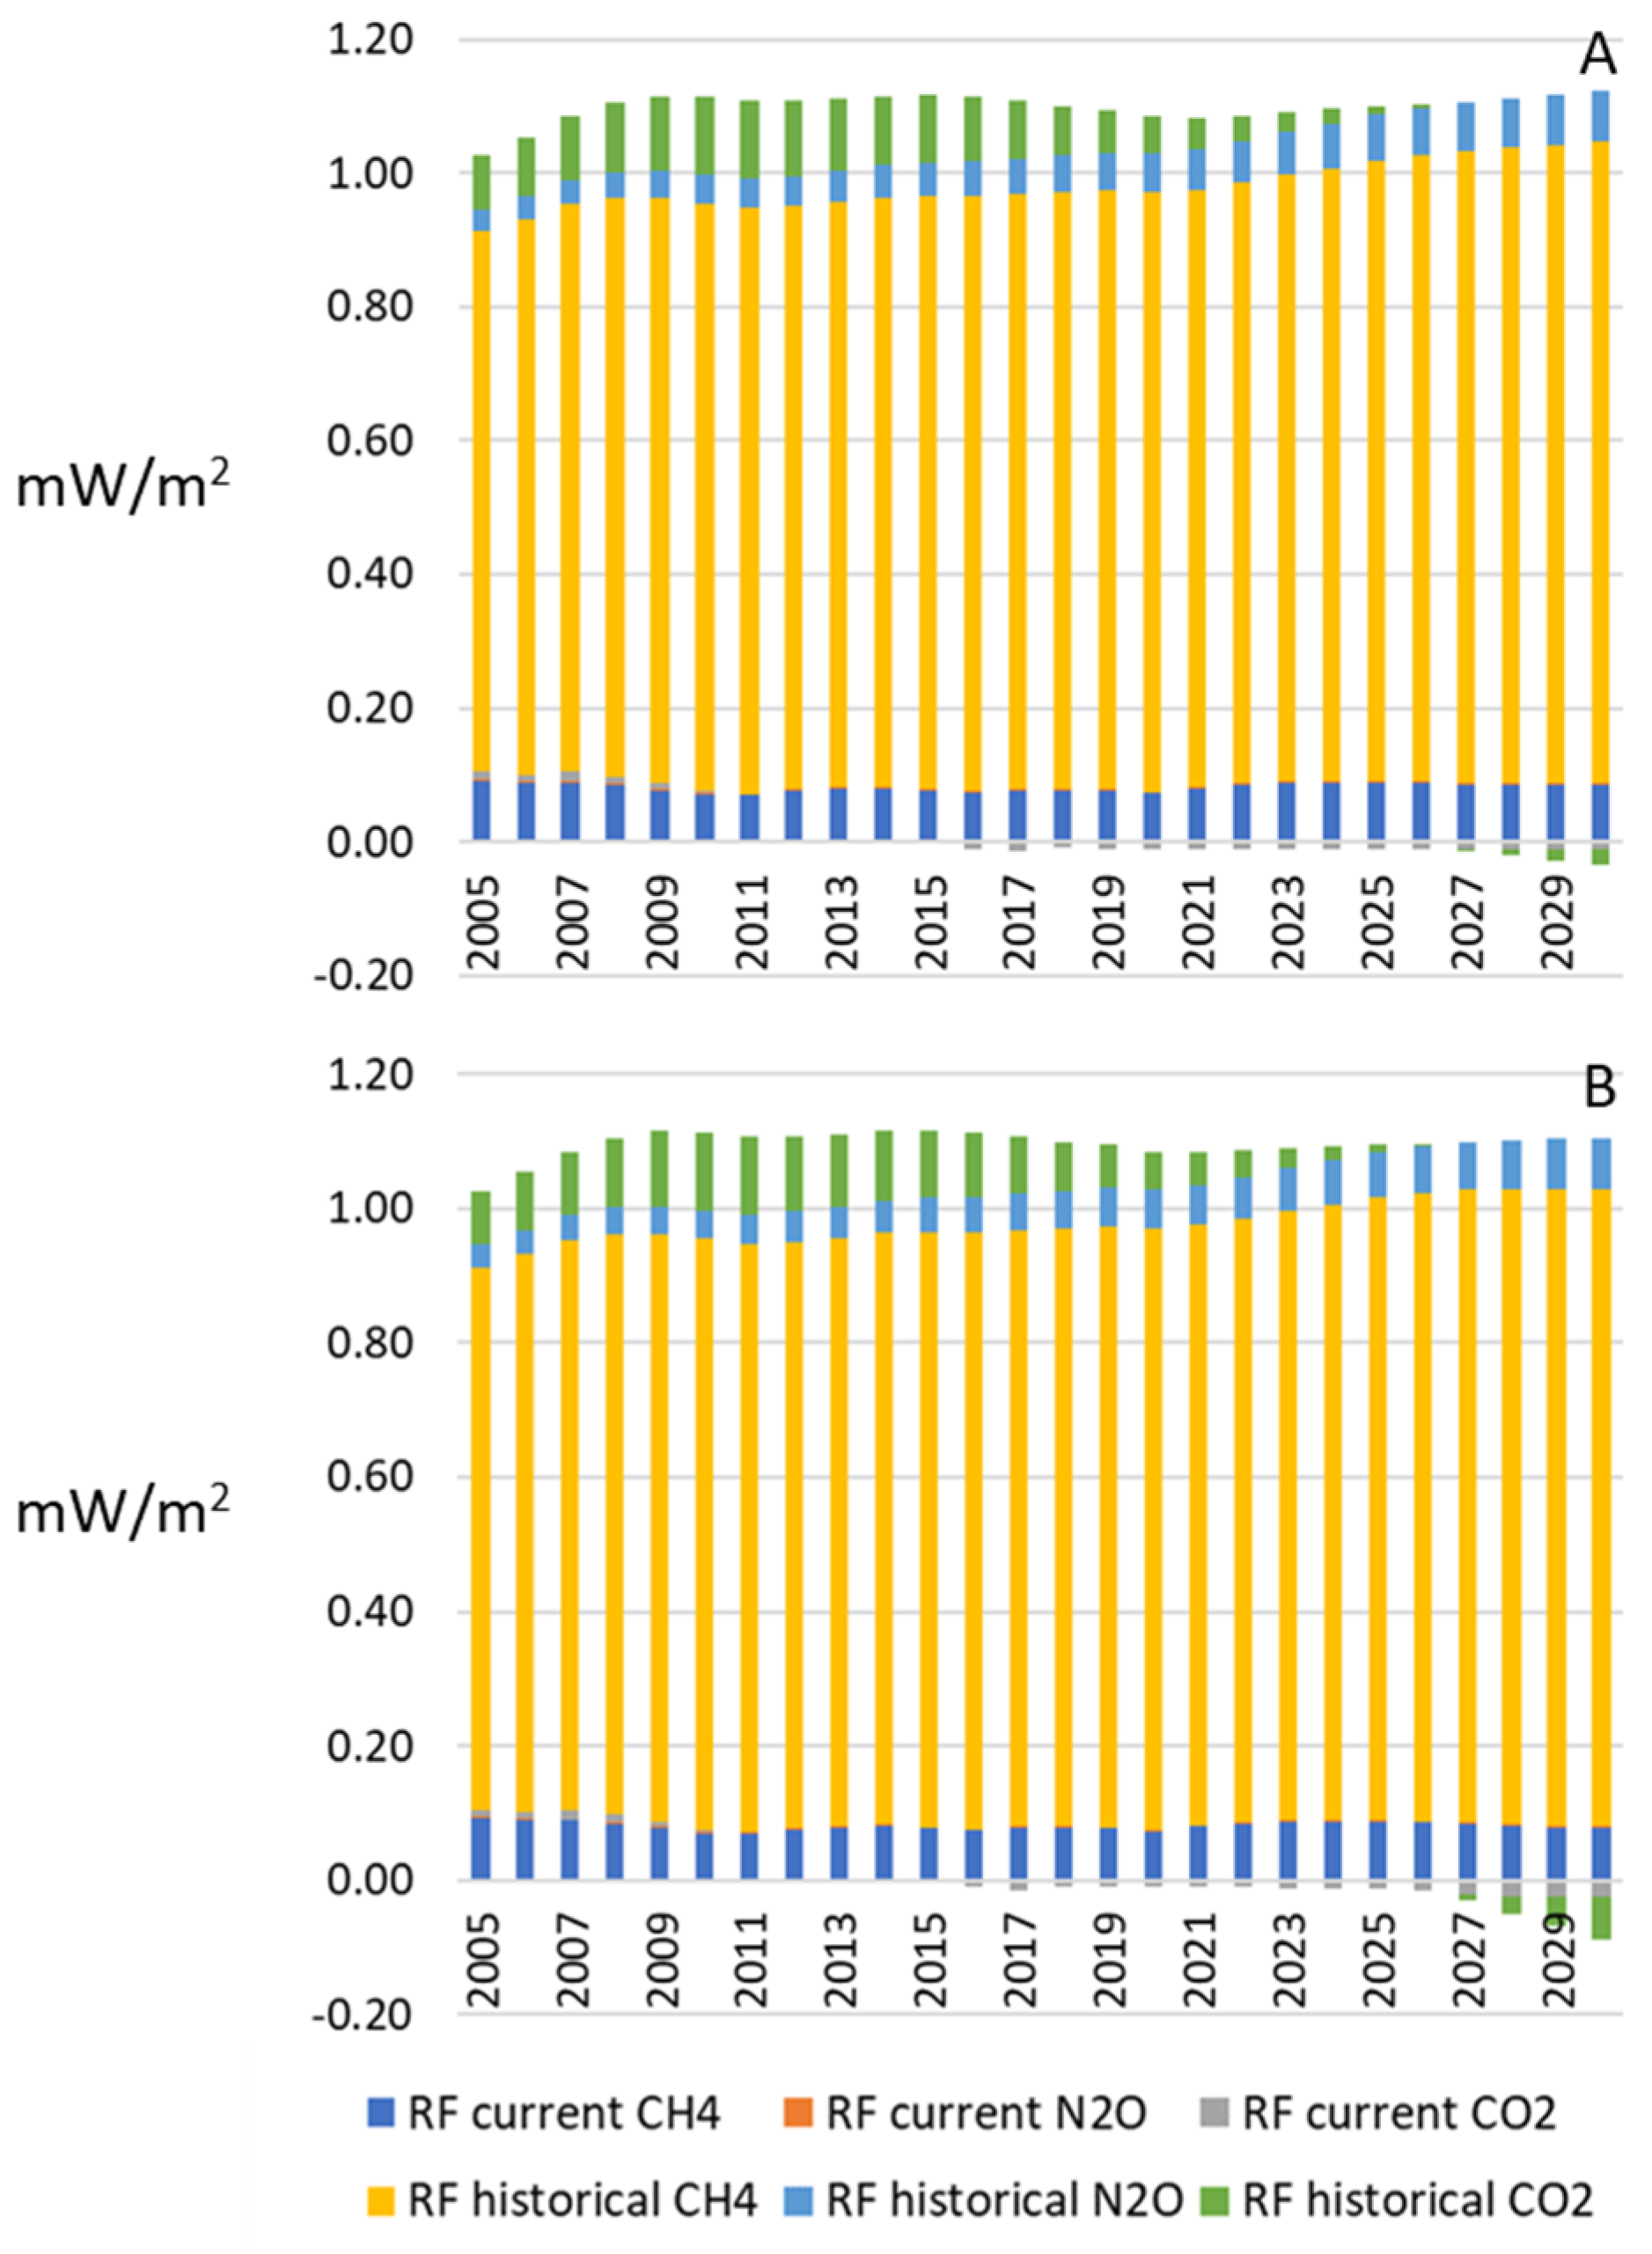
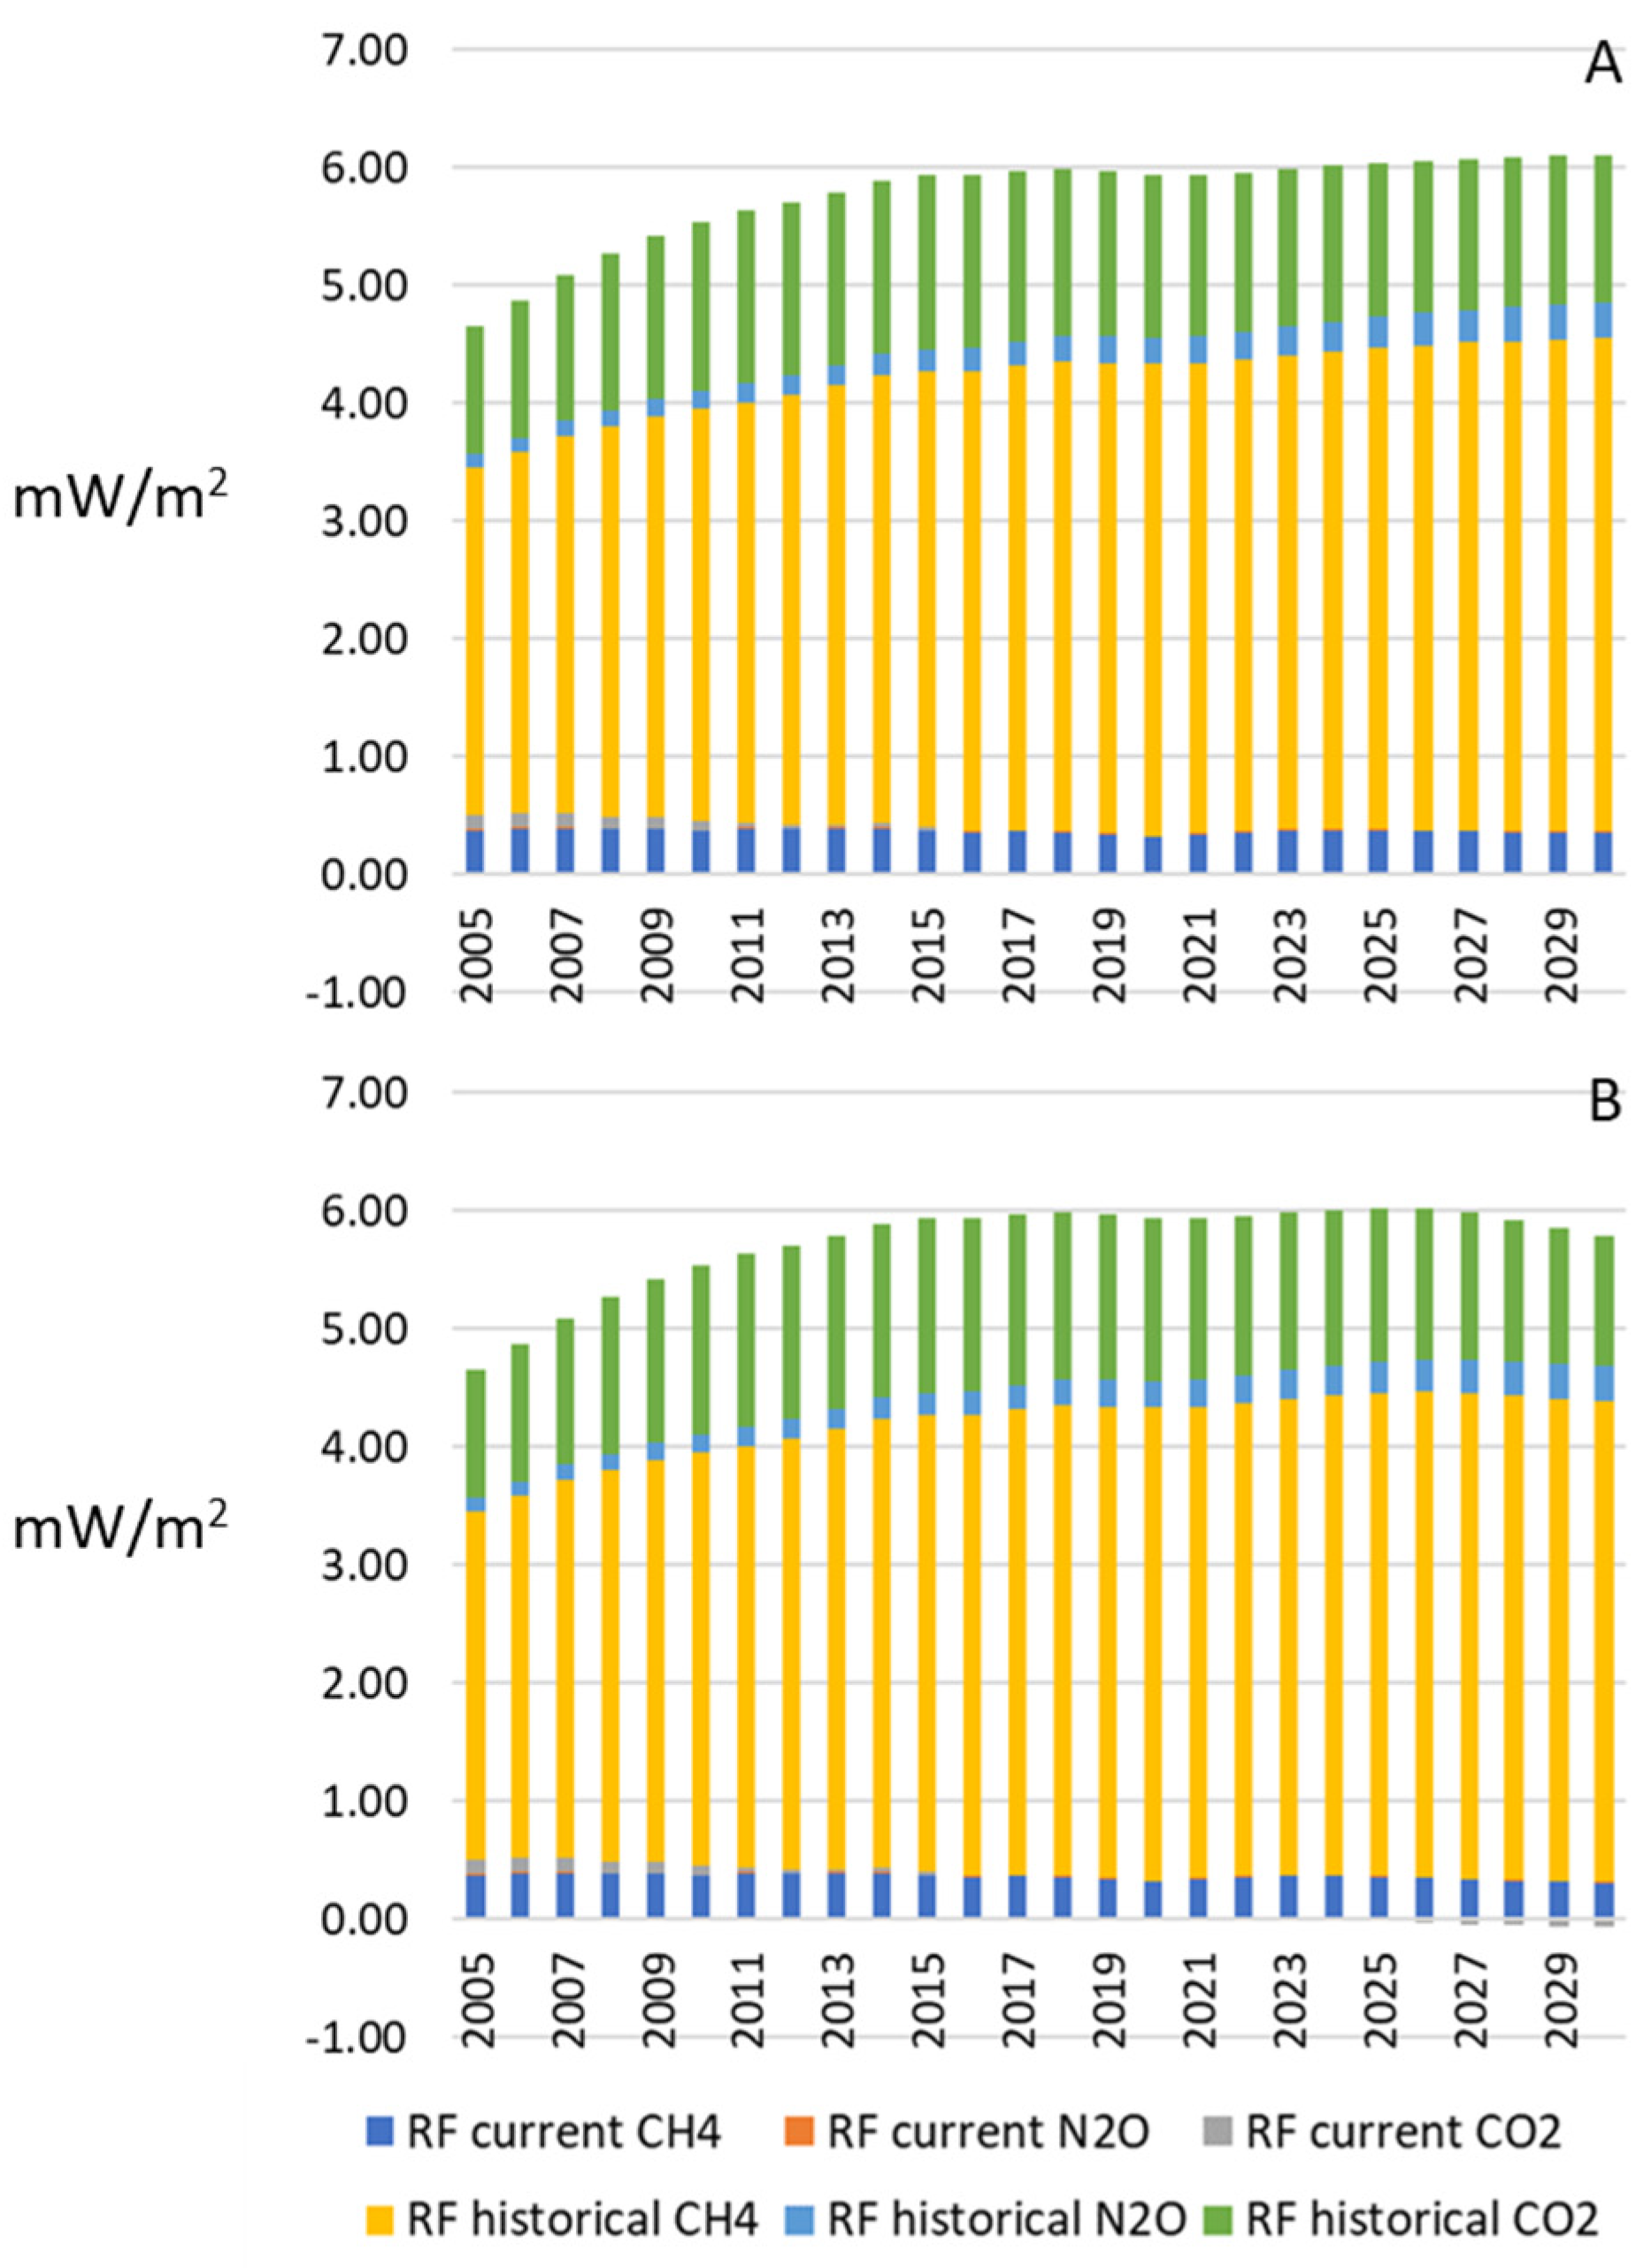
The extrapolated timeseries of GHG emissions were modified according to the interventions described in Table 2. Scenarios were modelled for the business-as-usual baseline (without additional interventions), and for interventions applied individually and collectively. For each scenario, annual radiative forcing footprints were quantified, following [21,22] and using parameters and equations reported in the IPCC 5th Assessment Report [46]. The results were reported in the units milli watts per square meter (mW/m2) of radiative forcing using the reference year of 2005, coinciding with Australia’s Nationally Determined Contribution under Article 4 of the Paris Agreement [47]. For year t, the RF footprint was quantified by summing RF from current year emissions along with the RF from historical emissions remaining in year t, as described in Equation (1). The individual GHG emissions that were included were CO2, CH4, and N2O as these are the major climate forcing emissions associated with agriculture. Other GHGs and non-GHG climate forcing emissions were excluded due to insufficient timeseries data.
RFt = RF associated with emissions in year t + RF associated with historical emissions remaining in year t

3. Results

3.1. Red Meat Industry RF Footprint

The profile of RF over time informs about the trajectory of RF and whether progress is being made to stabilize total cumulative RF, which is a requirement for climate stabilization, as expressed in the Paris Agreement. Considering the Australian red meat industry (beef cattle, sheep and lambs for meat, goats, and domestic processing), the RF footprint increased from 5.71 to 7.09 mW/m2 over the decade 2005 to 2015, after which it plateaued, reaching a local maximum of 7.13 mW/m2 in 2018 and decreasing to 7.07 mW/m2 in 2020 (Figure 1A). With future expansion of the herd and flock, the RF footprint is projected to increase marginally to 7.26 mW/m2 in 2030 under a business-as-usual scenario (a 2.8% increase). In contrast, with the combination of interventions described in Table 2, the RF footprint remains relatively flat, but declines marginally to 6.81 mW/m2 in 2030 (Figure 1B), a decrease of 3.6% from 2020. The reduction in RF footprint relative to the business-as-usual scenario was attributed partly to vegetation management (56.6%) and partly to production system innovations (43.4%) (Table 3). The most impactful production system innovation was improved herd management (culling of unproductive animals, supplementary feeding, improved grazing management, etc.) that contributed almost one quarter of the RF footprint reduction (Table 3). Some of the production system innovations made only a modest contribution to RF footprint reduction in the period to 2030.

3.2. Sheep Meat Sector RF Footprint

Considering the sheep meat sector of the Australian red meat industry (animals for mutton and lamb meat production), the RF footprint plateaued around 2008 when it reached 1.11 mW/m2 (Figure 2A). By 2020, the RF footprint had declined marginally to 1.07 mW/m2. However, with a projected increase in the size of the flock of almost 18% over the next decade (Table 1), the RF footprint is projected to increase marginally by around 1.3% to 1.09 mW/m2 under a business-as-usual scenario (Figure 2A). In contrast, with the combination of interventions described in Table 2, the RF footprint remains relatively flat (Figure 2B), but with an additional decline to 1.02 mW/m2 in 2030, a decrease of 5.3% compared to 2020. The reduction in RF footprint relative to the business-as-usual scenario was attributed mainly to carbon sequestration in trees planted on farms (>70%) (Table 4). Production system innovations contributed the balance, with improved flock management (culling of unproductive animals, supplementary feeding, improved grazing management, etc.) being the most important.

3.3. Beef Cattle Sector RF Footprint

Considering the beef cattle sector of the Australian red meat industry (including feedlot finishing), the RF footprint increased from 4.65 to 5.93 mW/m2 over the decade 2005 to 2015, after which it plateaued, reaching a local maximum of 5.99 mW/m2 in 2018 and decreasing back to 5.94 mW/m2 in 2020 (Figure 3A). With future expansion of the herd, the forecast is expected to be of the order of around 13% over the next decade (Table 1), and the RF footprint is projected to marginally increase by around 2.9% to 6.11 mW/m2 under a business-as-usual scenario (Figure 3A). In contrast, with the combination of interventions described in Table 2, the RF footprint remains relatively flat, but declines marginally to 5.73 mW/m2 in 2030 (Figure 3B), a decrease of 3.5% from 2020. Compared to the business-as-usual scenario, the intervention that made the largest single contribution to reducing the RF footprint was improved herd management (Table 5). Carbon sequestration in trees on farm made the next largest contribution, followed by savannah burning management, underscoring the importance of vegetation management in radiative forcing management.

4. Discussion

The purpose of this study was to explore the pathways for the Australian red meat industry to reach climate neutrality. Here, climate neutrality was assessed using the RF footprint approach and is considered to have been achieved when the footprint has plateaued and there is no additional contribution to radiative forcing, which is a requirement for climate stabilization [12]. This approach differs from carbon neutrality, which, according to the IPCC, is a condition that only applies to a balancing of anthropogenic CO2 emissions and removals [25]. Considering the substantial non-CO2 emissions associated with the red meat industry, such an approach is deemed too limited in scope. The approach to climate neutrality taken in this study also differs from greenhouse gas neutrality, which, according to the IPCC, is a condition that relates to a balancing of metric-weighted anthropogenic emissions and removals [25]. The difficulty with this approach is the requirement for a climate metric that establishes equivalence between different GHGs. As discussed in the Introduction, there is no absolute equivalence in climate impact that can be established between different GHGs, and the equivalency factors vary between different climate metrics. Though the GWP100 climate metric is often used by convention, there is no scientific basis to justify its use in preference to another climate metric, and there are implied value judgements [46]. Furthermore, when organisations commit to GHG neutrality using the GWP100 climate metric, it is not apparent what the impact on future radiative forcing and warming will be as this will depend on the specific basket of GHG emissions involved [48,49,50]. As such, it can be difficult to reconcile metric-weighted GHG emission reports and commitments with the climate stabilization goal of the Paris Agreement, especially where there are substantial short-lived emissions, as in the case of ruminant livestock industries.
As for the Australian red meat industry, it was found that climate neutrality occurred in 2019 when the industry’s RF footprint decreased by 0.02 mW/m2 in that year (Figure 1A). Climate neutrality was sustained again in 2020 when the industry’s RF footprint decreased by a further in 0.04 mW/m2. With the production of sheep and lambs for meat, climate neutrality was achieved in 2010 and has been more or less maintained since then (Figure 2A). With the beef cattle sector, climate neutrality was achieved in 2019 and sustained in 2020 (Figure 3A). A key finding from this study, designed with the initial purpose of exploring pathways to climate neutrality, is that the Australian red meat industry is already climate neutral, with its RF footprint in absolute decline since 2019. The industry has made an historical contribution to the increase in radiative forcing that has led to change in the climate system. However, since 2019, the industry’s contribution to climate change has not increased, and, indeed, has retracted marginally. That said, radiative forcing management is necessary to avoid future increases in RF that are incompatible with climate stabilization. In Australia, the expectation is that flock and herd numbers will increase over the coming decade (Table 1). Under a business-as-usual scenario, increasing livestock numbers are projected to push the RF footprint higher (Figure 1A, Figure 2A, and Figure 3A), thereby not maintaining the current climate-neutral status. However, a combination of climate actions (Table 2), if successfully implemented, have the potential to allow increased production while also allowing further unwinding of the industry’s historical climate impact. An important conclusion is that the industry has the potential to expand its role as a food producer, contributing to needed increases in food production [51,52] while operating within the constraints of climate stabilization.
There is considerable uncertainty associated with the pace at which new technologies and supplements to reduce livestock methane emissions can be developed and adopted [35]. The Australian sheep and beef cattle sectors are diverse, including a wide range of intensive and extensive systems spanning temperate and tropical zones. High-impact feed additives that require daily administration are most feasibly implemented in feedlots and perhaps other production systems where farmers have a high degree of control over feed intake. Delivery techniques to enable implementation in grazing systems are a current research focus [53]. In this study, the approach used was to assume realistic, yet conservative, estimates of adoption and efficacy (Table 2). Overall, feed additives contributed slightly less than 15% of the 2030 reduction in RF footprint compared to business-as-usual (Table 3). This outcome depended substantially on the deployment of feed additives in grazing systems, as the benefit of deployment in feedlots alone is important but limited (Table 3), as shown previously [22]. In comparison, improved herd and flock management was found to contribute more than 26% of the RF footprint reduction in 2030 (Table 3). These measures are closely linked to productivity improvement and as such are expected to have a high rate of adoption. More than 50% of the RF footprint reduction in 2030 was related to vegetation management, especially tree planting on farms (Table 3). In Australia, the livestock industry manages a vast area of land, including more than 280 M ha of grazed native vegetation, more than 40 M ha of grazed modified pastures, and additional areas where mixed farming and crop/pasture rotations are practiced [54]. The potential is therefore enormous, but the carbon sequestration rates are also variable, from shrub and fodder crops with a sequestration potential in the order of 0.7 t CO2/ha/y to trees planted in higher rainfall areas that might achieve between 2 and 4 t CO2/ha/y [55]. The challenge will be to integrate vegetation strategies in a way that enhances overall farm productivity and profitability. Within the 2030 time horizon of this study, breeding for lower enteric methane emissions made little contribution (Table 3). Taken together, the modelled GHG mitigation and sequestration interventions were more than sufficient to achieve climate neutrality, with the projected RF footprint lower in 2030 than in 2020. As such, RF footprint stabilization is likely, even if not all interventions reach the modelled levels of efficacy and adoption.
The RF footprint reports present radiative forcing from current year emissions together with the radiative forcing from historical emissions remaining in the atmosphere [20]. This approach differs from most other approaches to GHG emission reporting and management in that historical emissions are included. The time series approach also provides transparency with respect to the climate impacts of short-lived and long-lived GHGs over time (Figure 1, Figure 2 and Figure 3). This is one of the main criticisms associated with the application of the GWP100 climate metric in the livestock industry. The result obtained using the GWP100 metric describes the integral of radiative forcing over a future 100-year horizon, obscuring the near- and long-term implications [7,8,9,12]. As discussed in the Introduction, the IPCC states that to stabilize the climate, it is necessary to reach net zero CO2 emissions, but the same cannot be said for short-lived biogenic methane [2], where a more or less steady emissions profile is consistent with climate stabilization. The implications for the ruminant livestock industries are enormous. Climate actions that mitigate livestock methane emissions at the expense of increasing CO2 and other long-lived GHG emissions may appear to be beneficial when the GWP100 climate metric is used. However, while such strategies might reduce radiative forcing in the near term, they are adding to long-lived atmospheric CO2 stocks and making the goal of climate stabilization more difficult [14,22]. The RF footprint shares some similarities with the GWP* [23,24,56] and CGTP [57] climate metrics in that it is the rate of change of methane emission that is assessed rather than a pulse. However, a major drawback in the practical use of GWP* and CGTP is the need to discern what is a permanent rate of change in methane emission. The developers of GWP* suggest use of a 20-year time interval, arguing that this smooths out short-term fluctuations in emission rates that may not reflect permanent change [23]. However, in practice, this approach has still been found to present challenges for performance tracking as results can deviate sharply from year to year, complicating interpretation and communication with stakeholders.
For this study, a target of zero increase in RF footprint was used, meaning that the industry no longer contributes to the further development of radiative forcing of the Earth’s atmospheric system, which is contributing to the progression of climate change [58]. However, the RF footprint approach can equally be used to manage industry GHG emissions toward any chosen RF target. In 2011, the total anthropogenic radiative forcing was estimated to have reached 2.3 W/m2 [46]. The RF footprint approach could be used to manage industry radiative forcing in a manner that is consistent with any global radiative forcing target, such as 1.9, 2.6, or 3.4 W/m2. The choice of RF target is ultimately a political decision and separate from the RF footprint calculation methodology. A further consideration is that of equity. It has been argued that climate metrics that are based on the rate of change of methane emissions favour countries that established their herd long ago, and disadvantage new entrants [59]. However, this argument is founded on the assumption that RF management targets need to be identical for all industries and countries and introduces the notion of a fair share of the total global radiative forcing budget. However, equity is a consideration that goes beyond science. As pointed out by Cain et al. [60], climate metrics only exist to inform decision making and policy options. What matters for existing industries is that radiative forcing is managed to avoid escalating climate risks and impacts.

5. Conclusions

In summary, this study has demonstrated, through RF footprint quantification, that it is possible for the Australian red meat industry to continue as a supplier of high-quality protein and even increase output while also managing GHG emissions in a manner consistent with climate stabilization. The increase in production is contingent on successful GHG mitigation and carbon sequestration actions beyond current business-as-usual practices. With projected increases in sheep and beef cattle numbers of 18% and 13%, respectively, the successful implementation of GHG mitigation and sequestration actions has the potential to lower the overall RF footprint by 3.6%. These findings relate to the Australian red meat industry and may not be representative of livestock industries in other regions. In addition, the study only considered radiative forcing and not other environmental or social aspects. In conclusion, greater use of the RF footprint is recommended to inform climate action in the livestock industry. This will avoid unnecessary curtailment of the contribution of livestock to global food systems based on net zero emission strategies, which are applicable to long-lived GHG emissions but fail to represent the radiative forcing characteristics of short-lived GHG emissions like methane.

Funding

This study was funded, in part, by Meat and Livestock Australia (https://www.mla.com.au/), grant number B.CCH.2301, and in part by the Commonwealth Scientific and Industrial Research Organisation, Australia.

Institutional Review Board Statement

Not applicable.

Informed Consent Statement

Not applicable.

Data Availability Statement

All data used in this study are publicly available from the cited sources. Radiative forcing footprints were quantified using parameters and equations publicly available in the IPCC 5th Assessment Report.

Conflicts of Interest

This study was funded, in part, by Meat and Livestock Australia (https://www.mla.com.au/), grant number B.CCH.2301. MLA did not have any role in the analysis or interpretation of results. The decision to publish was made prior to funding and before the results were known. MLA had no role in the preparation of the manuscript.

References

  1. Paris Agreement. Available online: https://unfccc.int/sites/default/files/english_paris_agreement.pdf (accessed on 4 July 2023).
  2. Climate Change Widespread, Rapid, and Intensifying—IPCC. Available online: https://www.ipcc.ch/2021/08/09/ar6-wg1-20210809-pr/ (accessed on 4 July 2023).
  3. Archer, D.; Brovkin, V. The millennial atmospheric lifetime of anthropogenic CO2. Clim. Chang. 2008, 90, 283–297. [Google Scholar] [CrossRef]
  4. Eby, M.; Zickfeld, K.; Montenegro, A.; Archer, D.; Meissner, K.J.; Weaver, A.J. Lifetime of anthropogenic climate change: Millennial time scales of potential CO2 and surface temperature perturbations. J. Clim. 2009, 22, 2501–2511. [Google Scholar] [CrossRef]
  5. Smith, C.; Nicholls, Z.R.J.; Armour, K.; Collins, W.; Forster, P.; Meinshausen, M.; Palmer, M.D.; Watanabe, M. The earth’s energy budget, climate feedbacks, and climate sensitivity supplementary material. In Climate Change 2021: The Physical Science Basis. Contribution of Working Group I to the Sixth Assessment Report of the Intergovernmental Panel on Climate Change; Masson-Delmotte, V., Zhai, P., Pirani, A., Connors, S.L., Péan, C., Berger, S., Caud, N., Chen, Y., Goldfarb, L., Gomis, M.I., Huang, M., Leitzell, K., Lonnoy, E., Matthews, J.B.R., Maycock, T.K., Waterfield, T., Yelekçi, O., Yu, R., Zhou, B., Eds.; Cambridge University Press: Cambridge, UK, 2023; Available online: https://www.ipcc.ch/ (accessed on 22 May 2023).
  6. Tanaka, K.; O’Neill, B.C. The Paris Agreement zero-emissions goal is not always consistent with the 1.5 °C and 2 °C temperature targets. Nat. Clim. Chang. 2018, 8, 319–324. [Google Scholar] [CrossRef]
  7. Shine, K.P. The global warming potential—The need for an interdisciplinary retrial. Clim. Chang. 2009, 96, 467–472. [Google Scholar] [CrossRef]
  8. Allen, M.R.; Fuglestvedt, J.S.; Shine, K.P.; Reisinger, A.; Pierrehumbert, R.T.; Forster, P.M. New use of global warming potentials to compare cumulative and short-lived climate pollutants. Nat. Clim. Chang. 2016, 6, 773–777. [Google Scholar] [CrossRef]
  9. Ocko, I.B.; Hamburg, S.P.; Jacob, D.J.; Keith, D.W.; Keohane, N.O.; Oppenheimer, M.; Roy-Mayhew, J.D.; Schrag, D.P.; Pacala, S.W. Unmask temporal trade-offs in climate policy debates. Science 2017, 356, 492–493. [Google Scholar] [CrossRef] [PubMed]
  10. Lorenz, K.; Lal, R. Agroforestry systems. In Carbon Sequestration in Agricultural Ecosystems; Springer: Cham, Switzerland, 2018; pp. 235–260. [Google Scholar]
  11. Lorenz, K.; Lal, R. Carbon sequestration in grassland soils. In Carbon Sequestration in Agricultural Ecosystems; Springer: Cham, Switzerland, 2018; pp. 175–210. [Google Scholar]
  12. FAO. Methane Emissions in Livestock and Rice Systems—Sources, Quantification, Mitigation and Metrics; Livestock Environmental Assessment and Performance (LEAP) Partnership: Rome, Italy, 2023. [Google Scholar]
  13. del Prado, A.; Manzano, P.; Pardo, G. The role of the European small ruminant dairy sector in stabilising global temperatures: Lessons from GWP* warming-equivalent emission metrics. J. Dairy Res. 2021, 88, 8–15. [Google Scholar] [CrossRef] [PubMed]
  14. del Prado, A.; Lynch, J.; Liu, S.; Ridoutt, B.; Pardo, G.; Mitloehner, F. Opportunities and challenges in using GWP* to report the impact of ruminant livestock on global temperature change. Animal 2023, 17, 100790. [Google Scholar] [CrossRef] [PubMed]
  15. Ridoutt, B. Climate impact of Australian livestock production assessed using the GWP* climate metric. Livest. Sci. 2021, 246, 104459. [Google Scholar] [CrossRef]
  16. Pressman, E.M.; Liu, S.; Mitloehner, F.M. Methane emissions from California dairies estimated using novel climate metric Global Warming Potential Star show improved agreement with modeled warming dynamics. Front. Sustain. Food Syst. 2023, 6, 1072805. [Google Scholar] [CrossRef]
  17. Liu, S.; Proudman, J.; Mitloehner, F.M. Rethinking methane from animal agriculture. CABI Agric. Biosci. 2021, 2, 22. [Google Scholar] [CrossRef]
  18. Place, S.E.; McCabe, C.J.; Mitloehner, F.M. Symposium review: Defining a pathway to climate neutrality for US dairy cattle production. J. Dairy Sci 2022, 105, 8558–8568. [Google Scholar] [CrossRef] [PubMed]
  19. Costa, C., Jr.; Wollenberg, E.; Benitez, M.; Newman, R.; Gardner, N.; Bellone, F. Roadmap for achieving net-zero emissions in global food systems by 2050. Sci. Rep. 2022, 12, 15064. [Google Scholar] [CrossRef] [PubMed]
  20. Ridoutt, B.; Huang, J. When climate metrics and climate stabilization goals do not align. Environ. Sci. Technol. 2019, 53, 14093–14094. [Google Scholar] [CrossRef] [PubMed]
  21. Ridoutt, B. Climate neutral livestock production—A radiative forcing-based climate footprint approach. J. Clean. Prod. 2021, 291, 125260. [Google Scholar] [CrossRef]
  22. Ridoutt, B.; Lehnert, S.A.; Denman, S.; Charmley, E.; Kinley, R.; Dominik, S. Potential GHG emission benefits of Asparagopsis taxiformis feed supplement in Australian beef cattle feedlots. J. Clean. Prod. 2022, 337, 130499. [Google Scholar] [CrossRef]
  23. Allen, M.R.; Shine, K.P.; Fuglestvedt, J.S.; Millar, R.J.; Cain, M.; Frame, D.J.; Macey, A.H. A solution to the misrepresentations of CO2-equivalent emissions of short-lived climate pollutants under ambitious mitigation. npj Clim. Atmos. Sci. 2018, 1, 16. [Google Scholar] [CrossRef]
  24. Cain, M.; Lynch, J.; Allen, M.R.; Fuglestvedt, J.S.; Frame, D.J.; Macey, A.H. Improved calculation of warming-equivalent emissions for short-lived climate pollutants. npj Clim. Atmos. Sci. 2019, 2, 29. [Google Scholar] [CrossRef] [PubMed]
  25. Matthews, J.R.; Möller, V.; van Diemen, R.; Fuglestvedt, J.; Masson-Delmotte, V.; Méndez, C.; Reisinger, A.; Semenov, S. Annex VII: Glossary. In Climate Change 2021: The Physical Science Basis. Contribution of Working Group I to the Sixth Assessment Report of the Intergovernmental Panel on Climate Change; Masson-Delmotte, V., Zhai, P., Pirani, A., Connors, S.L., Péan, C., Berger, S., Caud, N., Chen, Y., Goldfarb, L., Gomis, M.I., et al., Eds.; Cambridge University Press: Cambridge, UK, 2023; Available online: https://www.ipcc.ch/ (accessed on 22 May 2023).
  26. Lynch, J.; Cain, M.; Pierrehumbert, R.; Allen, M. Demonstrating GWP*: A means of reporting warming-equivalent emissions that captures the contrasting impacts of short- and long-lived climate pollutants. Environ. Res. Lett. 2020, 15, 044023. [Google Scholar] [CrossRef]
  27. Australian Greenhouse Emissions Information System. Available online: https://ageis.climatechange.gov.au.xxx (accessed on 4 July 2022).
  28. DISER. National Inventory Report 2020 Volume 1; Australian Government Department of Industry, Science, Energy and Resources: Canberra, Australia, 2022.
  29. DISER. National Inventory Report 2020 Volume 2; Australian Government Department of Industry, Science, Energy and Resources: Canberra, Australia, 2022.
  30. Wiedemann, S.G.; Ledgard, S.F.; Henry, B.K.; Yan, M.J.; Mao, N.; Russell, S.J. Application of life cycle assessment to sheep production systems: Investigating co-production of wool and meat using case studies from major global producers. Int. J. Life Cycle Assess. 2015, 20, 463–476. [Google Scholar] [CrossRef]
  31. Wiedemann, S.; McGahan, E.; Murphy, C.; Yan, M. Resource use and environmental impacts from beef production in eastern Australia investigated using life cycle assessment. Anim. Prod. Sci. 2016, 56, 882–894. [Google Scholar] [CrossRef]
  32. Wiedemann, S.; Davis, R.; McGahan, E.; Murphy, C.; Redding, M. Resource use and greenhouse gas emissions from grain-finishing beef cattle in seven Australian feedlots: A life cycle assessment. Anim. Prod. Sci. 2017, 57, 1149–1162. [Google Scholar] [CrossRef]
  33. All Energy. 2020 Environmental Performance Review (EPR) for the Red Meat Processing (RMP) Industry; Australian Meat Processor Corporation and Meat & Livestock Australia: North Sydney, Australia, 2021. [Google Scholar]
  34. Ridoutt, B. Greenhouse Gas Footprint of the Australian Red Meat Production and Processing Sectors 2020; Meat & Livestock Australia: North Sydney, Australia, 2022. [Google Scholar]
  35. Hegarty, R.S.; Passetti, R.A.; Dittmer, K.M.; Wang, Y.; Shelton, S.W.; Emmet-Booth, J.; Wollenberg, E.; McAllister, T.; Leahy, S.; Beauchemin, K.; et al. An Evaluation of Emerging Feed Additives to Reduce Methane Emissions from Livestock; A report coordinated by Climate Change, Agriculture and Food Security (CCAFS) and the New Zealand Agricultural Greenhouse Gas Research Centre (NZAGRC) Initiative of the Global Research Alliance (GRA). 2021. Available online: https://globalresearchalliance.org/wp-content/uploads/2021/12/An-evaluation-of-evidence-for-efficacy-and-applicability-of-methane-inhibiting-feed-additives-for-livestock-FINAL (accessed on 22 August 2022).
  36. Black, J.L.; Davison, T.M.; Box, I. Methane emissions from ruminants in Australia: Mitigation potential and applicability of mitigation strategies. Animals 2021, 11, 951. [Google Scholar] [CrossRef] [PubMed]
  37. Almeida, A.K.; Hegarty, R.S.; Cowie, A. Meta-analysis quantifying the potential of dietary additives and rumen modifiers for methane mitigation in ruminant production systems. Anim. Nutr. 2021, 7, 1219–1230. [Google Scholar] [CrossRef] [PubMed]
  38. Fouts, J.Q.; Honan, M.C.; Roque, B.M.; Tricarico, J.M.; Kebreab, E. Enteric methane mitigation interventions. Transl. Anim. Sci. 2022, 6, txac041. [Google Scholar] [CrossRef] [PubMed]
  39. Machado, L.; Magnusson, M.; Paul, N.A.; de Nys, R.; Tomkins, N. Effects of marine and freshwater macroalgae on in vitro total gas and methane production. PLoS ONE 2014, 9, e85289. [Google Scholar]
  40. Brooke, C.G.; Roque, B.M.; Shaw, C.; Najafi, N.; Gonzalez, M.; Pfefferlen, A.; De Anda, V.; Ginsburg, D.W.; Harden, M.C.; Nuzhdin, S.V.; et al. Methane reduction potential of two Pacific coast macroalgae during in vitro ruminant fermentation. Front. Mar. Sci. 2020, 7, 561. [Google Scholar] [CrossRef]
  41. Kinley, R.D.; de Nys, R.; Vucko, M.J.; Machado, L.; Tomkins, N.W. The red macroalgae Asparagopsis taxiformis is a potent natural antimethanogenic that reduces methane production during in vitro fermentation with rumen fluid. Anim. Prod. Sci. 2016, 56, 282–289. [Google Scholar] [CrossRef]
  42. Roque, B.M.; Venegas, M.; Kinley, R.D.; de Nys, R.; Duarte, T.L.; Yang, X.; Kebreab, E. Red seaweed (Asparagopsis taxiformis) supplementation reduces enteric methane by over 80 percent in beef steers. PLoS ONE 2021, 16, e0247820. [Google Scholar] [CrossRef]
  43. Kinley, R.D.; Martinez-Fernandez, G.; Matthews, M.K.; de Nys, R.; Magnusson, M.; Tomkins, N.W. Mitigating the carbon footprint and improving productivity of ruminant livestock agriculture using a red seaweed. J. Clean. Prod. 2020, 259, 120836. [Google Scholar] [CrossRef]
  44. Carbon Storage. Available online: https://www.mla.com.au/research-and-development/Environment-sustainability/carbon-neutral-2030-rd/carbon-storage/ (accessed on 1 September 2022).
  45. Industry GHG Emissions Avoidance. Available online: https://www.mla.com.au/research-and-development/Environment-sustainability/carbon-neutral-2030-rd/industry-ghg-emissions-avoidance/ (accessed on 1 September 2022).
  46. Myhre, G.; Shindell, D.; Bréon, F.-M.; Collins, W.; Fuglestvedt, J.; Huang, J.; Koch, D.; Lamarque, J.-F.; Lee, D.; Mendoza, B.; et al. Chapter 8 Anthropogenic and natural radiative forcing. In Climate Change 2013: The Physical Science Basis. Contribution of Working Group I to the Fifth Assessment Report of the Intergovernmental Panel on Climate Change; Stocker, T.F., Qin, D., Plattner, G.-K., Tignor, M., Allen, S.K., Boschung, J., Nauels, A., Xia, Y., Bex, V., Midgley, P.M., Eds.; Cambridge University Press: Cambridge, UK, 2013; pp. 659–740. [Google Scholar]
  47. Australia’s Nationally Determined Contribution. Available online: https://unfccc.int/documents/510662 (accessed on 7 July 2023).
  48. Fuglestvedt, J.; Rogelj, J.; Millar, R.J.; Allen, M.; Boucher, O.; Cain, M.; Forster, P.M.; Kriegler, E.; Shindell, D. Implications of possible interpretations of ‘greenhouse gas balance’ in the Paris Agreement. Phil. Trans. R. Soc. A 2018, 376, 20160445. [Google Scholar] [CrossRef] [PubMed]
  49. Tanaka, K.; Johansson, D.J.A.; O’Neill, B.C.; Fuglestvedt, J.S. Emission metrics under the 2 °C climate stabilization target. Clim. Chang. 2013, 117, 933–941. [Google Scholar] [CrossRef]
  50. Allen, M.; Tanaka, K.; Macey, A.; Cain, M.; Jenkins, S.; Lynch, J.; Smith, M. Ensuring that offsets and other internationally transferred mitigation outcomes contribute effectively to limiting global warming. Environ. Res. Lett. 2021, 16, 074009. [Google Scholar] [CrossRef] [PubMed]
  51. Bodirsky, B.L.; Rolinski, S.; Biewald, A.; Isabelle, W.; Alexander, P.; Hermann, L.-C. Global food demand scenarios for the twenty first century. PLoS ONE 2015, 10, e0139201. [Google Scholar]
  52. van Dijk, M.; Morley, T.; Rau, M.L.; Saghai, Y. A meta-analysis of projected global food demand and population at risk of hunger for the period 2010–2050. Nat. Food 2021, 2, 494–501. [Google Scholar] [CrossRef] [PubMed]
  53. Reducing Methane from Livestock. Available online: https://www.dcceew.gov.au/climate-change/emissions-reduction/agricultural-land-sectors/livestock (accessed on 19 July 2023).
  54. Snapshot of Australian Agriculture. 2023. Available online: https://www.agriculture.gov.au/abares/products/insights/snapshot-of-australian-agriculture (accessed on 19 July 2023).
  55. Mayberry, D.; Bartlett, H.; Moss, J.; Davison, T.; Herrero, M. Pathways to carbon-neutrality for the Australian red meat sector. Agric. Syst. 2019, 175, 13–21. [Google Scholar] [CrossRef]
  56. Smith, M.A.; Cain, M.; Allen, M.R. Further improvement of warming-equivalent emissions calculation. npj Clim. Atmos. Sci. 2021, 4, 19. [Google Scholar] [CrossRef]
  57. Collins, W.J.; Frame, D.J.; Fuglestvedt, J.S.; Shine, K.P. Stable climate metrics for emissions of short and long-lived species—Combining steps and pulses. Environ. Res. Lett. 2020, 15, 024018. [Google Scholar] [CrossRef]
  58. Skeie, R.B.; Berntsen, T.K.; Myhre, G.; Tanaka, K.; Kvalevåg, M.M.; Hoyle, C.R. Anthropogenic radiative forcing time series from pre-industrial times until 2010. Atmos. Chem. Phys. 2011, 11, 11827–11857. [Google Scholar] [CrossRef]
  59. Rogelj, J.; Schleussner, C.F. Unintentional unfairness when applying new greenhouse gas emissions metrics at country level. Environ. Res. Lett. 2019, 14, 11403. [Google Scholar] [CrossRef]
  60. Cain, M.; Shine, K.; Frame, D.; Lynch, J.; Macey, A.; Pierrehumbert, R.; Allen, M. Comment on ‘Unintentional unfairness when applying new greenhouse gas emissions metrics at country level’. Environ. Res. Lett. 2021, 16, 068001. [Google Scholar] [CrossRef]
Figure 1. Australian red meat industry radiative forcing (RF) footprint (mW/m2) under (A) a business-as-usual scenario, and (B) with the adoption of GHG mitigation and sequestration actions. Historical data 2005 to 2020. Projected data from 2021. Each annual RF footprint comprises RF from current year emissions along with RF from historical emissions that are remaining.
Methane 03 00022 g001
Figure 2. Australian sheep meat sector (mutton, lamb) radiative forcing (RF) footprint (mW/m2) under (A) a business-as-usual scenario, and (B) with adoption of GHG mitigation and sequestration actions. Historical data 2005 to 2020. Projected data from 2021. Each annual RF footprint comprises RF from current year emissions along with RF from historical emissions that are remaining.
Methane 03 00022 g002
Figure 3. Australian beef cattle sector (including feedlot finishing) radiative forcing (RF) footprint (mW/m2) under (A) a business-as-usual scenario, and (B) with adoption of GHG mitigation and sequestration actions. Historical data 2005 to 2020. Projected data from 2021. Each annual RF footprint comprises RF from current year emissions along with RF from historical emissions that are remaining.
Methane 03 00022 g003
Table 1. Livestock and production forecasts for the Australian red meat industry.
YearGoats
‘000 Head
Sheep
(Incl. Lambs)
‘000 Head
Cattle
(Pasture)
‘000 Head
Cattle
(Feedlot)
M Head Days
Processing—Beef Cattle
‘000 t HSCW 1
Processing—Mutton/Lamb
‘000 t HSCW 1
202046066,67021,2283562083658
202146073,54522,5123481872663
202246079,19623,7813761956703
202346082,03624,7473882162746
202446082,61624,8883952295734
202546083,37624,6833962330742
202646081,82224,4223972347748
202746080,33324,1443972361755
202846078,84223,8843982377762
202946078,65423,8403992392768
203046078,52923,9054012420774
1 Hot Standard Carcass Weight.
Table 2. GHG mitigation and sequestration interventions.
InterventionSectorEfficacyAdoption
(Initial)
Adoption
(2030)
Notes
High-impact feed additivesFeedlot49%2023—5%80%Includes Bovaer® (3-NOP) and macroalgae-derived additives. Efficacy refers to enteric methane reduction. Potential productivity impacts, but likely small and uncertain.
High-impact feed additivesGrazing11%2026—2%30%Methane yield reduction less for animals on forage diets and administration likely to be sub-optimal (15–30% of efficacy in feedlots).
Other feed additivesFeedlot10%2023—2%10%Includes tannin extracts, saponins, grape marc, etc. Methane yield reduction typically <15%. Potential impact on feed digestibility and growth, but likely small.
Other feed additivesBeef cattle (grazing)5%0%0%Due to low efficacy, it is not envisaged that these products will be widely adopted in grazing systems before 2030.
Other feed additivesSheep (grazing)1%2023—2%10%Grape marc might have limited potential for supplemental feeding of sheep in southern Australia located in proximity to wineries (0.10 × 10% of year).
Leucaena forage cropBeef cattle (grazing)2%2023—2%20%Methane yield reduction is generally less than 15%, applicable to 20% of Australian beef cattle herd (0.10 × 20%).
Desmanthus forage cropBeef cattle (grazing)4%2023—2%20%Methane yield reduction is generally less than 15%, applicable to 40% of Australian beef cattle herd (0.10 × 40%).
Breeding for lower methaneGrazing0.25%/y2023—1%3%Estimated reduction of 4–8% achievable over 20 years, may be constrained by impacts on productivity traits (5%/20 years). Adoption may be low due to testing costs.
Trees on farmGrazing25 MT/y2023—5%100%Integration of shade and shelterbelts on 10 M ha (southern Aust focus) of available 355 million ha of grazing area nationally, storing more than 25MT CO2 per annum.
Soil carbon storageBeef cattle (grazing)7.8 MT/y2023—5%100%Soil carbon storage increased via a variety of means, including planting of leguminous forage crops, fertilization of pastures, and the transition of cropland to permanent pasture. Soil carbon storage levels in 30% of grazing lands increased by 50–100 kg CO2/ha/year (520 M ha × 30% × 50 kg/ha/yr).
Savannah burning managementBeef cattle (grazing)10.7 MT/y2023—5%100%More than 40 million ha of cattle grazing land can adopt savannah burning mgmt. 0.044 t CO2e/ha/y from avoided CH4 and N2O emissions due to less intense burning. 0.22 t/CO2e/ha/y from additional carbon sequestration in woody biomass.
Herd managementBeef cattle (grazing)15%2023—5%80%Activities including the culling of unproductive animals, supplementary feeding, and improved grazing management. Variable, but 15% reduction in methane feasible. Adoption high due to productivity co-benefits
Flock managementSheep (grazing)10%2023—5%50%Variable, but 10% reduction in methane feasible. Realistic productivity co-benefits.
Table 3. Contribution to projected RF footprint reduction in the Australian red meat industry.
Intervention%
Trees on farm29.6
Improved herd management23.7
Savannah burning management15.6
Soil carbon storage11.4
Feed additives—beef cattle pasture7.4
Feed additives—beef cattle feedlot5.3
Improved flock management2.6
Forage crops2.3
Feed additives—sheep pasture2.0
Breeding for lower methane 0.1
Table 4. Contribution to projected RF footprint reduction in the Australian sheep meat sector.
Intervention%
Trees on farm71.2
Improved flock management16.3
Feed additives—sheep pasture12.3
Breeding for lower methane 0.2
Table 5. Contribution to projected RF footprint reduction in the Australian beef cattle sector.
Intervention%
Improved herd management28.2
Trees on farm21.7
Savannah burning management18.5
Soil carbon storage13.5
Feed additives—beef cattle pasture8.8
Feed additives—beef cattle feedlot6.4
Forage crops2.8
Breeding for lower methane 0.1
Disclaimer/Publisher’s Note: The statements, opinions and data contained in all publications are solely those of the individual author(s) and contributor(s) and not of MDPI and/or the editor(s). MDPI and/or the editor(s) disclaim responsibility for any injury to people or property resulting from any ideas, methods, instructions or products referred to in the content.

