Article

Genetical and Biochemical Basis of Methane Monooxygenases of Methylosinus trichosporium OB3b in Response to Copper

1
Department of Chemical and Biological Engineering, South Dakota School of Mines and Technology, Rapid City, SD 57701, USA
2
BuG ReMeDEE Consortium, South Dakota School of Mines and Technology, Rapid City, SD 57701, USA
3
Data Driven Material Discovery Center for Bioengineering Innovation, South Dakota School of Mines and Technology, Rapid City, SD 57701, USA
4
Department of Microbiology and Plant Biology, University of Oklahoma, Norman, OK 73019, USA
5
Department of Civil and Environmental Engineering, South Dakota School of Mines and Technology, Rapid City, SD 57701, USA
6
Faculty of Science, Universiti Teknologi Malaysia, Skudai 81310, Johor, Malaysia
*
Author to whom correspondence should be addressed.
Methane 2024, 3(1), 103-121; https://doi.org/10.3390/methane3010007
Submission received: 26 November 2023 / Revised: 21 January 2024 / Accepted: 2 February 2024 / Published: 20 February 2024
(This article belongs to the Special Issue Trends in Methane-Based Biotechnology)

Abstract

:
Over the past decade, copper (Cu) has been recognized as a crucial metal in the differential expression of soluble (sMMO) and particulate (pMMO) forms of methane monooxygenase (MMO) through a mechanism referred to as the “Cu switch”. In this study, we used Methylosinus trichosporium OB3b as a model bacterium to investigate the range of Cu concentrations that trigger the expression of sMMO to pMMO and its effect on growth and methane oxidation. The Cu switch was found to be regulated within Cu concentrations from 3 to 5 µM, with a strict increase in the methane consumption rates from 3.09 to 3.85 µM occurring on the 6th day. Our findings indicate that there was a decrease in the fold changes in the expression of methanobactin (Mbn) synthesis gene (mbnA) with a higher Cu concentration, whereas the Ton-B siderophore receptor gene (mbnT) showed upregulation at all Cu concentrations. Furthermore, the upregulation of the di-heme enzyme at concentrations above 5 µM Cu may play a crucial role in the copper switch by increasing oxygen consumption; however, the role has yet not been elucidated. We developed a quantitative assay based on the naphthalene–Molisch principle to distinguish between the sMMO- and pMMO-expressing cells, which coincided with the regulation profile of the sMMO and pMMO genes. At 0 and 3 µM Cu, the naphthol concentration was higher (8.1 and 4.2 µM, respectively) and gradually decreased to 0 µM naphthol when pMMO was expressed and acted as the sole methane oxidizer at concentrations above 5 µM Cu. Using physical protein–protein interaction, we identified seven transporters, three cell wall biosynthesis or degradation proteins, Cu resistance operon proteins, and 18 hypothetical proteins that may be involved in Cu toxicity and homeostasis. These findings shed light on the key regulatory genes of the Cu switch that will have potential implications for bioremediation and biotechnology applications.

Graphical Abstract

1. Introduction

Aerobic methanotrophs are Gram-negative bacteria that utilize methane as the sole source of carbon for their energy fulfillment [1]. They are mainly found at the oxic–anoxic interface of aquatic environments (e.g., terrestrial, marine, and freshwater), where they oxidize methane produced by methanogens in anoxic zones [2]. Methanotrophs possess a complex metalloenzyme called methane monooxygenase (MMO), which catalyzes the oxidation of methane to methanol [3]. MMO comprises two distinct forms: a cytosolic form termed sMMO (soluble methane monooxygenase) and an integral membrane-associated form called pMMO (particulate methane monooxygenase) [4]. Although sMMO is absent in many methanotrophs, pMMO is present in almost all methanotrophs except for the members of the genera Methylocella and Methyloferulla [5].
Certain methanotrophs, for instance, Methylosinus trichosporium OB3b and Methylococcus capsulatus BATH, exhibit both sMMO and pMMO [6]. The switch between the expression of each type of MMO is primarily controlled by the copper (Cu)–biomass ratio. In the general consensus, sMMOs are upregulated under a very low Cu–biomass ratio (≤0.85 µM Cu) [7,8]. On the other hand, the canonical methanobactin-mediated “Cu switch” requires a higher Cu–biomass ratio (≤50 µM Cu) to highly upregulate the expression of pMMO, as pMMO also shows expression under low copper concentrations [8,9]. At specific concentrations of Cu, both sMMO and pMMO are expressed through this switching mechanism. However, the range of the Cu–biomass ratio responsible for such expression generally varies with the methanotrophic genera under study [9] and can even be species-specific [10]. Even for M. trichosporium OB3b, which is one of best-studied Type II methanotrophs, despite the copper switch being studied across years of research, the range of Cu concentrations that shift the expression of sMMO towards pMMO varies significantly from one report to another. For instance, one group reported that sMMO in M. trichosporium OB3b was suppressed when the Cu concentration was greater than 0.8 µM [7], whereas in another report, the shift was at 0.13 µM Cu within the same organism in nitrate minimal salt media (NMS) [11,12,13]. Therefore, the mechanism of this shift still requires further investigation.
sMMO-mediated methane oxidation occurs at a bis-hydroxo-bridged di-iron center located within the hydroxylase subunit of the enzyme. sMMO is composed of a hydroxylase, a reductase, and a regulatory subunit encoded by the six-gene sMMO operon (mmoXYBZDC) [14]. Methane oxidation by pMMO is controlled by two to four mononuclear Cu centers [15,16]. However, there is some disagreement regarding the distribution of Cu centers within the pMMO subunits α, β, and γ (encoded by the pmoCAB operon), with several competing models [17,18,19]. It is important to mention here that although the mmoD gene (part of the sMMO operon) is reported to participate in sMMO activity, the core genes responsible for the switch are not well understood [20]. Even the cop operon, which serves as the Cu storage, has been shown to have no role in the Cu switch and Cu uptake in methanotrophs [21]. Functionally, methanotrophs express methanobactin, a Cu-binding molecule (a chalkophore with a low molecular mass <1200 Da) [22], to sense and chelate Cu from the environment to enable the coordination of Cu with the active sites of pMMO. Genomic data suggest that methanobactin is commonly produced by methanotrophic genera such as Methylosinus and Methylocystis [23]. Although the operon structures of these species are known, the operon features and activation mechanism remain poorly understood [24,25,26]. Additionally, there are conflicting models for the Cu switch, including in Methylosinus trichosporium OB3b, which is one of best-studied Type II methanotrophs [22,27].
Considering the fact that both sMMO and pMMO have divergent features in terms of affinity towards certain substrates and kinetics, comprehending the basis of the copper switch is significant to exert greater control over methanotrophic activity. Therefore, the focus of the present study is to establish the relationship between the range of Cu concentration responsible for the copper switch and the associated expression of MMOs within M. trichosporium OB3b. Specifically, this study aims to investigate the role of varying Cu concentrations at a constant iron (Fe) concentration on OB3b growth, the rates of methane oxidation, the variation in oxygen consumption, the expression of MMOs (sMMO, and pMMO), and methanobactin genes (including the hypothetical protein upstream of mbnA). Finally, in this paper, we discuss the development of a new qualitative whole-cell assay protocol based on the underlying principle of a naphthalene ortho-dianisidine assay that can measure sMMO activity based on the naphthol concentration.

2. Results and Discussion

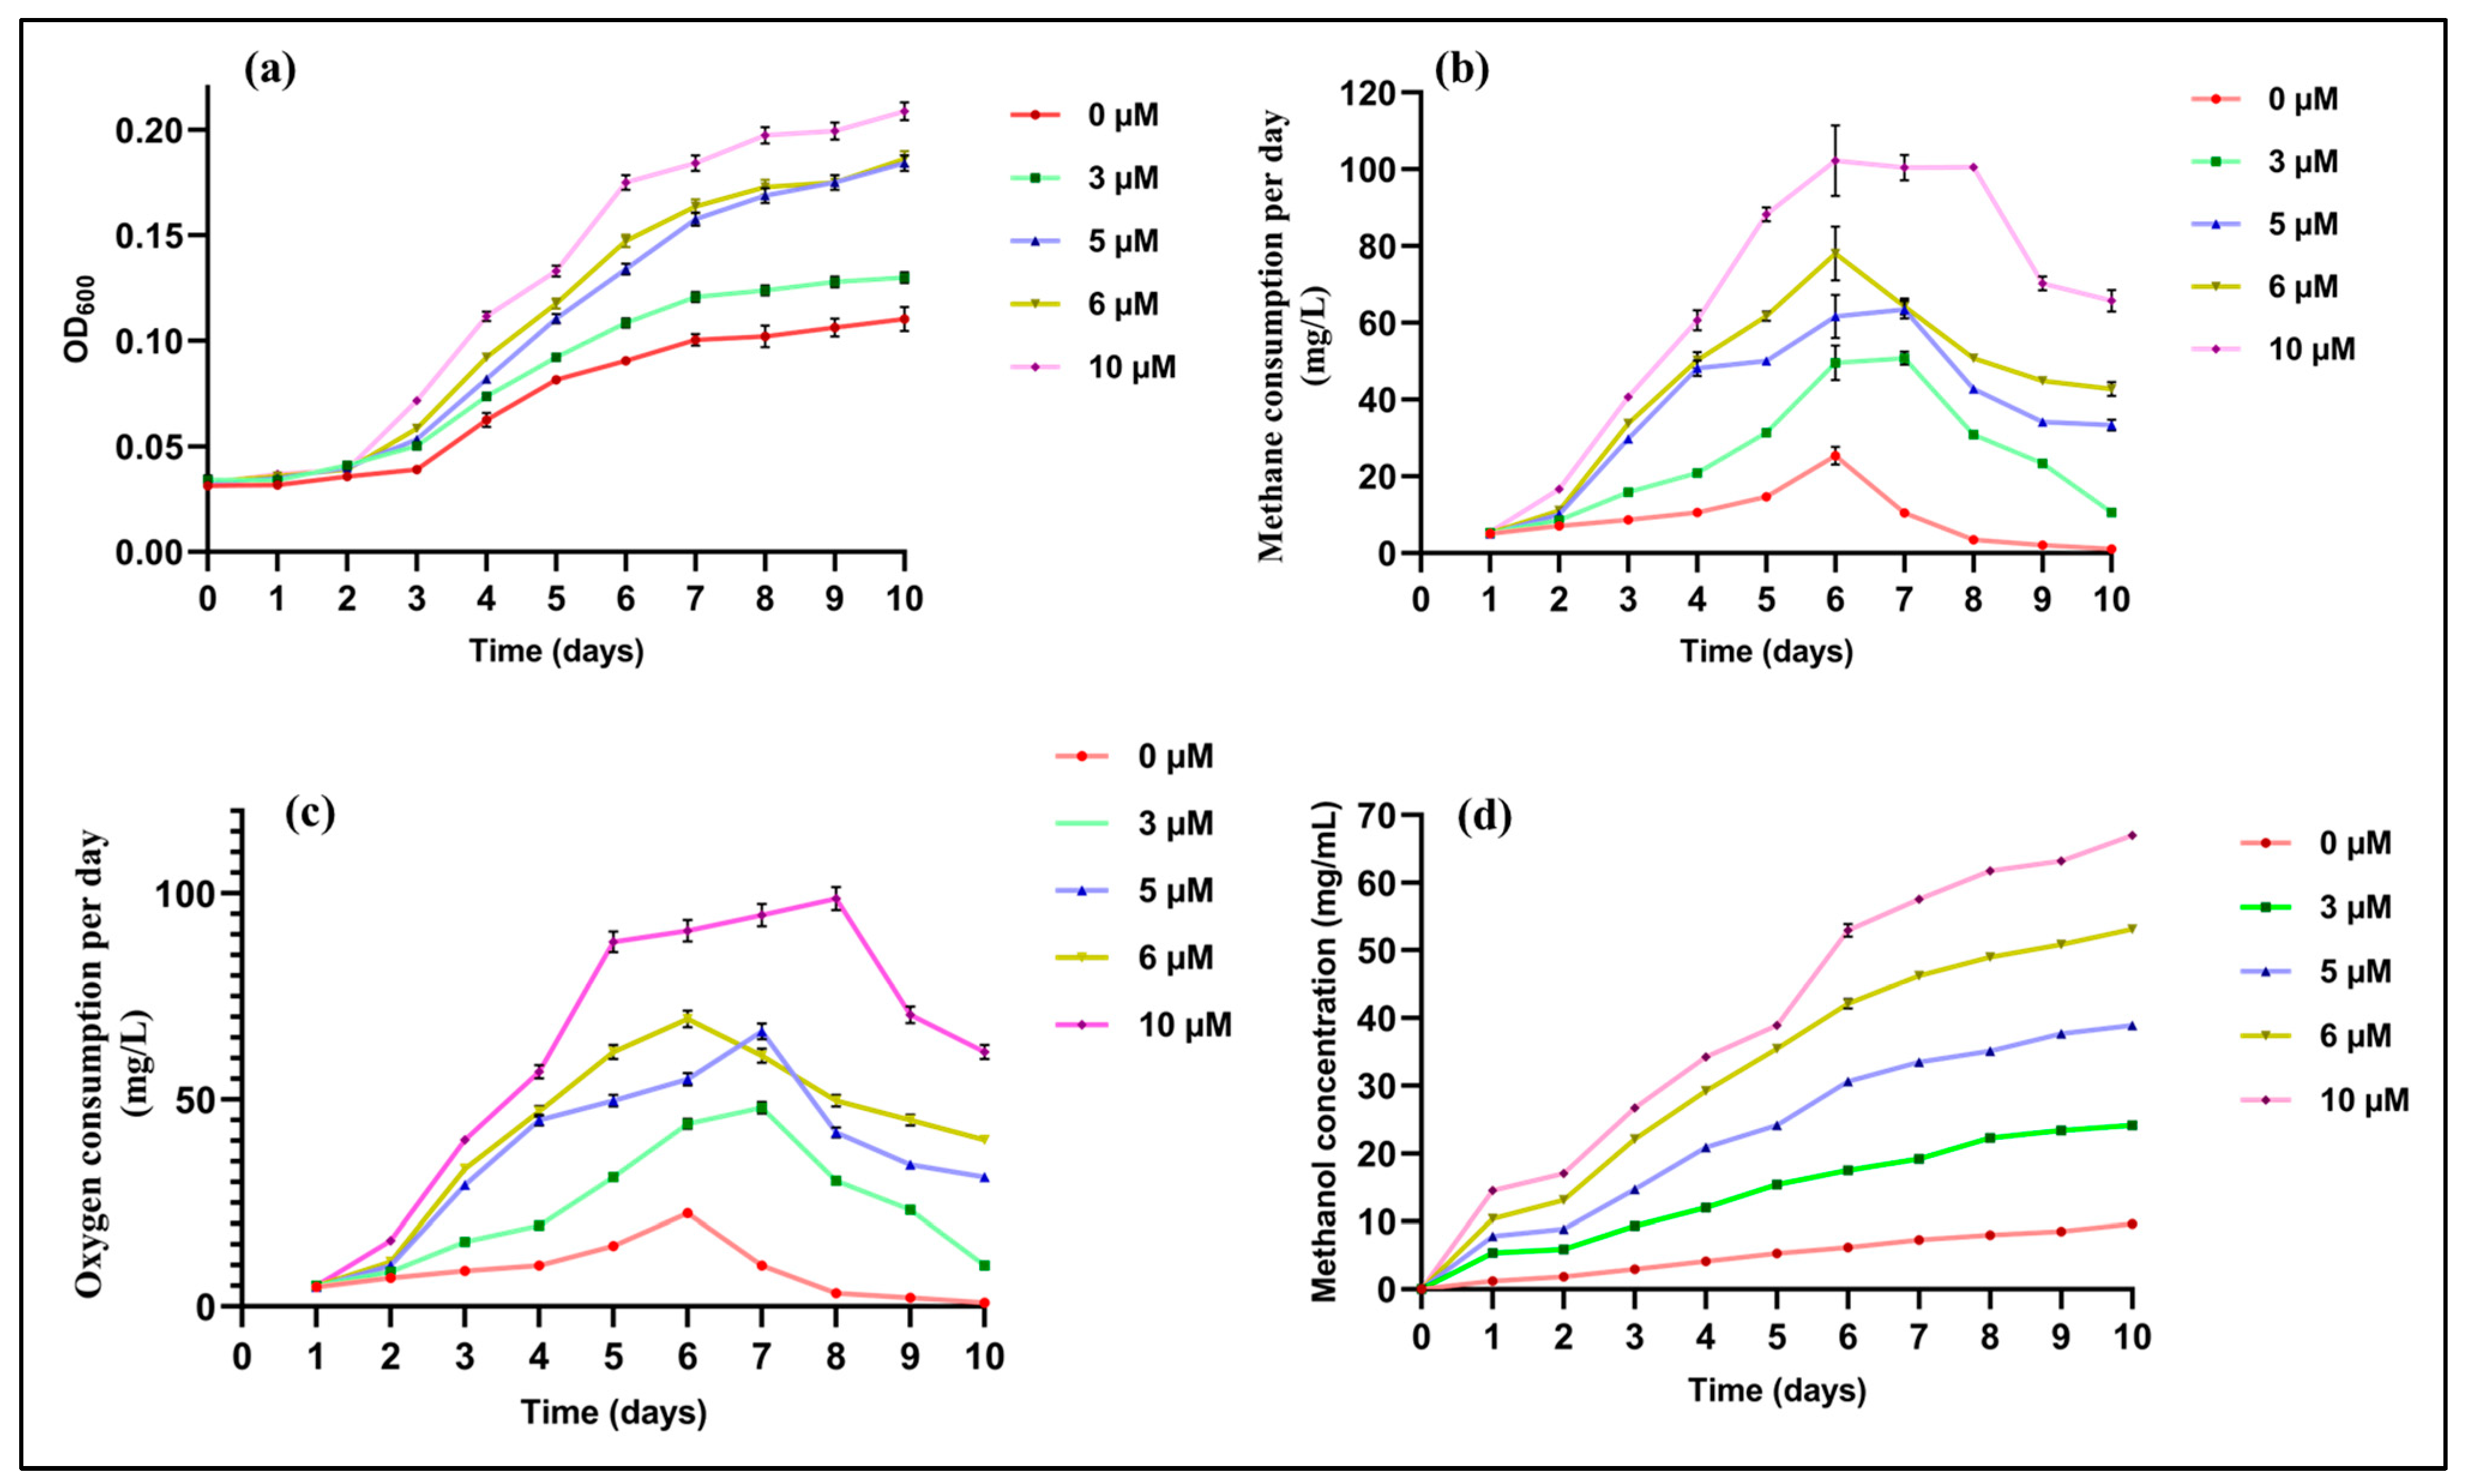
2.1. Effects of Cu on Growth and Methane Utilization

Several studies have depicted significant variations in the specific growth rates in M. trichosporium OB3b with respect to the media composition, air-to-methane ratio, and copper concentrations. Morton et al. reported average growth rates of M. trichosporium OB3b at 0.075 h⁻1 and 0.045 h⁻1 in NMS and M2M media, respectively [13]. In another study, Park et al. observed growth rates of M. trichosporium OB3b (with 0.125 g/L CuSO4·5H2O) at 0.08 h⁻1 during the fast exponential phase and 0.008 h⁻1 during the slow growth phase under initial nitrate conditions ranging from 5 to 20 mM [28]. Hwang et al., manipulating Cu concentrations (0, 1, 5, 10, and 50 µM copper) with M. trichosporium OB3b, demonstrated specific growth rates of 0.044, 0.053, 0.059, 0.053, and 0.032, respectively (air–methane = 7:3, equivalent to 30% methane) [29]. In this study, to evaluate the effect of varying concentrations of Cu (~75% methane) on the growth rate of M. trichosporium OB3b, the OD values (at 600 nm) were plotted against the Cu concentrations (Figure 1a). The cell concentrations were observed to increase with increase in the supplemented Cu in the growth medium, and the concentration was at a maximum at 10 µM. These results can be further explained with the maximum specific growth rate (µmax) for each individual concentration, as shown in Supplementary Table S1. The value of µmax was observed to be 0.013 h−1 at 0 µM Cu, and there was a significant increase in µmax to 0.022 h−1 at 10 µM. The td was significantly decreased from 54 h at 0 µM to 31 h at 10 µM. Interestingly, there was a strict positive change in µmax from 3 µM (0.012 h−1 td = 54 h) to 5 µM (0.01625 h−1, td = 43 h). The higher growth rates maintained by M. trichosporium OB3b in the growth medium with Cu concentrations greater than 5 µM could be suggestive of the fact that there was a shift in the expression of MMO from sMMO to pMMO. The shift may be due to the fact that copper is a cofactor of pMMO [30], and the increased supplementation of Cu led to higher methane consumption because of its higher turnover frequency, which is described in the subsequent sections.
The literature also reported the kinetics of aliphatic substrates that can be oxidized by sMMO or pMMO. Hylckama et al. used trichloroethylene and showed that OB3b grown on Cu-deprived medium had a first-order kinetic constant of less than 0.03 mL/(mg cells min) [31]. Meanwhile, Lontoh et al. used trichloroethylene and obtained a kinetic value of 0.035 mL/(mg cells min) when the expression of sMMO was suppressed by adjusting the Cu concentration to 2.5 µM [11]. In a separate study, Xing et al. used methanotrophic consortia and observed that Cu concentrations of 0.03 µM (0.064 mL/(mg cells min)) and 5 µM (0.075 mL/(mg cells min)) stimulated trichloroethylene degradation, which was in corroborated in the study of Lontoh et al., which depicted that a Cu concentration of 2.5 µM had the highest trichloroethylene degradation within the range of 0–10 µM Cu concentration [32]. These increased degradations of substrates in all the studies mentioned above are evident of the fact pMMO has a reasonably higher number of active sites than sMMO, and, therefore, pMMO has a higher affinity for halogenated aliphatic alkanes and alkenes (halomethane, chloroform, 1,1,1-trichloroethane, vinyl chlorides, and haloalkenes). As the Cu concentration increased from 2.5 µM to 20 µM, Lontoh et al. observed an increased affinity of OB3b towards trichloroethylene as well as a doubled kinetic constant (6.9 × 10⁻⁵ to 5.2 × 10⁻⁴ L/min/mg of protein) for methane oxidation [12]. Semrau et al. observed that the sMMO expression in methanotrophs was limited to as low as 0.8 µM Cu using methane as the substrate [7]. Cantera et al., in 2016, showed that differences in the Cu concentration induced significant variations in the methane oxidation kinetics [33]. In the present study, the methane utilization rates of M. trichosporium OB3b increased from 1.58 to 6.39 µM on the 6th day (maximum point of methane utilization) with an increase in the Cu concentration from 0 µM to 10 µM.
Previous research has reported a correlation between methane oxidation rates in Ob3b and increasing concentrations of Cu in the growth medium as well as the expression of MMOs [34,35,36,37]. Similarly, this study observed an enhancement in the methane and oxygen utilization rates for each concentration of Cu used to grow the M. trichosporium OB3b, as depicted in Figure 1b and c, respectively. As a general observation, the methane uptake rates at any Cu concentration were consistent with the growth rates of M. trichosporium OB3b. The batch cultures containing 3 µM Cu or less exhibited significantly lower growth and methane uptake rates. However, when the Cu concentration was varied from 3 µM to 5 µM, the methane utilization rate strictly increased from 3.09 to 3.85 µM on the 6th day. These results suggest that an increase in the rate of methane uptake is directly proportional to the increased growth rates and Cu concentration in the culture medium. As such, published reports have suggested that methane uptake rates may continue to increase until the Cu concentration reaches to a toxic concentration (>4.2 mM) for most well-studied methanotrophs [12,35,38].
A previous report has demonstrated that the rate of oxygen consumption by methanotrophic cells in the absence of Cu was only 15% of the rate when 1.2 mg/L (17 µM) of soluble Cu was present [10]. This suggests that sMMO dominates over pMMO during the pre- and post-exponential phases, resulting in decreased oxygen uptake rates. In our study, the decrease in the oxygen consumption rate at 0 µM Cu was about 17% and 23% of the rate at 10 µM Cu on 5th and 6th day, respectively. In the investigation conducted by Zhang et al., the methane-to-oxygen consumption ratio (methane–oxygen) variations in M. trichosporium Ob3b were examined. The study reported ratios of 1.46 ± 0.03 and 1.48 ± 0.03 under 0 and 5 µM Cu, respectively, in NMS media [39]. However, the same study demonstrated ratio variations of 1.31 ± 0.01 and 1.47 ± 0.02 under the same Cu conditions in AMS media [39]. In our study, the methane and oxygen consumption were observed to be approximately 100 and 87 mg/L, respectively, on the 6th day with 10 µM Cu, resulting in a ratio of 1.15 ± 0.07. Calculating the ratio for the other concentrations over the entire 10-day experiment yielded values within the range of 1.11 ± 0.12. Consistent with previous research, our findings suggest that variations in the copper concentration did not significantly affect the methane–oxygen ratio in NMS media.
In the investigation by Duan et al., the conversion of methane to methanol was examined in a high concentration (400 mmol/L) of phosphate buffer. The study revealed an accumulation of 1.1 g/L methanol in the reaction media, indicating a 60% conversion [40]. Additionally, when a membrane-aerated bioreactor was employed, the study reported a methanol accumulation of 0.95 g/L [40]. Another study conducted by Takeguchi et al. demonstrated a methanol concentration of 5.3 mmol/L under a phosphate concentration of 67 mmol/L [41]. This suggests that the concentration of phosphate buffer plays a crucial role in mediating the concentration of methanol in reaction media, as phosphate serves as an inhibitor for methanol dehydrogenase [29]. In this study, the concentration of phosphate buffer in the reaction media was kept constant at 0.2 mM. The extracellular methanol productions under varied Cu concentrations were measured using HPLC (shown in Figure 1d), and a strict increase in the accumulation of methanol from 0.75 to 1.22 µM (until day 10) at the 3 µM and 5 µM Cu concentrations, respectively, was observed. The maximum methanol concentration produced by M. trichosporium OB3b was observed at 10 µM Cu (2.09 µM). However, we did not measure the toxicity level of methanol in this study, but Takeguchi et al. observed an extracellular methanol concentration of 5.3 mM in M. trichosporium OB3b, which was much greater than the highest recorded for the 10 µM Cu concentration (~2.09 µM) in this study [41]. The experimental stoichiometric ratio between the methane and the methanol should be 1:1. However, the experimental stoichiometric ratio between the extracellular methanol and methane was 0.14:1 (extracellular methanol production was 14% of the methane consumed), suggesting that about 86% of the total methanol (in the case of 3 µM on the 6th day) was intracellular or was being utilized by the cells. The extracellular methanol stoichiometry at 10 µM Cu for day 6 was observed to be 0.26:1 (with deviations of ±10%), signifying that the extracellular methanol production increased to 26% at a higher Cu concentration.

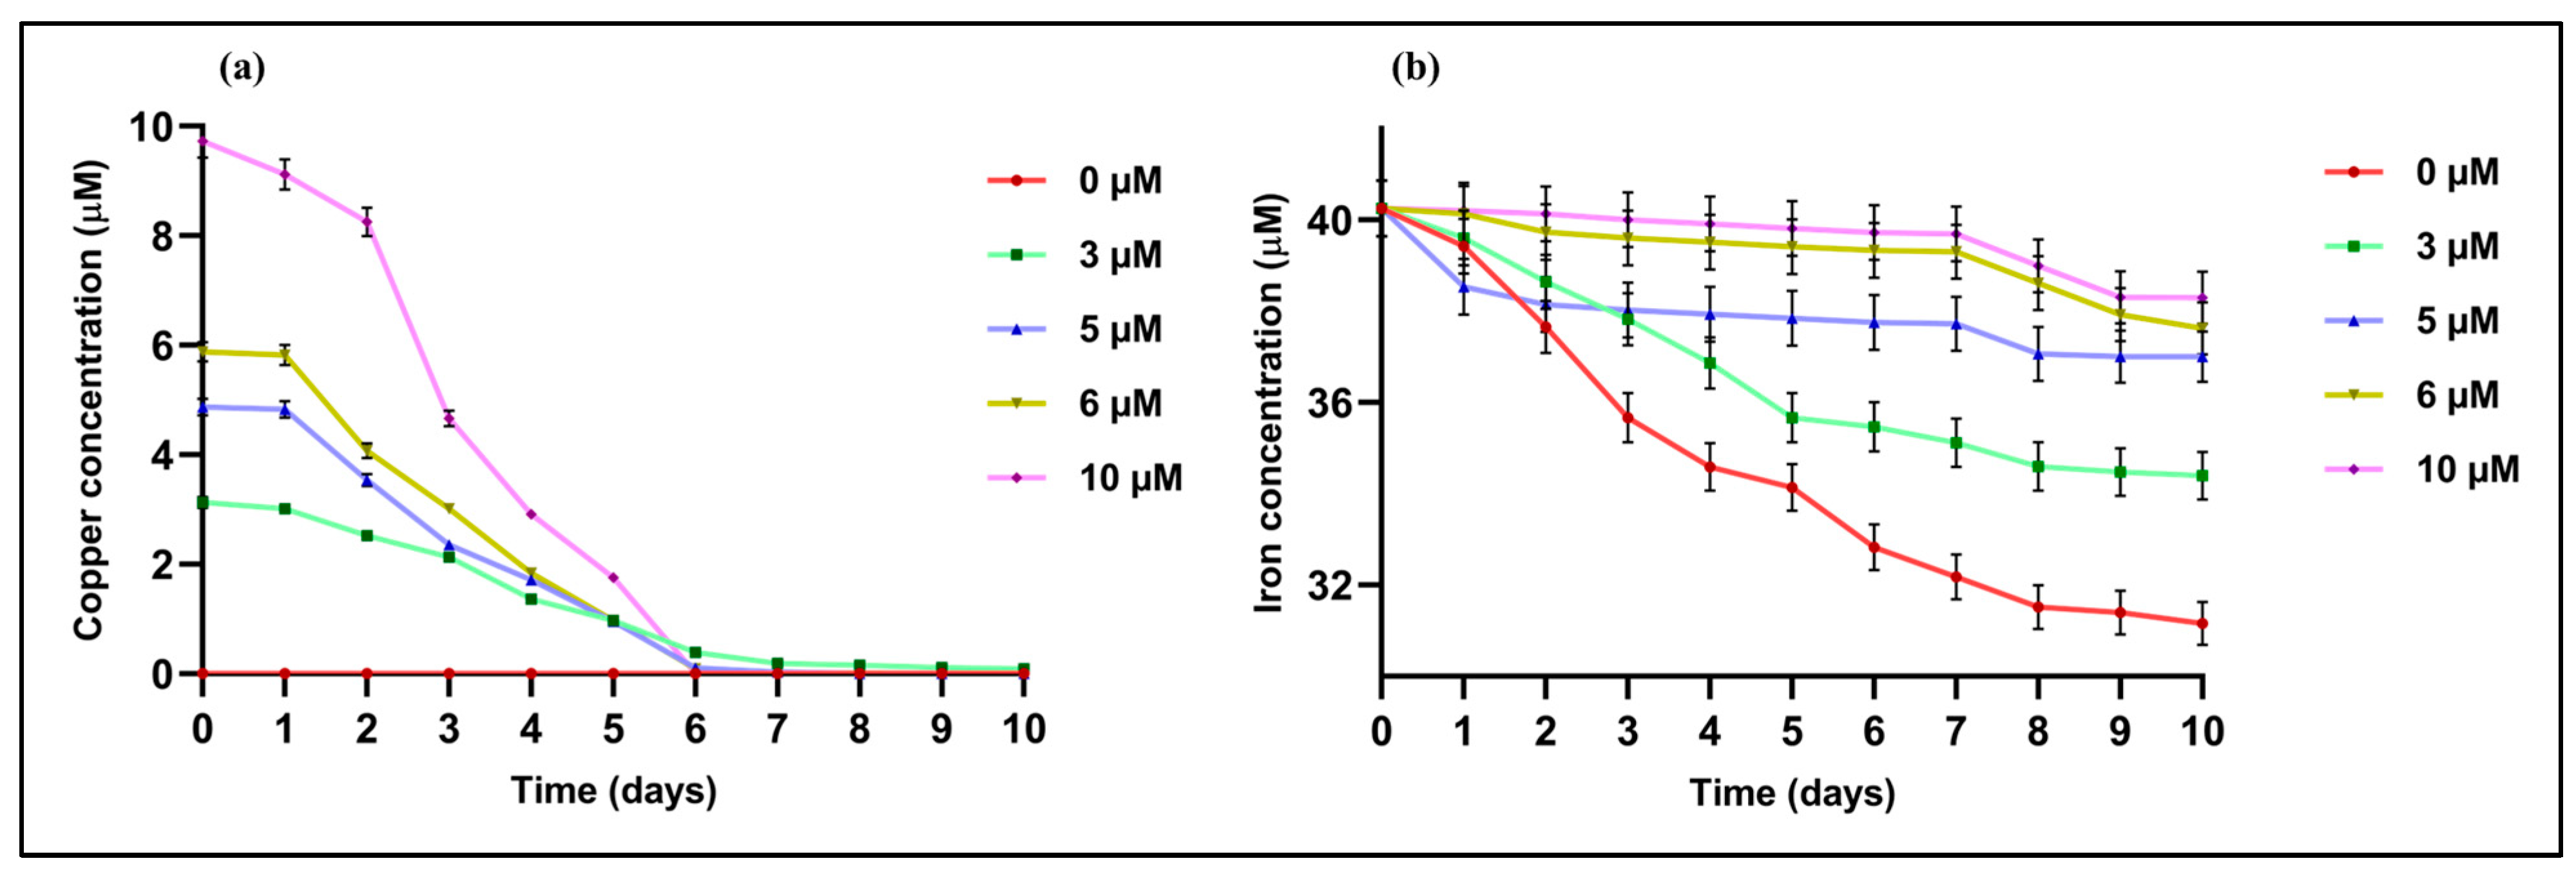
2.2. Effects of Cu Concentration on Metal (Cu and Fe) Uptake Rates

The Cu uptake rate (shown in Figure 2a) increased with increasing the Cu concentration in the NMS medium until the highest concentration tested in this study (10 µM). sMMO is an Fe-based enzyme that requires Fe atoms for methane oxidation, whereas pMMO relies on Cu availability. Begonja et al. reported a significant positive effect on the growth and sMMO activity by increasing the initial FeSO4 concentration in NMS medium from 12 to 52 µM [42]. In our study, during the initial set up of the experiment, the Fe concentration was kept constant at 40 µM in all the experimental bottles according to the media composition, while the Cu concentration was varied. The Cu and Fe uptake rates by the OB3b cells were measured using ICP-MS, and the difference in the Cu and Fe concentrations in the extracellular environment was used to estimate the uptake rates. In this study, the rate of the reduction in the concentration of Fe decreased with the increase in the Cu concentration (shown in Figure 2), which is supportive of the fact that pMMO activity dominated at higher concentrations of Cu, where it required Cu as the sole cofactor. At 5 µM Cu, there was an increase in the rate of Cu removal. An excess addition of Fe has been reported to stimulate the expression of sMMO, but an excess of Cu at more than 50 µM leads to the reversible inhibition of growth due to its reaction with the oxidant hydrogen peroxide [8]. Moreover, as show in Figure 2b, a constant decrease in the Fe concentration at Cu concentrations greater than 5 µM was observed. The reduction in the Fe concentration at a very low extent at these higher concentrations of Cu may be due to the requirement of Fe at a small quantity within the cell metabolism [43]. Therefore, as the increased Cu bioavailability enhanced the pMMO activity, the methane oxidation rates also increased proportionally as more Cu became available in the growth medium. We further discuss the switch based on the gene expression levels between sMMO and pMMO in the following section.

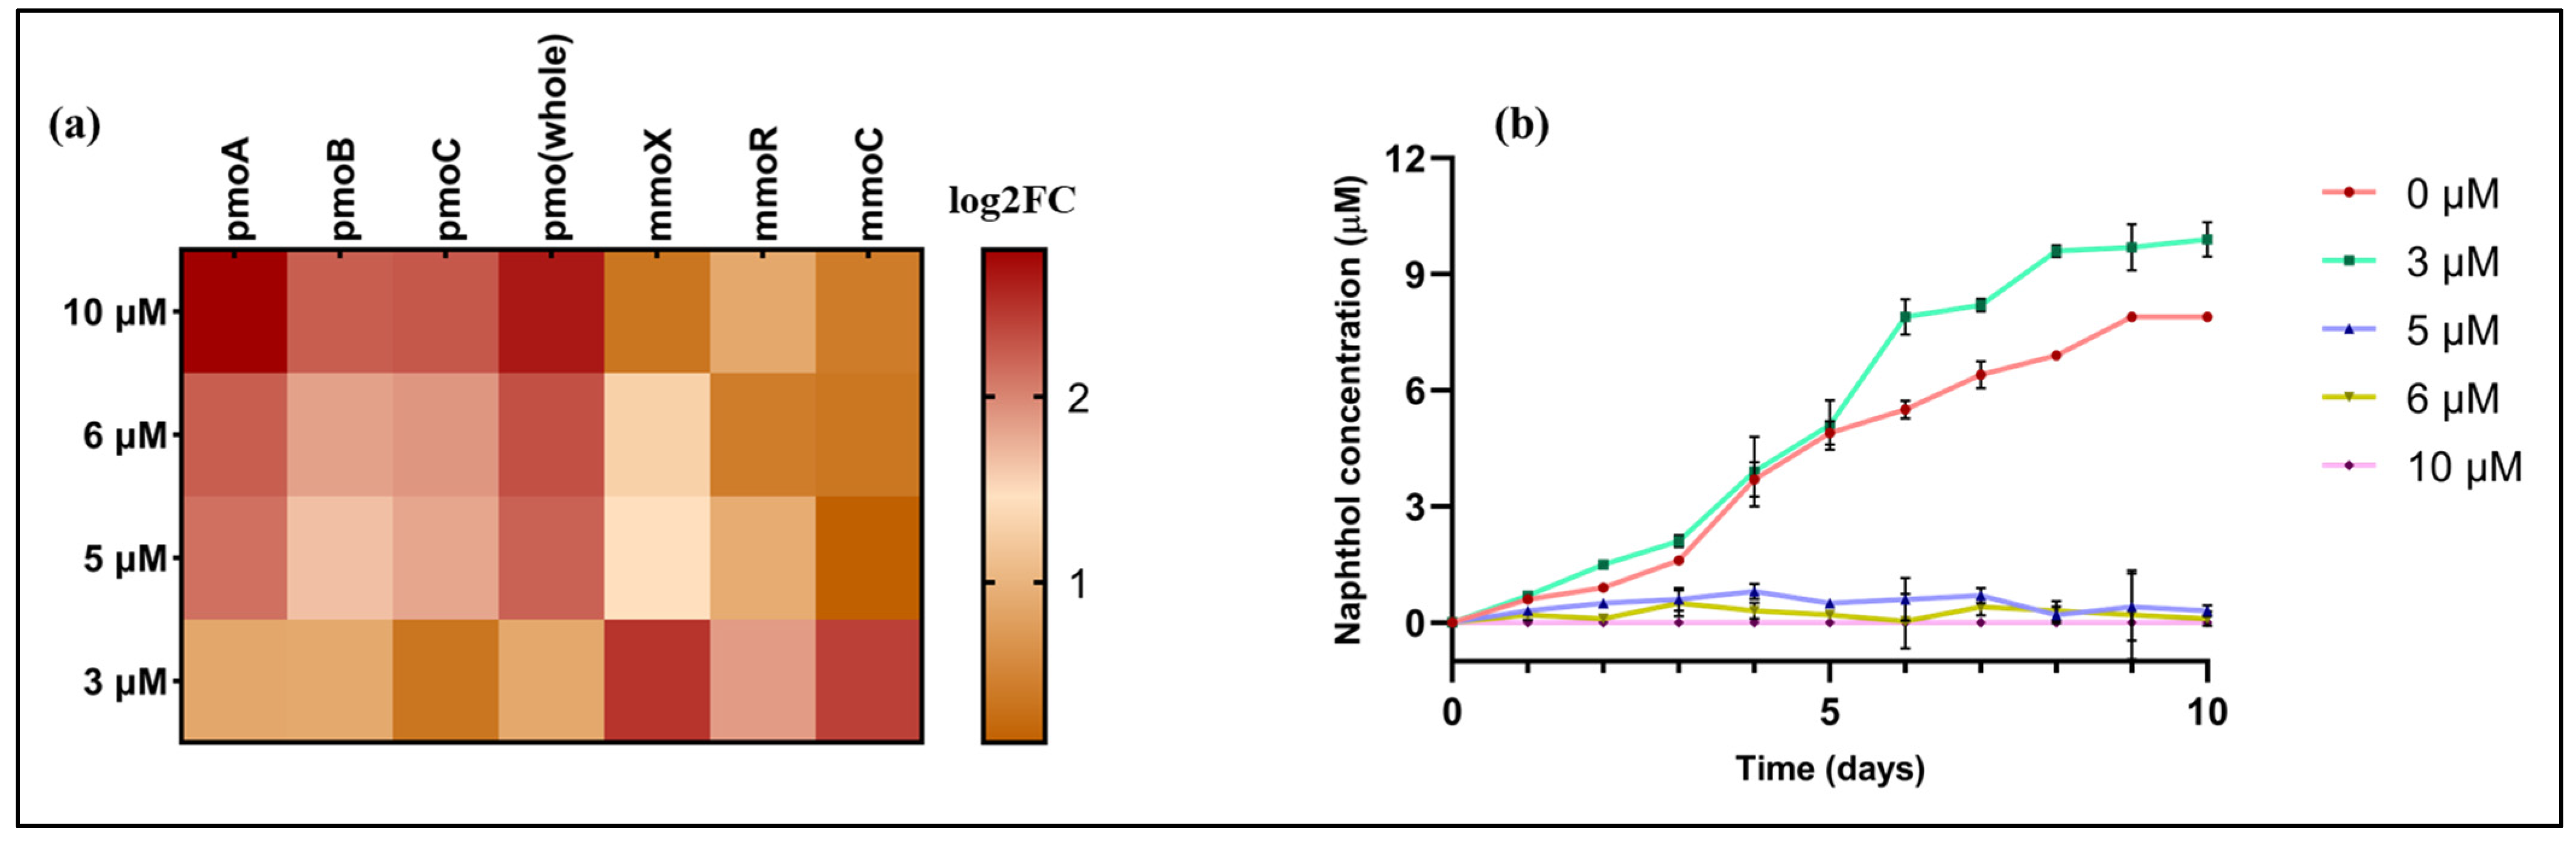
2.3. Effects of Metals on the Expression of pMMO and sMMO

Several studies have demonstrated that the range and expression of MMOs depend on the combination of various abiotic parameters (such as nitrogen, oxygen, and the presence of metals like Zn, Mo, Ni, Cu, and Fe) [44,45]. The expression profiling for each of the sMMO and pMMO genes under 3, 5, 6, and 10 µM Cu concentrations with respect to the control (0 µM) were plotted as a heat map with concentration distance variances and is shown in Figure 3a. Through the assessment of log2FC values, at lower concentration of Cu (3 µM), the sMMO genes mmoX (hydrolase subunit), mmoR (regulatory subunit), and mmoC (reductase subunit) were upregulated with an average log2FC of 2. Comparatively, the upregulation of the pMMO genes pmoA (β-subunit), pmoB (α-subunit), and pmoC (γ-subunit) at 10 µM had an average log2FC of 3.5. Here, an inconsequential amount of fold change (log2FC = 0.003) was observed constantly for the sMMO genes at higher Cu concentrations. Within the range from 3 to 5 µM, the co-expression of the sMMO and pMMO genes was observed with an average log2FC of 1.5 and 2.7, respectively. These RT qPCR data further support our previous results that showed that the Cu-mediated switch between the two MMOs in OB3b was activated within the Cu concentration range from 3 to 5 µM.
The range of Cu concentrations used to suppress sMMO expression in methanotrophs depends on both the methanotrophic genus and the culture medium used. Han et al. have shown that the expression of sMMO in methanotrophs is efficient at Cu concentrations of less than 0.8 µM and is restricted at an excess of 4 µM Cu [46]. However, Xing et al. used methanotrophic consortia and found that there was no such repression at a 4 µM Cu concentration [35]. Brusseau et al. reported that at above a 0.25 µM Cu concentration, M. trichosporium OB3b cells did not show any sMMO activity [47]. However, several studies assessing the influence of Cu on MMO expression in natural ecosystems did not observe sMMO at concentrations as low as 0.1 µM. These studies are evident of the fact that the MMO switching concentration of Cu varies within methanotrophic genera.
However, there are discrepancies in sMMO activities that depend on the concentration of the chelating agent (EDTA) in NMS medium. Studies have also demonstrated variability in sMMO activity based on the Cu concentration, as influenced by differences in the media composition. For instance, a study by Morton et al. compared sMMO activity in NMS (EDTA as a chelating agent) and M2M (pyrophosphate as a chelating agent) media [13]. The observed sMMO activity was apparent at up to 5.64 and 2.63 μmol copper·g of protein−1 in NMS and M2M, respectively. The study suggested that the bioavailable copper in NMS is half of that in M2M medium, attributing it to the role of the chelating agent in terms of sMMO activity. Another study observed that the addition of 84 μM Na2EDTA to NMS medium with 1.6 μM Cu led to an enhancement in trichloroethylene (TCE) degradation rates by a mixed methanotrophic culture. Given that TCE degradation rates are notably higher for sMMO compared to pMMO, the increased degradation at 1.6 μM Cu could potentially be attributed to reduced copper bioavailability and an augmented expression of sMMO, particularly under high EDTA concentrations [48]. M. capsulatus BATH showed a concomitant expression of sMMO and pMMO upon the addition of 2 μM FeEDTA, which was possibly linked to enhanced sMMO expression due to the lower copper bioavailability [49]. Notably, a study on copper handling by methanotrophs using Csps, a family of bacterial copper storage proteins, revealed that M. trichosporium OB3b possesses three Csps (Csp1, 2, and 3) [50,51]. A double mutation (Δcsp1/csp2) in M. trichosporium OB3b demonstrated their role in storing large quantities of copper, potentially delivering the metal to pMMO and providing an internal copper source when copper is limited [51]. In our study, the use of 7.4 mM Na2EDTA may have contributed to the sMMO activity persisting up to 3 μM Cu. Furthermore, at 3 μM Cu, Csps may store copper, resulting in less bioavailable copper in the reaction media, thereby sustaining sMMO activity.

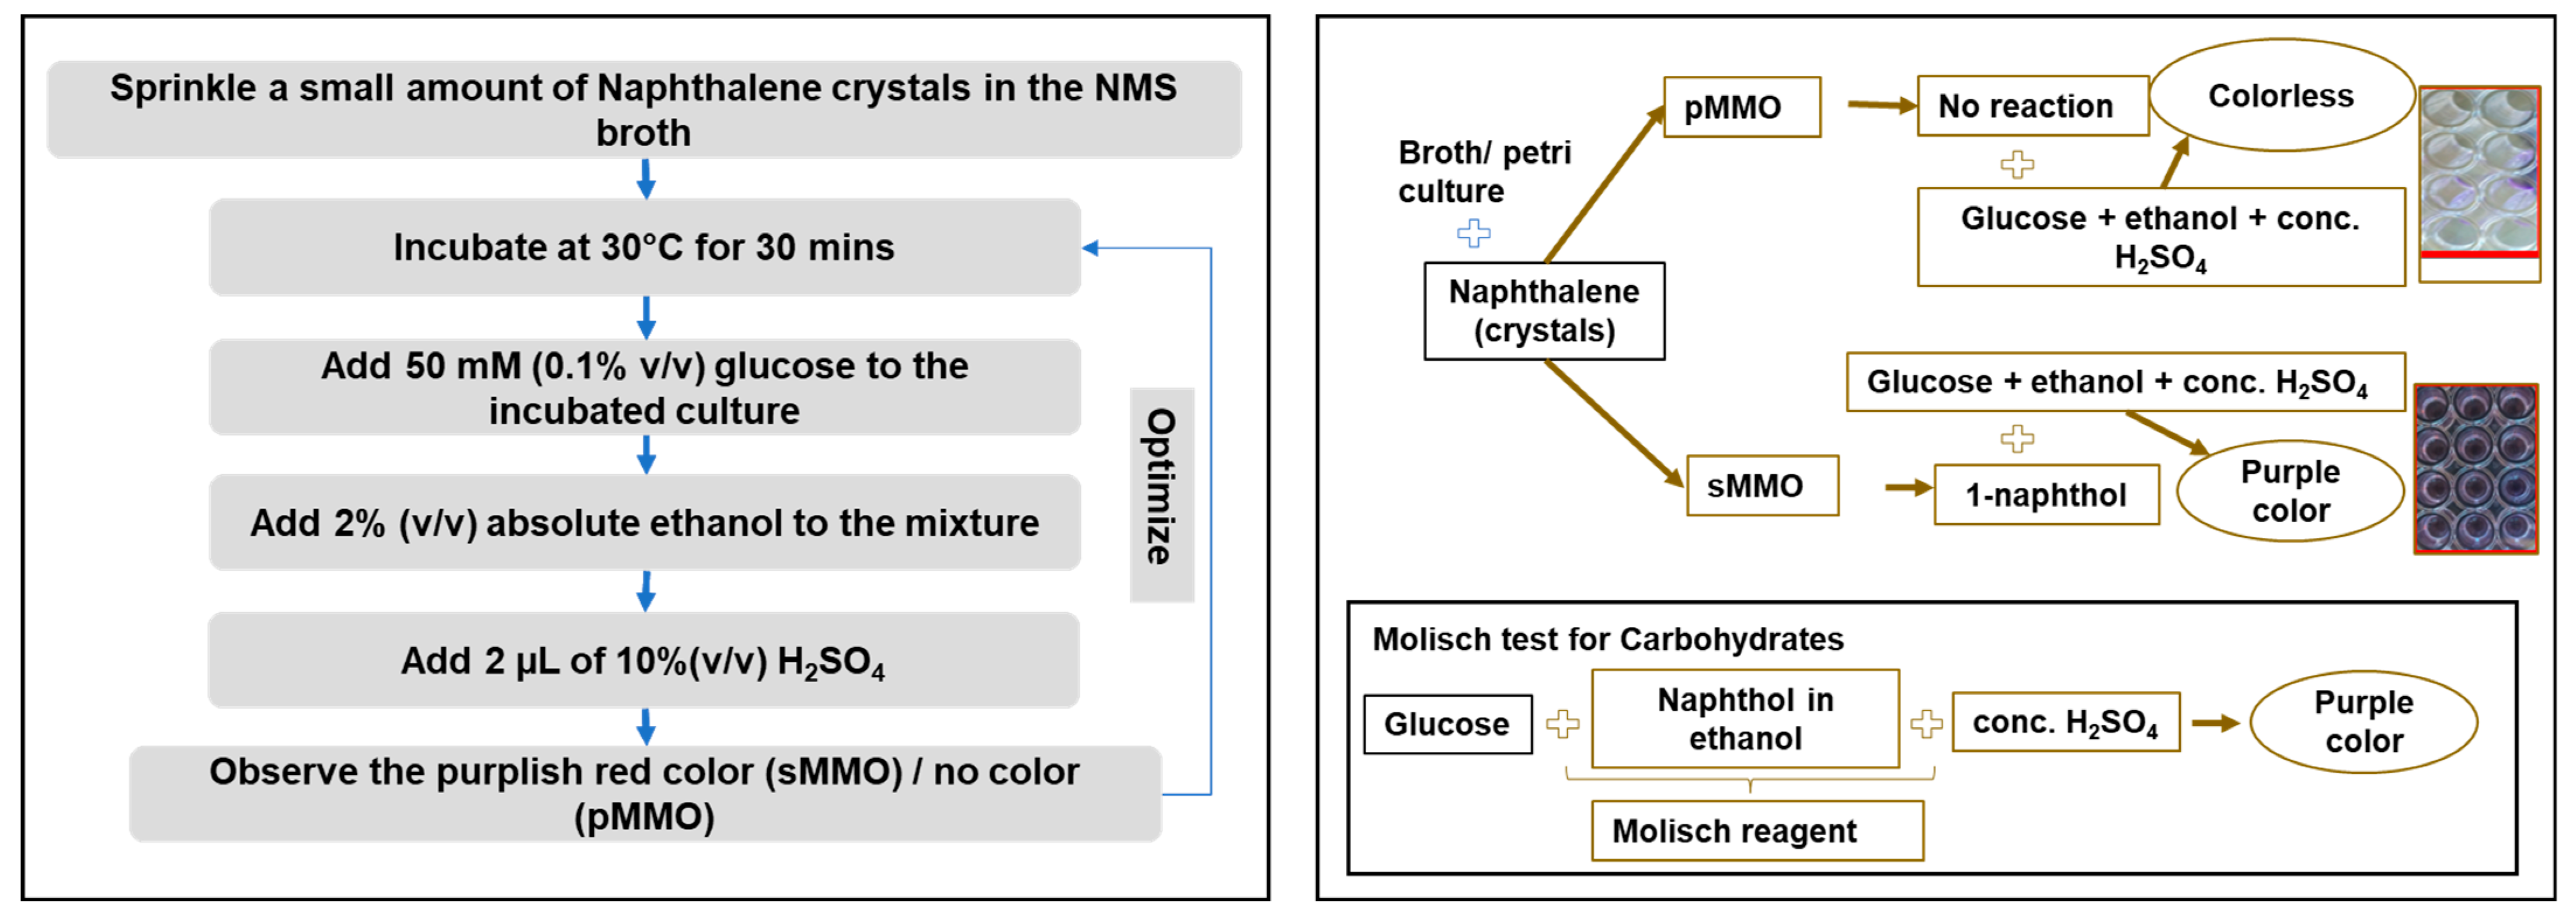
2.4. Molisch-Based Naphthalene Assay

For decades, various studies have measured sMMO and pMMO activity using trichloroethylene assays [12,52]. Trichloroethylene is much more reactive towards sMMO, but it also reacts with pMMO to some extent. Another calorimetric plate assay based on naphthalene and ortho-dianisidine, first described by Graham et al. to distinguish between sMMO and pMMO, is also a well-adopted assay as an alternative to the trichloroethylene assay [53]. The naphthalene–o-dianisidine assay is based on the fact that sMMO can degrade aromatic compounds, whereas pMMO cannot. When sMMO oxidizes naphthalene, it forms an azo complex with ortho-dianisidine, turning methanotrophic colonies purple, while colonies with pMMO remain colorless. Graham et al. used this assay to test OB3b and found no color development at 1 and 2 µM Cu concentrations. They also tested Methylomonas album BG8 and observed no growth at 0 µM Cu due to the absence of sMMO production and no color development at 2 µM Cu, indicating the absence of sMMO oxidation. The intensity of the purple color varies and can be an indication of the presence of both sMMO and pMMO, with a lighter intensity suggesting the presence of sMMO to some extent. However, this assay is limited to qualitative identification of sMMO, and quantification involves absorbance measurements, which can be prone to errors due to the depth of coloration by the azo complex, requiring dilution. Additionally, the incubation period needs to be optimized for both the plate culture and broth and is highly dependent on the amount of naphthol formed within the broth.
To circumvent these limitations, a new assay method based on the underlying principle of this calorimetric assay was developed. This newly established assay can quantify sMMO and, thus, can be used as a faster identification marker. The new assay is based on the amalgamation of the Molisch assay and the existing naphthalene assay. Samples in terms of broth cultures (50 mL) that were grown with different Cu concentrations were collected. Powdered naphthalene crystals (2.5 mg) were supplemented within the broth containing 50 mL of OB3b cell media and were left for incubation for 15, 30, 45, and 60 min. The variation in the incubation period was an attempt to optimize the procedure in terms of higher naphthol concentrations. The workflow towards the establishment of this new methodology is shown in Figure 4 (described under Section 3.7). Moreover, 1% and 0.1% (v/v) quantities of 50 mM glucose were added to the mixture, where 0.1% glucose was found to be more effective while adjusting the naphthol concentration by manipulating the incubation periods from 0 to 60 min with 15 min intervals. To begin with, the Molisch reagent and 2% (v/v) ethanol were added to the solution containing naphthalene, which was unaltered throughout the assay. The addition of 0.2% (v/v) H2SO4 to the resulting solution gave a purple color to the test. However, the color intensity differed from sample to sample, which was dependent on the naphthol concentration. The color intensity was the basis towards the spectrophotometric quantification of the desired product. The absorbance wavelength was scanned from 400 nm to 540 nm and optimized at 540 nm for this assay, which corresponded to the carbohydrate test using the Molisch assay azo compounds. Hence, the whole-cell-based assay was promising in terms of differentiating between the sMMO (purple test color) and pMMO (colorless due to no reaction) and was also effective in quantifying the naphthol concentration. This assay was used to distinguish between the MMOs and to find out the naphthol concentration (the calibration curve at 540 nm is depicted in Figure S1) associated with sMMO expressions with varying concentrations of Cu.
In this study, we optimized this assay to work well with a 15 min incubation period and 0.1% (v/v) of 50 mM glucose solution under a long range naphthol concentrations (lower sensitivity of naphthol measurement: 0.02 µM, and upper sensitivity of naphthol measurement: 120 µM), and we therefore report the newly established whole-cell assay as faster, broad-range-sensitive, and more efficient for both quantitative and qualitative measurement in broth cultures. Figure 3b shows the concentration of naphthol production using the naphthalene–ortho-dianisidine assay when M. trichosporium OB3b was grown in 75% methane. In this study, it was observed that the sMMO was suppressed when the Cu concentration exceeded ≥5 µM in the culture medium, which coincided with the expression data where the sMMO genes showed no significant fold change (log2FC = 0.003). The formations of naphthol were not observed with ≥5 µM Cu concentration, but the existence of the oxidation of methane at higher concentrations and the upregulated expression of only the pMMO genes (average log2FC of 3.5) signify that the pMMO became the sole oxidizer. Also, the decrease in the production of naphthol between 3 and 5 µM Cu concentrations may suggest that the pMMO (with an observed upregulation; log2FC of 2.7) was dominant over the sMMO (with an observed downregulation; log2FC of 1.5), where both the forms of MMO were co-expressed.

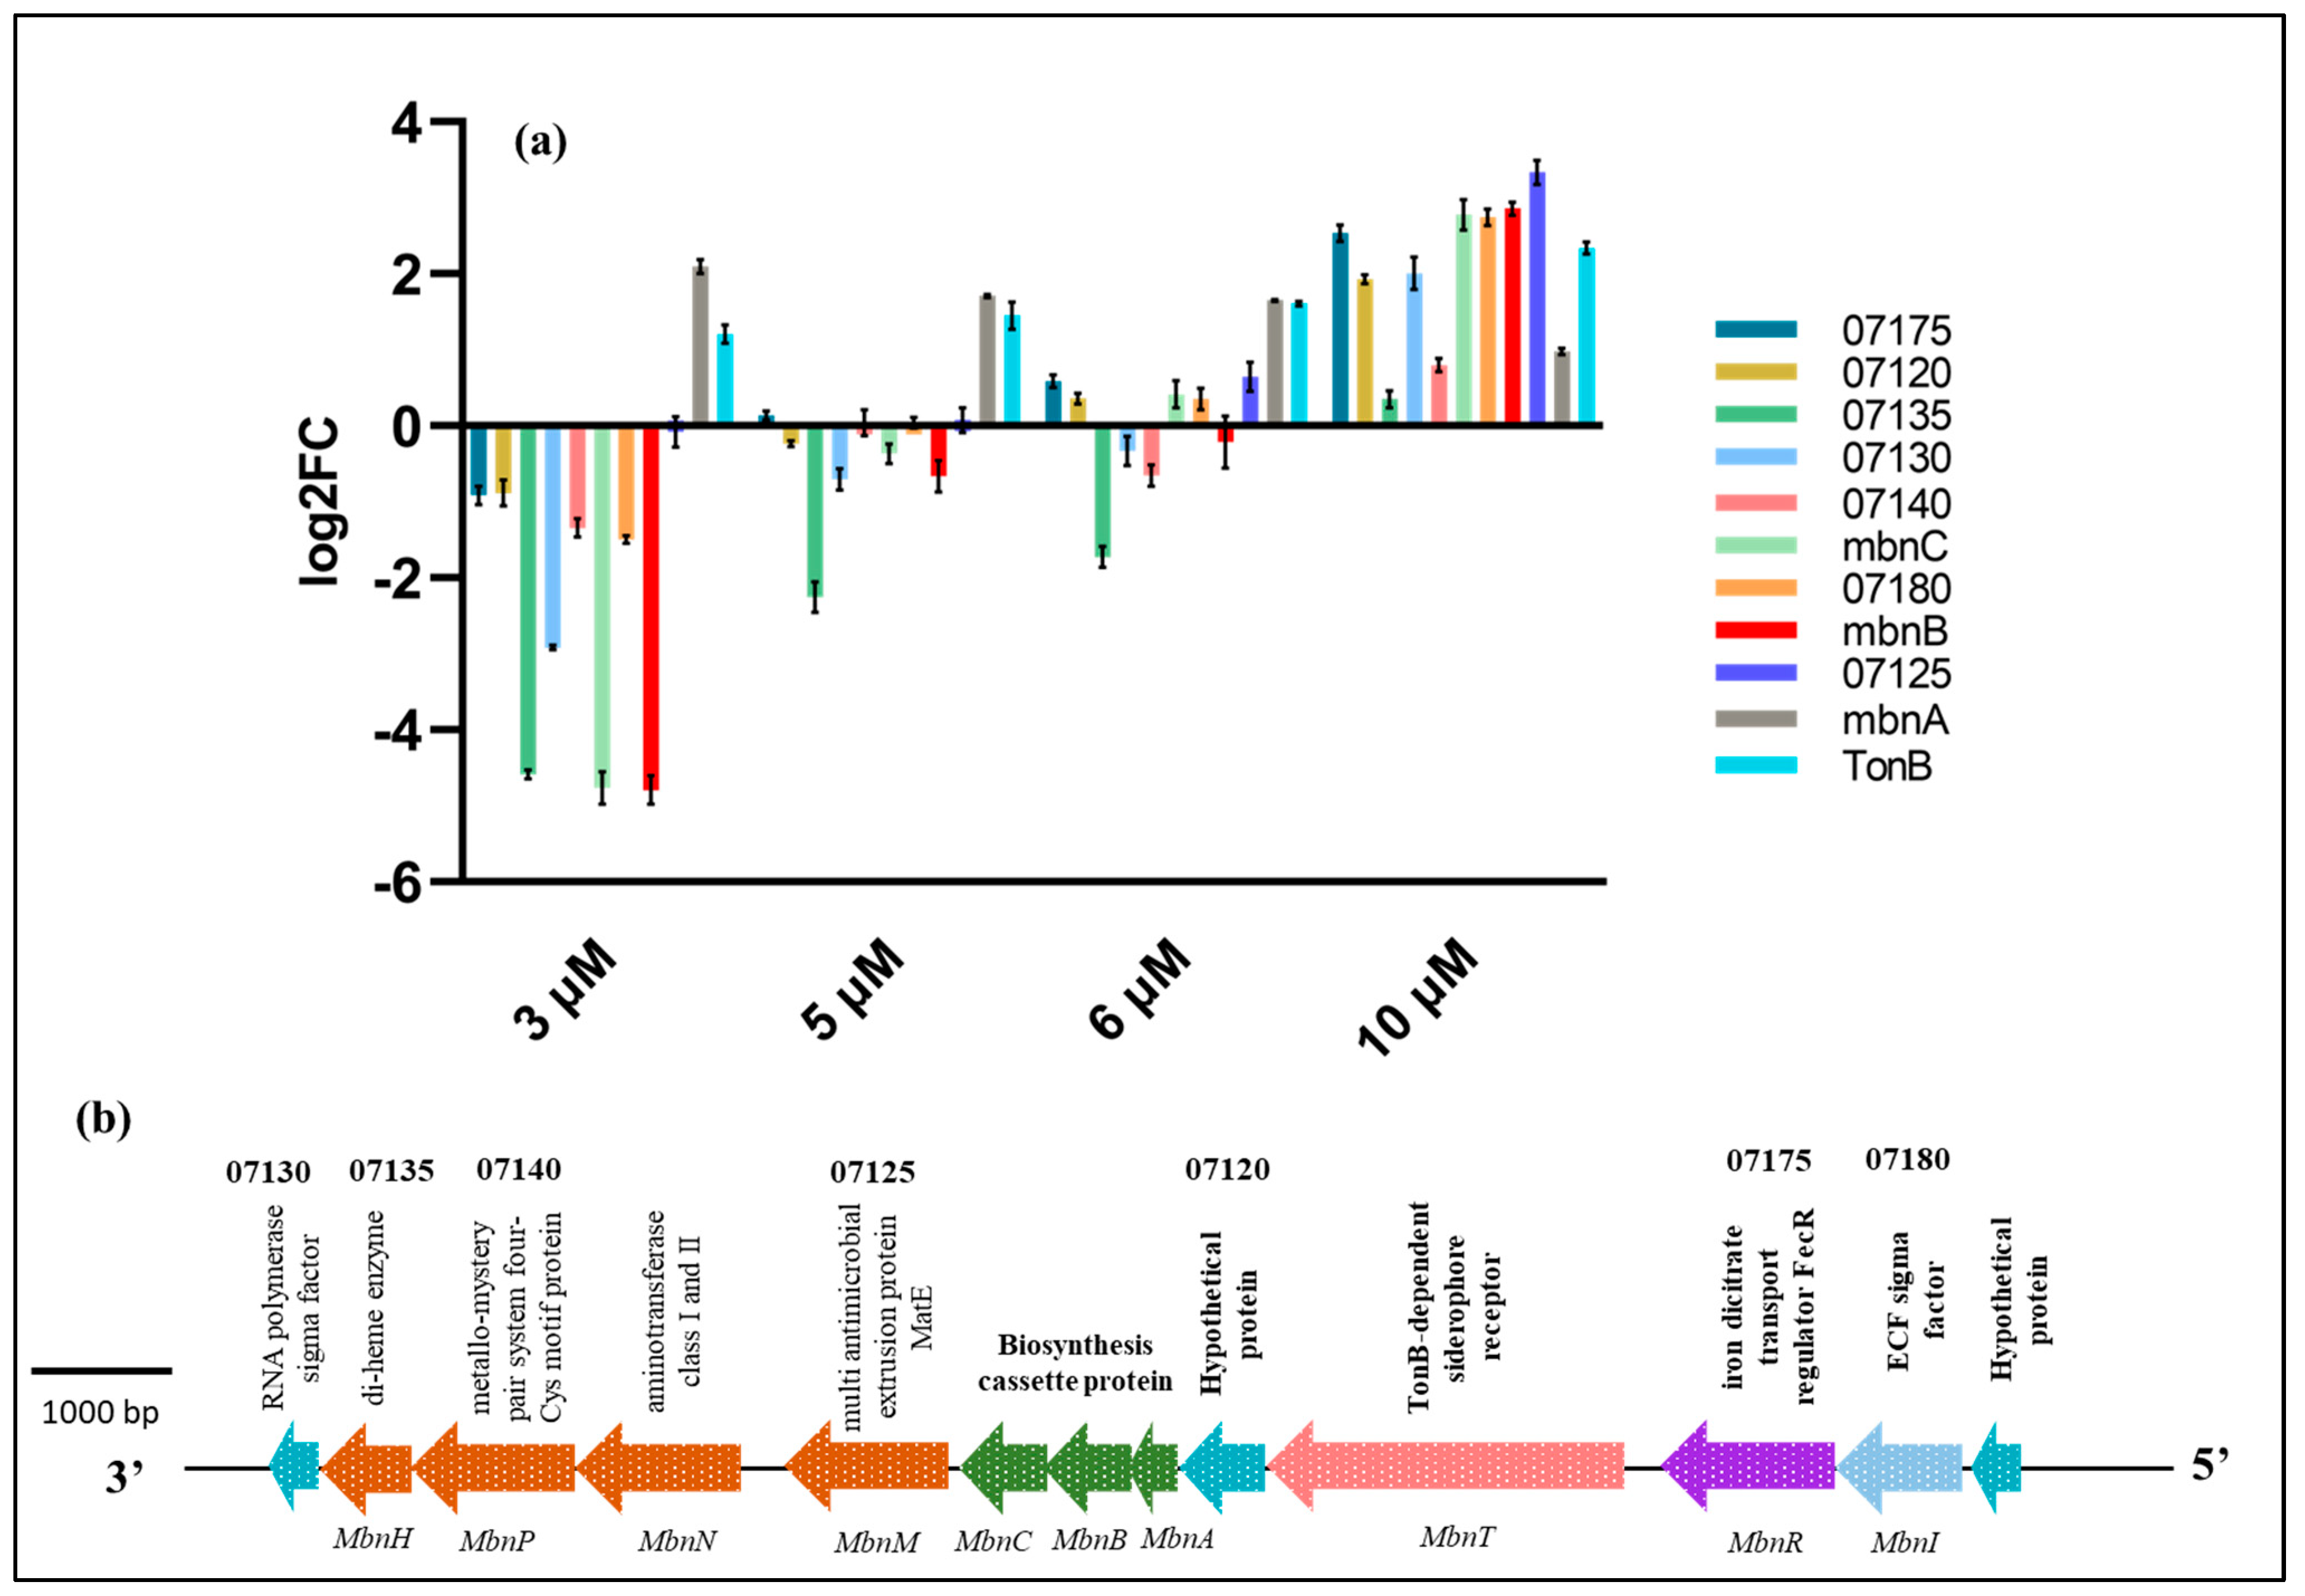
2.5. Effects of Cu on the Expression of Methanobactin Operon Genes

Methanobactins are known to play a role in Cu acquisition, the regulation of MMO expression, pMMO activity, and Cu resistance [53].
The methanobactin operon in M. trichosporium OB3b comprises 11 genes structured as follows: (1) import genes (periplasmic binding protein MbnE and Ton-B-dependent transporter MbnT), (2) export genes (the MATE multidrug exporter MbnM and the regulation of the sigma/anti-sigma factor pair MbnIR), and (3) putative synthesis genes (the precursor peptides MbnA and MbnC and the aminotransferase MbnN) [22]. The methanobactin machinery in Ob3b also houses two hypothetical proteins, MbnP and MbnH, the roles of which are unknown [25].
The methanobactin of M. trichosporium OB3b is well known for its 3-methylbutanoyl-oxazolone association with the first amino acid glycine and the pyrrolidinyl-oxazolone between the fourth-position tyrosine and fifth-position serine, cycled by the disulfide bond between two cysteine residues at the third and sixth positions [54]. These oxazolones are the result of two post-translational modifications from two different amino acid residues, the mechanism of which is an open question [23,55]. A recent study showed that mbnC is not an essential gene for the formation of the oxazolone ring in methanobactin; however, the gene is responsible for the synthesis of methanobactin and is therefore a critical factor during synthesis [56]. A study by Peng et al. demonstrated that the mmoD gene, found in the soluble methane monooxygenase (sMMO) operon, not only plays a role in the post-transcriptional maturation of sMMO but also participates in the expression of MbnA [20]. Another study supported the idea that mmoD collaborates with Mbn, influencing its expression [57]. Interestingly, Csp proteins have also been shown to regulate Mbn expression under copper-limited conditions [51]. In M. trichosporium OB3b, methanobactin unwraps and chelates copper from Csp1 and Csp2. The disruption in MbnN leads to the cessation of Mbn production [25]. While the role of MbnF remains unclear, it is hypothesized to be involved in oxazolone biosynthesis [50]. Notably, M. trichosporium OB3b lacks MbnF but still produces oxazolone. MbnH belongs to the MauG protein family, but MbnP has no known associated domain [53]. Although the genes related to methanobactin production and expression, such as Csp and mmoD, have been explored to some extent, the functions of most genes in the Mbn operon during the copper switch remain largely unexplored.
Some of the literature reported the expression profiling of a few genes of methanobactin in the absence and presence of copper ions. For instance, Peng et al. [58] used a deletion/excision strategy to show that M. trichosporium OB3b exploits two Ton-B-dependent receptors and reported that this organism can not only uptake its own methanobactin but also those produced by another organism (Methylocystis sp. strain SB2). Another article further investigated the multiple copper uptake mechanisms by this organism when heterologous methanobactins are present in the culture media during mixed growth [59]. Therefore, to elucidate the correlation between the regulation of expression between the methanobactin genes and the MMOs, there is a need to account for the expression of each individual gene under different Cu concentrations. In this study, we looked at expression of TonB (TonB-dependent siderophore receptor), mbnA (methanobactin synthesis precursor), mbnB (putative methanobactin synthesis cassette mbnB), mbnC (putative methanobactin synthesis cassette mbnC), CQW49_07125 (DUF4189 domain-containing protein), CQW49_07130 (RNA polymerase sigma factor), CQW49_07135 (di-heme enzyme), CQW49_07140 (metallo-mystery pair system four-Cys motif protein), CQW49_07175 (iron dicitrate transport regulator FecR), CQW49_07180 (RNA polymerase sigma factor), and CQW49_07120 (hypothetical protein) from the entire methanobactin operon under 3, 5, 6, and 10 µM Cu concentrations with respect to a control (0 µM) (shown in Figure 5a). The operon architecture of the methanobactin operon is shown in Figure 5b (adapted from [57]).
We observed from the significant values of log2FC that all the genes were downregulated under the 3 µM Cu concentration except for TonB and mbnA, which is contrary to the 10 µM Cu concentration, where all the genes exhibited upregulation. mbnA showed a gradual decrease in fold changes at higher Cu concentrations. However, there were very few genes that were observed to be upregulated at 5 µM, and, gradually, the number of upregulated genes increased at 6 µM. All the Mbn genes considered in this study were observed to be significantly upregulated at higher Cu concentrations (6 and 10 µM). These results suggest that methanobactin synthesis was restricted at lower Cu concentrations, but as the Cu became available at higher amounts in the surrounding media, there was an enhancement in methanobactin synthesis and a greater uptake of Cu ions, as coincided from the ICP-MS Cu reduction data. Interestingly, the hypothetical protein also showed a change in expression at different Cu concentrations, signifying that this small gene is not only an ORF but codes for a functionable protein that takes part during excess Cu conditions; the function and mechanism of the protein are yet to be elucidated. The TonB-dependent siderophore receptor, which is responsible for the uptake of metalloprotein complexes in Gram-negative bacteria, never showed downregulation at any Cu concentration, and, consistent with the other genes, the fold changes increased gradually at higher Cu concentrations. However, a possible circumstance can be proposed at much higher Cu concentrations, where this gene may show upregulation and could be a possible cause for harvesting more Cu ions due to pMMO activity. The mbnB and mbnC showed equal expression at a particular Cu concentration, suggesting that methanobactin post-translational modification is triggered by both genes simultaneously. The greatest upregulation of the di-heme enzyme (an oxygenase that incorporates oxygen from dioxygen into enzymes) at 10 µM is suggestive of the fact that more oxygen was used at higher Cu concentrations. The metallo-mystery pair system four-Cys motif protein, which is associated with Cu homeostasis and balancing the redox gradient in and out of the membrane, were observed to be upregulated at higher Cu concentrations. The upregulation of the RNA polymerase sigma factors at higher Cu concentrations denotes that the synthesis and triggered regulation of the genes in the operon are essential in a Cu-rich environment.

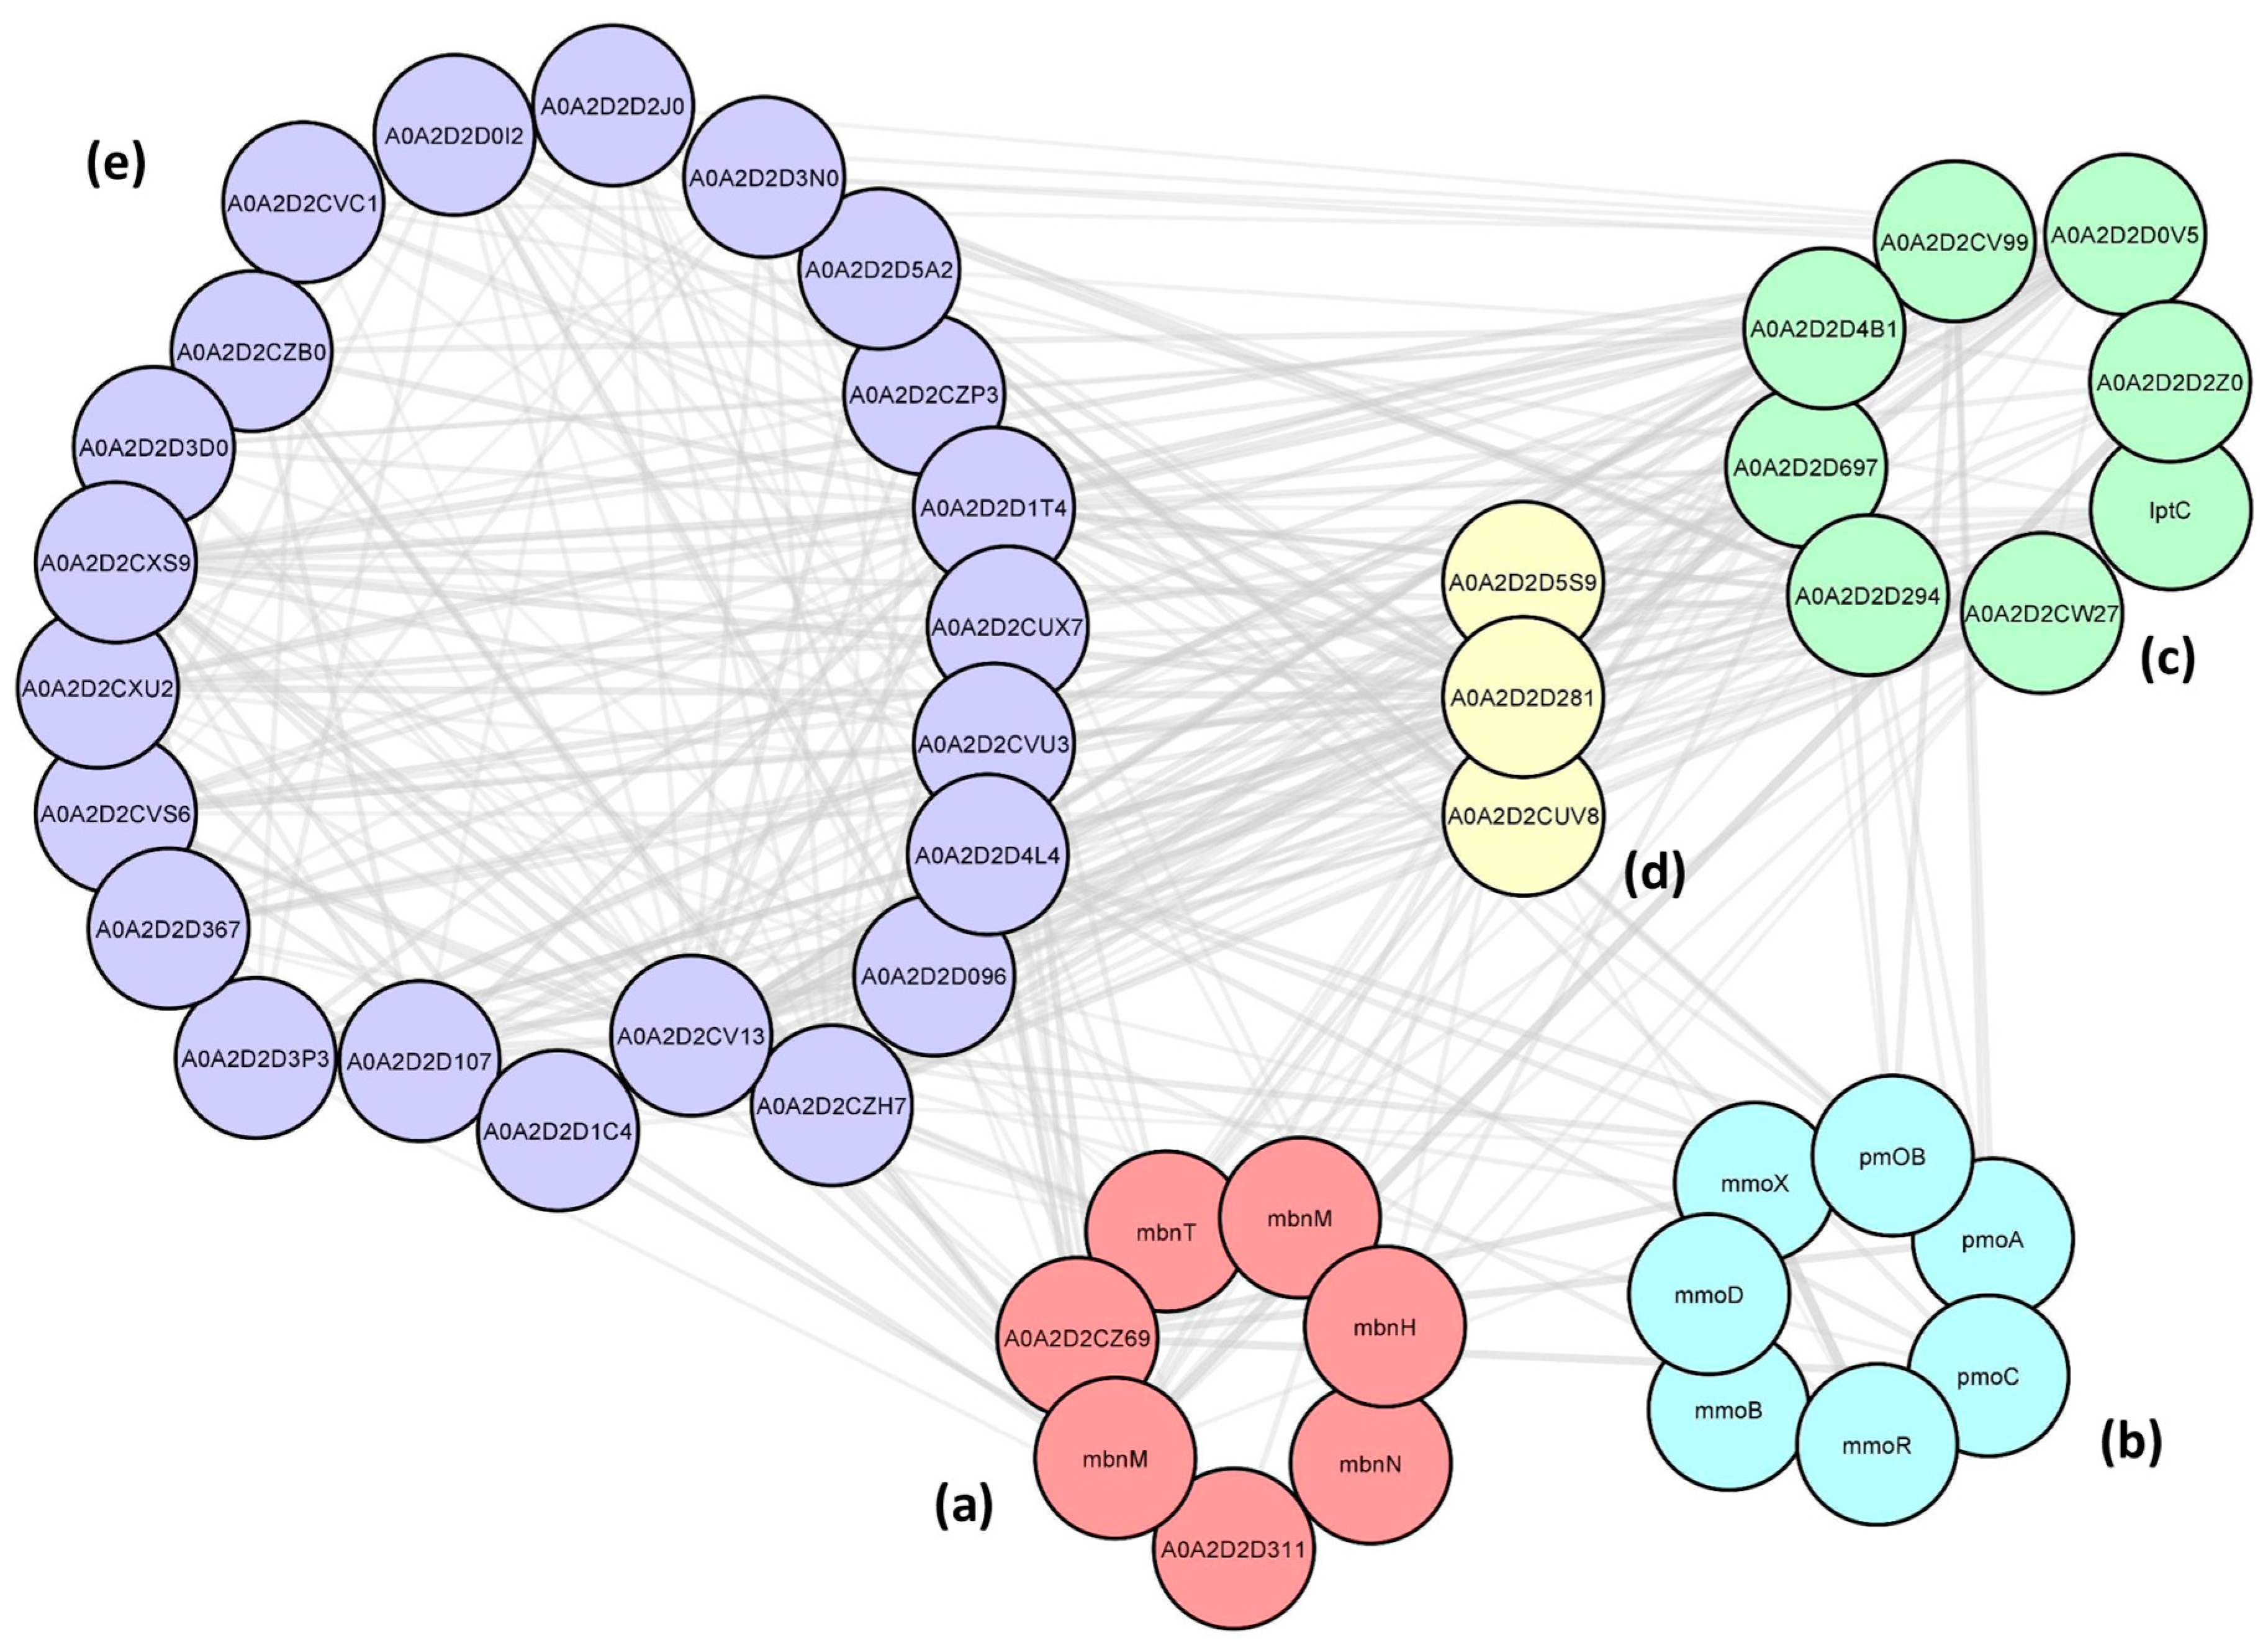
2.6. Protein–Protein Interactions (PPIs) between the Cu-Associated Genes

In addition to MMOs and MBNs, we performed PPIs to uncover the genes that are explicitly responsible for copper toxicity and homeostasis and the associative behavior associated with methane oxidation. PPIs were performed using Cytoscape (stringApp plugin) with the 17 genes from the mbn operon, pMMO, and sMMO operon, and the enrichment analysis with a significant enrichment p-value < 1.0 × 10⁻¹⁶ demonstrated the interactions of these genes with 13 other genes that can be broadly categorized under three substantial biological cellular functions, namely (1) transport/signal transduction, (2) cell-wall biosynthesis/regulation/degradation, and (3) Cu-associated (Cu-resistance) protein. In addition, the network analysis showed 18 genes that are hypothetical (unannotated/uncharacterized) and domain-containing genes and that may be non-exceptionally related to Cu homeostasis, Cu resistance, metal toxicity, or Cu-switching activities. Supplementary Table S2 lists the initial and the enriched genes with an emphasis on detailing the biochemical function, gene ontology processes, and role in this study. The network of the PPI interactions between the five groups of enriched genes are shown in Figure 6. The node table and the enrichment network tables are shown in Supplementary Table S3 and Table S4, respectively.
The network analysis, therefore, implies that although the primary regulation of the expression of both the MMOs are controlled by the genes from the mbn cluster, there are several other genes that are involved in copper sequestration and copper homeostasis/regulation. The influx and efflux mechanism during the transport of metal ions (Cu and Fe) highly regulates the Ton-B siderophore receptor (CQW49_19010) and the metallo-mystery pair system four-Cys motif protein (CQW49_07140). Interestingly, the genes from the tripartite efflux assemblies, namely, efflux transporter periplasmic adaptor subunit (CQW49_16885) and LPS export ABC transporter periplasmic protein (CQW49_11995), were observed to be highly related (STRING interaction score: 0.683) to the multidrug efflux gene from the methanobactin operon (CQW49_07150), which completes the multilateral three-way behavior of the efflux transport assembly. CQW49_12590, which encodes for apolipoprotein acyltransferase and is responsible for the nutrient uptake and signal transduction processes, was observed to be networked directly with the mbnT from the mbn operon. The overall interaction study depicts that the toxicity and redox homeostasis of copper regulation during the growth of M. trichosporium OB3b is quite fascinating with the involvement of not only the MMOs and methanobactin but also key genes from several essential pathways, the mechanisms of which are still unelucidated.

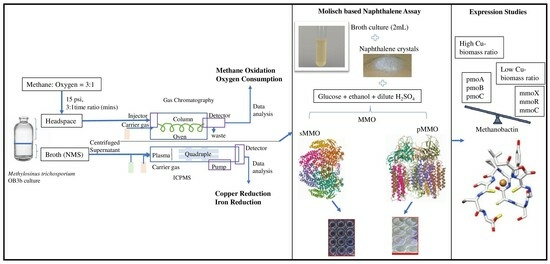
3. Materials and Methods

3.1. Growth Conditions

M. trichosporium OB3b was batch-cultured in serum bottles (media-to-gas ratio was maintained at 1:1 in a total volume of 500 mL) sealed with rubber septa and aluminum caps. The medium used for growth was NMS medium that contained (for 1 L media) NaNO3 at 11 mM, K2SO4 at 0.98 mM, MgSO4·7H2O at 0.30 mM, CaCl2·2H2O at 68 µM, 1 mL of phosphate buffer solution (0.2 mM, pH 7.2), and 2 mL of trace elements solution [60]. The phosphate buffer solution consisted of Na2HPO4·12H2O at 200 mM and KH2PO4 at 200 mM. The trace elements solution consisted of FeSO4·7H2O at 20 mM, ZnSO4·7H2O at 1.40 mM, H3BO3 at 0.25 mM, CoCl2·6H2O at 3.85 mM, EDTA disodium salt at 7.40 mM, MnCl2·4H2O at 0.10 mM, and NiCl2·6H2O at 77 µM. The media along with the trace metals within the serum bottles were autoclaved at 121 °C for 15 min. The filter-sterilized Cu sulfate solution (1000 µM stock) was supplemented separately in each serum bottle after autoclaving, and the concentrations were varied between 3, 5, 6 and 10 µM within the media. A serum bottle without supplemental Cu was used as a control. The autoclaved serum bottles containing the NMS media supplemented with appropriate concentrations of Cu were vacuumed to remove the oxygen, nitrogen, and other trace atmospheric gases within the batch system. The removal of the atmospheric gases and the methane-to-oxygen ratio were confirmed using a gas chromatograph (Model #8610C, SRI Instruments, Torrance, CA, USA) before inoculation. Subsequently, ultra-highly pure methane and oxygen were purged separately at 15 psi for 3 min and 1 min, respectively, to maintain the methane-to-oxygen ratio at 3:1 (at 1 atm) in all the serum bottles. After 45 min of purging the methane and oxygen, the serum bottles were inoculated with 2% (v/v) of a seed culture of M. trichosporium OB3b (OD600 = 0.2). The seed culture for the purpose was prepared by using the same NMS media composition (without Cu and with 40 µM Fe) and protocol mentioned above and inoculated from the deep-frozen (−80 °C) OB3b glycerol suspension. The culture-containing serum bottles were incubated at 30 °C and were shaken at 200 rpm continuously throughout the period of experiment. The experiment was performed in triplicates and repeated.
The growth statistics of OB3b cells under each Cu condition were monitored using an absorbance spectrophotometer (Model #141204E, BioTek Instruments, Winooski, VT, USA) at a wavelength of 600 nm at an interval of 24 h for 10 days. The growth statistics for all the samples were measured with the best-fitting linear model, which was a third-degree polynomial curve with a goodness of fit (R2) of 0.96 ± 2%. The maximum specific growth rates (µmax) were calculated in accordance with the batch equation dX/dt = µX, where X is the concentration of cells and µ is the specific growth rate. The doubling time was calculated with the equation ln(2)/µmax.

3.2. Measurement of Consumption Rates of the Gases

The changes in methane and oxygen in the headspace of each batch culture were analyzed using a gas chromatograph (Model #8610C, SRI Instruments, Torrance, CA, USA) using a thermal conductivity detector [61]. Due to significant differences in the thermal conductivity between argon (0.018 W/mK) and the measured gases (methane, 0.0343 W/mK and oxygen, 0.027 W/mK) at 300 K and 1 atm, argon was used as a carrier gas (sourced at 40 psi), and the chromatograph was set at a constant pressure of 14 psi. The oven temperature was varied from 150 °C to 250 °C at a step input interval of 10 °C. The peaks of oxygen and methane were observed at two significantly different retention times, 1.15 and 1.58 min, respectively, and the corresponding areas were observed. The observed peak area of each gas was compared to the known area versus the concentration (calibration curve), and the concentration was noted. The gaseous concentration readings were taken at an interval of 24 h for a period of 10 days.

3.3. Measurement of Extracellular Methanol

The concentration of methanol in the liquid phase of the growing culture was measured using high-pressure liquid chromatography (HPLC, Model #LC-2030C Plus, Shimadzu, Columbia, MD, USA). A total of 1 mL of the culture was sampled out from each of the serum bottles in 1.5 mL Eppendorf flasks and was centrifuged at 10,000 rpm for 10 min. The cell-free supernatant was then filter-sterilized using 0.22 µm circular polypropylene membrane filters and transferred into 2 mL HPLC-compatible vials (Waters, Milford, MA, USA). Sulfuric acid at a concentration of 0.005 M was used as a mobile phase for all the runs. The samples were drawn into the column with a flow rate of 0.6 mL/min. The UV detection method at a 215 nm wavelength and an ion-exclusion organic acid column (Model #87H, Bio-Rad, Hercules, CA, USA) were employed to measure the methanol, and the respective sharp peak was observed at the retention time 2.48 min. The calibration curve was prepared using the known concentrations of methanol (Catalog# 34860, Sigma Aldrich, St. Louis, MO, USA), ranging from 0 to 1000 µM.

3.4. Stoichiometry Calculations

Theoretically, each mole of methane reacts with half mole of oxygen to produce one mole of methanol. The experimental stoichiometry ratios (S.Rs) and the extracellular methanol percentages (%) in this study were calculated as below with the consideration of the chemical equation CH4 + 1 2 O2 → CH3OH.
E x p e r i m e n t a l   ( S . R )   b e t w e e n   o x y g e n   a n d   m e t h a n e   = O x y g e n   c o n s u m p t i o n   ( m o l e s ) M e t h a n e   c o n s u m p t i o n   ( m o l e s )
E x p e r i m e n t a l   ( S . R )   b e t w e e n   e x t r a c e l l u l a r   m e t h a n o l   a n d   m e t h a n e   = M e t h a n o l   c o n s u m p t i o n   ( m o l e s ) M e t h a n e   c o n s u m p t i o n   ( m o l e s )
Extracellular methanol% = experimental stoichiometric ratio between methanol and methane × 100
Intracellular methanol% = 100% (theoretical methanol to methane stoichiometry is 1:1) − extracellular methanol%

3.5. Profiling of Copper and Iron Concentrations

The concentrations of Cu and Fe were measured using inductively coupled plasma mass spectrometry (ICP-MS, Model #7900, Agilent Technologies, Santa Clara, CA, USA). A total of 1 mL of the media samples containing OB3b cells was taken out using a syringe with 21-gauge needles from the serum bottles every 24 h to determine the changes in the metal concentration within the media. The samples were centrifuged at 10,000 rpm for 10 min, and the supernatants were collected. To prepare high-purity samples devoid of cell particulates, the collected liquid supernatants were filtered out using 0.22 µm circular polypropylene filters. A total of 9 mL of the filtered samples was vortex-mixed with 1 mL of the 20% trace-metal-grade nitric acid, and the resulting samples were stored in falcon tubes at 4 °C for analysis. To maintain less than 200 ppm of the total dissolved solids and less than 5% of the total acid content, a second dilution was required. Therefore, the resulting sample solutions were further diluted by adding 9 mL of the 2% trace-metal-grade nitric acid to 1 mL of the solution. A standard calibration was performed using 0.001, 0.01, 0.1, and 10 ppm certified reference materials (Fe and Cu stocked at 100 ppm in 5% nitric acid). The carrier solution was 2% nitric acid. An automated measurement of each unknown sample was performed using the instrument, and the data are plotted in terms of Cu and Fe removal.

3.6. Naphthalene–Ortho-Dianisidine Assay

The naphthalene–o-dianisidine assay method is an established method to distinguish between the cells producing sMMO from those producing pMMO [62]. To perform the assay, 50 µL samples of the batch cultures were pipetted out uniformly on NMS–agar plates. NMS–agar plates containing no Cu were prepared by supplementing 2.5% agar to the same NMS media composition (mentioned under Section 2.1). A few naphthalene crystals were sprinkled in the lid of the plate, and the plate was stored inverted at 30 °C for 15 min in air. The reaction was incubated for a fixed time of 45 min. The plates were then opened and lightly sprayed with freshly prepared 2.5 mg/mL o-dianisidine (tetrazotized; zinc chloride complex, Catalog# D9143, Sigma Aldrich, St. Louis, MO, USA) for 2 to 3 s. The lids were replaced, and the plates were stored for 15 min in the presence of the dye. If naphthol was produced by the plated culture, a purple-red color appeared upon contact with the dye. The color, once formed, remained stable for at least 24 h at room temperature [62].

3.7. Quantitative Molisch-Based Naphthalene Assay

The principle of this derived naphthalene–Molisch assay is based on the underlying principle of both the Molisch test for carbohydrates and the naphthalene–o-dianisidine assay for phenolic compounds [62,63]. To quantify the whole-cell naphthol production, 2 mL of the batch cultures was collected in test tubes, and 0.1% (v/v) glucose was supplemented. The 2% (v/v) molecular-grade absolute ethanol was added to the solution. If naphthol was produced by the culture, a deep bluish-red color appeared upon addition of 2 µL of diluted (10% v/v) sulfuric acid. Naphthol standards were prepared with a range from 1 mg/mL to 100 mg/mL (along with a blank) at a concentration difference of 5 mg/mL using the same composition, and the calibration curve (absorbance vs. concentration) was prepared. A total of 200 µL of the colored solution was measured using an absorbance spectrophotometer at 540 nm and compared with the calibration curve for concentrations. The absorbance wavelength was optimized and chosen on the basis of scanning, which was performed between 400 nm and 540 nm, which corresponds to azo compounds [64,65]. The detailed optimization workflow and the working principle of the naphthalene–Molisch assay is shown in Figure 4, and the prepared standard curve is provided in Supplementary Figure S1.

3.8. Total RNA Isolation from Whole Cells

Total RNA was extracted from the control and test samples with different Cu concentrations (3, 4, 5, 6, and 10 µM) by sampling out 10 mL of the bacterial culture from the serum bottles on the 4th day. The OD600 for the respective OB3b cultures at the 4th day corresponded to the different exponential phases of the cellular growth. A total of 10 mL of each of the OB3b cultures from different Cu concentrations was pelleted down using centrifugation at 10,000× g for 10 min at 4 °C. The cell pellets were collected and washed three times with 1X phosphate-buffered saline (pH 7.4) to remove any unwanted media components that could hinder the RNA extraction. Subsequently, the cell pellets were transferred to sterile 2 mL microcentrifuge tubes for further extraction steps. Total RNA was extracted using a complete DNA and RNA Purification Kit following the manufacturer’s instructions (Lucigen, Middleton, WI, USA) and eluted in 20 µL of TE buffer. RNA purity was evaluated using a Nanodrop UV–Vis spectrophotometer (Thermo Fisher Scientific, Waltham, MA, USA). The concentration was further validated using a Qubit RNA assay kit and Qubit 3.0 fluorometer (Thermo Fisher Scientific, Waltham, MA, USA). Finally, RNA integrity was measured using a Bioanalyzer 2100 system (Agilent Technologies, Santa Clara, CA, USA).

3.9. qPCR Gene Expression

Prior to proceeding with the qPCR studies and as a precautionary measure against DNA contamination, we conducted gel electrophoresis (1.4% agarose gel,) using the extracted RNA (2 µL of RNA sample in 3 µL of nuclease-free water and 2 µL of 2xRNA loading dye) from each sample. The results revealed distinct bands corresponding to 23S and 16S rRNA at 3000 and ~1800 bp, respectively (Figure S2). The genes belonging to pMMO, sMMO, and mbn operon were selected for the RT-PCR to determine the mechanism of switching between pMMO and sMMO. Firstly, the cDNA of each sample was synthesized from 1.5 µL of the extracted total RNA (Figure S3, RNA integrity number: 6.7–7.5, and average concentration: 980–1200 ng/µL) using a QuantiTect Reverse Transcription Kit (Qiagen, Germantown, MD, USA). Subsequently, RT-qPCR was performed in a QuantStudio 3 Real-Time PCR system (Model #A28132, Thermo Fisher Scientific, Waltham, MA, USA) using a Maxima SYBR Green/ROX qPCR Master Mix (Thermo Fisher Scientific, Waltham, MA, USA) in 0.2 mL PCR tube strips (Thermo Fisher Scientific, Waltham, MA, USA). The NCBI accession ID and the gene-specific primer sequences used for RT-qPCR are shown in Supplementary Table S5. The 16S rRNA gene was used as an internal gene standard for PCR amplification and data normalization. Normalized fold changes in the relative expression ratio between the control and test samples were reckoned by the 2−ΔΔCT comparative method. The gene expressions are reported in terms of the base-2 logarithmic value of the 2−ΔΔCT method and are denoted as log2FC values. All experiments were performed in triplicates using independent samples, and their mean value and standard error of the mean were calculated.

3.10. Protein–Protein Interaction Using STRING Database and Cytoscape

The STRING (Search Tool for Interacting Genes Retrieval) database, which is a precomputation global resource for the prediction of the functional association between proteins, was used to analyze the physical protein–protein interactions (PPIs) [66]. The purpose for the PPI interaction in this study was to decipher the relationships between the genes responsible for Cu acquisition and MMOs and to further uncover the mechanism of Cu acquisition beyond the limit of methanobactin. The PPI network was enriched using STRING database with the inputs of genes from pMMO, sMMO, and mbn operon. The significantly enriched genes (p-value < 1.6 × 10⁻¹⁶) were visualized using the PPI visualization software Cytoscape (version-3.9.1). The Cytoscape plugin stringApp was used to perform pathway enrichment analysis and import PPI networks from the STRING database to Cytoscape. Methylosinus trichosporium OB3b was selected as the organism, and a confidence score cutoff of greater than 0.40 was used to find potential interactors. Highly connected regions of the network were identified using the ClusterONE (version 1.0) algorithm with the following criteria: minimum size = 3, minimum density = 0.05, and edge weights = combined score. The most enriched gene set was screened on the basis of false discovery (<1.0 × 10⁻⁶). In the PPI network, the nodes correspond to the proteins, and the edges depict the interactions.

4. Conclusions

The findings of this study indicate that an increase in Cu concentration in the growth medium corresponds to a proportional enhancement in the growth rate of OB3b cells and the subsequent methane oxidation rates. The newly developed naphthalene–Molisch assay showed no trace of naphthol in the samples with ≥5 µM Cu. The q-PCR expression data demonstrated the downregulation of sMMO genes and the upregulation of pMMO genes when the Cu concentration exceeded 3 µM in the medium. This indicates that Cu concentrations between 3 µM and 5 µM are suitable for the expression of both sMMO and pMMO within OB3b cells, which could be beneficial in the bioremediation of unknown compounds such as chlorinated aliphatics and aromatics. The mbn operon expression data showed that the di-heme enzyme (mbnH) and Ton-B-dependent receptor (mbnT) were upregulated at higher Cu concentrations. For an uncertain reason, the hypothetical gene at the upstream of mbnA synthesis precursor showed significant changes in expression under different Cu concentrations, which may be crucial in the biosynthesis process or in any other possible role. The protein–protein interaction data indicated that transporter genes, cell biosynthesis genes, the copper resistance gene, and a few hypothetical proteins play a collaborative role in the controlled copper uptake and homeostasis mechanism within the cells, aside from MMOs and methanobactin. The overall findings of this study fill a potential knowledge gap in understanding the copper-mediated physiology and genetics of methanotrophs using M. trichosporium OB3b.

Supplementary Materials

The following supporting information can be downloaded at: https://www.mdpi.com/article/10.3390/methane3010007/s1, Figure S1: Naphthol concentration calibration curve at wavelength of 540 nm; Figure S2: RNA gel-electrophoresis image; Figure S3: Bioanalyzer RNA gel-electrophoresis image; Table S1: The specific growth rate (µ, day−1) and the doubling time (td, days) for each individual concentration. All standard deviations are within 5% of the µmax (day−1); Table S2: Methanobactin-mediated cellular genes and the physical protein–protein interactions (PPIs) between the methanobactin synthesis cassette genes (mbnB and mbnC), MMOs, and other enriched genes; Table S3: StringDb enrichment statistics; Table S4: Network analysis between the enriched genes; Table S5: Forward and reverse primers of gene sets used in expression studies.

Author Contributions

Conceptualization, D.S. and R.K.S.; methodology, T.G., V.G. and D.S.; software, P.S. and D.S.; validation, D.S., V.G., T.G. and R.K.S.; formal analysis, D.S., T.G. and P.S.; investigation, D.S., T.G., K.M.G., L.K. and R.K.S.; resources, R.K.S.; data curation, D.S.; writing—original draft preparation, D.S.; writing—review and editing, D.S., T.G., P.S., K.M.G., L.K., V.G. and R.K.S.; visualization, P.S. and D.S.; supervision, R.K.S.; project administration, R.K.S.; funding acquisition, R.K.S. All authors have read and agreed to the published version of the manuscript.

Funding

This research was funded by the National Science Foundation in the form of the BuG ReMeDEE initiative (award #1736255, #1849206, and #1920954).

Data Availability Statement

Data are contained within the article and supplementary materials.

Acknowledgments

The authors acknowledge the support by the Department of Chemical and Biological Engineering at the South Dakota School of Mines and Technology.

Conflicts of Interest

The authors declare no conflicts of interest. The funders had no role in the design of the study; in the collection, analyses, or interpretation of data; in the writing of the manuscript; or in the decision to publish the results.

References

  1. Sahoo, K.K.; Goswami, G.; Das, D. Biotransformation of Methane and Carbon Dioxide into High-Value Products by Methanotrophs: Current State of Art and Future Prospects. Front. Microbiol. 2021, 12, 520. [Google Scholar] [CrossRef] [PubMed]
  2. Guerrero-Cruz, S.; Vaksmaa, A.; Horn, M.A.; Niemann, H.; Pijuan, M.; Ho, A. Methanotrophs: Discoveries, environmental relevance, and a perspective on current and future applications. Front. Microbiol. 2021, 12, 1057. [Google Scholar] [CrossRef] [PubMed]
  3. Lawton, T.J.; Rosenzweig, A.C. Methane-oxidizing enzymes: An upstream problem in biological gas-to-liquids conversion. J. Am. Chem. Soc. 2016, 138, 9327–9340. [Google Scholar] [CrossRef] [PubMed]
  4. Choi, D.-W.; Kunz, R.C.; Boyd, E.S.; Semrau, J.D.; Antholine, W.E.; Han, J.-I.; Zahn, J.A.; Boyd, J.M.; de la Mora, A.M.; DiSpirito, A.A. The membrane-associated methane monooxygenase (pMMO) and pMMO-NADH: Quinone oxidoreductase complex from Methylococcus capsulatus Bath. J. Bacteriol. 2003, 185, 5755–5764. [Google Scholar] [CrossRef]
  5. Haque, M.F.U.; Xu, H.-J.; Murrell, J.C.; Crombie, A. Facultative methanotrophs—Diversity, genetics, molecular ecology and biotechnological potential: A mini-review. Microbiology 2020, 166, 894. [Google Scholar]
  6. Smith, T.; Dalton, H. Biocatalysis by methane monooxygenase and its implications for the petroleum industry. Stud. Surf. Sci. Catal. 2004, 151, 177–192. [Google Scholar]
  7. Semrau, J.D.; DiSpirito, A.A.; Yoon, S. Methanotrophs and copper. FEMS Microbiol. Rev. 2010, 34, 496–531. [Google Scholar] [CrossRef]
  8. Chidambarampadmavathy, K.; Obulisamy, P.; Heimann, K. Role of copper and iron in methane oxidation and bacterial biopolymer accumulation. Eng. Life Sci. 2015, 15, 387–399. [Google Scholar] [CrossRef]
  9. Semrau, J.D.; DiSpirito, A.A.; Gu, W.; Yoon, S. Metals and methanotrophy. Appl. Environ. Microbiol. 2018, 84, e02289-17. [Google Scholar] [CrossRef]
  10. Fru, E.C. Copper biogeochemistry: A cornerstone in aerobic methanotrophic bacterial ecology and activity? Geomicrobiol. J. 2011, 28, 601–614. [Google Scholar] [CrossRef]
  11. Lontoh, S.T. Substrate Oxidation by Methanotrophs Expressing Particulate Methane Monooxygenase (pMMO): A Study of Whole-Cell Oxidation of Trichloroethylene and Its Potential Use for Environmental Remediation; University of Michigan: Ann Arbor, MI, USA, 2000. [Google Scholar]
  12. Lontoh, S.; Semrau, J.D. Methane and trichloroethylene degradation by Methylosinus trichosporium OB3b expressing particulate methane monooxygenase. Appl. Environ. Microbiol. 1998, 64, 1106–1114. [Google Scholar] [CrossRef] [PubMed]
  13. Morton, J.D.; Hayes, K.F.; Semrau, J.D. Effect of copper speciation on whole-cell soluble methane monooxygenase activity in Methylosinus trichosporium OB3b. Appl. Environ. Microbiol. 2000, 66, 1730–1733. [Google Scholar] [CrossRef]
  14. Gilbert, B.; McDonald, I.R.; Finch, R.; Stafford, G.P.; Nielsen, A.K.; Murrell, J.C. Molecular analysis of the pmo (particulate methane monooxygenase) operons from two type II methanotrophs. Appl. Environ. Microbiol. 2000, 66, 966–975. [Google Scholar] [CrossRef] [PubMed]
  15. Ross, M.O.; MacMillan, F.; Wang, J.; Nisthal, A.; Lawton, T.J.; Olafson, B.D.; Mayo, S.L.; Rosenzweig, A.C.; Hoffman, B.M. Particulate methane monooxygenase contains only mononuclear copper centers. Science 2019, 364, 566–570. [Google Scholar] [CrossRef] [PubMed]
  16. Hakemian, A.S.; Kondapalli, K.C.; Telser, J.; Hoffman, B.M.; Stemmler, T.L.; Rosenzweig, A.C. The metal centers of particulate methane monooxygenase from Methylosinus trichosporium OB3b. Biochemistry 2008, 47, 6793–6801. [Google Scholar] [CrossRef] [PubMed]
  17. Pan, Y.; Shen, X.; Yao, L.; Bentalib, A.; Peng, Z. Active sites in heterogeneous catalytic reaction on metal and metal oxide: Theory and practice. Catalysts 2018, 8, 478. [Google Scholar] [CrossRef]
  18. Samanta, D.; Govil, T.; Salem, D.R.; Krumholz, L.R.; Gerlach, R.; Gadhamshetty, V.; Sani, R.K. Methane Monooxygenases: Their Regulations and Applications in Biofuel Production. In Microbes for Sustainable Development and Bioremediation; CRC Press: Boca Raton, FL, USA, 2019; pp. 187–206. [Google Scholar]
  19. Samanta, D.; Govil, T.; Saxena, P.; Gadhamshetty, V.; Krumholz, L.R.; Salem, D.R.; Sani, R.K. Enhancement of Methane Catalysis Rates in Methylosinus trichosporium OB3b. Biomolecules 2022, 12, 560. [Google Scholar] [CrossRef]
  20. Peng, P.; Yang, J.; DiSpirito, A.A.; Semrau, J.D. MmoD regulates soluble methane monooxygenase and methanobactin production in Methylosinus trichosporium OB3b. Appl. Environ. Microbiol. 2023, 89, e01601-23. [Google Scholar] [CrossRef]
  21. Gu, W.; Farhan Ul Haque, M.; Semrau, J.D. Characterization of the role of copCD in copper uptake and the ‘copper-switch’in Methylosinus trichosporium OB3b. FEMS Microbiol. Lett. 2017, 364, fnx094. [Google Scholar] [CrossRef]
  22. Kenney, G.E.; Sadek, M.; Rosenzweig, A.C. Copper-responsive gene expression in the methanotroph Methylosinus trichosporium OB3b. Metallomics 2016, 8, 931–940. [Google Scholar] [CrossRef]
  23. Semrau, J.D.; DiSpirito, A.A.; Obulisamy, P.K.; Kang-Yun, C.S. Methanobactin from methanotrophs: Genetics, structure, function and potential applications. FEMS Microbiol. Lett. 2020, 367, fnaa045. [Google Scholar] [CrossRef]
  24. Kenney, G.E.; Rosenzweig, A.C. Chalkophores. Annu. Rev. Biochem. 2018, 87, 645–676. [Google Scholar] [CrossRef]
  25. Kenney, G.E.; Rosenzweig, A.C. Genome mining for methanobactins. BMC Biol. 2013, 11, 17. [Google Scholar] [CrossRef]
  26. Sirajuddin, S.; Rosenzweig, A.C. Enzymatic oxidation of methane. Biochemistry 2015, 54, 2283–2294. [Google Scholar] [CrossRef]
  27. Aimen, H.; Khan, A.S.; Kanwal, N. Methanotrophs: The natural way to tackle greenhouse effect. J. Bioremediat. Biodegrad. 2018, 9, 432. [Google Scholar] [CrossRef]
  28. Park, S.; Hanna, L.; Taylor, R.T.; Droege, M.W. Batch cultivation of Methylosinus trichosporium OB3b. I: Production of soluble methane monooxygenase. Biotechnol. Bioeng. 1991, 38, 423–433. [Google Scholar] [CrossRef]
  29. Hwang, I.Y.; Hur, D.H.; Lee, J.H.; Park, C.-H.; Chang, I.S.; Lee, J.W.; Lee, E.Y. Batch conversion of methane to methanol using Methylosinus trichosporium OB3b as biocatalyst. J. Microbiol. Biotechnol. 2015, 25, 375–380. [Google Scholar] [CrossRef] [PubMed]
  30. DiSpirito, A.A.; Zahn, J.A.; Graham, D.W.; Kim, H.J.; Larive, C.K.; Derrick, T.S.; Cox, C.D.; Taylor, A. Copper-binding compounds from Methylosinus trichosporium OB3b. J. Bacteriol. 1998, 180, 3606–3613. [Google Scholar] [CrossRef] [PubMed]
  31. Van Hylckama, V.J.; de Koning, W.; Janssen, D.B. Transformation kinetics of chlorinated ethenes by Methylosinus trichosporium OB3b and detection of unstable epoxides by on-line gas chromatography. Appl. Environ. Microbiol. 1996, 62, 3304–3312. [Google Scholar] [CrossRef] [PubMed]
  32. Xing, Z.; Zhao, T.; Gao, Y.; He, Z.; Yang, X.; Peng, X. Depth profiles of methane oxidation kinetics and the related methanotrophic community in a simulated landfill cover. Huan Jing Ke Xue = Huanjing Kexue 2015, 36, 4302–4310. [Google Scholar] [PubMed]
  33. Cantera, S.; Lebrero, R.; García-Encina, P.A.; Muñoz, R. Evaluation of the influence of methane and copper concentration and methane mass transport on the community structure and biodegradation kinetics of methanotrophic cultures. J. Environ. Manag. 2016, 171, 11–20. [Google Scholar] [CrossRef]
  34. Guggenheim, C.; Brand, A.; Bürgmann, H.; Sigg, L.; Wehrli, B. Aerobic methane oxidation under copper scarcity in a stratified lake. Sci. Rep. 2019, 9, 4817. [Google Scholar] [CrossRef] [PubMed]
  35. Xing, Z.; Zhao, T.; Zhang, L.; Gao, Y.; Liu, S.; Yang, X. Effects of copper on expression of methane monooxygenases, trichloroethylene degradation, and community structure in methanotrophic consortia. Eng. Life Sci. 2018, 18, 236–243. [Google Scholar] [CrossRef] [PubMed]
  36. Koo, C.W.; Rosenzweig, A.C. Biochemistry of aerobic biological methane oxidation. Chem. Soc. Rev. 2021, 50, 3424–3436. [Google Scholar] [CrossRef] [PubMed]
  37. Tentori, E.F.; Richardson, R.E. Methane monooxygenase gene transcripts as quantitative biomarkers of methanotrophic activity in Methylosinus trichosporium OB3b. Appl. Environ. Microbiol. 2020, 86, e01048-20. [Google Scholar] [CrossRef] [PubMed]
  38. Scheutz, C.; Kjeldsen, P. Environmental factors influencing attenuation of methane and hydrochlorofluorocarbons in landfill cover soils. J. Environ. Qual. 2004, 33, 72–79. [Google Scholar] [CrossRef] [PubMed]
  39. Zhang, T.; Zhou, J.; Wang, X.; Zhang, Y. Coupled effects of methane monooxygenase and nitrogen source on growth and poly-β-hydroxybutyrate (PHB) production of Methylosinus trichosporium OB3b. J. Environ. Sci. 2017, 52, 49–57. [Google Scholar] [CrossRef]
  40. Duan, C.; Luo, M.; Xing, X. High-rate conversion of methane to methanol by Methylosinus trichosporium OB3b. Bioresour. Technol. 2011, 102, 7349–7353. [Google Scholar] [CrossRef]
  41. Takeguchi, M.; Furuto, T.; Sugimori, D.; Okura, I. Optimization of methanol biosynthesis by Methylosinus trichosporium OB3b: An approach to improve methanol accumulation. Appl. Biochem. Biotechnol. 1997, 68, 143–152. [Google Scholar] [CrossRef]
  42. Begonja, A.; Hrsak, D. Effect of growth conditions on the expression of soluble methane monooxygenase. Food Technol. Biotechnol. 2001, 39, 29–36. [Google Scholar]
  43. Collins, J.F.; Prohaska, J.R.; Knutson, M.D. Metabolic crossroads of iron and copper. Nutr. Rev. 2010, 68, 133–147. [Google Scholar] [CrossRef] [PubMed]
  44. Hofmann, M.; Retamal-Morales, G.; Tischler, D. Metal binding ability of microbial natural metal chelators and potential applications. Nat. Prod. Rep. 2020, 37, 1262–1283. [Google Scholar] [CrossRef] [PubMed]
  45. Warren, M.J.; Lin, X.; Gaby, J.C.; Kretz, C.B.; Kolton, M.; Morton, P.L.; Pett-Ridge, J.; Weston, D.J.; Schadt, C.W.; Kostka, J.E. Molybdenum-based diazotrophy in a Sphagnum peatland in northern Minnesota. Appl. Environ. Microbiol. 2017, 83, e01174-17. [Google Scholar] [CrossRef] [PubMed]
  46. Han, B.; Su, T.; Li, X.; Xing, X. Research progresses of methanotrophs and methane monooxygenases. Sheng Wu Gong Cheng Xue Bao = Chin. J. Biotechnol. 2008, 24, 1511–1519. [Google Scholar]
  47. Brusseau, G.A.; Tsien, H.-C.; Hanson, R.S.; Wackett, L.P. Optimization of trichloroethylene oxidation by methanotrophs and the use of a colorimetric assay to detect soluble methane monooxygenase activity. Biodegradation 1990, 1, 19–29. [Google Scholar] [CrossRef] [PubMed]
  48. Henry, S.M.; Grbic-Galic, D. Effect of mineral media on trichloroethylene oxidation by aquifer methanotrophs. Microb. Ecol. 1990, 20, 151–169. [Google Scholar] [CrossRef]
  49. Nguyen, H.-H.T.; Elliott, S.J.; Yip, J.H.-K.; Chan, S.I. The particulate methane monooxygenase from Methylococcus capsulatus (Bath) is a novel copper-containing three-subunit enzyme: Isolation and characterization. J. Biol. Chem. 1998, 273, 7957–7966. [Google Scholar] [CrossRef]
  50. DiSpirito, A.A.; Semrau, J.D.; Murrell, J.C.; Gallagher, W.H.; Dennison, C.; Vuilleumier, S. Methanobactin and the link between copper and bacterial methane oxidation. Microbiol. Mol. Biol. Rev. 2016, 80, 387–409. [Google Scholar] [CrossRef]
  51. Vita, N.; Platsaki, S.; Baslé, A.; Allen, S.J.; Paterson, N.G.; Crombie, A.T.; Murrell, J.C.; Waldron, K.J.; Dennison, C. A four-helix bundle stores copper for methane oxidation. Nature 2015, 525, 140–143. [Google Scholar] [CrossRef]
  52. Wymore, R.A.; Lee, M.H.; Keener, W.K.; Miller, A.R.; Colwell, F.S.; Watwood, M.E.; Sorenson, K.S., Jr. Field evidence for intrinsic aerobic chlorinated ethene cometabolism by methanotrophs expressing soluble methane monooxygenase. Bioremediat. J. 2007, 11, 125–139. [Google Scholar] [CrossRef]
  53. Kenney, G.E.; Rosenzweig, A.C. Methanobactins: Maintaining copper homeostasis in methanotrophs and beyond. J. Biol. Chem. 2018, 293, 4606–4615. [Google Scholar] [CrossRef] [PubMed]
  54. Gu, W.; Baral, B.S.; DiSpirito, A.A.; Semrau, J.D. An aminotransferase is responsible for the deamination of the N-terminal leucine and required for formation of oxazolone ring A in methanobactin of Methylosinus trichosporium OB3b. Appl. Environ. Microbiol. 2017, 83, e02619-16. [Google Scholar] [CrossRef] [PubMed]
  55. Prabakaran, S.; Lippens, G.; Steen, H.; Gunawardena, J. Post-translational modification: Nature’s escape from genetic imprisonment and the basis for dynamic information encoding. Wiley Interdiscip. Rev. Syst. Biol. Med. 2012, 4, 565–583. [Google Scholar] [CrossRef] [PubMed]
  56. Dershwitz, P.; Gu, W.; Roche, J.; Kang-Yun, C.S.; Semrau, J.D.; Bobik, T.A.; Fulton, B.; Zischka, H.; DiSpirito, A.A. MbnC Is Not Required for the Formation of the N-Terminal Oxazolone in the Methanobactin from Methylosinus trichosporium OB3b. Appl. Environ. Microbiol. 2022, 88, e01841-21. [Google Scholar] [CrossRef] [PubMed]
  57. Semrau, J.D.; Jagadevan, S.; DiSpirito, A.A.; Khalifa, A.; Scanlan, J.; Bergman, B.H.; Freemeier, B.C.; Baral, B.S.; Bandow, N.L.; Vorobev, A. Methanobactin and MmoD work in concert to act as the ‘copper-switch’ in methanotrophs. Environ. Microbiol. 2013, 15, 3077–3086. [Google Scholar] [CrossRef]
  58. Peng, P.; Kang-Yun, C.S.; Chang, J.; Gu, W.; DiSpirito, A.A.; Semrau, J.D. Two TonB-Dependent Transporters in Methylosinus trichosporium OB3b Are Responsible for Uptake of Different Forms of Methanobactin and Are Involved in the Canonical “Copper Switch”. Appl. Environ. Microbiol. 2022, 88, e01793-21. [Google Scholar] [CrossRef]
  59. Peng, P.; Gu, W.; DiSpirito, A.A.; Semrau, J.D. Multiple Mechanisms for Copper Uptake by Methylosinus trichosporium OB3b in the Presence of Heterologous Methanobactin. mBio 2022, 13, e02239-22. [Google Scholar] [CrossRef]
  60. Samanta, D.; Singh, R.N.; Goh, K.M.; Sani, R.K. Integrating metabolomics and whole genome sequencing to elucidate the metabolic pathways in Methylosinus trichosporium OB3b. Syst. Microbiol. Biomanuf. 2023, 1–14. [Google Scholar] [CrossRef]
  61. Paul, B.G.; Ding, H.; Bagby, S.C.; Kellermann, M.Y.; Redmond, M.C.; Andersen, G.L.; Valentine, D.L. Methane-oxidizing bacteria shunt carbon to microbial mats at a marine hydrocarbon seep. Front. Microbiol. 2017, 8, 186. [Google Scholar] [CrossRef]
  62. Graham, D.W.; Korich, D.G.; LeBlanc, R.P.; Sinclair, N.A.; Arnold, R.G. Applications of a colorimetric plate assay for soluble methane monooxygenase activity. Appl. Environ. Microbiol. 1992, 58, 2231–2236. [Google Scholar] [CrossRef]
  63. Foulger, J.H. The use of the Molisch (α-naphthol) reactions in the study of sugars in biological fluids. J. Biol. Chem. 1931, 92, 345–353. [Google Scholar] [CrossRef]
  64. Gafar, S.; El-Kelany, M.; El-Shawadfy, S. Spectrophotometric properties of azo dye metal complex and its possible use as radiation dosimeter. J. Radiat. Res. Appl. Sci. 2018, 11, 190–194. [Google Scholar] [CrossRef]
  65. Jarad, A.J.; Kadhim, Z.S.; Mahmood, M.A.; Obaid, S.M. Synthesis, Spectral Studies and Biological Activity of Azo dye Complexes with Some MetalIons. J. Glob. Pharma Technol. 2009, 10, 97–106. [Google Scholar]
  66. Tripathi, A.K.; Saxena, P.; Thakur, P.; Rauniyar, S.; Samanta, D.; Gopalakrishnan, V.; Singh, R.N.; Sani, R.K. Transcriptomics and functional analysis of Copper stress response in the sulfate-reducing bacterium Desulfovibrio alaskensis G20. Int. J. Mol. Sci. 2022, 23, 1396. [Google Scholar] [CrossRef]
Figure 1. (a) Growth statistics, (b) methane consumption, (c) oxygen consumption, and (d) methanol concentration of M. trichosporium OB3b using methane as substrate.
Methane 03 00007 g001
Figure 2. Changes in the concentration of (a) Cu and (b) Fe in presence of different Cu concentrations.
Methane 03 00007 g002
Figure 3. (a) Heat map showing the gene expressions with concentration distance variances and (b) naphthol concentration.
Methane 03 00007 g003
Figure 4. The optimization and working principle of naphthalene–Molisch assay.
Methane 03 00007 g004
Figure 5. (a) Gene expression profile of Mbn and (b) operon system of methanobactin in M. trichosporium OB3b.
Methane 03 00007 g005
Figure 6. Physical protein–protein interactions between the (a) methanobactin (in red), (b) MMOs (in blue), (c) transporters (in green), (d) cell division (in yellow), and (e) hypothetical/domain-containing proteins (in purple). The circles represent the node associated with each gene (marked either with gene name or UniProt accession), and the solid connecting lines represent the edges (network between two genes).
Methane 03 00007 g006
Disclaimer/Publisher’s Note: The statements, opinions and data contained in all publications are solely those of the individual author(s) and contributor(s) and not of MDPI and/or the editor(s). MDPI and/or the editor(s) disclaim responsibility for any injury to people or property resulting from any ideas, methods, instructions or products referred to in the content.

