


Abstract
This study presents the results of a one-month validation campaign focused on wind field reconstruction using a dual-scanning LiDAR configuration. The measurement campaign was conducted inland, approximately 6 km from the Thracian Sea coast in northeastern Greece, and involved the deployment of two scanning LiDAR units alongside a reference meteorological mast. Wind conditions were measured at 82 m above ground level, enabling spatially resolved reconstruction of horizontal wind speed and direction. To investigate the sensitivity of wind field reconstruction to probe volume effects, two range gate length configurations—100 m and 200 m—were systematically alternated during the campaign. This alternating strategy enabled a direct comparison under identical atmospheric conditions. The reconstructed wind speed and direction data exhibited excellent agreement with the reference measurements, achieving a coefficient of determination greater than 0.99, and showed negligible systematic bias. Analysis of turbulence characteristics revealed that the dual-scanning LiDAR system underestimated turbulence intensity compared to the reference meteorological mast. These findings underscore the effectiveness of this technology as a cost-efficient and accurate method for coastal wind characterization. Owing to its ability to reliably reconstruct wind fields over long distances, the system holds strong potential for near-shore and offshore applications.
1. Introduction
The energy sector is responsible for over 75% of the European Union’s greenhouse gas emissions, highlighting the need to expand renewable energy in order to meet the EU’s targets: a 55% emissions reduction by 2030 and climate neutrality by 2050 [1]. Within this context, the deployment of offshore wind farms has emerged as a strategic priority for Greece, aiming to support the national energy transition framework and enhance energy security by integrating clean and cost-competitive electricity into the country’s energy portfolio. According to the revised National Energy and Climate Plan, the total installed offshore wind capacity is expected to reach 1.9 GW by 2030 [2].
A key challenge in the development of offshore wind projects in Greece lies in the limited availability of infrastructure for conducting reliable offshore meteorological and atmospheric measurements. Solutions such as offshore meteorological (met) masts and floating LiDAR systems entail high capital costs and extended timelines for deployment and permitting, thus presenting a significant barrier to market entry and investment. In response, the sector is increasingly exploring alternative technologies, with scanning Doppler LiDAR systems gaining traction as a flexible and cost-efficient solution for offshore wind resource assessment.
Scanning LiDAR (SL) technology provides a flexible and cost-effective alternative to traditional met masts for wind resource assessment, offering accurate measurements of wind speed and direction at multiple heights and locations. Long-range SLs offer great potential to measure wind characteristics for a variety of applications in offshore wind energy [3]. These systems are capable of delivering high-accuracy wind condition measurements over distances of several kilometers, with typical operational ranges reaching up to 15 km, depending on system configuration and prevailing atmospheric conditions [4].
Scan strategies rely on the assumption of horizontal flow homogeneity, which is often invalid in boundary layer meteorology and may affect the quality and spatial resolution of wind field retrievals [5]. Among the various scanning approaches, dual-scanning LiDAR (DSL) systems have emerged as advanced and reliable tools for high-resolution wind flow characterization. DSL systems are often favored over single-scan configurations for several reasons. While a single SL can be employed to estimate both wind speed and direction, such measurements generally require multi-directional scanning and rely on the assumption of horizontal homogeneity within the probed volume [6]. This assumption becomes increasingly invalid as the scanning sector widens—for example, beyond 40°—since wind flow characteristics may vary significantly across such a span, particularly in complex terrain or non-uniform flow conditions. DSL systems mitigate this limitation by enabling spatially resolved, multi-point wind vector measurements without the need to invoke homogeneity assumptions. Nevertheless, their performance is highly dependent on accurate system setup, which requires a detailed understanding of instrument-specific operational parameters under campaign conditions, as well as precise calibration of the scan head alignment at each deployment site [7].
Key parameters of interest in wind energy applications include the horizontal wind velocity components—namely, wind speed and direction—as well as turbulence intensity (TI). These variables are essential for accurate wind resource assessment and for optimizing wind farm design and operation. DSL systems provide multi-directional wind-field measurements without this assumption and, with appropriate geometry and processing, supports more reliable characterization of turbulence statistics and vertical wind shear [8,9]. In parallel, with measurement-based approaches, recent studies have explored data-driven and machine learning methods for wind profile reconstruction using LiDAR measurements, including convolutional neural network-based approaches for improved LiDAR wind profile retrieval and reconstruction [10].
Previous studies have undertaken validation campaigns comparing SL systems with met masts to assess the reliability and accuracy of this emerging measurement technology. Inter-comparison analyses between SL systems, vertical profiling LiDARs, and reference met masts have demonstrated that scanning approaches significantly reduce scatter and directional errors in wind speed estimates under heterogeneous flow conditions [11]. In coastal environments, it has been shown that dual-Doppler lidar configurations provide more accurate measurements of horizontal wind components compared to sector-scan setups, highlighting the advantages of dual systems for reliable characterization of wind fields [12]. Furthermore, recent offshore experiments have confirmed that DSL systems offer improved accuracy in nearshore wind profiling compared to single SL units, reinforcing their suitability for marine wind energy applications [13].
The objective of this study is to contribute to the growing body of research on SL validation by evaluating the performance of a DSL system under realistic coastal conditions through comparison with high-quality reference measurements from a met mast. Particular emphasis is placed on the comparison of two range-gate configurations, 100 m and 200 m, in terms of horizontal wind speed, wind direction, and turbulence intensity under quasi-concurrent atmospheric conditions. The results provide further insight into the influence of range-gate configuration on DSL-derived wind measurements and contribute to the ongoing evaluation of SL for future wind resource assessment applications.
2. Materials and Methods
2.1. Validation Methodology Overview
This study was conducted as part of a one-month validation campaign, aiming to evaluate the level of agreement between wind field reconstructions derived from a DSL system and corresponding reference measurements collected from a met mast. The focus was placed on three key wind parameters: horizontal wind speed, wind direction, and TI.
The DSL system consisted of two spatially separated SLs, positioned several kilometers apart, enabling volumetric wind flow measurements via intersecting line-of-sight (LOS) observations at common points in space. Each LiDAR unit measured the wind velocity component along its beam direction—referred to as the LOS or radial velocity [14]—within a predefined range gate length (RGL), which determines the effective probe volume of the measurement. The LOS velocity at each point was computed by averaging the Doppler shift across the RGL [15], with the center of the RGL defining the spatial location of the measurement.
Two RGL settings (100 m and 200 m) were applied in a systematic schedule to investigate the sensitivity of the DSL system to resolution. The met mast was installed on flat, low-elevation terrain, offering a representative reference environment for coastal and near-shore wind characterization.
2.2. Wind Field Reconstruction
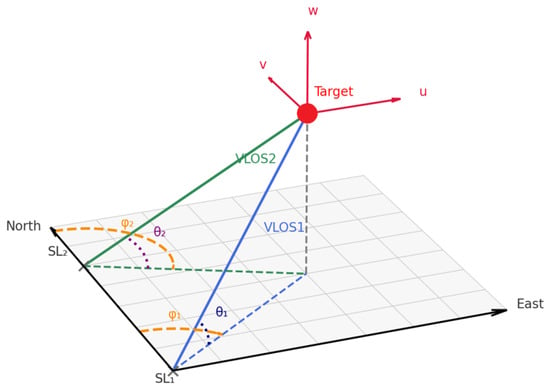
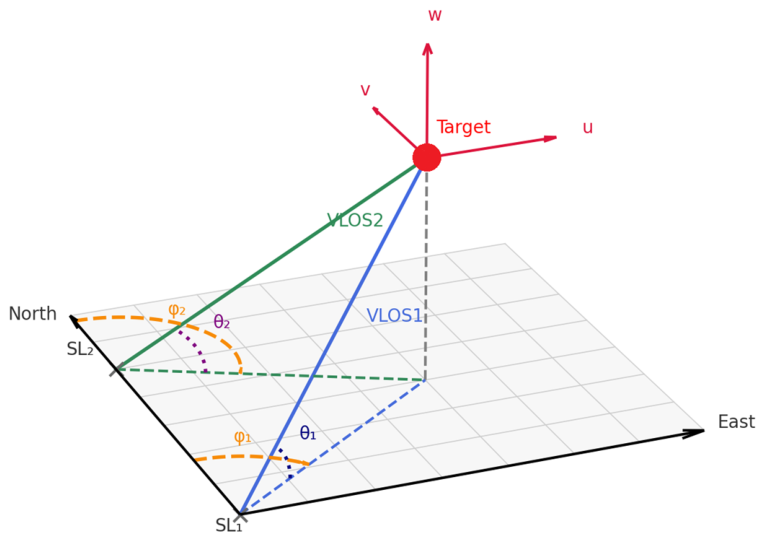
The LOS velocities retrieved by a single SL can be represented as a projection of the three-dimensional wind vector components—, , and —onto the LiDAR beam direction [16], given by Equation (1).
where and denote the azimuth and elevation angles, respectively, and the subscript corresponds to the identification number for SL1 and SL2 (Figure 1).
Figure 1.
Schematic representation of LOS wind velocities and components , and . The red marker indicates the target point, while the blue and green arrows indicate the LOS velocities from SL1 and SL2, respectively.
The calculation of the horizontal wind speed components u and v from the LOS wind velocities measured by the two SLs can be carried out by neglecting the third term on the right-hand side of Equation (1) and applying Equations (2) and (3).
The horizontal wind speed () and wind direction () can be derived from the horizontal components of the wind velocity by applying Equations (4) and (5).
2.3. Experimental Procedure
The campaign was conducted along the Thracian Sea coast in northeastern Greece, from 19 March to 22 April 2025. The measurement site was located approximately 6 km inland from the shoreline, at an elevation between 1 and 3 m above sea level.
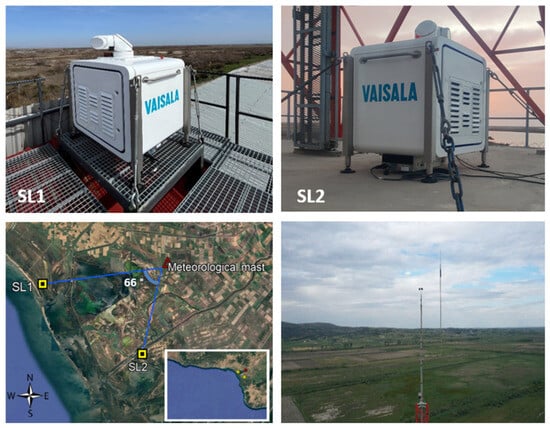
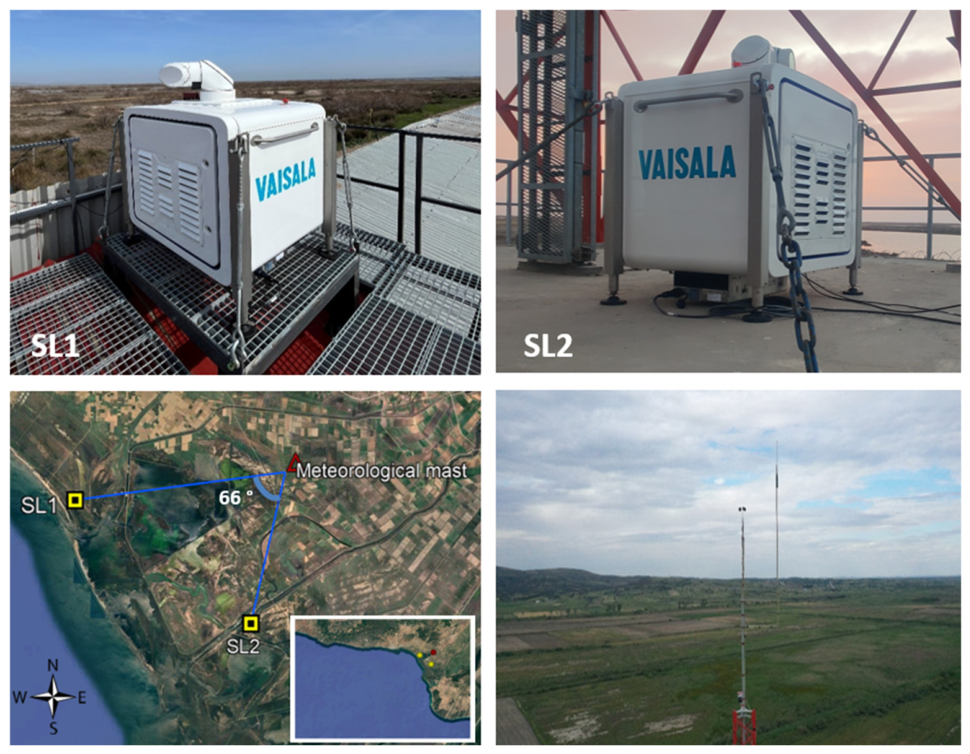
The experiment employed two WindCube scan LiDARs 400S (Wind Energy Edition), manufactured by Vaisala Oyj, Vantaa, Finland. The first unit, referred to as SL1, was installed on an elevated platform, while the second unit, designated SL2, was mounted on the concrete balcony of a telecommunications tower. For validation purposes, a met mast was also deployed at the site, situated 6349 m from SL1 and 4561 m from SL2. The intersection angle between the two beams was 66°, ensuring the required spatial overlap at the designated measurement height. The spatial layout of the two SLs and the met mast is illustrated in Figure 2.
Figure 2.
Spatial arrangement of the instrumentation used during the validation campaign.
The reference met mast was configured in accordance with IEC 61400-12-1 [17], ensuring traceable and high-quality wind measurements. It was installed at an elevation of 1 m above sea level. All cup anemometers (a/m) and wind vanes were calibrated following MEASNET procedures to ensure consistency and comparability of the recorded data (Table 1). The reference instruments used for direct comparison with the DSL system were the top-mounted a/m at 81.8 m and the wind vane at 77.1 m. The mast’s lightning protection rod was installed at an azimuth angle of 122°, carefully positioned to avoid obstruction or shading of the top-mounted a/m, thereby preserving the integrity of wind speed measurements at that level.
Table 1.
Instrumentation used during the validation campaign.
The mast’s power supply was provided by photovoltaic solar panels, with battery storage ensuring continuity during periods of low solar irradiance. Data acquisition was conducted continuously throughout the measurement campaign using a data logger configured to sample at 1 Hz. Wind speed, wind direction, and additional meteorological parameters—including temperature, humidity, and air pressure—were recorded. From the 10-min mast data time series, statistical parameters such as mean, maximum, minimum, and standard deviation were computed.
To ensure temporal consistency between the two datasets, the mast data—originally recorded in UTC + 02:00—were time-shifted by two hours to match the Coordinated Universal Time (UTC) used by the DSL system. Additionally, a directional correction of +5.6° was applied to the mast wind direction measurements to account for the local magnetic declination, aligning the magnetic north-based orientation of the mast with the true north reference frame used by the DSL system.
2.4. Scanning LiDAR Setup
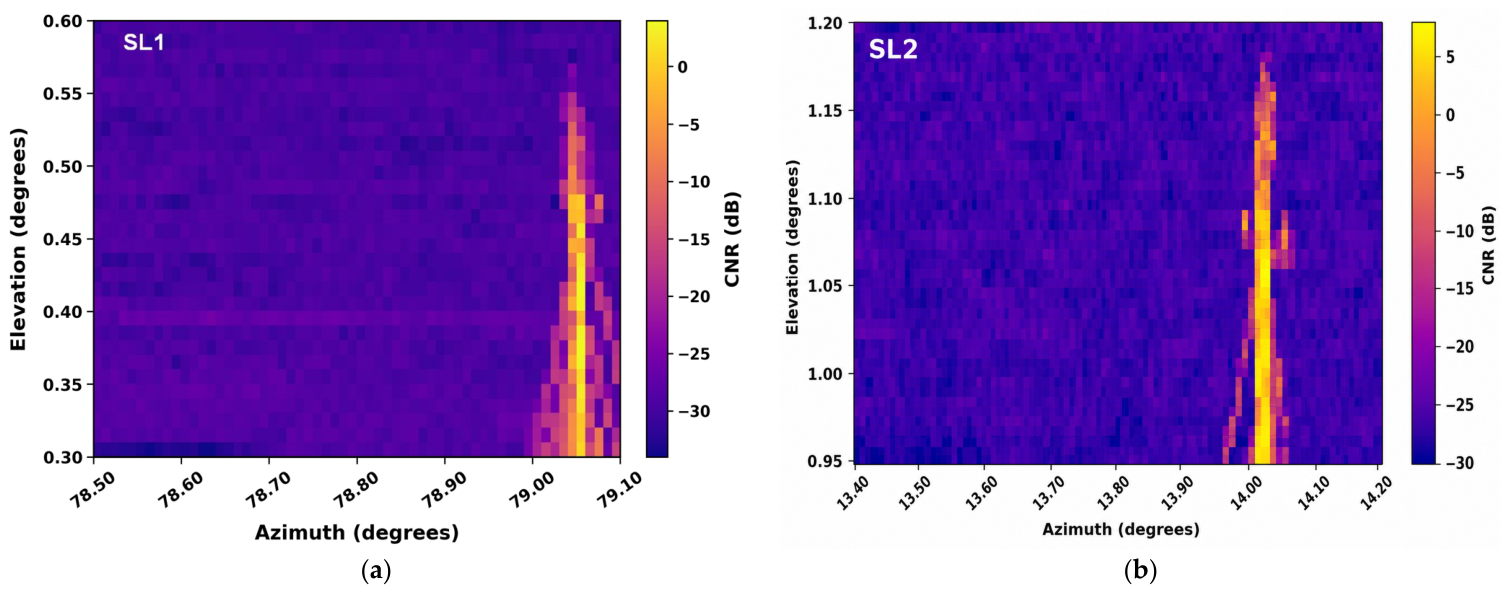
In the DSL configuration, SL1 operated autonomously using a standalone power system consisting of batteries and photovoltaic solar panels, while SL2 was powered by the electrical grid. To ensure accurate spatial referencing and optimal alignment of the scanning geometry, the orientation of both SL units was determined through hard target identification procedures. This process involved performing a series of Plan Position Indicator (PPI) scans at various elevation angles around the top of the reference met mast. When the SL beam intersected the mast structure, a distinct peak was observed in the carrier-to-noise ratio (CNR) of the returned signal—an approach commonly referred to as CNR heatmapping or hard target (HT) testing.
The azimuth angles corresponding to the observed CNR peaks were compared against theoretical reference angles, calculated based on the known geographic coordinates of the met mast and the installation positions of the LiDAR units. These comparisons enabled precise determination of both azimuth and elevation angles associated with the location of the top-mounted a/m. CNR heatmaps were independently generated for both LiDAR systems to verify spatial accuracy and to finalize scan head alignment (Figure 3). For the generation of these CNR heatmaps, an in-house developed tool was used, in which generative artificial intelligence (GenAI) was applied for the purpose of visualization support. All outputs were reviewed by the authors.
Figure 3.
CNR heatmaps targeting the met mast for (a) SL1 and (b) SL2.
To maintain a clear line-of-sight and minimize the influence of flow disturbances induced by the structure, the SL beams were intentionally offset by 4 m in the horizontal direction relative to the met mast axis. This lateral displacement was preserved at the target measurement height of 82 m above ground level—corresponding to the elevation of the reference a/m and maintaining the same elevation angle—thereby ensuring spatial consistency and reducing potential wake effects. For confidentiality purposes, precise coordinates have been omitted in the final publication.
A key system parameter in SL measurements is the RGL, which defines the spatial resolution along the beam path and directly impacts both data quality and signal availability. In this experiment, two RGL configurations—100 m and 200 m—were alternated systematically every 30 min. This setup enabled a comparative analysis of the DSL system’s sensitivity to resolution settings and their impact on the measurement of wind speed, wind direction, and turbulence intensity. The full measurement configuration and operational parameters employed during the validation campaign are summarized in Table 2.
Table 2.
Measurement configuration details of both scanning LiDARs.
3. Results
3.1. Atmospheric Parameters
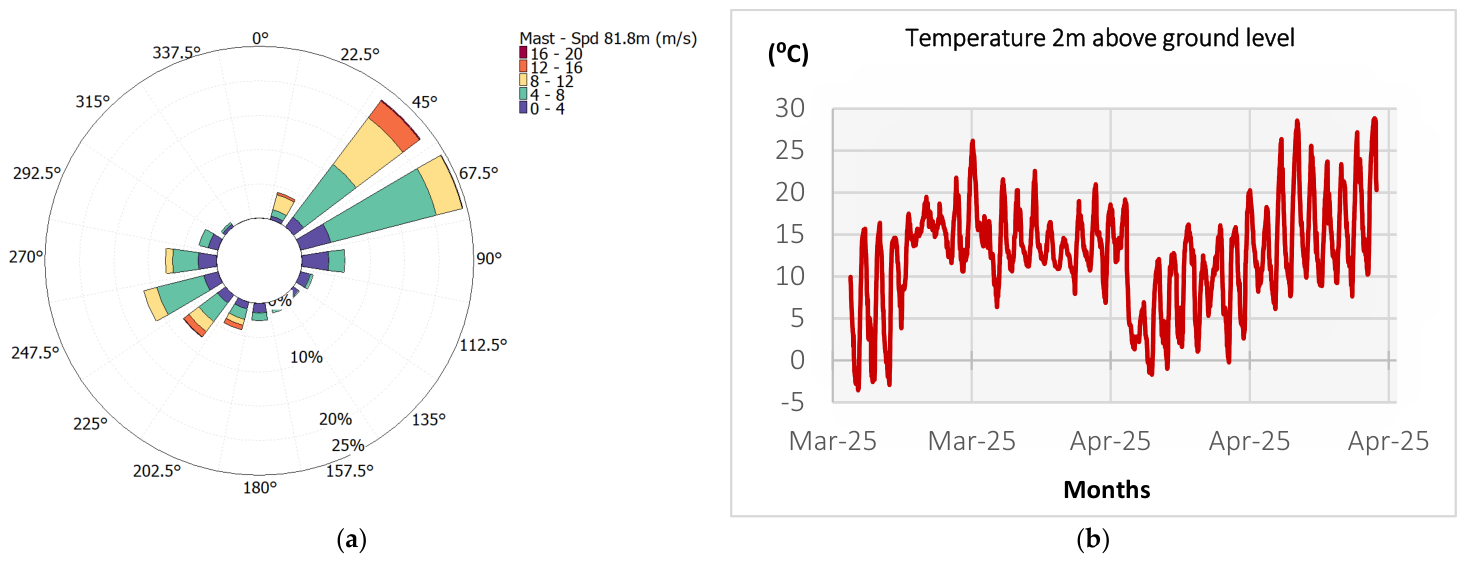
Atmospheric parameters were continuously monitored throughout the validation campaign using the reference met mast instruments. At 81.8 m above ground level—the height of the reference cup a/m—the mean wind speed was 6.1 m/s, with 10-min maximum values reaching up to 17.6 m/s. The predominant wind direction, as measured by the 77.1 m wind vane, originated from the east-northeast (ENE), as illustrated in the wind rose diagram (Figure 4a), in alignment with the orientation of the mast instrumentation. The mean ambient temperature during the campaign was 12.6 °C, obtained from a thermometer (Figure 4b), with observed minima approaching −5 °C. Notably, no data freezing was detected in the met mast instruments throughout the period, indicating uninterrupted sensor functionality under sub-zero conditions. Average relative humidity levels stood at 76%, while the corresponding atmospheric pressure over the same period averaged approximately 1018 hPa. These values are consistent with typical early-spring wind conditions observed in northeastern Greece and provide a representative basis for assessing the performance of the DSL system under coastal flow regimes.
Figure 4.
Wind direction frequency distribution (a) and temperature time series (b) during the validation period.
Approximately 4 km north of the measurement site lies a low mountain range, with elevations reaching up to 260 m above sea level. To minimize the influence of terrain-induced flow distortion, wind direction sectors between 320° and 20° were excluded from the analysis. This filtering ensured that only flow conditions unaffected by topographic obstacles were used for the evaluation of horizontal wind speed, direction, and TI.
3.2. Data Filtering Procedure
Raw data availability in SL systems refers to the proportion of successfully retrieved LOS wind velocity measurements relative to the total number of attempted measurements. This parameter is highly sensitive to atmospheric conditions, primarily due to their influence on the CNR. Adverse weather phenomena—such as precipitation events or low aerosol concentrations—can reduce CNR values, thereby limiting the effective measurement range and degrading data availability [18]. As part of the system’s internal quality control, radial wind speed measurements with CNR values outside the range of −30 dB to 5 dB are automatically discarded for wind field reconstruction.
Following the vector reconstruction process, additional filtering was applied to the 10-min averaged data from the DSL system. Specifically, a minimum data availability threshold of 10%—equivalent to at least 60 valid 1 Hz samples per 10-min interval—was enforced. This criterion was adopted to ensure statistical representativeness and minimizes sampling-related uncertainty. As supported by previous SL studies, such thresholds are critical for maintaining the stability of statistical metrics, particularly in the computation of turbulence-related quantities [19]. Finally, external quality control procedures were implemented to identify and exclude physically implausible values, including outliers and anomalous spikes in wind speed measurements. The overall availability of reconstructed 10-min data reached 74% for the 100 m RGL and 86% for the 200 m RGL, yielding a robust dataset suitable for meaningful statistical analysis across the full duration of a one-month measurement campaign.
3.3. Horizontal Wind Speed
To assess the performance of the DSL system, reconstructed horizontal wind speed data were compared against measurements from the top-mounted cup a/m installed at 81.8 m on the met mast. The analysis focused on two RGL configurations—100 m and 200 m—through systematic comparisons between LiDAR-derived and met mast-based wind speeds.
To further support the comparison between the two RGL configurations, a condition-matching check was performed to verify that the observed differences were not primarily influenced by changing atmospheric conditions. This check was based on the reference met mast measurements corresponding to each RGL subset. The reference mast mean wind speeds were found to be very similar for the two configurations (Table 3). Similar consistency was also observed in wind direction, with ENE remaining the predominant wind direction in both subsets, as well as in turbulence characteristics.
Table 3.
Summary of statistical analysis of the 100 m and 200 m RGL against met mast.
Linear regression analysis, a standard method in wind energy validation studies, was employed to quantify the agreement between the two datasets. The regression was performed over the 4–16 m/s wind speed interval, using raw paired, time-synchronized 10-min averaged wind speed data. The cup a/m served as the independent (reference) variable, and the DSL system as the dependent variable. All 10-min averaged wind speed values falling within the specified range were included in the analysis for both RGL settings.
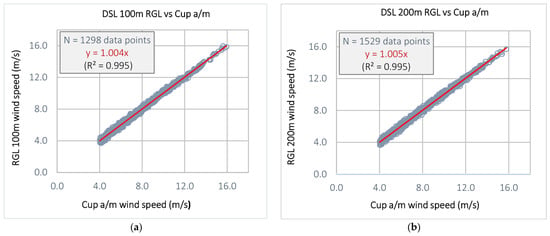
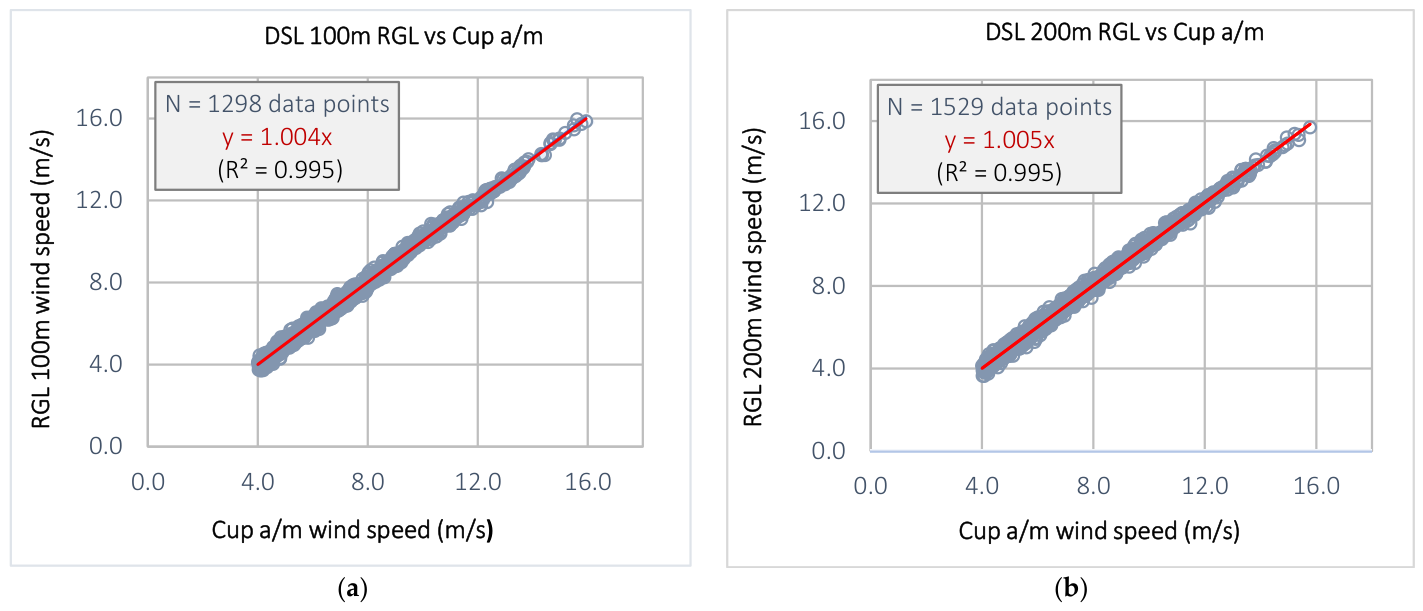
The results indicated excellent agreement between the DSL system and the met mast measurements across both RGLs, with coefficients of determination (R2) equal to 0.995 for both configurations (Figure 5a,b).
Figure 5.
Wind speed comparisons between cup a/m and DSL at 100 m (a) and 200 m RGL (b). Red lines indicate the linear regression fits.
For the 100 m RGL case, the mean wind speed measured by the cup a/m was 7.250 m/s, while the DSL system reported 7.270 m/s (Table 3). The bias between the two datasets was +0.018 m/s, indicating that the DSL system measured, on average, slightly higher wind speeds than the reference cup a/m. The mean relative wind speed difference was 0.28%, while the MAE and RMSE were 0.142 m/s and 0.181 m/s, respectively. The standard deviation (SD) of the differences was 0.180 m/s, indicating strong consistency between the two measurement methods.
In the 200 m RGL configuration, the cup a/m recorded a mean wind speed of 7.318 m/s, compared to 7.346 m/s measured by the DSL system (Table 3). The bias increased slightly to +0.028 m/s, indicating a similarly small positive deviation of the DSL measurements relative to the met mast. The mean relative difference was 0.41%, while the MAE and RMSE were 0.140 m/s and 0.183 m/s, respectively. The SD of the differences remained virtually unchanged at 0.181 m/s, further confirming the robustness and reliability of the DSL system in capturing horizontal wind speed, even at longer effective probe volume.
3.4. Wind Direction
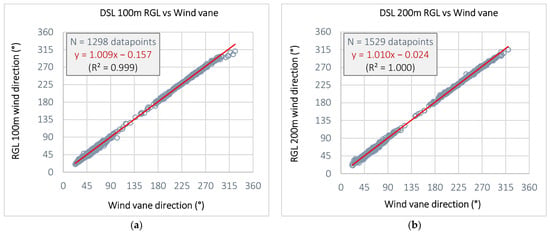
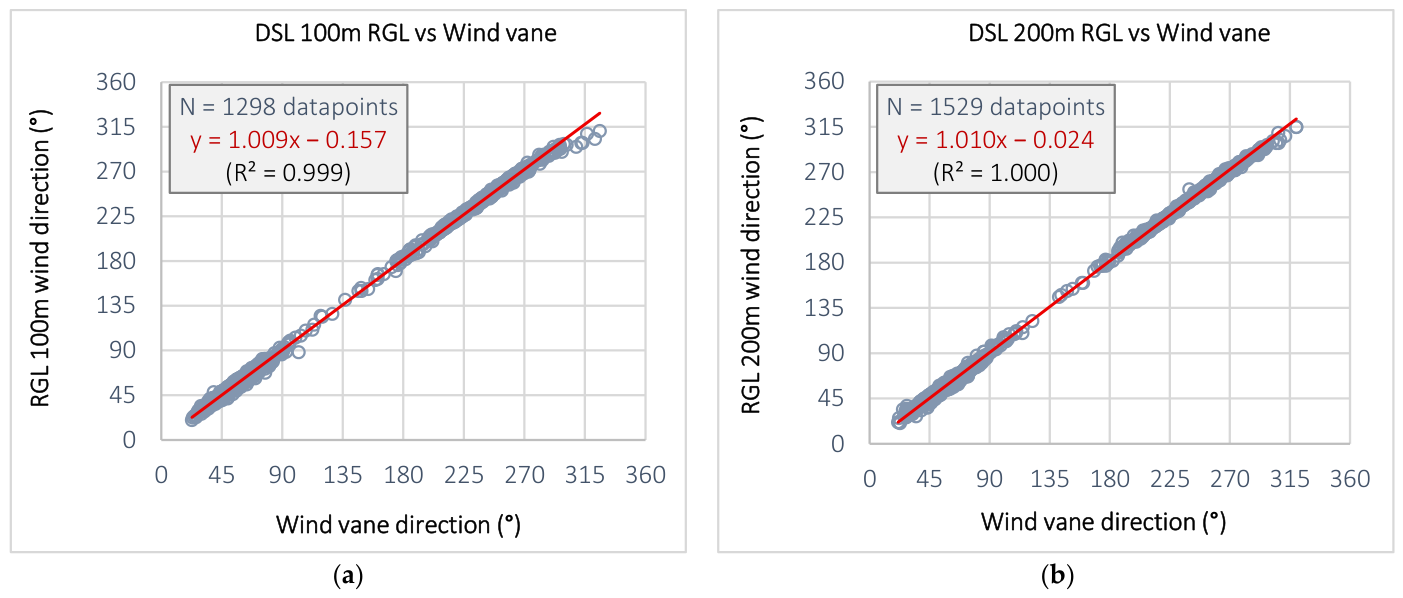
Wind direction measurements obtained from the DSL system were compared against those recorded by the wind vane installed at 77.1 m above ground level on the met mast. The comparison was conducted using linear regression analysis within the wind speed interval of 4–16 m/s, for both RGL configurations. For the 100 m RGL configuration, the regression yielded a slope of 1.009, an offset of 0.157°, and R2 of 0.999, indicating excellent directional agreement between the DSL and the reference system (Figure 6a). In the case of the 200 m RGL, the slope was 1.010, the offset was reduced to 0.024°, and R2 reached 1.000 (Figure 6b). These results highlight the directional accuracy and repeatability of the DSL system, even under varying probe volume configurations.
Figure 6.
Wind direction comparisons between wind vane and DSL at 100 m (a) and 200 m RGL (b). Red lines indicate the linear regression fits.
The near-unity regression slopes, negligible angular offsets, and R2 values approaching 1.000 across both RGLs collectively confirm a high level of consistency and directional fidelity in the reconstructed wind direction from the DSL system, as compared to the wind vane reference measurements.
3.5. Turbulence Intensity
As part of the validation analysis, TI was systematically examined to assess the DSL system’s capability to characterize atmospheric variability under operational field conditions. At the reference height of the cup a/m, the mean TI calculated from the DSL system was 6.8%, compared to 7.8% recorded by the mast-mounted sensor (Table 4). For the 200 m RGL configuration, the discrepancy persisted, with the DSL reporting a mean TI of 6.4%, while the reference data indicated a higher value of 8.3%. These results represent mean values averaged over the entire validation period and restricted to the 4–16 m/s wind speed range. The DSL system exhibited a consistent underestimation of TI relative to the met mast measurements across both RGL configurations. This observation is aligned with previous findings in the literature, where volumetric averaging effects inherent to SL systems tend to attenuate high-frequency wind fluctuations and result in lower TI estimates.
Table 4.
Mean TI from cup a/m and DSL at 100 m and 200 m RGL.
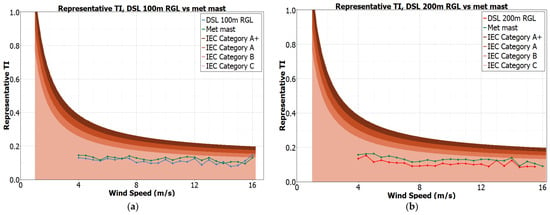
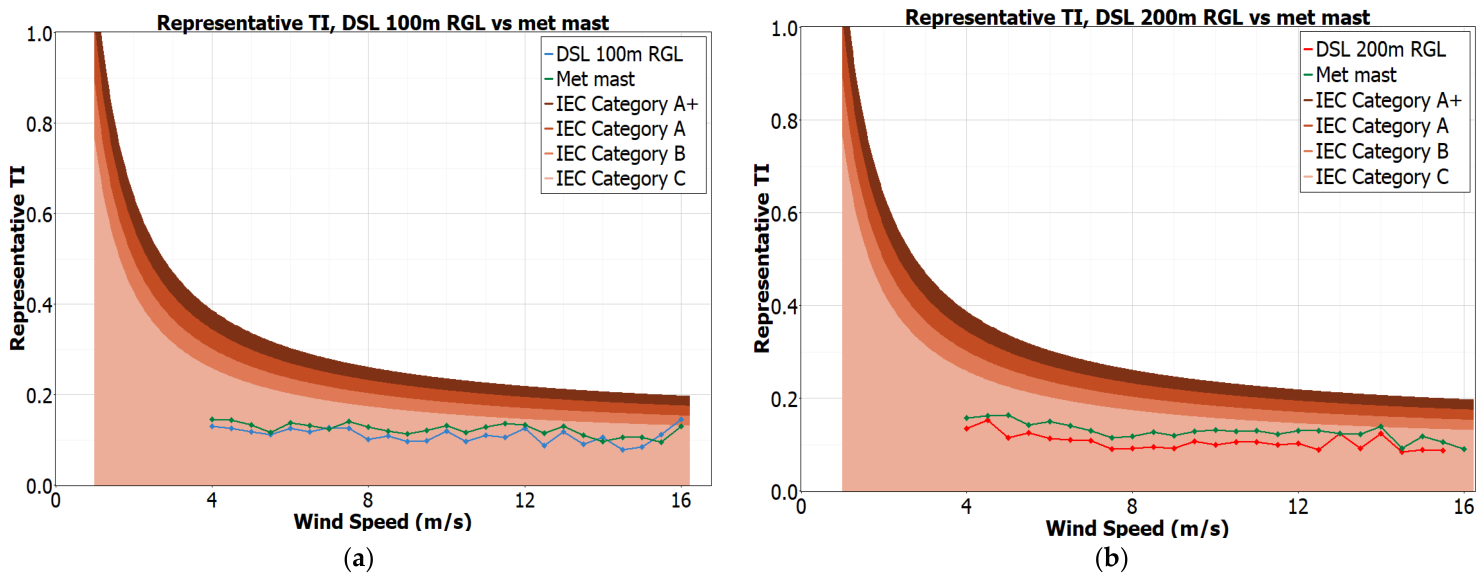
Beyond overall means, representative ΤΙ was calculated for each RGL configuration to better capture upper-range turbulence behavior under typical wind conditions, for the same wind speed range. Representative TI is defined as the 90th percentile of all valid TI measurements, meaning that 90% of the observed values fall below this threshold. As shown in Figure 7, the resulting distributions were classified according to the IEC 61400-1 turbulence categories. Both the 100 m and 200 m RGL configurations consistently fell into Category C, indicating generally low turbulence levels under conditions representative of standard turbine operation as captured by the DSL system.
Figure 7.
Representative TI classification at 100 m (a) and 200 m RGL (b).
Offshore vertical profiler LiDAR measurements have shown that turbulence characteristics are influenced by wind direction, with clear differences between land-influenced and sea-influenced flow regimes [20]. To assess the DSL system’s ability to capture this directional variability, TI was initially analyzed across 16 wind sectors. Only sectors with at least 100 valid data points were retained in the final analysis, ensuring sufficient data coverage for reliable statistical evaluation. For each sector, TI values derived from the DSL system were compared to those measured by the reference cup a/m using 10-min averages within the 4–16 m/s wind speed range.
To quantify sector-wise deviations, relative TI differences (ΔTI) between the DSL and met mast measurements were computed. For the 100 m RGL configuration, the DSL system consistently underestimated TI across all sectors, with relative differences ranging from −8.21% to −13.48% (Table A1). The largest deviation was observed in the 67.5° wind sector, while the smallest occurred at 270°. In the 200 m RGL configuration, underestimation was even more pronounced, with relative differences ranging from −15.81% to −24.70%, peaking in the 45° sector (Table A1). This trend suggests an amplified sensitivity to volumetric averaging and reduced spatial resolution at longer RGLs, further limiting the DSL system’s ability to resolve sector-dependent turbulence features.
4. Discussion
The results of this validation campaign confirm that the DSL system delivers accurate and reliable performance in reconstructing horizontal wind fields under coastal conditions. Excellent agreement was observed between the DSL system and the reference cup a/m, with R2 values for horizontal wind speed reaching 0.995 for both RGL configurations, and for wind direction reaching 0.999 (100 m RGL) and 1.000 (200 m RGL). These R2 values exceed the best-practice Key Performance Indicators (KPIs) established by the Carbon Trust guideline for floating LiDARs [21], which recommend thresholds of R2 > 0.98 for wind speed and R2 > 0.97 for wind direction-thereby reinforcing the robustness of the DSL system and supporting its potential applicability to offshore wind energy assessments. In addition to the strong correlation, the DSL system also demonstrated excellent consistency in wind speed magnitude, with mean differences between its measurements and cup a/m remaining below 0.05 m/s and relative differences under 0.5% for both RGL settings. A small positive bias was observed in both configurations (+0.018 m/s for 100 m RGL and +0.028 m/s for 200 m RGL), indicating slightly higher wind speeds measured by the DSL system compared to the cup a/m. These results highlight the main advantage of the DSL approach, namely its ability to robustly reproduce mean wind speed and direction fields under realistic measurement conditions.
However, the analysis of TI revealed systematic underestimation by the DSL system in both configurations. This behavior is primarily attributed to spatial averaging effects induced by the finite probe volume of the LiDAR beam and the LOS integration process, which tend to attenuate high-frequency turbulence fluctuations. The more pronounced underestimation observed at 200 m RGL further supports this interpretation, as the use of larger range gates reduces spatial resolution and amplifies signal smoothing effects. Accordingly, DSL-derived TI should be interpreted primarily as a relative metric for comparing measurement configurations, rather than as an absolute turbulence metric. No spectral correction, transfer-function-based adjustment, or additional uncertainty correction was applied in the present study. Therefore, the DSL-derived TI values should not be used directly for turbine classification or design-load applications without further correction and uncertainty treatment. The TI results presented here are intended to support the validation and comparative assessment of the 100 m and 200 m RGL configurations, while acknowledging the spatial filtering effects inherent to the scanning LiDAR measurement principle.
Sector-wise analysis of TI indicated an average underestimation of approximately 12% for the 100 m RGL and 22% for the 200 m RGL configuration. These results align with the understanding that turbulence intensity is modulated by local surface characteristics and inflow heterogeneity, which cannot be fully resolved by SL systems due to inherent spatial averaging, highlighting a key limitation of SL-based turbulence estimation, particularly in capturing high-frequency fluctuations. This behavior is consistent with previous studies on scanning Doppler LiDARs, which have reported systematic underestimation of turbulence intensity due to spatial averaging and line-of-sight integration effects [13,22].
The interpretation of the results is based on the assumption of homogeneous flow conditions within the scanned volume and on the representativeness of the coastal measurement site for moderately rough atmospheric environments. Importantly, the validation campaign was conducted over flat terrain with low surface roughness and minimal upstream obstructions, suggesting that the turbulence levels observed are representative of such environments. Therefore, when DSL systems are deployed offshore—where surface roughness is typically lower—TI is expected to remain at or below the levels associated with IEC Category C [23].
5. Conclusions
In summary, the validation campaign using SLs demonstrated the consistent and accurate operation of the DSL setup for coastal wind characterization. The technology shows strong potential for wind resource assessment and wind farm optimization in coastal and near-offshore environments. Notably, the reduced TI underestimation observed at 100 m RGL suggests a trade-off between measurement range and resolution. Future research should explore optimized scanning strategies and data fusion methodologies—potentially combining multiple LiDAR units or integrating fixed-point sensors—to balance range, resolution, and turbulence fidelity. Longer-term measurement campaigns encompassing a broader range of seasonal and atmospheric stability conditions, as well as deployments in fully offshore environments, would further strengthen the validation framework for DSL systems in offshore wind energy applications. The results from this study can inform best practices for DSL system deployment and integration in pre-construction and operational phases of wind energy projects. Such approaches may further enhance the utility of DSL systems in operational wind energy projects, including future offshore applications.
Author Contributions
Conceptualization, G.K., G.D. and I.P.; methodology, G.K. and G.D.; software, G.K. and G.D.; validation, G.K. and G.D.; formal analysis, G.K. and G.D.; investigation, G.K., G.D. and I.P.; resources, G.K.; data curation, G.K. and G.D.; writing—original draft preparation, G.K.; writing—review and editing, G.K., G.D. and I.P.; visualization, G.K.; supervision, G.D. and I.P.; project administration, I.P.; funding acquisition, I.P. All authors have read and agreed to the published version of the manuscript.
Funding
This research was funded by 2EN S.A. Renewable Energy Sources. No external grant number is applicable.
Institutional Review Board Statement
Not applicable.
Informed Consent Statement
Not applicable.
Data Availability Statement
The original contributions presented in the study are included in the article; further inquiries can be directed to the corresponding author.
Acknowledgments
During the preparation of this study, the authors used Windographer software by UL Solutions (version 5) for data analysis and graphics. The CNR heatmaps, however, were produced using an in-house-developed tool. All outputs were reviewed and edited by the authors, who take full responsibility for the content of this publication.
Conflicts of Interest
Giannis Kissas and George Droukas were employed by 2EN. Ioannis Panourgias is the owner of 2EN. The authors declare that this study received funding from 2EN. Ioannis Panourgias had a role in conceptualization, supervision, project administration, and funding acquisition.
Abbreviations
| met | Meteorological |
| LiDAR | Light Detection and Ranging |
| SL | Scanning LiDAR |
| DSL | Dual Scanning LiDAR |
| TI | Turbulence Intensity |
| LOS | Line of sight |
| RGL | Range Gate Length |
| HWS | Horizontal Wind Speed |
| a/m | Anemometer |
| UTC | Coordinated Universal Time |
| PPI | Plan Position Indicator |
| HT | Hard Target (test) |
| CNR | Carrier-to-Noise Ratio |
| dB | Decibel |
| R2 | Coefficient of determination |
| SD | Standard deviation |
| MAE | Mean Absolute Error |
| RMSE | Root-Mean-Square Error |
| ΔΤΙ | Turbulence Intensity difference |
| KPI | Key Performance Indicators |
Appendix A
To quantify sector-wise deviations, relative turbulence intensity differences (ΔTI) between the DSL and meteorological mast measurements were calculated for both RGL configurations.
Table A1.
Relative differences in TI by wind sector at 100 m and 200 m RGL.
References
- European Parliament and Council. Directive (EU) 2023/2413 of the European Parliament and of the Council of 18 October 2023 amending Directive (EU) 2018/2001, Regulation (EU) 2018/1999 and Directive 98/70/EC as regards the promotion of energy from renewable sources, and repealing Council Directive (EU) 2015/652. Off. J. Eur. Union 2023. Available online: https://eur-lex.europa.eu/legal-content/EN/TXT/PDF/?uri=OJ:L_202302413 (accessed on 23 June 2026).
- Hellenic Republic. Final Updated National Energy and Climate Plan (NECP) 2021–2030; Ministry of Environment and Energy: Athens, Greece, 2025; Available online: https://commission.europa.eu/publications/greece-final-updated-necp-2021-2030-submitted-2025_en (accessed on 23 June 2026).
- Gramitzky, K.; Jäger, F.; Hildebrand, T.; Gloria, N.; Riechert, J.; Steger, M.; Pauscher, L. Alignment calibration and correction for offshore wind measurements using scanning lidars. J. Phys. Conf. Ser. 2024, 2767, 042014. [Google Scholar] [CrossRef] [Scilit]
- Cameron, L.; Clerc, A.; Feeney, S.; Stuart, P. Remote Wind Measurements Offshore Using Scanning LiDAR Systems; OWA Report; Carbon Trust: London, UK, 2014; Available online: https://www.carbontrust.com/our-work-and-impact/guides-reports-and-tools/remote-wind-measurements-offshore-using-scanning-lidar-systems (accessed on 23 June 2026).
- Bell, T.M.; Klein, P.; Wildmann, N.; Menke, R. Analysis of flow in complex terrain using multi-Doppler lidar retrievals. Atmos. Meas. Tech. 2020, 13, 1357–1371. [Google Scholar] [CrossRef] [Scilit]
- Peña, A.; Mann, J. Turbulence measurements with dual-Doppler scanning lidars. Remote Sens. 2020, 11, 2444. [Google Scholar] [CrossRef] [Scilit]
- Rott, A.; Trujillo, M.; Kessler, M. Alignment of scanning lidars in offshore wind farms. Wind Energy Sci. 2022, 7, 283–299. [Google Scholar] [CrossRef] [Scilit]
- Choukulkar, A.; Brewer, W.A.; Sandberg, S.P.; Weickmann, A.; Bonin, T.A.; Hardesty, R.M.; Lundquist, J.K.; Delgado, R.; Iungo, G.V.; Ashton, R.; et al. Evaluation of single and multiple Doppler lidar techniques to measure complex flow during the XPIA field campaign. Atmos. Meas. Tech. 2017, 10, 247–264. [Google Scholar] [CrossRef] [Scilit]
- Newman, J.F.; Sathe, A.; Mann, J. Evaluation of three lidar scanning strategies for turbulence measurements. Atmos. Meas. Tech. 2016, 9, 1993–2013. [Google Scholar] [CrossRef] [Scilit]
- Li, J.; Chen, C.; Han, Y.; Chen, T.; Xue, X.; Liu, H.; Zhang, S.; Yang, J.; Sun, D. Wind Profile Reconstruction Based on Convolutional Neural Network for Incoherent Doppler Wind LiDAR. Remote Sens. 2024, 16, 1473. [Google Scholar] [CrossRef] [Scilit]
- Pauscher, L.; Vasiljevic, N.; Callies, D.; Lea, G.; Mann, J.; Klaas, T.; Hieronimus, J.; Gottschall, J.; Schwesig, A.; Kühn, M.; et al. An inter-comparison study of multi- and DBS lidar measurements in complex terrain. Remote. Sens. 2016, 8, 782, Erratum in Remote Sens. 2017, 9, 667. https://doi.org/10.3390/rs9070667. [Google Scholar] [CrossRef] [Scilit]
- Simon, E.; Courtney, M. A Comparison of Sector-Scan and Dual Doppler Wind Measurements at Høvsøre Test Station—One Lidar or Two; DTU Wind Energy: Roskilde, Denmark, 2016; Volume 0112, Available online: https://backend.orbit.dtu.dk/ws/files/125285452/RUNE_D1.2_ellsim_final.pdf (accessed on 23 June 2026).
- Shimada, S.; Kogaki, T.; Konagaya, M.; Mito, T.; Misaki, T.; Hamada, K.; Araki, R.; Ohhata, S.; Ueda, Y.; Ohsawa, T. Mutsu 2020 Scanning LiDAR Experiment: Comparison of Dual and Single Scanning LiDAR Systems for Near-Shore Wind Measurement. Wind Energy 2025, 28, e70003. [Google Scholar] [CrossRef] [Scilit]
- Goit, J.P.; Yamaguchi, A.; Ishihara, T. Measurement and prediction of wind fields at an offshore site by scanning Doppler LiDAR and WRF. Atmosphere 2020, 11, 442. [Google Scholar] [CrossRef] [Scilit]
- Newsom, R.K.; Krishnamurthy, R. Doppler Lidar (DL) Instrument Handbook 2022; Tech. Rep. DOE/SC-ARM-TR-101; U.S. Department of Energy, Atmospheric Radiation Measurement (ARM) User Facility: Billings, OK, USA, 2022. Available online: https://www.arm.gov/publications/tech_reports/handbooks/dl_handbook.pdf (accessed on 23 June 2026).
- New Energy and Industrial Technology Development Organization (NEDO). Offshore Wind Measurement Guidebook; New Energy and Industrial Technology Development Organization: Kawasaki, Japan, 2023; Available online: https://www.nedo.go.jp/english/ZZFF_00002.html (accessed on 23 June 2026).
- IEC 61400-12-1:2017; Wind Energy Generation Systems—Part 12-1: Power Performance Measurements of Electricity Producing Wind Turbines. International Electrotechnical Commission: Geneva, Switzerland, 2017.
- Shimada, S.; Goit, J.P.; Ohsawa, T.; Kogaki, T.; Nakamura, S. Coastal Wind Measurements Using a Single Scanning LiDAR. Remote Sens. 2020, 12, 1347. [Google Scholar] [CrossRef] [Scilit]
- Watanabe, K.; Takakuwa, S.; Hemmi, C.; Ishihara, T. A study of offshore wind assessment using dual-Doppler scanning lidars. J. Wind Energy (Jpn Wind Energy Assoc.) 2021, 45, 40–48. (In Japanese) [Google Scholar] [CrossRef]
- Bodini, N.; Lundquist, J.K.; Kirincich, A.U.S. East Coast lidar measurements show offshore wind turbines will encounter very low atmospheric turbulence. Geophys. Res. Lett. 2019, 46, 5582–5591. [Google Scholar] [CrossRef] [Scilit]
- The Carbon Trust. Offshore Wind Accelerator Roadmap for the Commercial Acceptance of Floating LiDAR Technology; Revision 3.0; The Carbon Trust: London, UK, 2025; Available online: https://www.carbontrust.com/our-work-and-impact/guides-reports-and-tools/accelerator-roadmap-for-the-commercial-acceptance-of-floating-lidar-technology (accessed on 23 June 2026).
- Bonin, T.A.; Chilson, P.B.; Zielke, B.; Fedorovich, E. Evaluation of turbulence measurement techniques from a single Doppler lidar. Atmos. Meas. Tech. 2017, 10, 3021–3039. [Google Scholar] [CrossRef] [Scilit]
- Kim, B.; Lee, K.; Ko, K.; Choi, J. Offshore wind resource assessment off the coast of Daejeong, Jeju Island using 30-year wind estimates. Sci. Rep. 2022, 12, 14179. [Google Scholar] [CrossRef] [Scilit] [PubMed]

Disclaimer/Publisher’s Note: The statements, opinions and data contained in all publications are solely those of the individual author(s) and contributor(s) and not of MDPI and/or the editor(s). MDPI and/or the editor(s) disclaim responsibility for any injury to people or property resulting from any ideas, methods, instructions or products referred to in the content. |
© 2026 by the authors. Licensee MDPI, Basel, Switzerland. This article is an open access article distributed under the terms and conditions of the Creative Commons Attribution (CC BY) license.