Article

Modernizing Wind Load Standards for Ireland

by
David Cunningham
1,
Rubina Ramponi
2,
Reamonn MacReamoinn
2 and
Jennifer Keenahan
1,*
1
School of Civil Engineering, University College Dublin, The Belfield Campus, D04 V1W8 Dublin, Ireland
2
Arup, 50 Ringsend Road, D04 T6X0 Dublin, Ireland
*
Author to whom correspondence should be addressed.
Submission received: 19 August 2025 / Revised: 10 October 2025 / Accepted: 13 October 2025 / Published: 17 October 2025
(This article belongs to the Special Issue Wind Effects on Civil Infrastructure)

Abstract

In anticipation of the implementation of the Second-Generation Eurocodes, evaluating the suitability of these standards is necessary to ensure the structural safety and sustainable design of Ireland’s future building stock. This paper provides a detailed comparative analysis of the wind loading codes of practice relevant to Ireland: The Irish National Annex to EN1991-1-4 (2005) and the draft version of the Second-Generation Eurocode, EN1991-1-4 (2025). Quantitative evaluation is conducted across a range of building typologies, with calculations performed for various sites and structural geometries. The findings reveal marked differences in wind load predictions between the codes, particularly affecting base shear values and net pressure coefficients. Areas of concern regarding structural design efficiency and safety for future building structures in Ireland are outlined. The significant inconsistencies between provisions within the codes of practice are identified and critically evaluated from both theoretical and practical perspectives, providing insight into the optimal solution for implementation in Irish engineering practice.

1. Introduction

The 2nd Generation Eurocodes (2nd GEN EN) are currently being drafted. Ireland’s input into this process, as well as the production of its National Annexes, is led by the Eurocodes National Implementation Programme at the NSAI (National Standards Authority of Ireland). When the 1st Generation Eurocode for Wind Loading was being developed in the mid-2000s, a calibration study was completed comparing this new code to the one in use at the time—British Standard: BS6399-2 [1]. This comparison revealed that there was a significant departure (up to 12%) from current Irish practice, which would, in a majority of cases, result in significantly different wind loads [2]. This was mainly due to the simplifications in the basic EN methods, which were significantly conservative or non-conservative depending on structure and location. It is possible that there may be a repeat of this scenario with the final draft (Fpr) of the new 2nd GEN EN. This version is considered stable, and, unless rejected in the formal vote, will become the official EN standard. It is very close to the final published standard, and only editorial or minor technical changes may be made before publication. A brief historical comparison with the first-generation transition is provided in Section 7.4.
Foundational treatments of wind effects on structures emphasize the coupling of atmospheric boundary-layer turbulence, bluff-body aerodynamics, and structural dynamics, with widely used design guidance captured in benchmark texts and reviews by Simiu and Scanlan and by Holmes [3], alongside Davenport’s statistical framework for extreme winds and gust loading [4] that underpins modern code formats [5]. Equivalent static and dynamic load representations have evolved from Davenport’s spectrum-based concepts into generalized gust loading factor formulations proposed and reviewed by Kareem and co-authors to capture background and resonant response components more consistently for tall and flexible systems [6,7,8].
Wind load calculation methodologies in international practice share common elements: wind climate characterization, exposure and terrain modeling, turbulence intensity and length scale specification, peak velocity pressure, pressure coefficients, and structural factors. However, they differ in their handling of gust factors, averaging times, and exposure categories, as documented in code-perspective and comparative reviews by Stathopoulos and in data-to-code comparisons addressing NBCC, ASCE, ISO/AIJ, and Eurocode provisions [9,10]. These reviews highlight that along-wind background and resonant contributions, internal pressures, and averaging-time inconsistencies can produce non-trivial divergence in predicted actions across codes for nominally similar exposures and return periods. For façades and roofs, multiple syntheses have consolidated pressure data and modeling approaches, including Uematsu’s review on low-rise pressures [11] and Stathopoulos’ recent overview of wind loads on buildings [10] with implications for pressure zoning and component design [12,13].
Exposure and terrain modeling are critical where upwind roughness changes occur, with the non-equilibrium Harris and Deaves framework (as applied by Cook to heterogeneous terrain) providing a physically grounded approach to fetch-dependent profiles that can avoid step-changes inherent in discrete category schemes [14]. Interference and proximity effects further complicate external pressures and global actions in urban settings; a review by Khanduri et al. [15] synthesis six decades of work on building–building interference, showing substantial departures from isolated-building loads and underscoring the need for conservative envelopes in dense contexts. Downstream design implications are evident in component and system response comparisons, where data-informed effective static loads have been related to measured and simulated responses for roofs and large enclosures [16].
Recent building-scale studies also report sensitivity of façade pressures to architectural details and near-wall flow physics, with validated CFD and large-eddy simulations improving prediction of mean pressure coefficients and balcony-wake effects beyond steady RANS limits [17]. For low-rise roof edges and corners, data-driven and machine-learning interpolation frameworks have been shown to reconstruct peak and area-averaged pressures across approach-flow conditions, supporting refined pressure zoning and cladding design [18,19]. Collectively, this body of work motivates careful treatment of exposure, terrain transitions, internal pressures and local coefficients when comparing code predictions for Irish sites spanning city–country–seaside interfaces [10].
Internationally, a series of peer-reviewed comparative studies has examined divergences among major wind standards (ASCE 7 [20], Eurocode 1 [21], NBCC [22], AIJ [23], AS/NZS [24]) for tall buildings and towers, finding systematic differences tied to velocity averaging, gust factors, exposure categories, and background or resonant partitioning, with implications for both strength and serviceability checks [9,25,26,27]. Additional comparative applications confirm that such divergences can translate into materially different member forces and accelerations for representative high-rise forms and wall–frame structures, reinforcing the value of local calibration and code-to-data checks [26,27,28]. Bridge applications similarly show that exposure and dynamic treatment in Eurocode 1 can yield conservative forces relative to validated CFD studies for certain configurations, encouraging judicious national guidance on exposure assessment [29].
For the Irish context, peer-reviewed studies situate wind climate within the broader European storminess literature: projections and reanalyzes indicate regionally varying trends in extreme winds and storm losses across Western and Northern Europe, with several works reporting increases in high-percentile winds over the North Sea and Northern Europe and decreases in parts of the south, and with notable sensitivity to model choice and scenario [30,31,32,33]. Ireland-focused downscaling indicates credible representation of present-day wind climatology and scenario-dependent changes in mean and high-percentile winds, reinforcing the importance of robust exposure assessment and return-period calibration in national implementation [34]. At continental scale, multi-model ensembles and NAO-linked variability syntheses further underscore substantial spatial gradients and uncertainties in extreme winds relevant to code calibration and safety margins [30,35]. This paper aims to analyze the effects of any of the updated code provisions relative to the existing code of practice in Ireland. A calibration study calculated and compared wind loading values from the proposed 2nd GEN EN and the Irish National Annex to the current Eurocode (Irish NA). The profile of typical building types in Ireland has changed significantly since the drafting of the 1st Generation Eurocode in 2004. Therefore, this paper will investigate various building types and sizes to better reflect the modern cityscape in Ireland, as well as potential future cityscapes.

2. Identification of Important Changes Between the Codes of Practice

The first step in this research was to identify the differences between the provisions of the Irish NA and the 2nd GEN EN, and the following items were identified as being potentially significant:
  • Changes in the determination of the structural factor, CsCd;
  • The calculation of peak velocity pressures, qp(z).
  • Net pressure coefficients, focusing on the effects of the proposed global pressure coefficients, Cpeg;
  • Pressure coefficients for roofs.
  • Pressure coefficients for façade elements.
  • The treatment of upwind terrain transitions.

3. Case Studies for Comparison

3.1. Building Types

This paper conducts a comparative analysis of wind loads and specific wind parameters for concrete and steel buildings of a wide range of geometries. In the interest of investigating global wind effects, these buildings have simple geometries with flat roofs and rectangular plan dimensions. The concrete buildings were investigated for a wide range of building heights up to 100 m in urban areas and up to 40 m in rural areas. The steel buildings were investigated for heights up to 40 m and for large plan areas, reflecting typical industrial and data center building geometries. For each building height, the plan areas were varied in defined increments. The plan aspect ratios (B/L) were varied in increments of 0.1 between the limits of 0.5 and 1.5, relative to an assumed northly orientation, as shown in Figure 1.

3.2. Site Locations

For the purpose of investigating a wide range of building geometries, a small selection of city and country site locations around Ireland were chosen, as shown in Table 1. Wind loads were calculated for each of the buildings investigated in the North, South, East and West directions according to the orientation shown in Figure 1. In this paper, results for each site are presented for the critical wind direction shown in Table 1. The critical direction is the one that gives the highest base shear across the study building set under each code; it aligns with smoother upwind fetch (for example, sea or open country) that increase qp(z). Where the governing direction alternated across geometries, the direction that maximized the site’s median base shear was adopted for consistency. This avoids bias to any single geometry, aligns with the paper’s focus on global actions for simple rectangular buildings, and reflects the terrain-transition sensitivities in Section 6.
To enable a thorough investigation of the effect of site location and upstream terrain transitions on the calculated wind loads, a range of generic site locations were defined. A smaller variety of building geometries were assigned a site terrain category and smoother upstream category, and their wind loads calculated for various distances to the smoother upstream terrain.

3.3. Data Extraction and Interpolation from Code Charts and Tables

Consistent extraction of chart and table-based parameters was required across the Irish National Annex to EN 1991-1-4:2005 [36] and the draft 2nd GEN EN prEN 1991-1-4 [21], to enable like-for-like comparisons. The same workflow was used for structural factors, net/local pressure coefficients, and their inputs, with code-specific bounds and interpolation rules applied in post-processing. Charts were digitized at high resolution; axes were calibrated to tick marks and labels; datasets were recovered over the published domains; and bilinear interpolation was used for intermediate geometries to avoid bias from sparse manual readings. Calibration was verified by re-reading reference points to within 1–2%; datasets were exported to CSV and checked for monotonicity and bounds before use. In generating the roof-coefficient ratio fields plotted in later in the paper, building height (H) and windward width (B) were discretized on a fixed grid and results were evaluated at bin mid-points. Appendix A lists the input definitions and governing equations.

4. Structural Factor (CsCd)

4.1. Introduction

The Irish NA accounts for the lack of spatial correlation of turbulence as well as any dynamic amplifications in the along-wind direction by means of the structural factor, CsCd. The 2nd GEN EN implements an almost identical factor for the same purpose, called Csd. The CsCd factor consists of two components, the size factor, Cs, which accounts for the lack of spatial correlation of turbulence across the surface of a structure, and the dynamic factor, Cd, which accounts for the effect of gusts with a frequency close to that of the natural frequency of the structure [37].
The detailed procedure for determining CsCd in the Irish NA and the 2nd GEN EN is computational demanding, requiring the determination of integral length scales, peak factors, power spectral density functions and aerodynamic admittance functions [37]. For convenience, graphical data are presented in Annex E of the 2nd GEN EN for a range of dimensions, for two terrain categories and for concrete and steel buildings. Similarly, Cs and Cd values are provided in tabular and graphical format in the Irish NA. the graphical and tabulated values of CsCd are used in this comparative analysis to best reflect the methodology of a practicing structural engineer.
Along-wind structural factors were read from the published charts/tables after digitizing the relevant surfaces and evaluating at the non-dimensional geometry points using bilinear interpolation (nearest bounds at edges); for the 2nd GEN EN, the 0.85 lower bound for chart-derived values was applied where relevant. Section 3.3 details the digitization workflow, quality checks, and file outputs.

4.2. Comparison of CsCd Values: City Sites

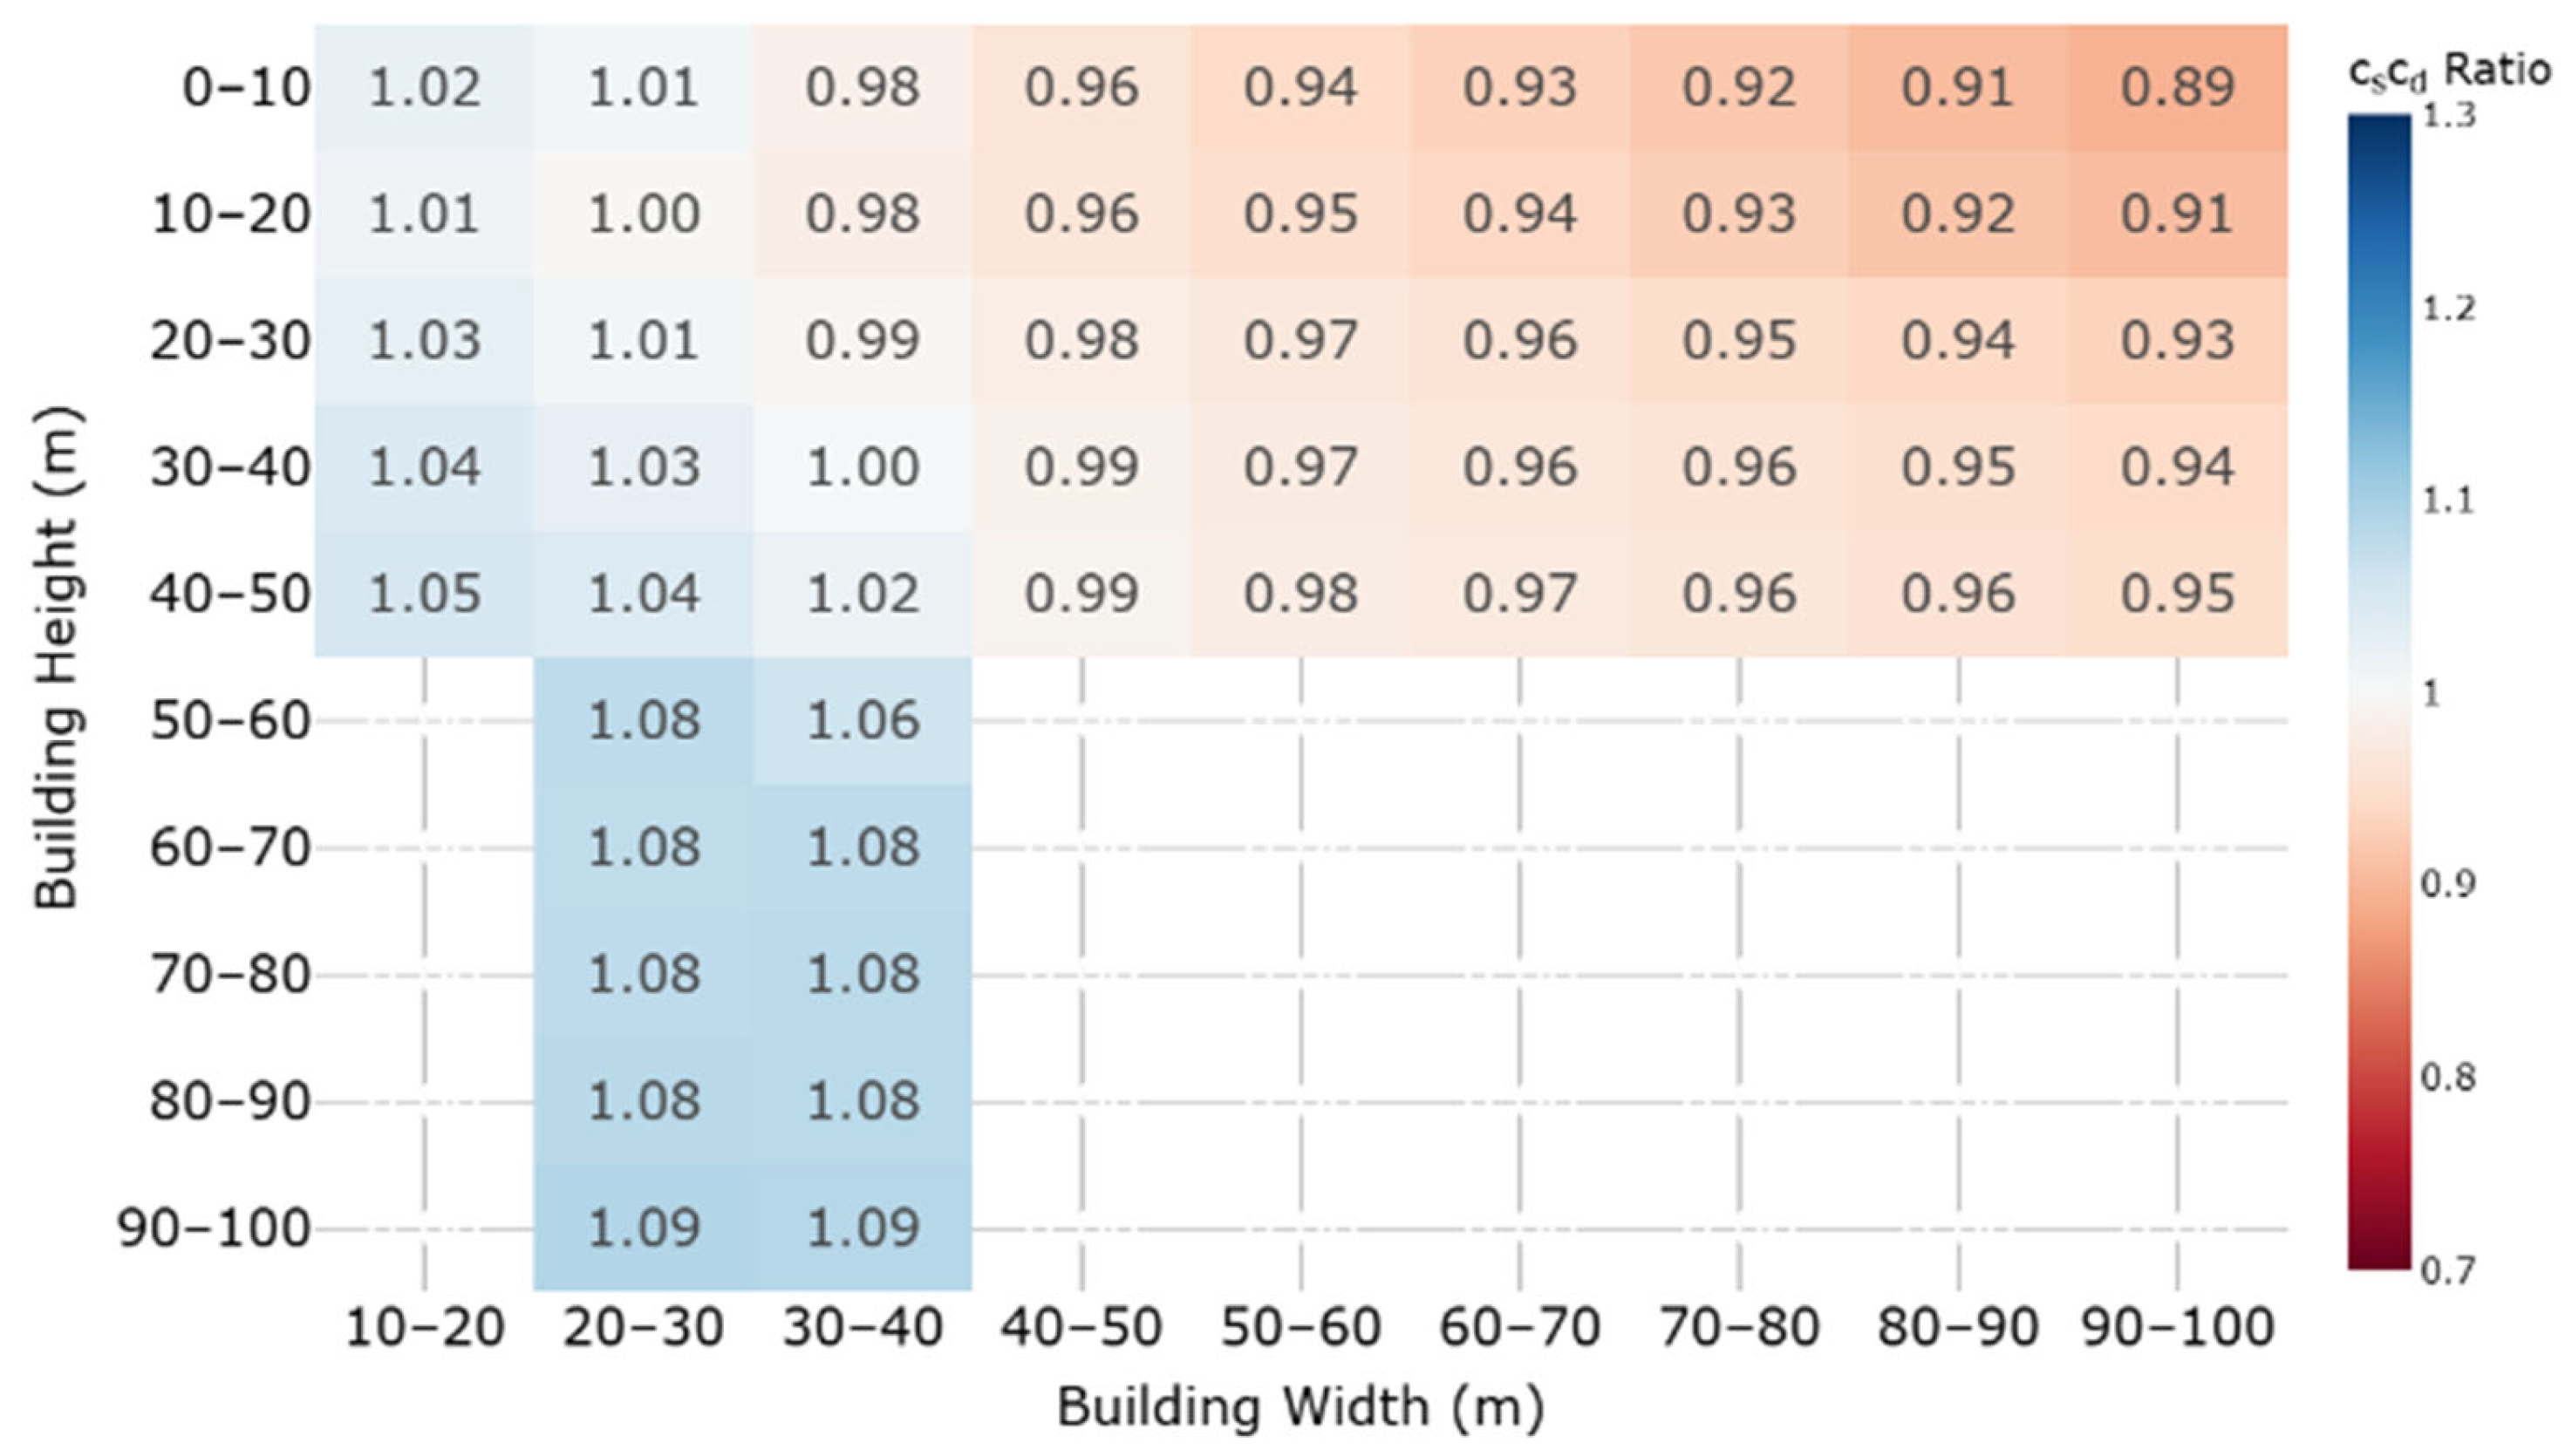
Figure 2 shows the ratios of Irish NA CsCd values to those of the 2nd GEN EN for a range of concrete building geometries. It is evident from the red and blue color variations in this heatmap that the 2nd GEN EN CsCd values can be either higher or lower than the Irish NA, depending upon the building geometry. Tower-like structures are shown to result in 2nd GEN EN values up to 10% lower than those of the Irish NA (ratios > 1). Conversely, low-rise buildings with large windward face widths result in 2nd GEN EN values up to 10% higher than the Irish NA (ratios < 1).
This variation in the comparative behavior between the codes of practice is due to difference in the treatment of upstream terrain transitions. The determination of the Cs factor is dependent on the exposure conditions of the building. In determining CsCd, the Irish NA implements three terrain zones: A, B and C, while only two terrain categories are used in the 2nd GEN EN: Terrain Categories I and II.

4.3. Comparison of CsCd Values: Country Sites

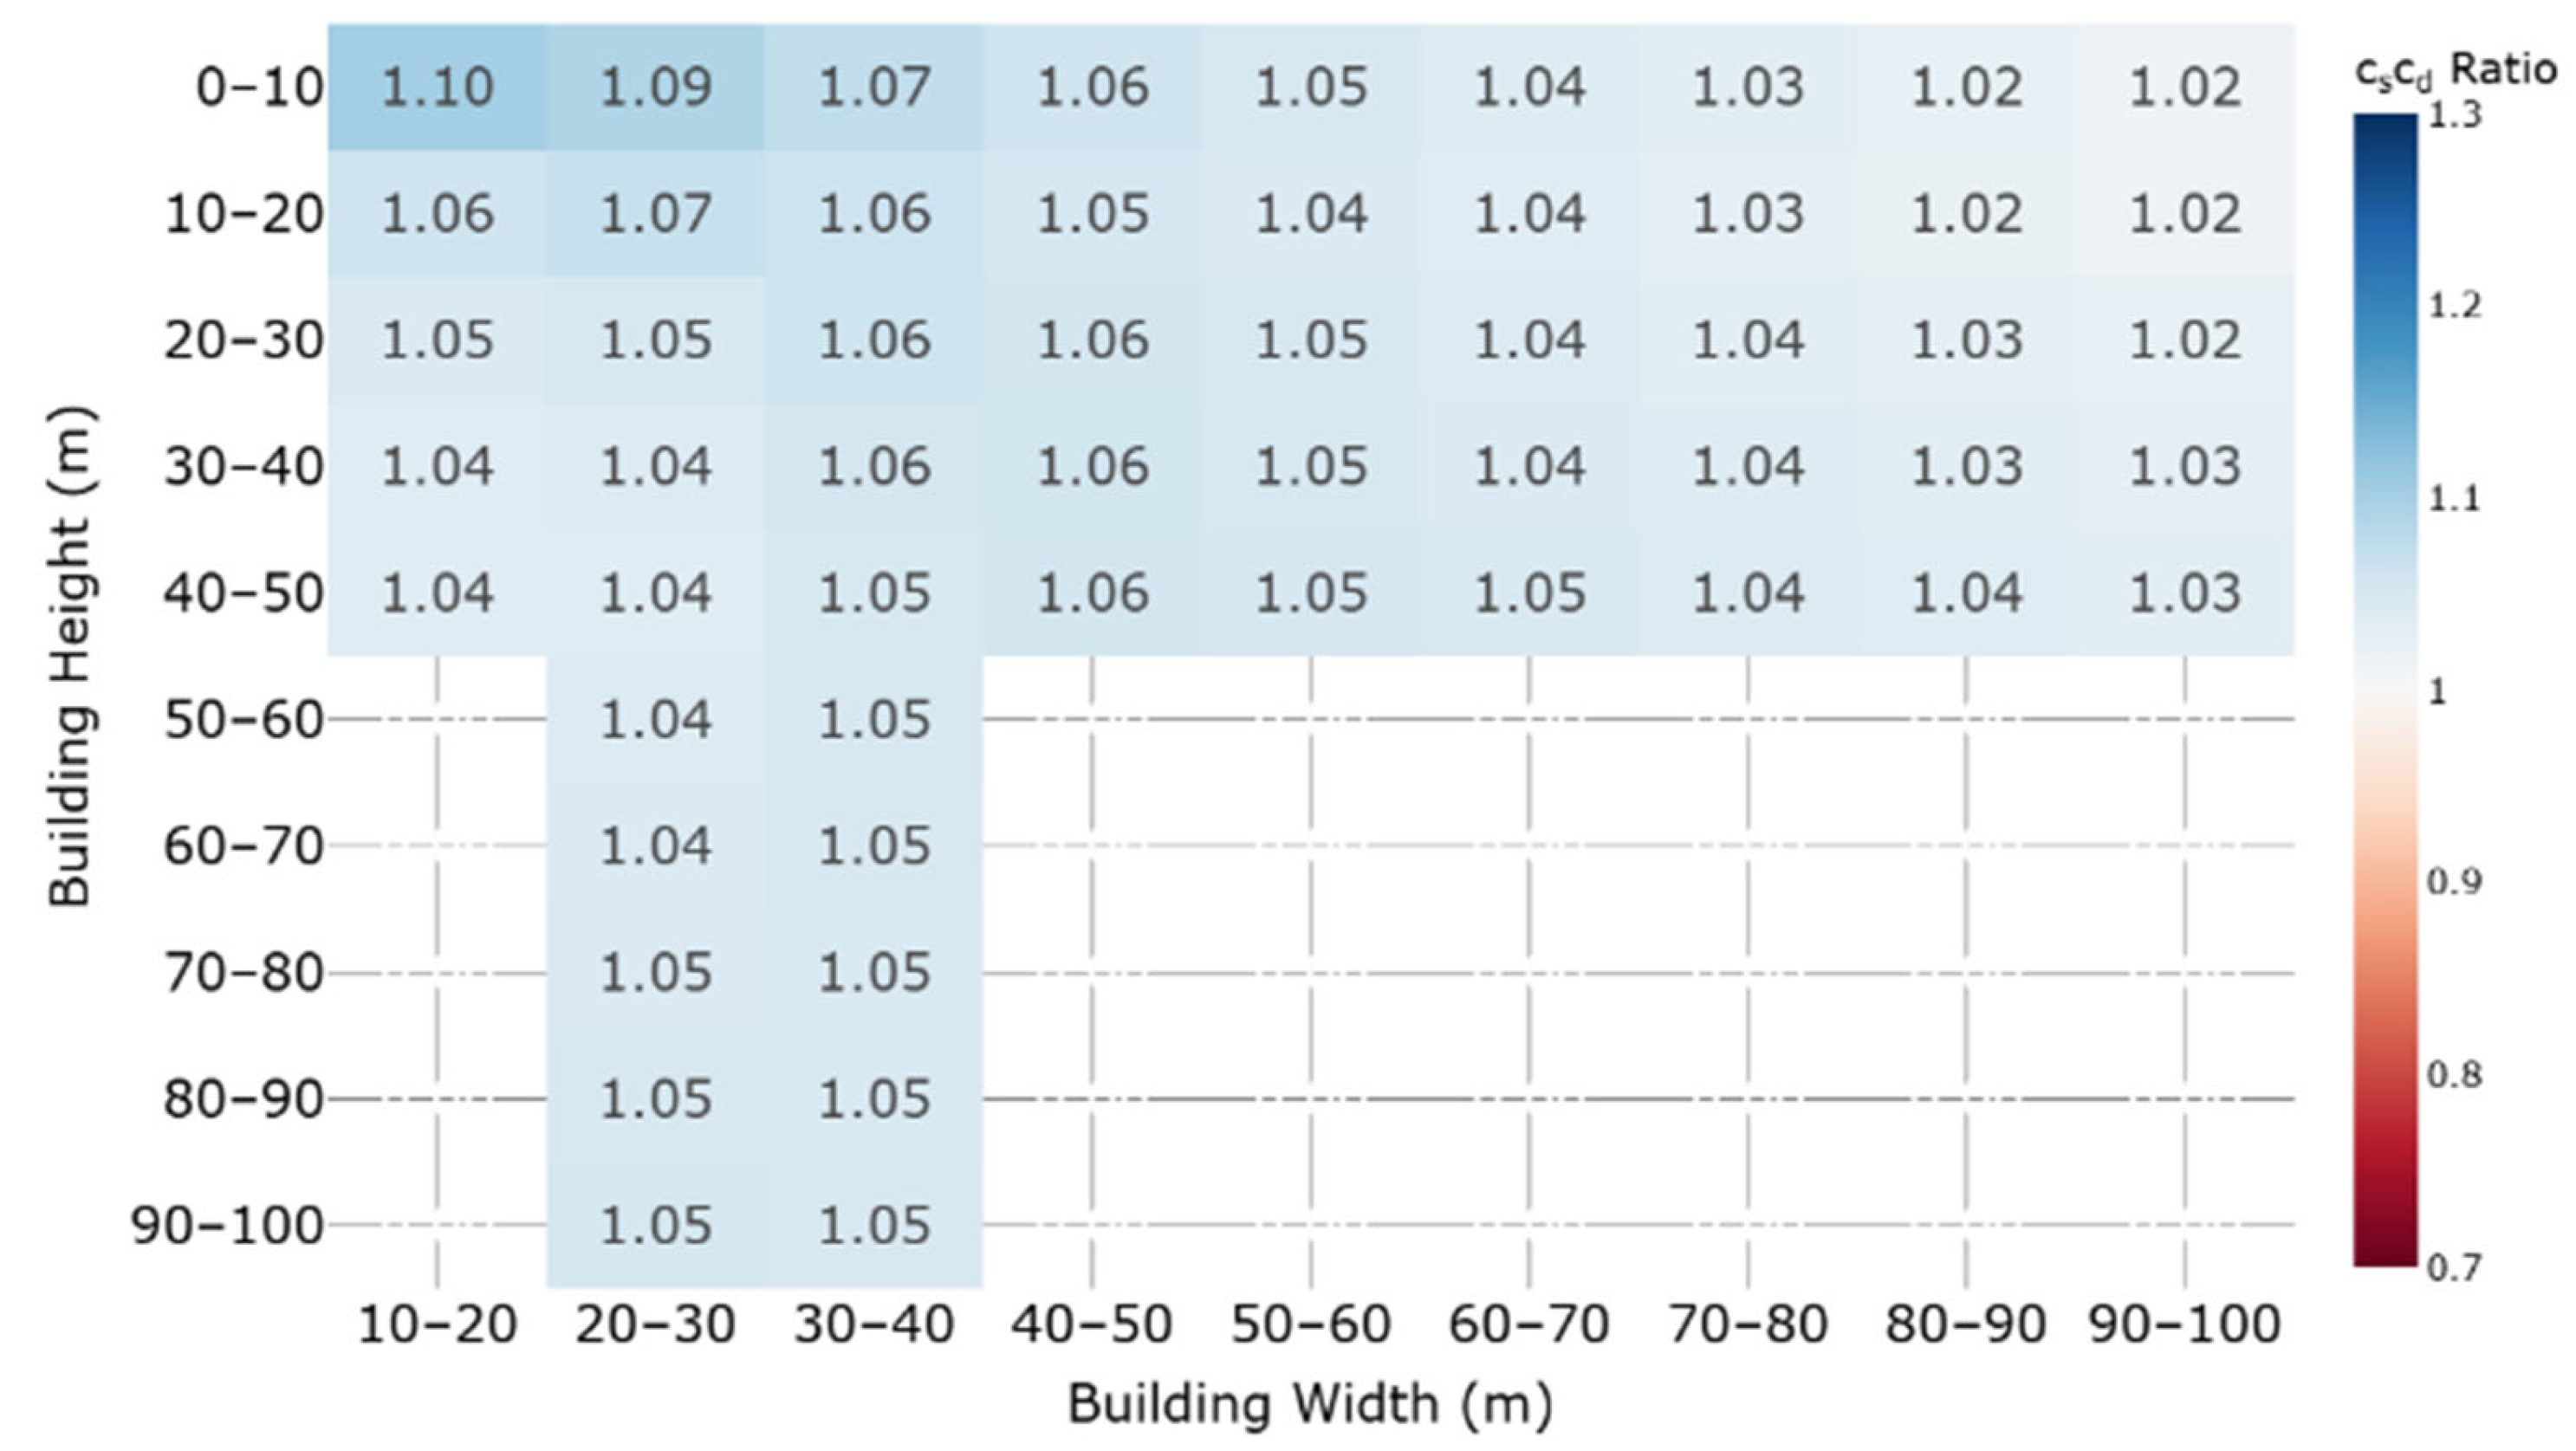
Figure 3 shows the CsCd ratios for the same concrete buildings in Figure 2 for a site in rural terrain.
Figure 3 shows consistency in the comparative behavior between the codes of practice for all building geometries in rural terrain/context. The 2nd GEN EN tends to produce CsCd values which are lower than the Irish NA in the order of 5%. The consistency among the CsCd ratios for this rural site reveal that the relatively larger 2nd GEN EN values previously seen in Figure 2 for low-rise buildings are attributable to different in the treatment of upstream terrain transitions between the two codes.
Despite differences in the dynamic characteristics, almost identical results to those in Figure 3 are seen for steel buildings in rural terrain. It is worth noting that for particularly large windward face widths which are common for such low-rise steel buildings of industrial use, the CsCd values of the 2nd GEN EN tend to be greater than those of the Irish NA. this is due to the lower limit of 0.85 imposed on this parameter when using the graphical values of the 2nd GEN EN. This lower limit is not implemented in the Irish NA.

5. Pressure Coefficients

5.1. Net Pressure Coefficients

Net pressure coefficient values are often used in the determination of the total windward forces acting on a building. They are calculated as the net sum of the pressure coefficients on the windward and leeward walls and enable the structural engineer to apply a single pressure value to the windward faces of the building which is representative of the global wind action.
A new inclusion in the 2nd GEN EN are the global external pressure coefficients (Cpeg). These are intended to simplify the determination of wind loads on foundations and lateral stiffening systems of buildings [21]. The global external pressure coefficients in the 2nd GEN EN provide a conservative estimable of the total wind load [21]. The 2nd GEN EN provides these pressure coefficients for the windward, leeward, side and roof faces of buildings [21].
The Irish NA provides net pressure coefficient values for rectangular plan buildings [36]. Both the Irish NA and the 2nd GEN EN provide Cpe,10 pressure coefficient values which are applicable to surface areas greater than 10 m2 in size. When evaluating the global wind forces acting on a building, the structural engineer has the option to use these Cpe,10 values.
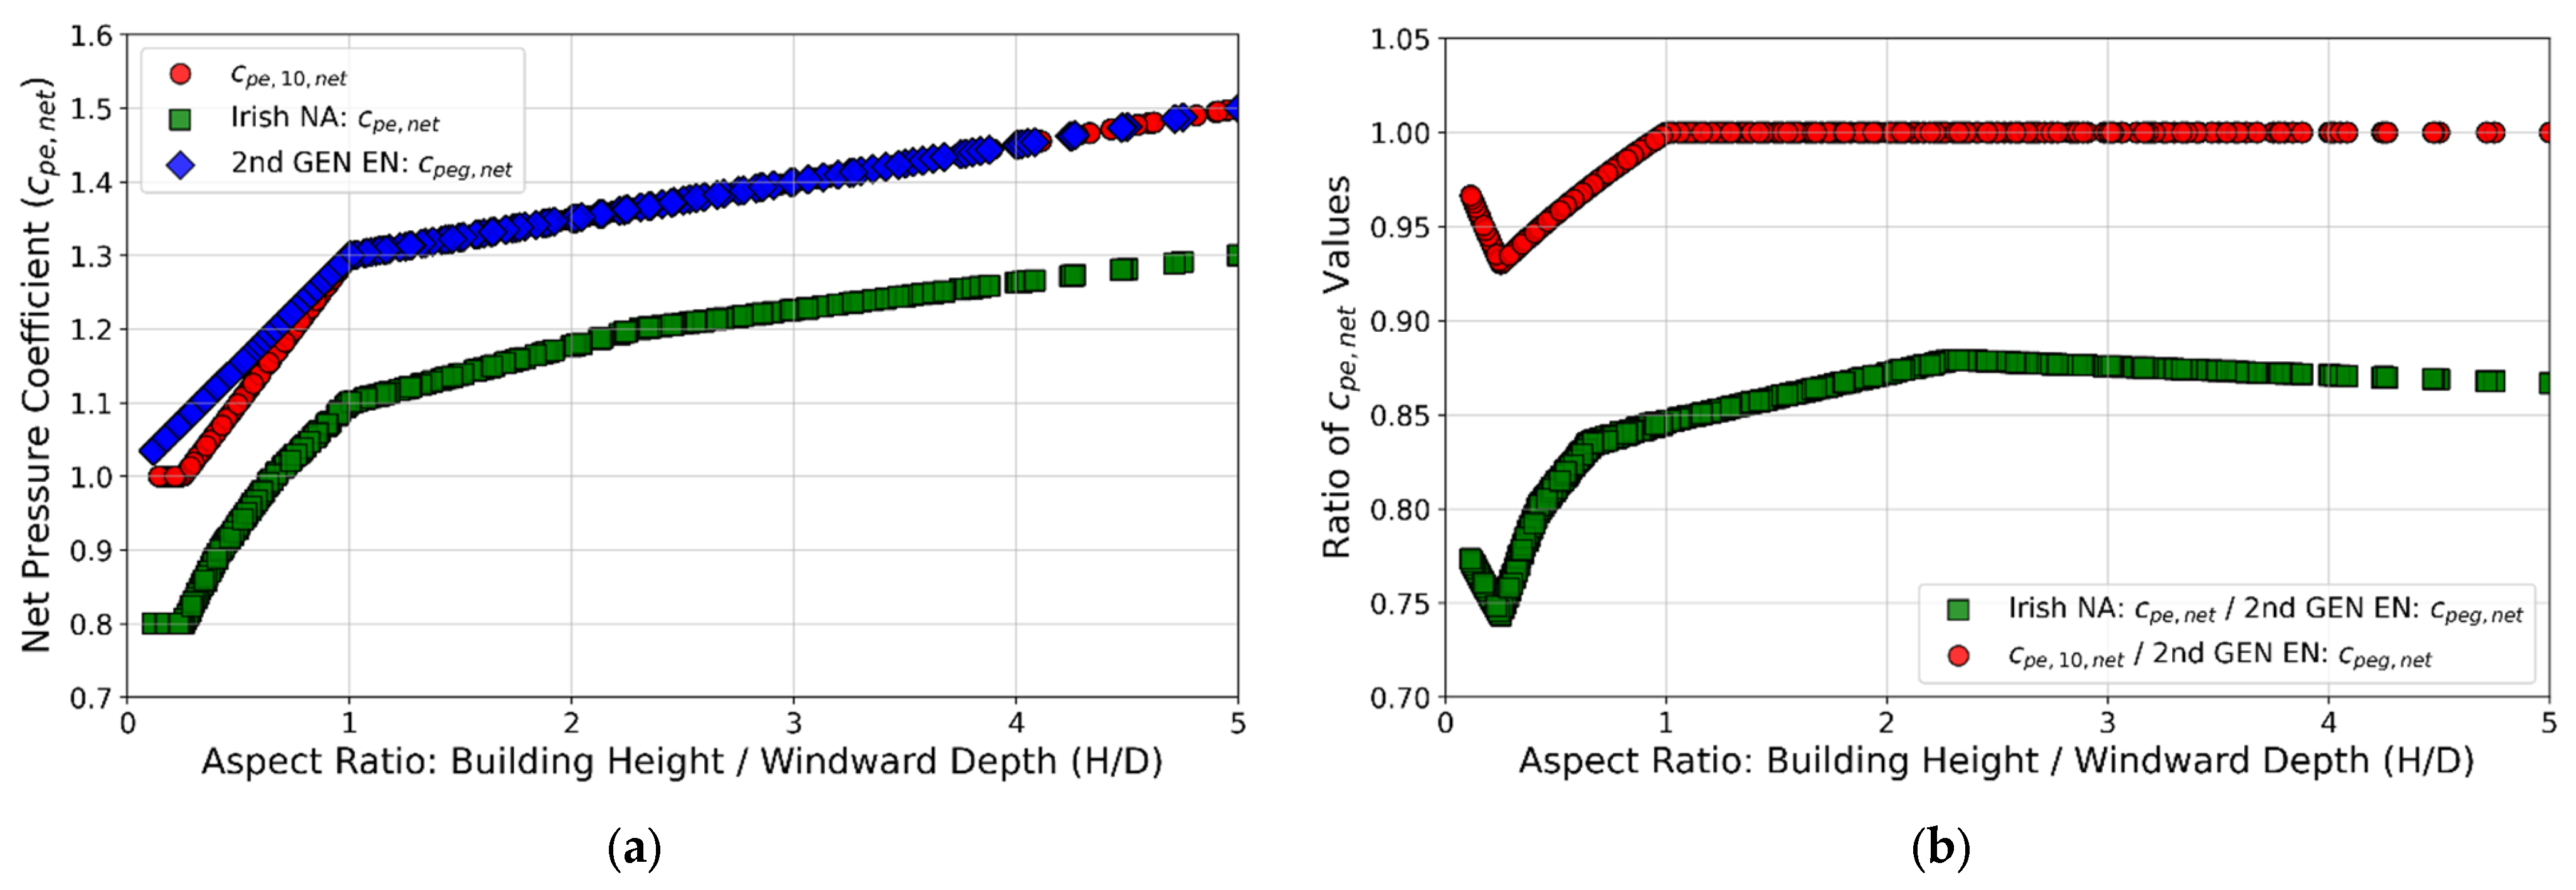
Figure 4 compares the values of net pressure coefficient calculated using the global pressure coefficient values (Cpeg) in the 2nd GEN EN, the net pressure coefficients provided in the Irish NA, and the Cpe,10 values.
For all aspect ratios (H/D in Figure 4), the Irish NA produces lower net pressure coefficient values than the 2nd GEN EN. These differences reach a maximum of 35% for some aspect ratios less than one as shown in Figure 4b. For aspect ratios greater than one, the 2nd GEN EN values are higher by between 12% and 15%. It is evident that deviating from the current net pressure coefficient values in the Irish NA and using the Cpeg values would produce higher calculated global actions under the 2nd GEN EN thatn under the Irish NA.
For buildings of aspect ratio greater than one, the net pressure coefficients calculated using the Cpe,10 values are identical to those using the Cpeg values. For aspect ratios less than one, the Cpeg values are higher by up to 7%. This increase in loading will impact large single-storey buildings such as industrial buildings and data centers.

5.2. Flat Roofs

The previously completed calibration study [2] which compared the pressure coefficients for flat roofs provided in the EN1991-1-4:2005 standard [37] with those in the BS639901:1997 standard [1], revealed significant differences in the determined values for a selection of building geometries. As a result of these discrepancies, an advisory note is included in the Irish NA which redirects engineers to the BS6399-2 standard for the purpose of determining pressure coefficients on roofs [36]. The 2nd GEN EN provides the same values of pressure coefficient for flat roofs as those included in the first generation of the code of practice. The inclusion of these values in a normative annex means that there is no national choice for these pressure coefficients.
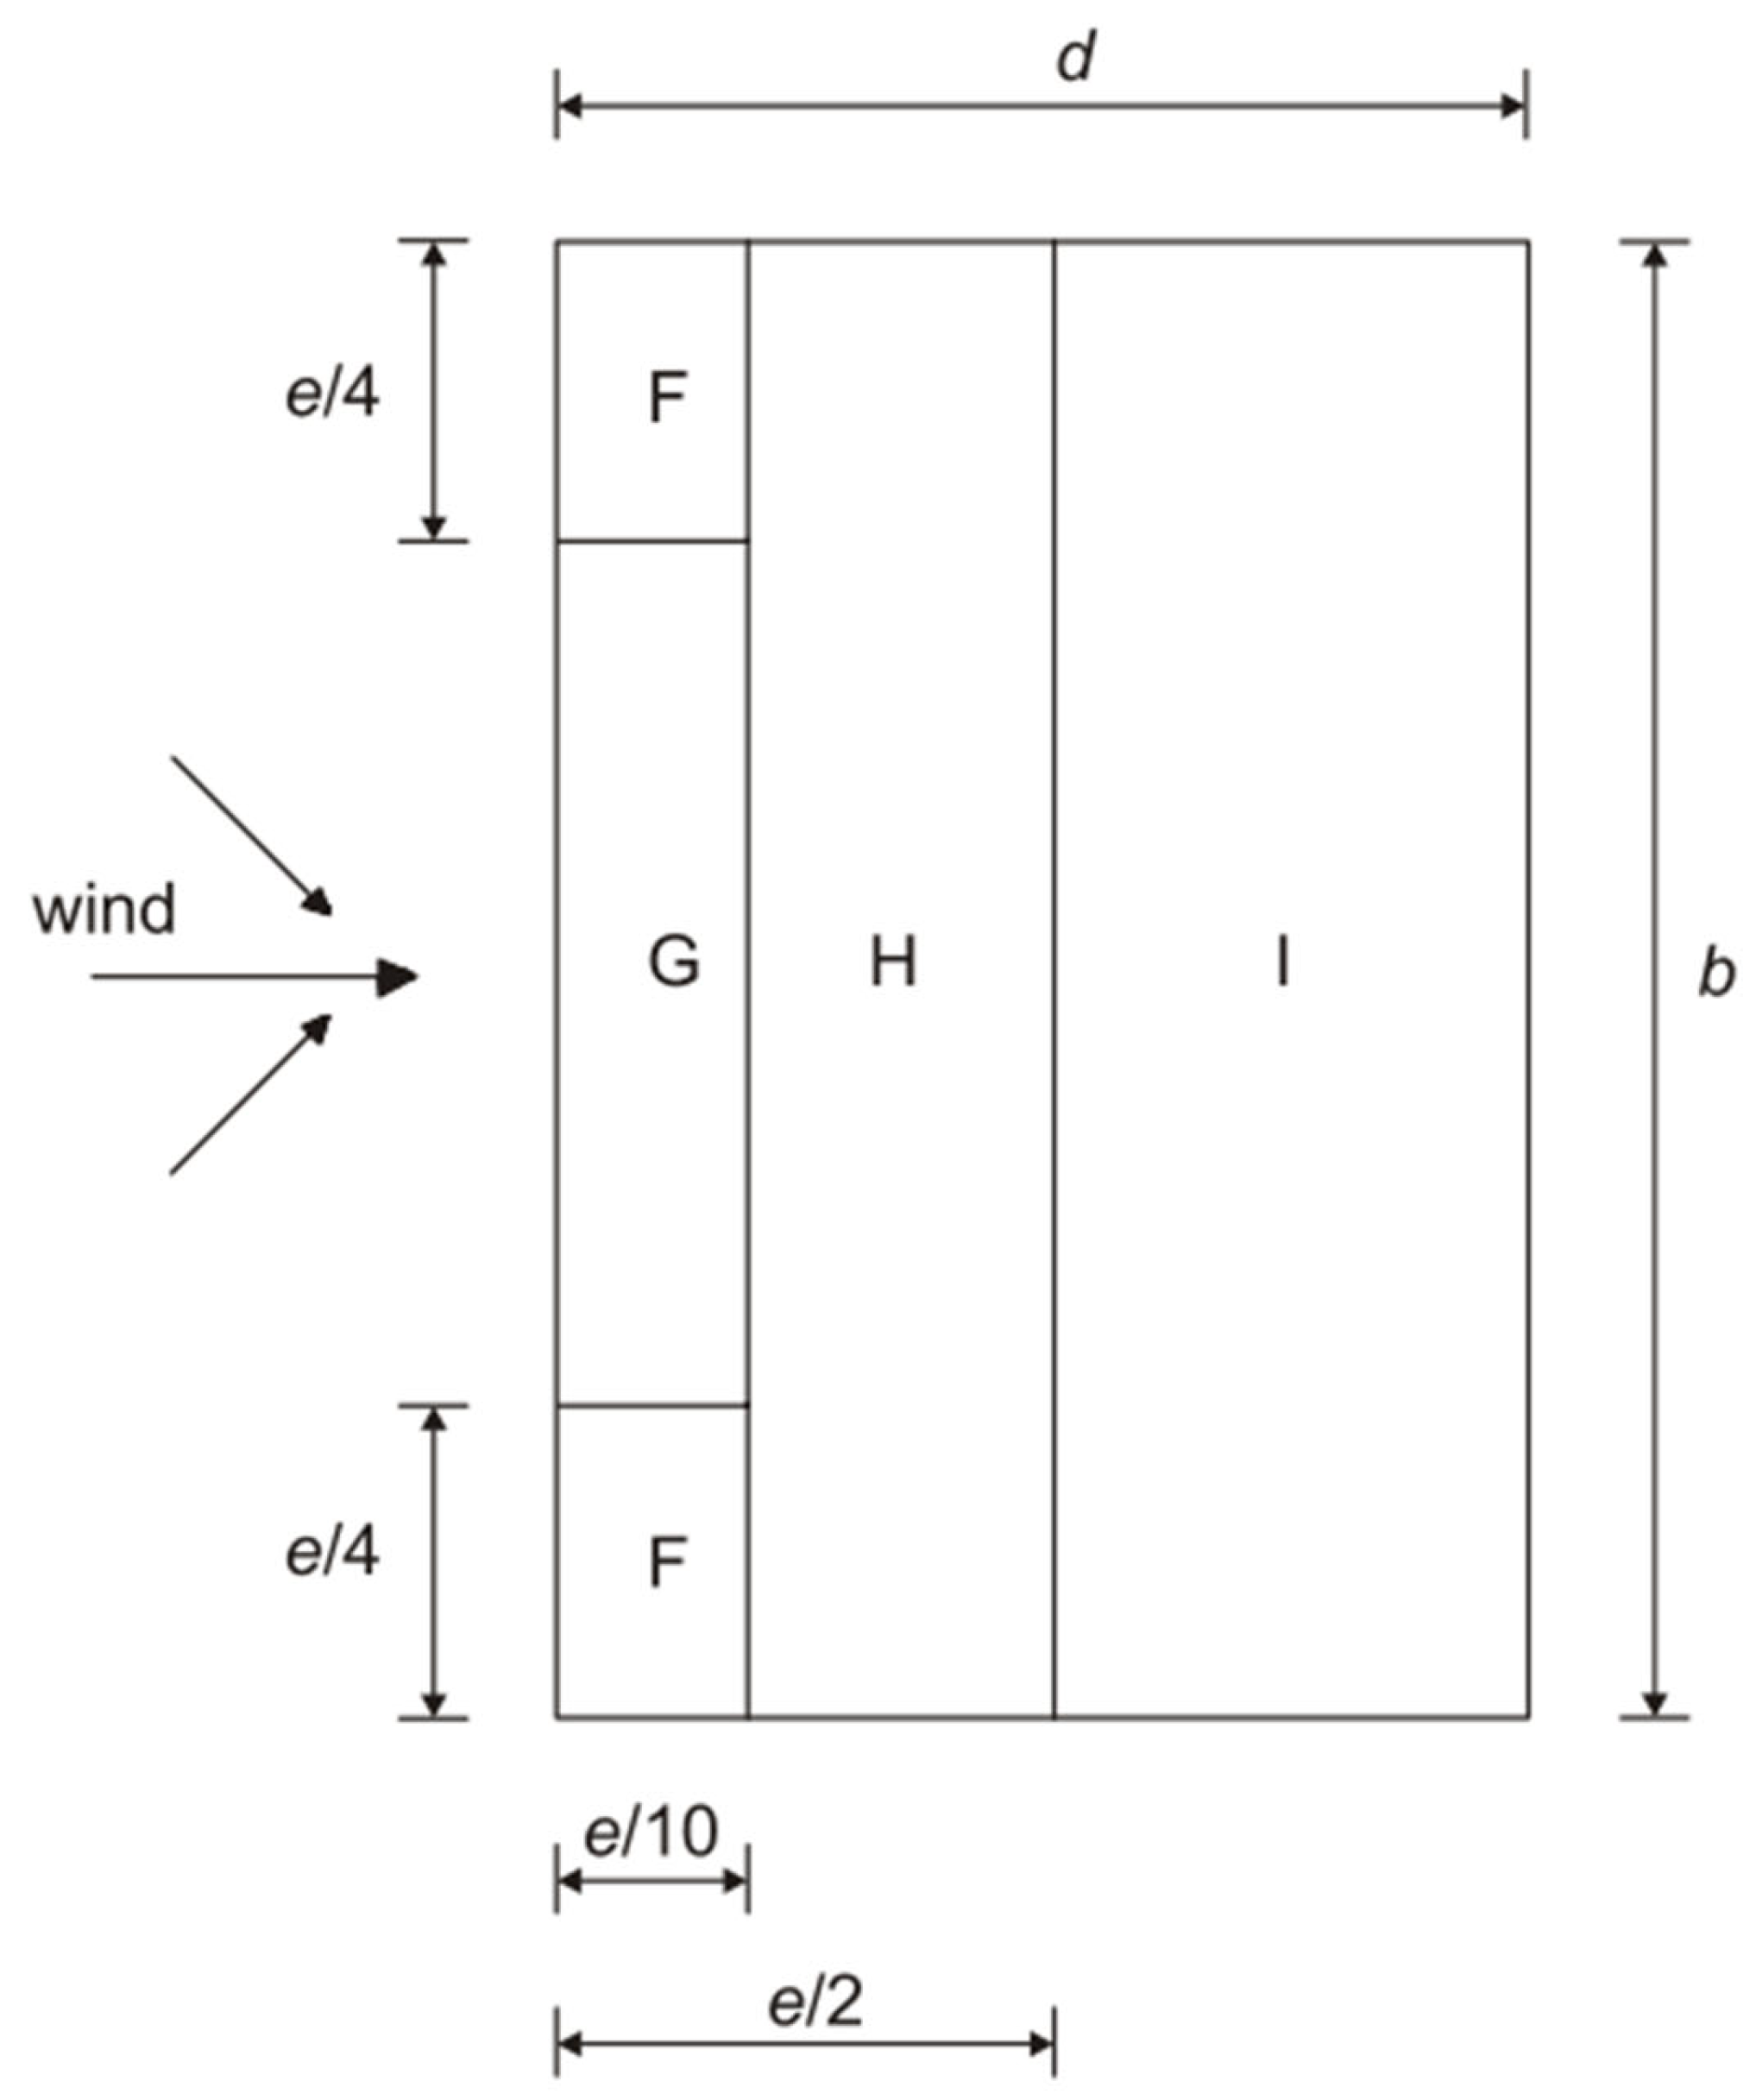
In comparing the values of the 2nd GEN EN and Irish NA, a constant roof parapet height of 1.1 m has been chosen in accordance with the minimum requirements specific in the building regulations in Ireland [38]. Unlike the procedure outline in the 2nd GEN EN whereby the coefficients depend only on building and parapet height [21,37], the BS6399-2 values depend on the width of the windward face of the building [1]. Figure 5a,b shows the ratios of BS6399-2 to 2nd GEN EN coefficient values for Zone G and Zone F roof areas (Figure 6), respectively [1].
Figure 5 shows that the BS6399-2 [1] Zone F and G external pressure coefficients are of the order of 50% greater than those of the 2nd GEN EN for buildings less than 20 m in height. These significant differences in pressure coefficient will likely have an impact on the design of supporting structural members in these roof zones. For example, single-story steel structures designed using the 2nd GEN EN external pressure coefficients will likely have a larger purlin spacing to support the roof cladding in zones F and G.
Taller buildings are also affected by the differences in pressure coefficient values with the BS6399-2 [1] values being between 20% and 25% higher than those of the 2nd GEN EN for residential or commercial buildings between 10 and 15 stories in height. Similarly, Zone F and Zone G pressure coefficients for high-rise towers between 60 m and 100 m in height are smaller by between 15% and 18% compared to the current BS6399-2 [1] values.

5.3. Façade Elements

The methodology implemented in the Irish NA and the 2nd GEN EN for determining external pressure coefficients differs for façade elements between 1 m2 and 10 m2 in size. The Irish NA and 2nd GEN EN provide two types of detailed external pressure coefficients, Cpe,1 and Cpe,10 values, which are used for surface areas less than 1 m2 and greater than 10 m2, respectively. For areas between 1 m2 and 10 m2 in size, the 2nd GEN EN suggests the use of logarithmic interpolation between the Cpe,1 and Cpe,10 values. The Irish NA does not implement the method of logarithmic interpolation, instead suggesting the use of Cpe,10 values for all areas greater than 1 m2 in size. This difference in methodology has a localized effect, most notably in the determination of design pressures for façade elements which are frequently between 1 m2 and 10 m2 in size.
Figure 7 shows a comparison between the external pressure coefficient values determined using both the 2nd GEN EN and Irish NA methodologies for façade elements located in Zone A of a building. Common practice in the design of facades involves the design of a single facade panel and its required fixings for use across all vertical walls of the building. This is to avoid the potential of incorrect installation during the construction process. As a result, the highest wind pressure experienced across the vertical walls of the building (Zone A) is typically chosen as the design pressure for all vertical façade elements.
Figure 7 shows that the logarithmic interpolation between pressure coefficient values results in 2nd GEN EN values which are greater than those in the Irish NA. The majority of façade panels used for buildings are between 4 m2 and 6 m2 in size. For such façade panels, the increase in the value of external pressure coefficient can be expected to be between 4% and 6% by using the 2nd GEN EN methodology. For typical values of internal pressure coefficient (Cpi), the design pressures can be expected to increase by approximately 5% using the 2nd GEN EN logarithmic interpolation methodology.

6. Terrain Roughness Transitions and Peak Velocity Pressure

The expressions for peak velocity pressure used in the existing Eurocode, the Irish NA and the 2nd GEN EN are shown in Equations (1)–(3), respectively.
qp(z) = 0.5 [1 + 7 Iv(z)] c vm2
qp(z) = 0.5 [1 + 3 Iv(z)]2 c vm2
qp(z) = 0.5 [1 + 2.9 Iv(z)]2 c vm2
where Iv(z) is the turbulence intensity (dimensionless) at height z (m), vm is the mean wind velocity (m/s) and c is the air density (kg/m3). Each of these expressions is based on the gust factor concept used in determining quasi-static wind pressures [39], the theory for which was initially developed by Davenport [40].
The existing Eurocode implements the original expression developed for gust factor [1 + 7 Iv(z)] by Davenport, where the peak factor, kp, is assumed to be 3.5. The existing Eurocode incorporates Davenport’s assumption of the negligible impact of second-order turbulent velocity terms, creating a linear expression for qp(z). This assumes that the turbulent component of the overall wind speed is significantly less than that of the mean component in strong winds [4]. This simplification becomes unsafe when the wind turbulence component increases in magnitude due to greater surface roughness, such as that found in urban terrain [41]. The Irish NA and 2nd GEN EN recognize the unsafe nature of this assumption and implement the second-order turbulent wind velocity terms with lower peak factor values of 3 and 2.9, respectively.
As shown by Equations (1)–(3), peak velocity pressure is dependent on the mean wind velocity, vm, and the turbulence intensity, Iv(z). These parameters are calculated by using reference height and terrain conditions as inputs. A site’s terrain category depends on the roughness and distance to the upstream smoother terrain. The Irish NA implements the Harris and Deaves non-equilibrium model in consideration of upstream changes in surface roughness [42]. This model accounts for the fact that the surface roughness length (z0) becomes a function of distance to the upstream change in surface roughness [14].
The 2nd GEN EN implements discrete expressions that do not consider a continuous change in z0 with distance to the upstream terrain transition. This results in the z0 value for a site being limited to those defined for the four terrain categories specified in the 2nd GEN EN. Expression 6.8 of the 2nd GEN EN (Equation (4)) determines the minimum distance from the site at which changes in upstream terrain roughness should be considered (xs) [21]. This is a change in methodology from the current Eurocode, which includes these distances for a limited range of building heights in a tabular format in Annex A of the document [37].
xs = xo (h/ho)1.2
where xo is the length parameter (which equals 1000 m), h is the reference height (m) for the determination of qp and ho is 23.2 m.

6.1. Peak Velocity Pressure Profiles

Figure 8 compares the qp(z) values from each code of practice for a range of heights up to 100 m at a rural site in Dublin.
The 2nd GEN EN produces higher peak velocity pressure (qp(z)) values than the Irish NA at all heights at country sites, as illustrated by the ratios less than one in Figure 8b. Figure 8b shows the most significant difference in qp(z) values at heights less than 20 m. Similar behavior is seen for the Cork and Waterford sites. This suggests low-rise structures will have larger 2nd GEN EN qp(z) values. 2nd GEN EN values up to 21% and 15% higher than the Irish NA are recorded for sites located downstream of a nearby shoreline and smoother country terrain, respectively.
The distribution of qp(z) values for rougher terrain at a site in Dublin City is shown in Figure 9. A summary of the results for the different city sites in Ireland is provided in Table 2. For each site, the ratio r(z) = qp(z)IrishNA/qp(z)2ndGEN is evaluated at the set of reference heights used for the profiles in Figure 8 and Figure 9. The term ‘domain’ denotes this evaluated height set for the site’s critical wind direction. The term ‘Max. ratio’ is the highest value of the ratio r(z) over the domain across the heights that were evaluated, and the term ‘Min. ratio’ is the lowest value. The term ‘mean’ implies the arithmetic mean of r(z) taken over the subset where r(z) is greater than 1. The same definitions are used consistently where identical headings appear in Table 4 for base-shear ratios.
The comparative behavior between the two codes is more complex for city sites. This is evident from the different proportions of heights producing higher and lower 2nd GEN EN qp(z) values for the city sites in Table 2 due to abrupt switch in terrain classification with increasing building height.
Table 2 shows similar behavior in the relative qp(z) values for the Dublin and Galway sites. Both sites transition from a region of over-estimation relative to the 2nd GEN EN values to a region of underestimation, as shown by the distribution of values in Figure 9a. The sudden change in terrain category classification of the 2nd GEN EN from a town site to a seaside site causes this transition.
The Cork, Waterford and Limerick sites show similar behaviour due to their location downstream of smoother country terrain. At these sites, the Irish NA qp(z) values are larger than those of the 2nd GEN EN for all reference heights, with the relative differences diminishing with increasing height. The Irish NA qp(z) values are greater than the 2nd GEN EN by more than 50% at a reference height of 10 m, as shown by the maximum ratios in Table 2.

6.2. Upwind Terrain Transitions: Country Sites

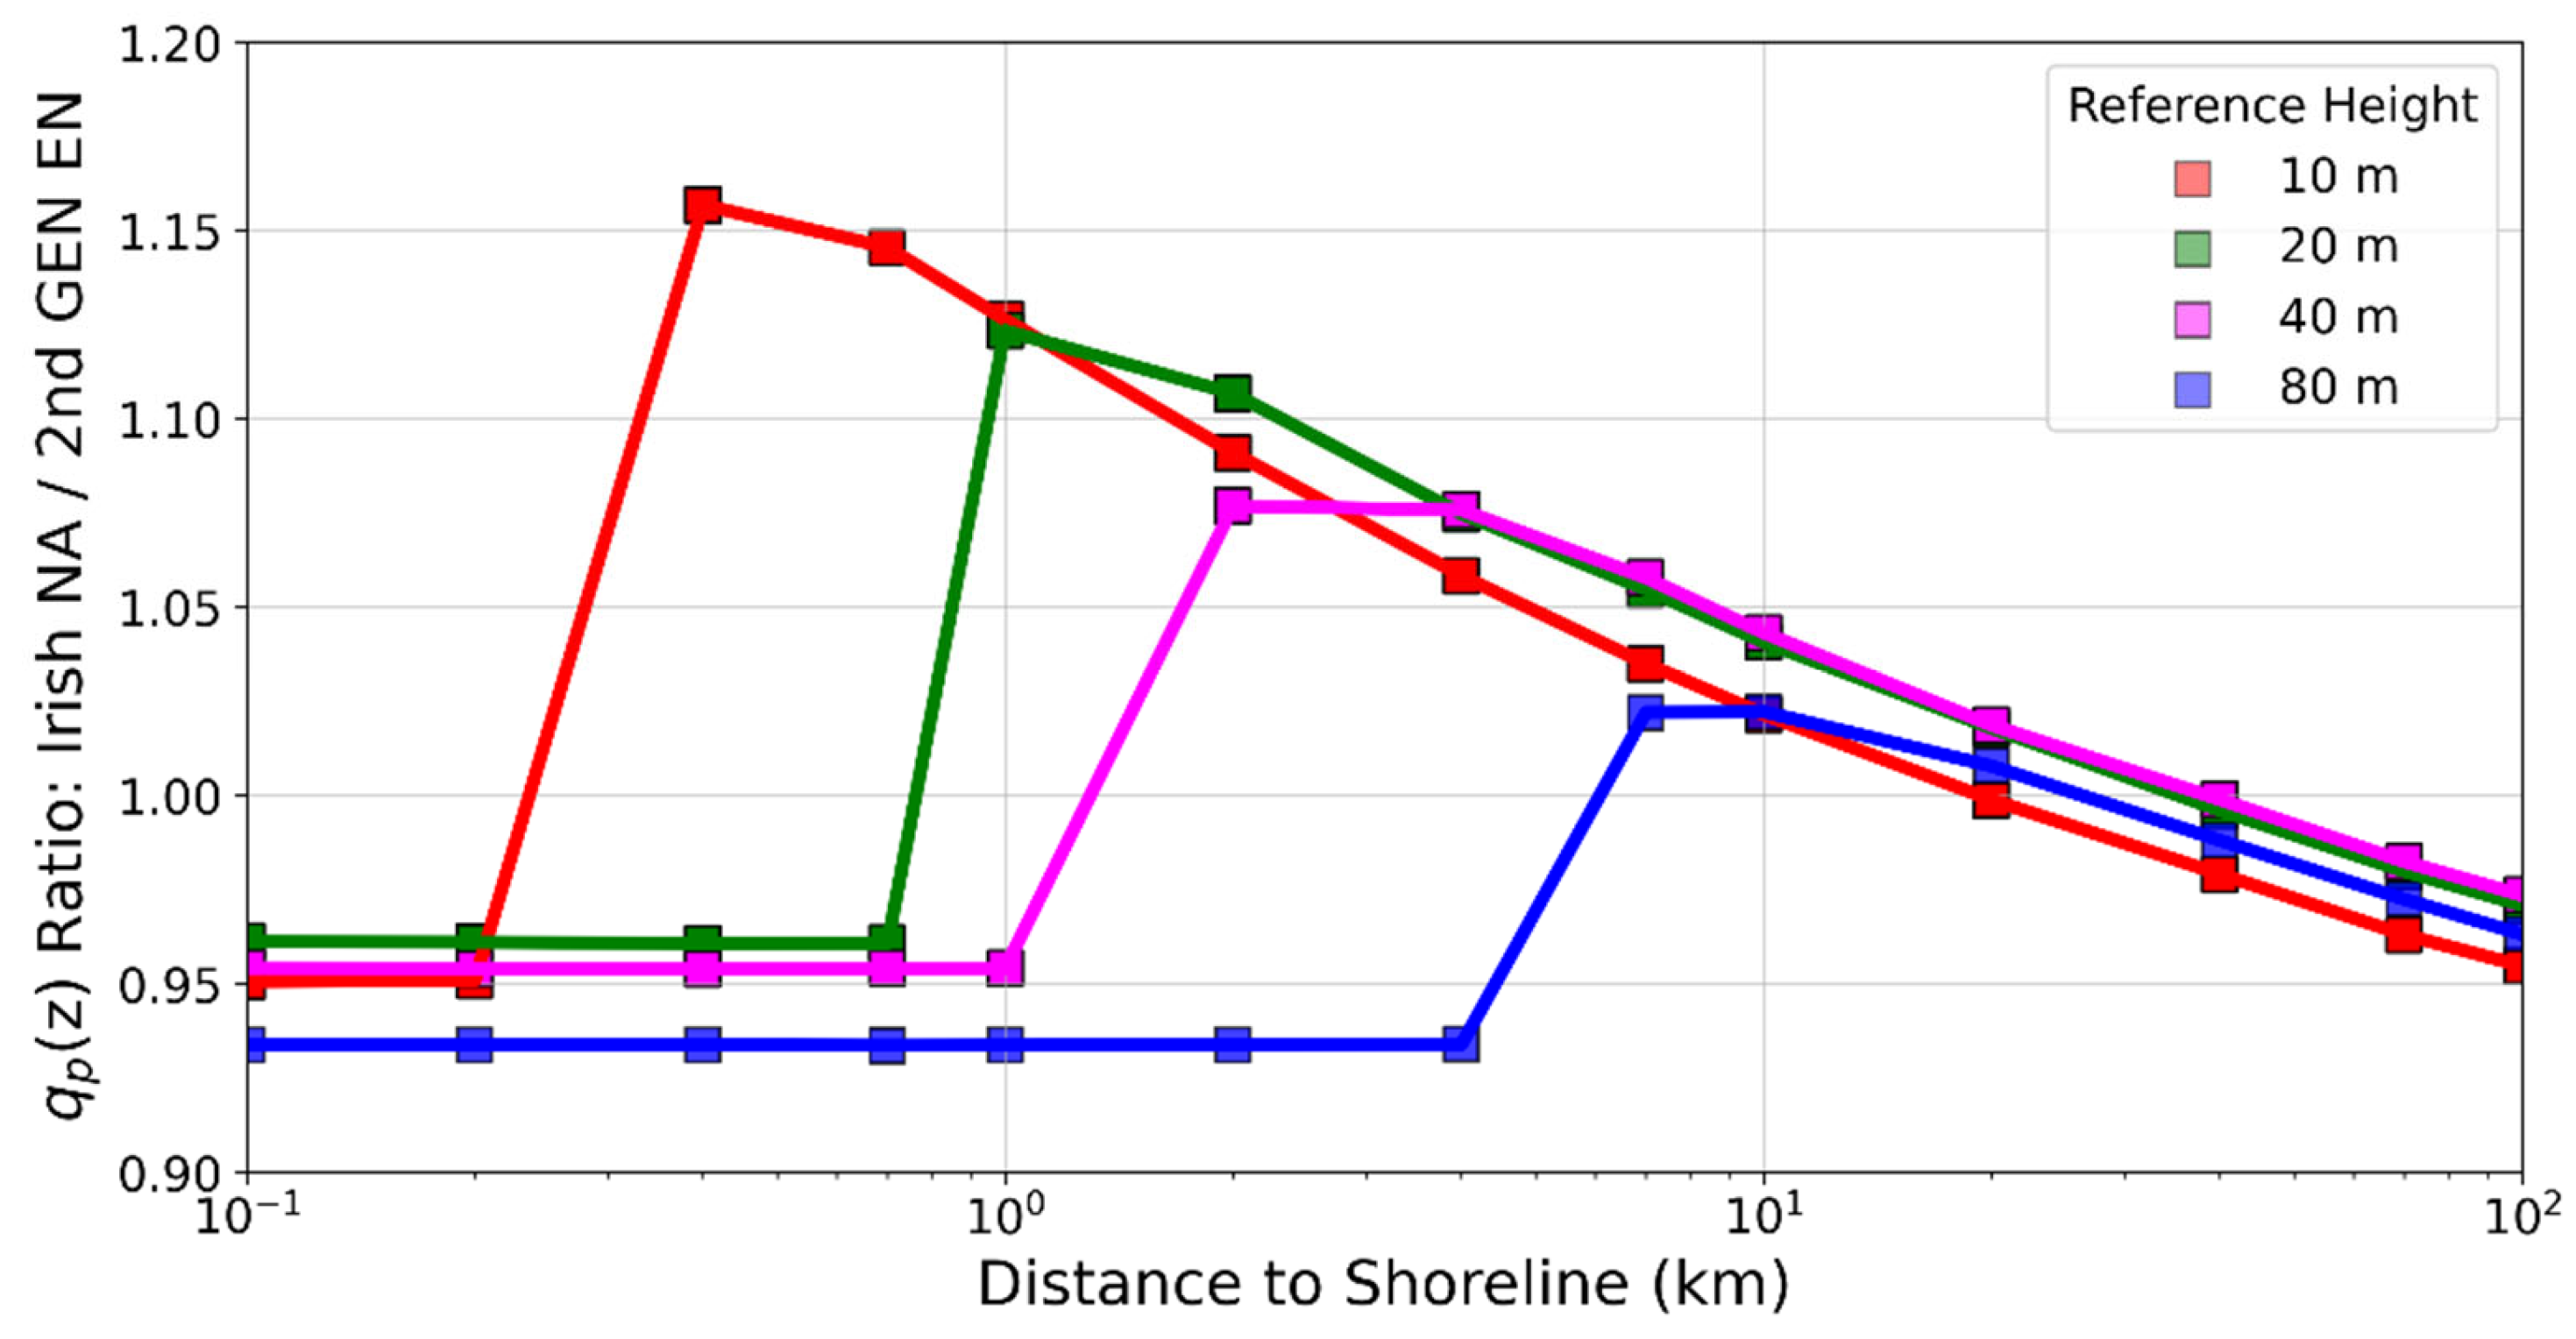
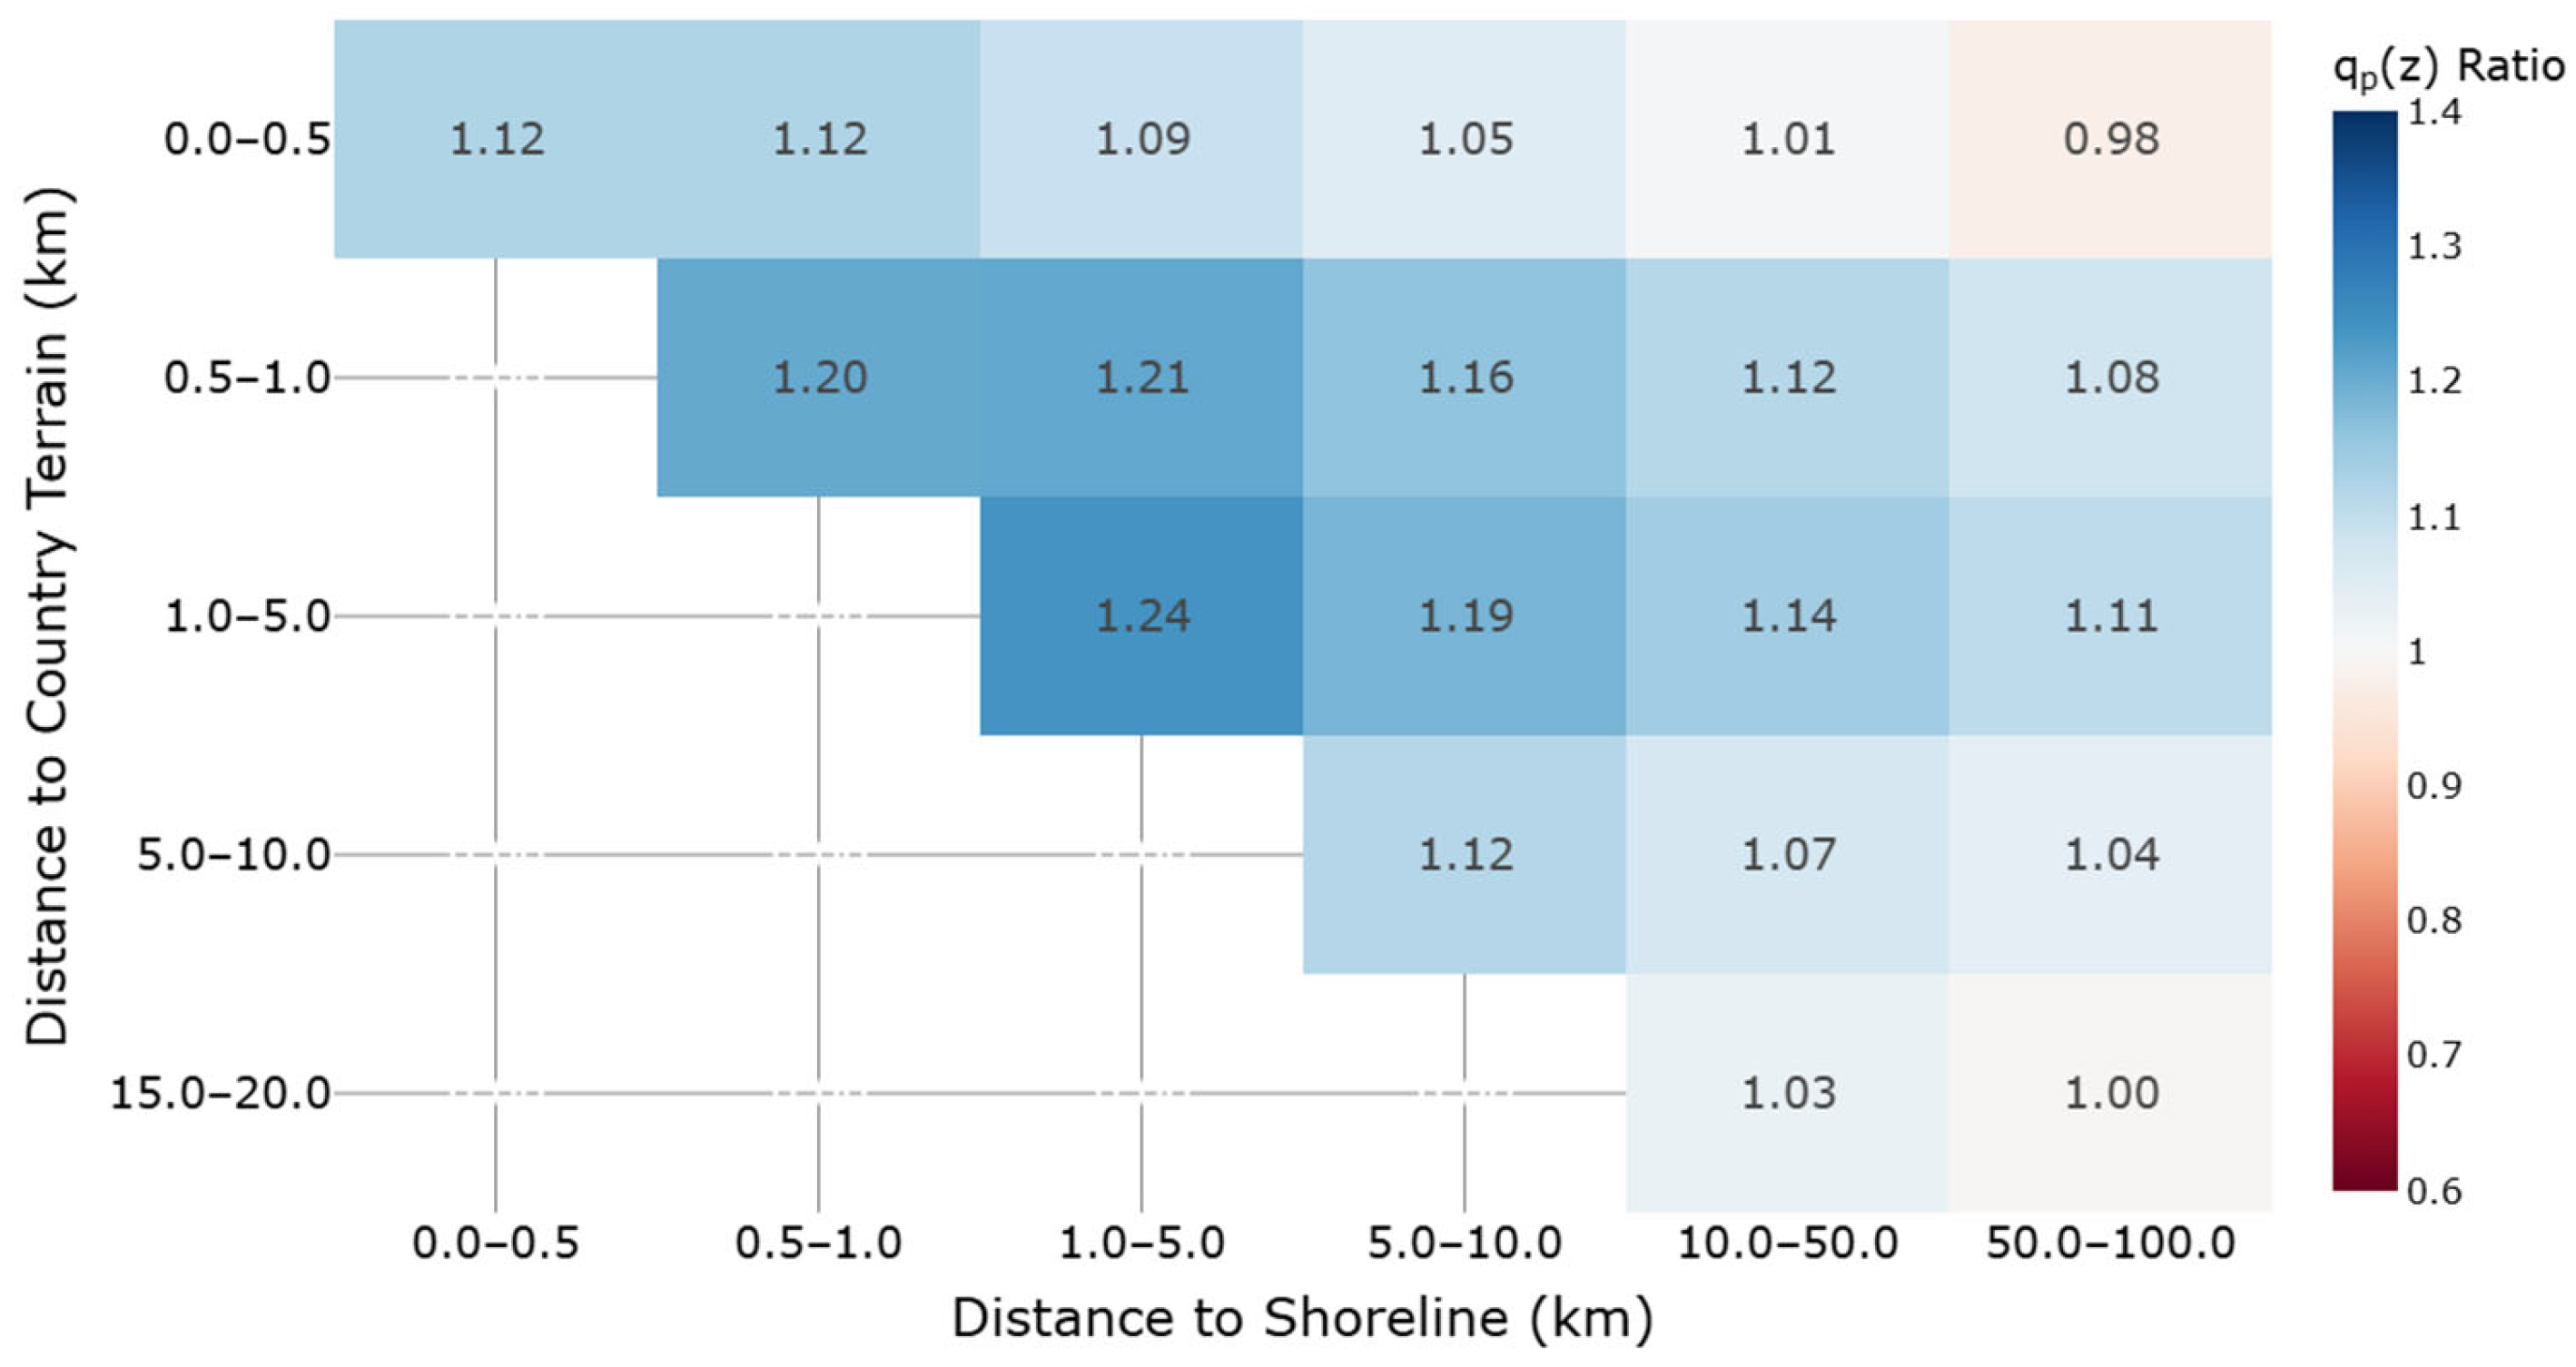
Figure 10 shows the ratios of the Irish NA to the 2nd GEN EN qp(z) values for a range of reference heights and rural site locations at varying distances downstream of the shoreline. The differences between the codes are significant and variable in nature, with the 2nd GEN EN values showing the possibility of being either higher or lower than those of the Irish NA, depending on the distance to the shoreline.
It is evident from Figure 10 that for each reference height, a sudden and large increase in the qp(z) ratio occurs at a particular distance from the shoreline. This results from the 2nd GEN EN suddenly changing terrain category classification from sea to country terrain. This causes a sudden reduction in the 2nd GEN EN qp(z) values relative to the Irish NA values. Figure 10 shows that the effect of this change in terrain category is more impactful for low-rise buildings, with the 2nd GEN EN values being up to 15% lower than those of the Irish NA at a height of 10 m. For sites located particularly close to or far away from the shoreline, Figure 10 shows that the 2nd GEN EN values can be up to 5% greater than the Irish NA.

6.3. Upwind Terrain Transitions: City Sites

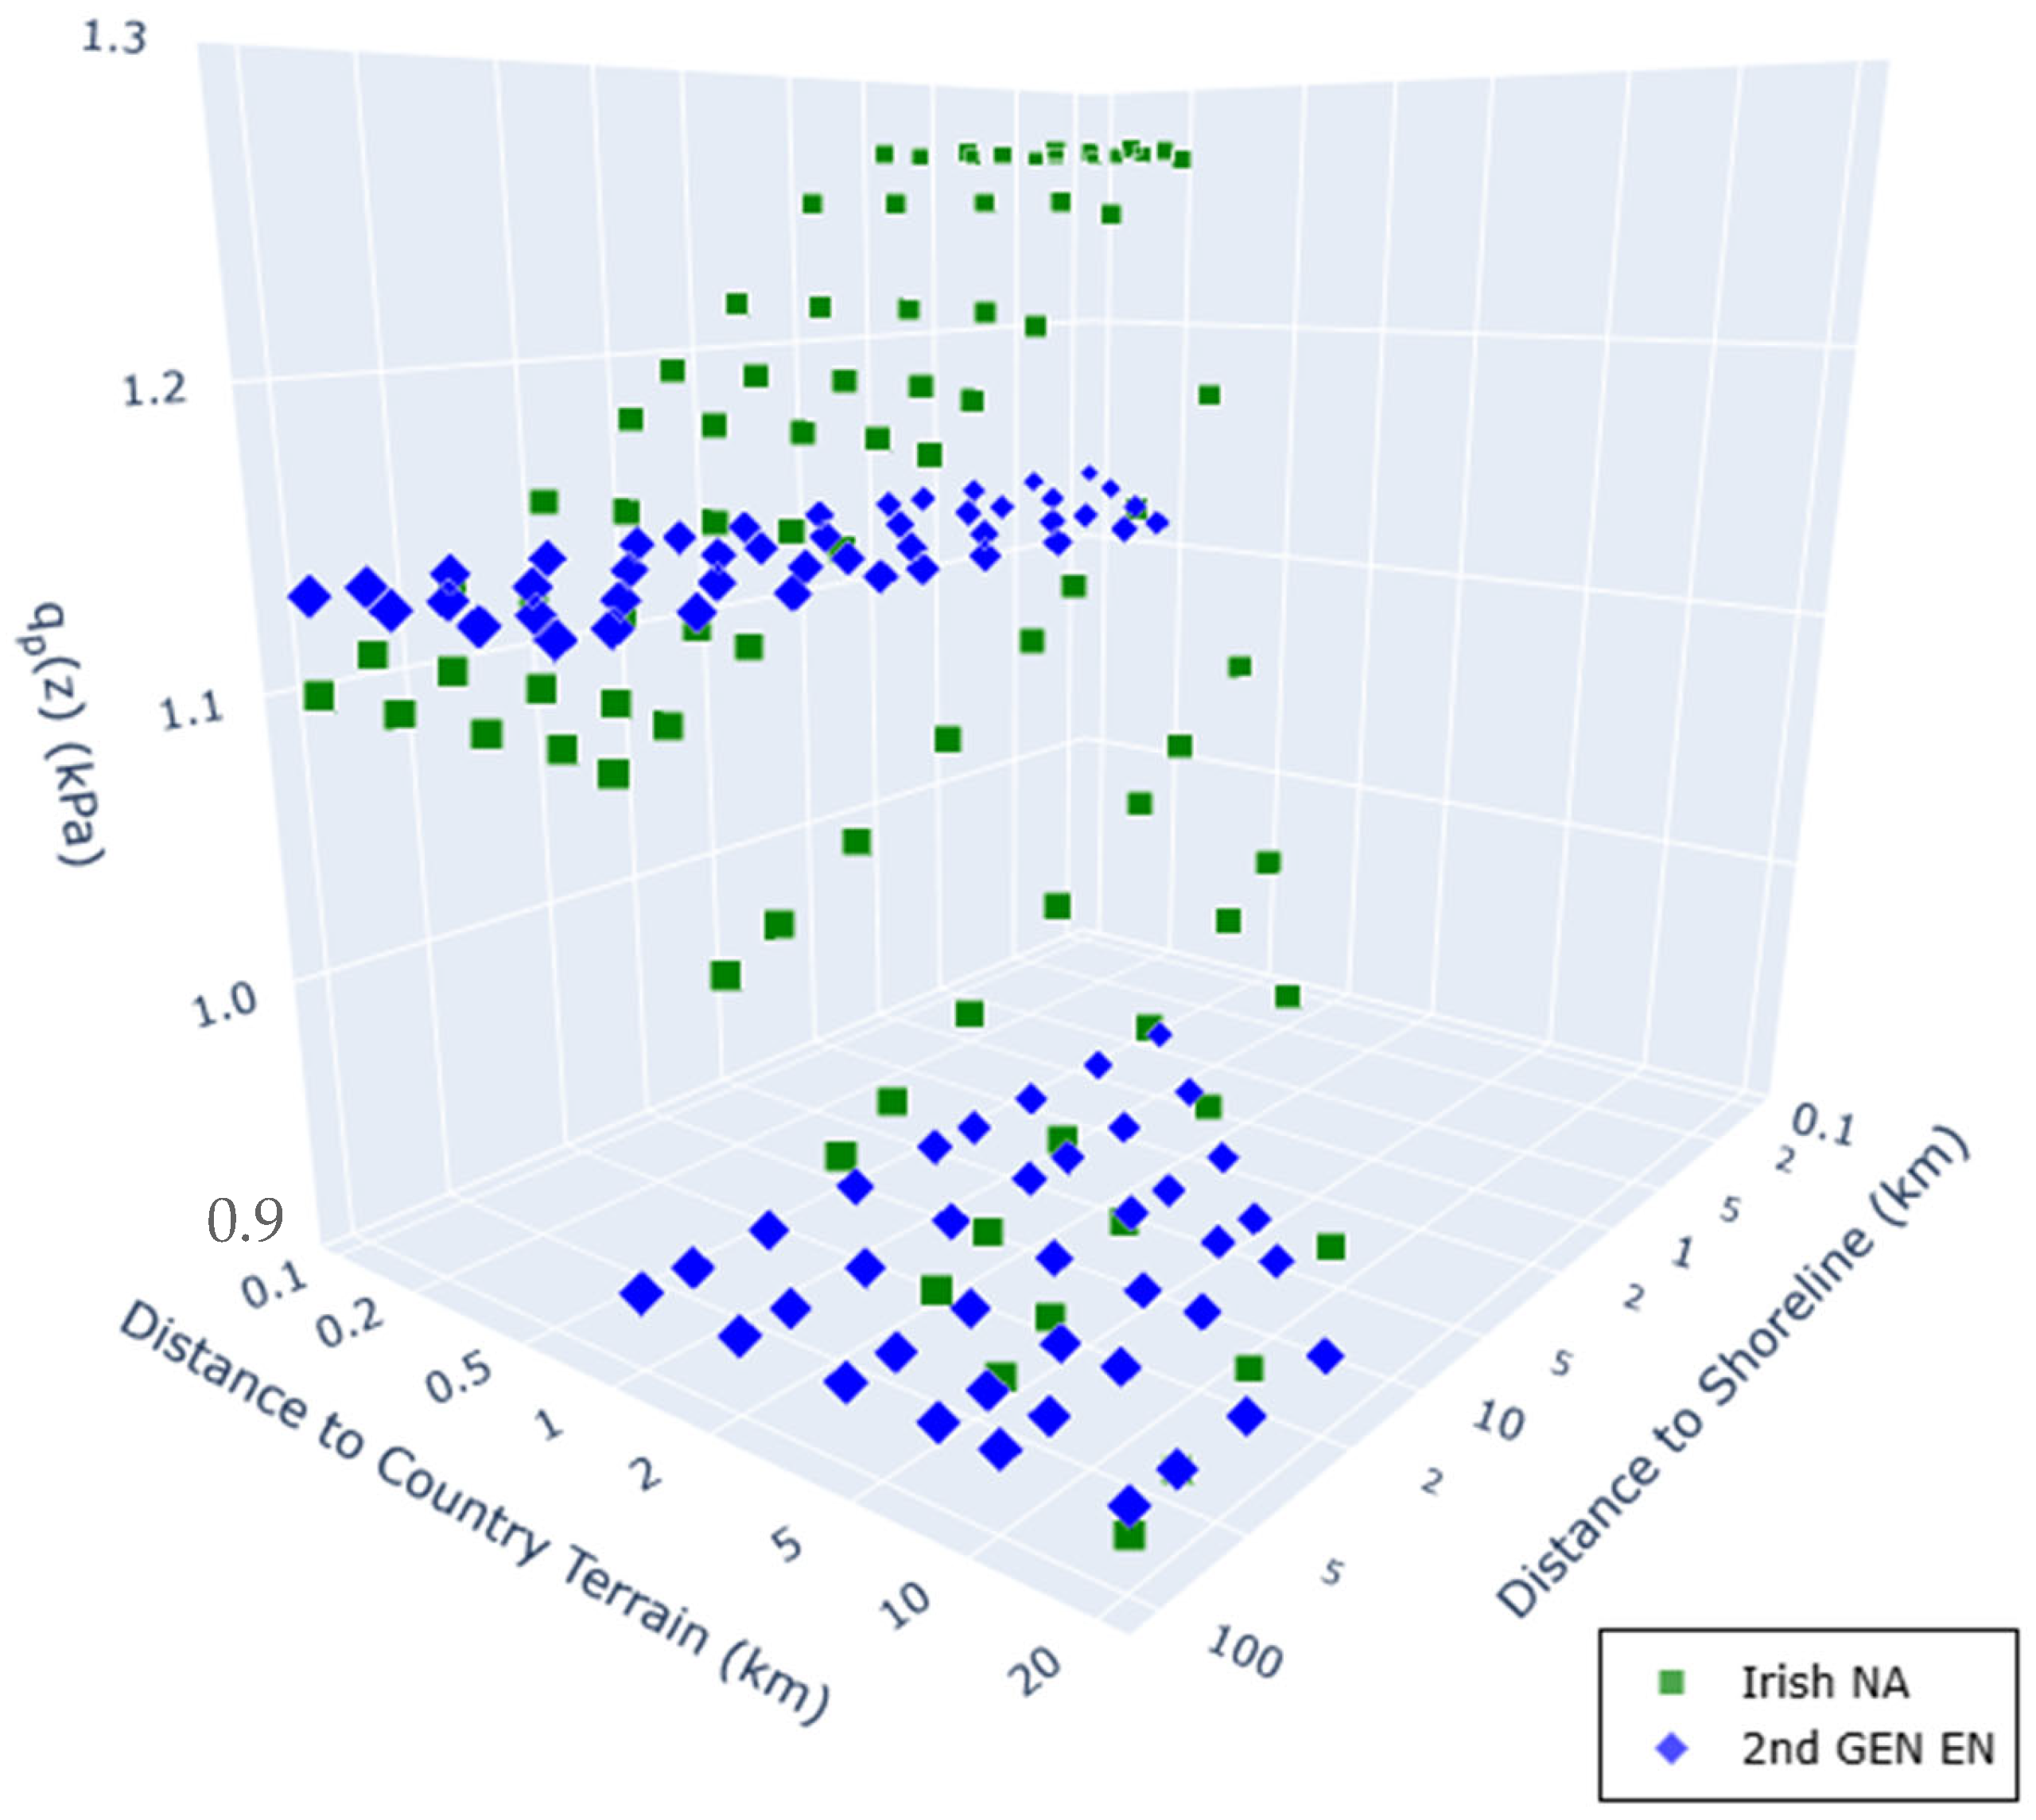
Figure 11 shows the distribution of qp(z) values at a height of 20 m at a city site (Terrain Category III), located at various distances to the nearest shoreline and smoother upstream country terrain (Terrain Category II). A large discontinuity in the 2nd GEN EN values is evident in Figure 11 where there is a change in terrain category classification at 0.5 km to the country terrain. This results in a significant difference between the Irish NA and 2nd GEN EN.
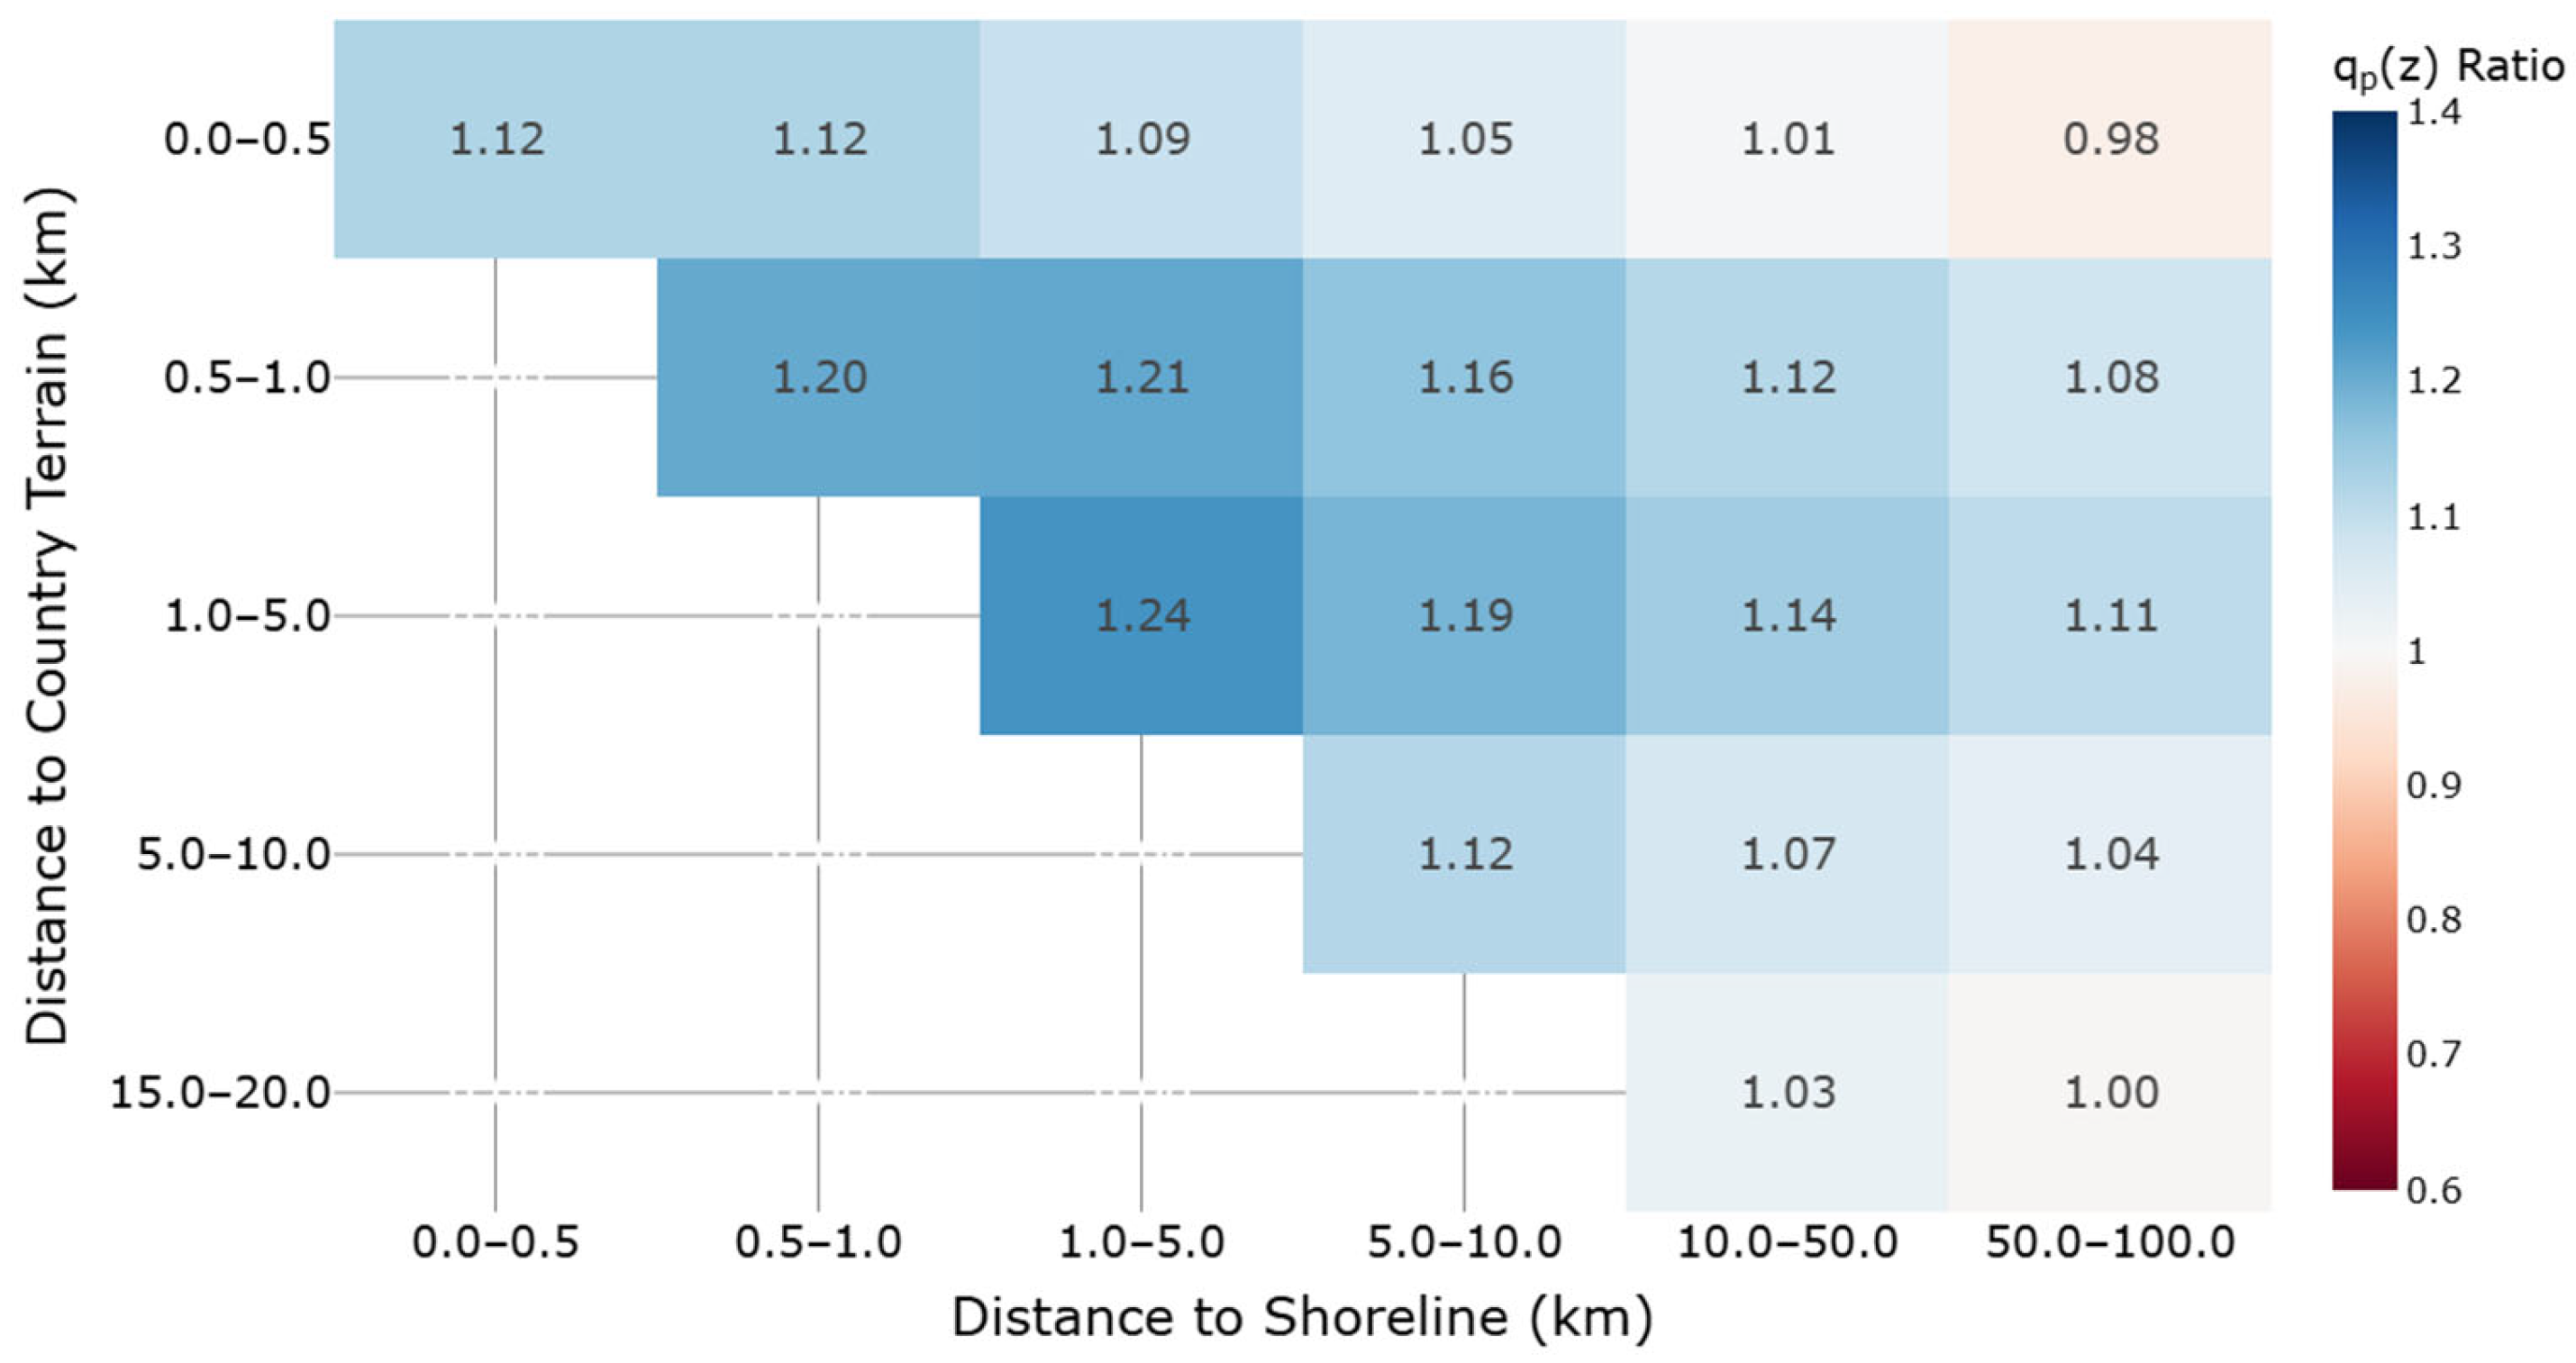
Figure 12 shows the distribution of Irish NA to 2nd GEN EN qp(z) ratios for the same range of qp(z) values shown in Figure 11.
At the location of discontinuity, the 2nd GEN EN values are greater than the Irish NA by more than 20% as shown in Figure 12. This difference gradually decreases as distance to the shoreline increases.
Table 3 shows a summary of the qp(z) ratios between the codes for the same site locations shown in Figure 11 for a range of building heights. Similar discontinuities occur for each of the building heights shown in Table 3. The magnitude of the differences between the codes reduces with increasing height, however, as shown by the maximum ratios and mean values for ratios greater than one in Table 3. This is a similar phenomenon to that shown in Figure 10.

7. Wind Loads

7.1. City Sites

In this section, the total wind loads (base shear) calculated using the 2nd GEN EN and Irish NA for a range of building geometries in urban terrain are compared.
Figure 13 shows the base shear values calculated for a range of concrete building geometries at a site in Dublin City. The distribution of values is very similar to that for peak velocity pressure in Figure 9 where the 2nd GEN EN tends to produce smaller values than the Irish NA at smaller heights and relatively larger values for buildings greater than 70 m in height.
Figure 14 shows the ratio of the Irish NA to 2nd GEN EN base shear values for the same building geometries of Figure 13. The 2nd GEN EN is seen to produce total wind loads which are of the order of 20% less than those of the Irish NA for mid-rise buildings. Conversely, for tower-like buildings, the 2nd GEN EN produces values between 8% and 16% higher than those of the Irish NA at this site location. The significant differences between the codes of practice are predominantly attributable to the treatment of changes in upstream terrain roughness.
Table 4 shows a statistical summary of the results shown in Figure 14 for a range of city sites in Ireland. The variability among the sites is evident from the maximum base shear ratios and the proportion of the building geometries at each site with higher (ratios < 1) or lower (ratios > 1) 2nd GEN EN base shear values. This variability is attributable to differences in upstream terrain conditions at each of the sites.
A cause of concern is the higher Irish NA base shear ratios for low-rise buildings at city sites located down-stream of smoother country terrain (Cork, Waterford, Limerick). Differences reach 38%, 45%, and 30% for Cork, Waterford, and Limerick, respectively, as shown in Table 4. These low-rise buildings of around 3–5 stories are common in Ireland and will have higher calculated design wind actions under the 2nd GEN EN methodology relative to the Irish NA for these geometries and sites.

7.2. Country Sites

A comparison of the total wind loads calculated using the 2nd GEN EN procedures and those of the Irish NA for buildings in rural terrain is presented in this section.
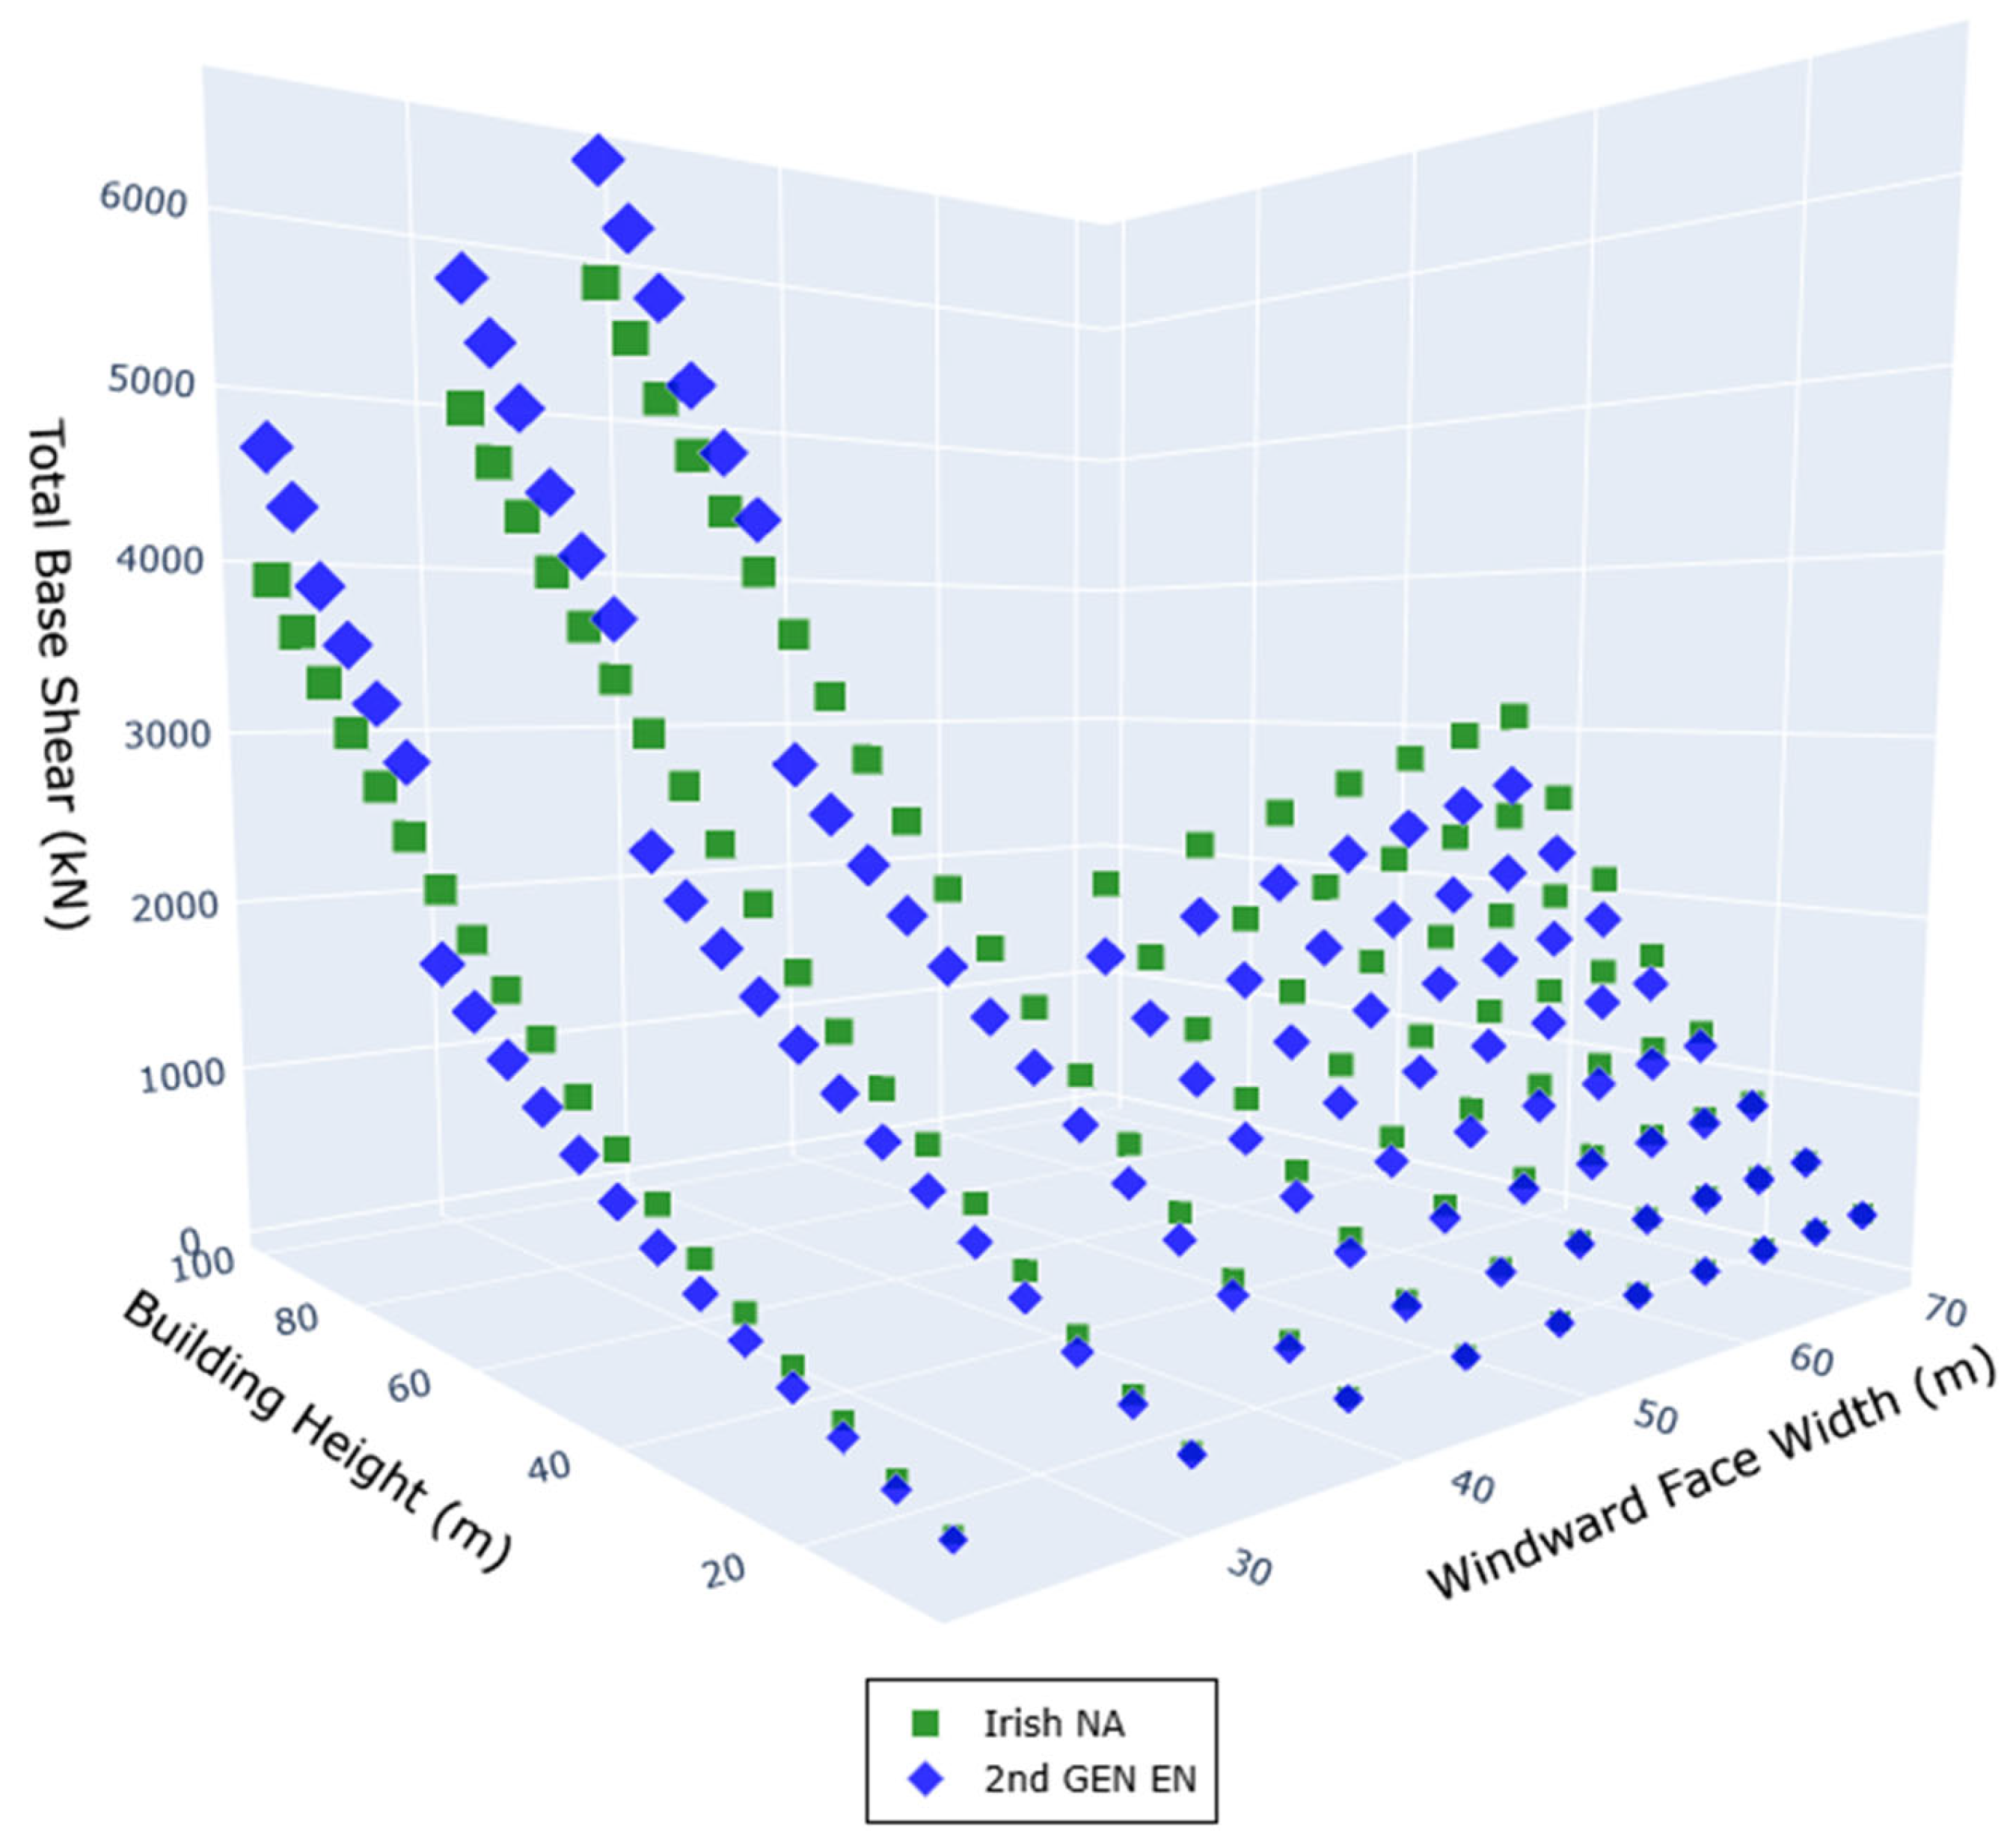
The 2nd GEN EN produces higher values of base shear than the Irish NA for all building geometries at the country sites investigated, as shown by the distribution of base shear values for steel buildings in Figure 15.
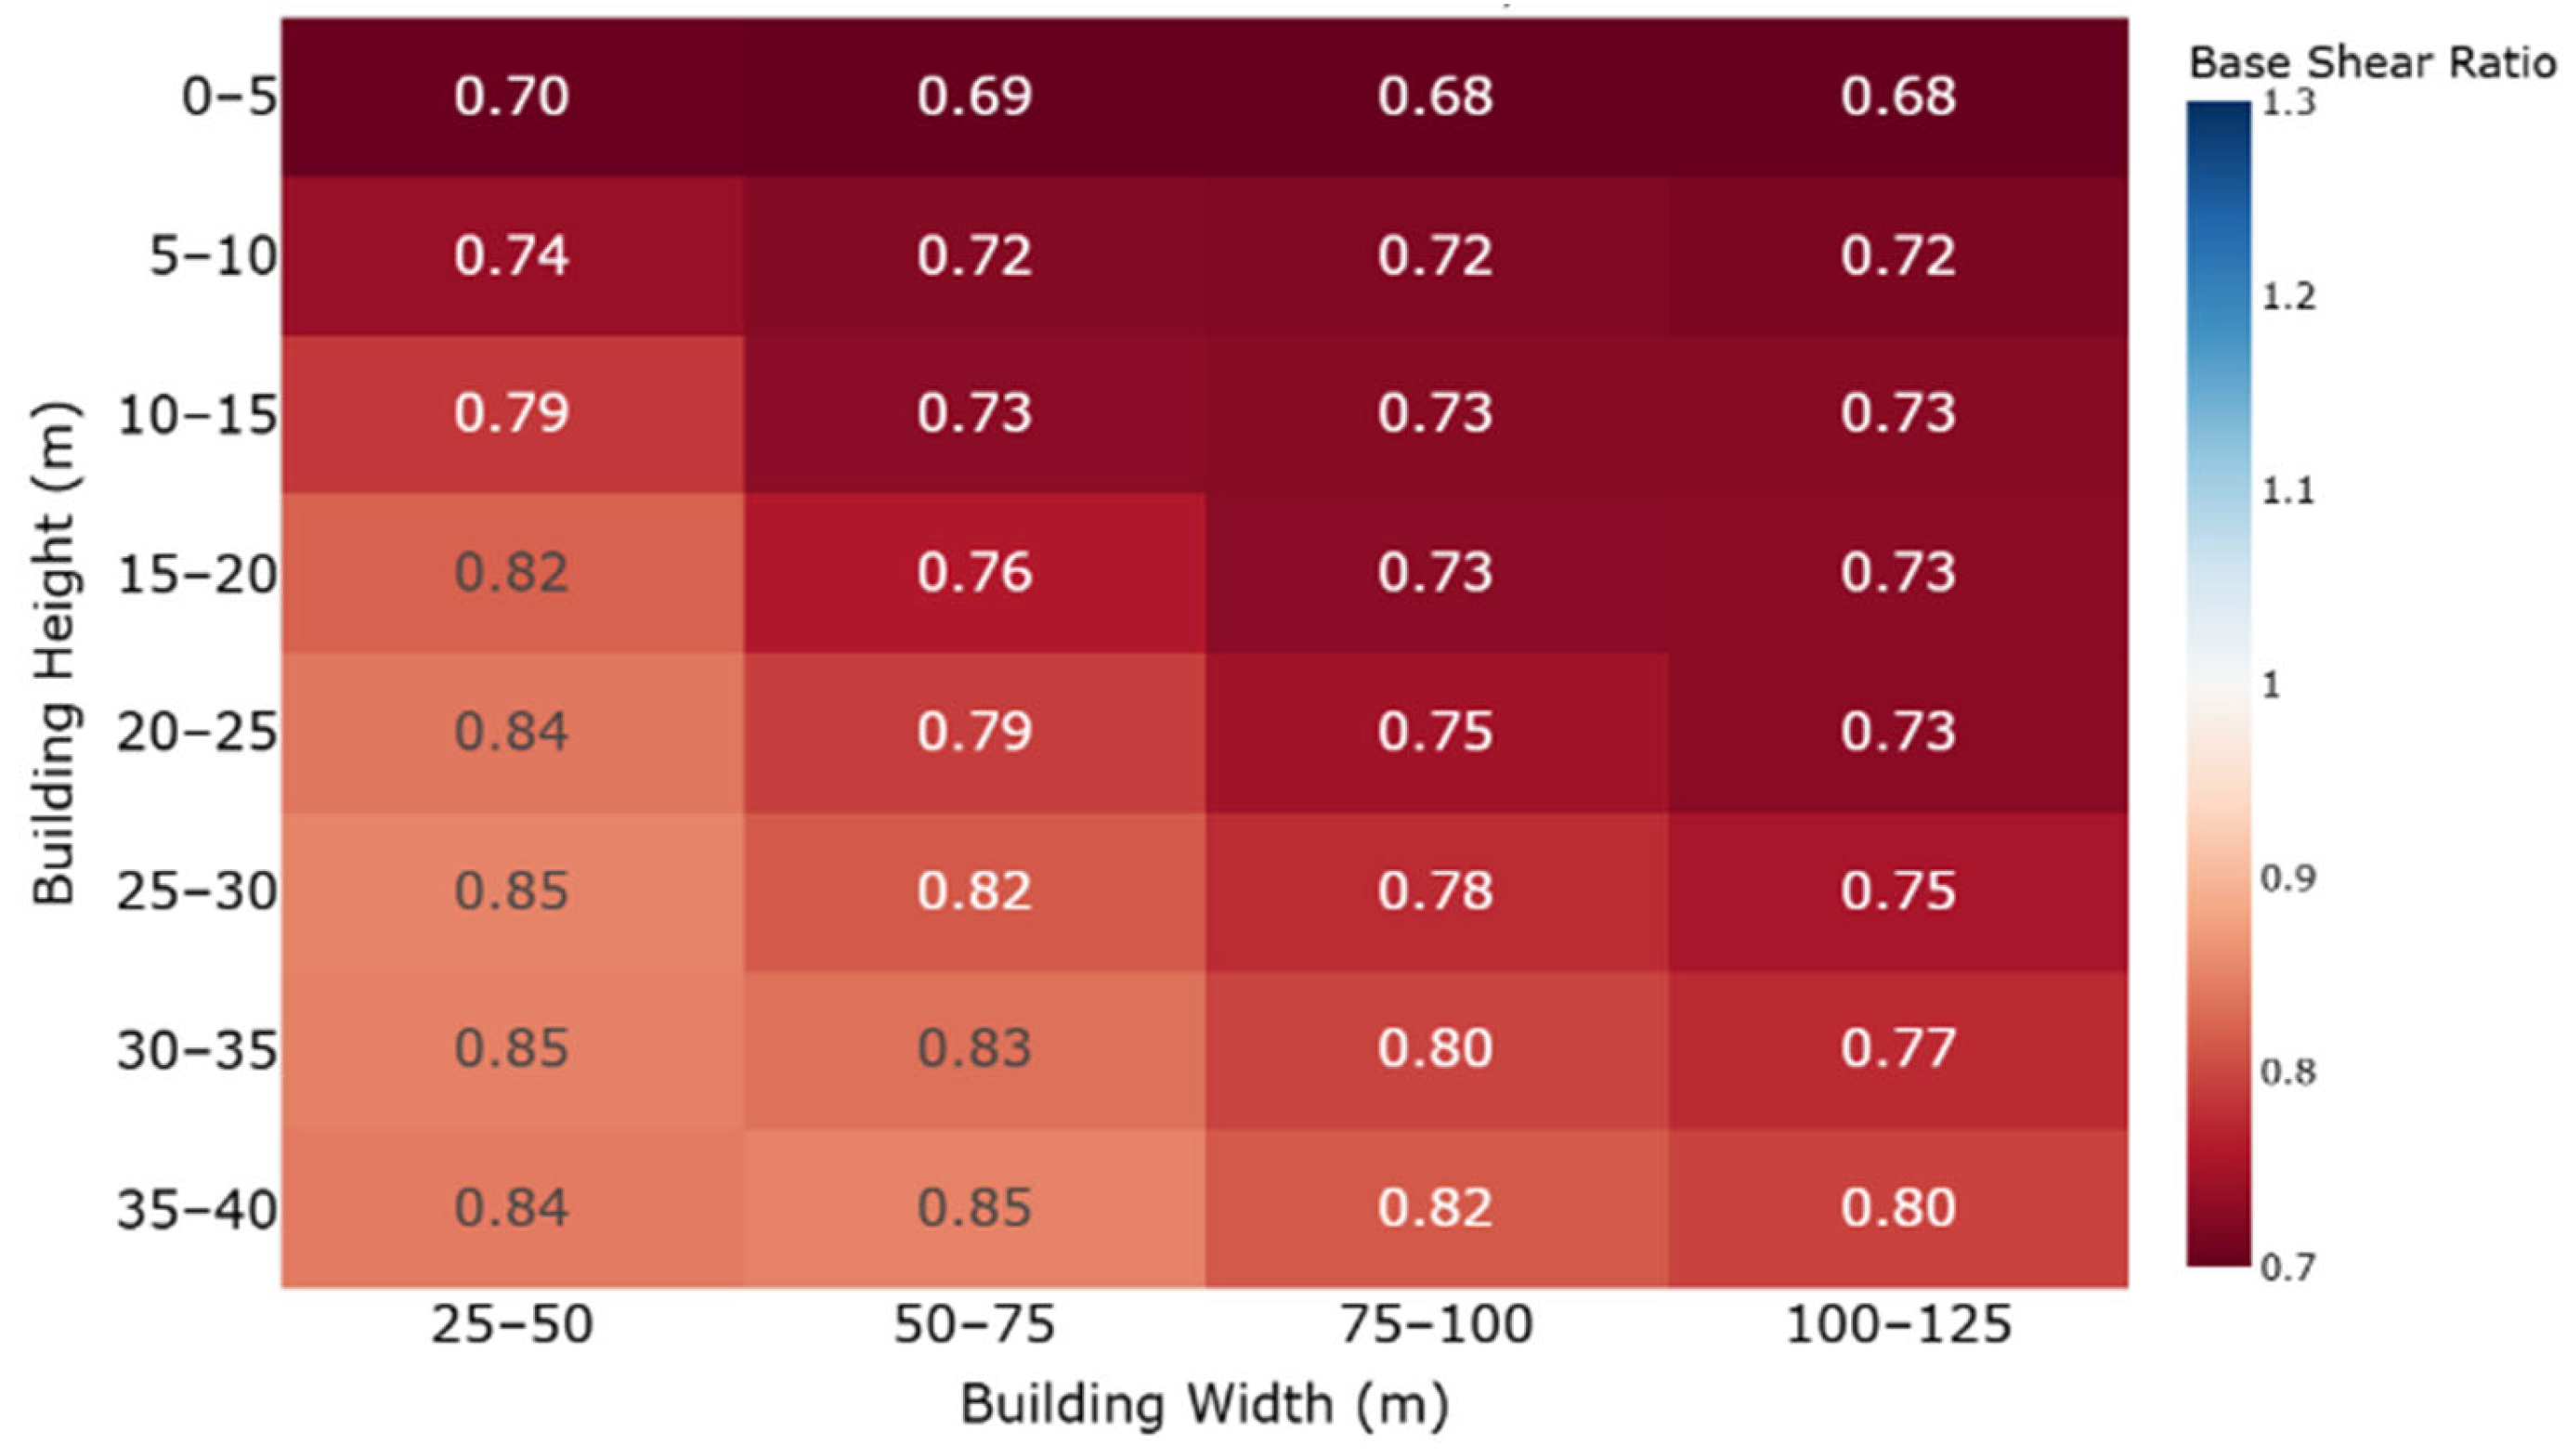
Unlike the distribution of values seen for the Dublin City site in Figure 13, Figure 15 shows no discontinuity in the 2nd GEN EN base shear values. This is due to the reduced extremity of the change in surface roughness length upstream of these rural sites. As a result, the comparative behavior between the codes remains relatively consistent for all the rural site locations investigated. Figure 16 shows the ratio of Irish NA to 2nd GEN EN base shear values for the same building geometries in Figure 15.
Figure 16 shows that the 2nd GEN EN tends to produce significantly higher base shear values than the Irish NA for all building geometries in country terrain. This is predominantly due to the higher 2nd GEN EN net pressure coefficients shown in Figure 4. The relative difference between the codes of practice is greatest for large low-rise buildings with the 2nd GEN EN producing values greater than the Irish NA by over 30%. These building geometries are typical of those of industrial use.
The higher 2nd GEN EN values are due to a combination of higher qp(z) and net pressure coefficient values (Figure 4). Despite lower values of 2nd GEN EN CsCd at these site locations, the differences in qp(z) and net pressure coefficient determine the comparative behavior between the two codes of practice.

7.3. Conceptual Implications of Discrete Terrain Transitions

A key difference is how upwind terrain transitions are treated: the Irish NA varies roughness continuously with upstream fetch using the Harris–Deaves model, while the 2nd GEN EN uses discrete categories with a threshold distance rule that creates abrupt step changes in qp(z) and derived actions across boundaries. Figure 10, Figure 11 and Figure 12 show sharp shifts in qp(z) ratios at specific distances, producing design discontinuities not present under the Irish NA. At city sites near smoother country or seaside fetch, the 2nd GEN EN can cause sudden reductions or increases in qp(z) and base shear at the threshold, with differences over 20% at representative heights.
Near thresholds, small changes in site placement, reference height, or fetch interpretation can flip the classification and alter design loads noticeably. This sensitivity grows because the threshold distance depends on reference height, so changes between options or stages can switch the applicable terrain category. In phased projects that span interfaces, actions may be inconsistent across plots unless a conservative envelope is used through the transition zone.
Two practical responses are advisable. First, include explicit terrain-transition sensitivity checks that bracket plausible categories and threshold distances, and report the governing envelope for qp(z), net/global coefficients, and base shear. Second, national guidance should clarify exposure assessment near thresholds (sector mapping, distance rules, and when to prefer Cpeg versus Cpe,10) and recommend conservative continuity rules for mixed exposures.

7.4. Historical Context and Comparison with First-Generation Transition

In the mid-2000s, calibration between the first-generation Eurocode and BS 6399-2 found departures from Irish practice of up to about 12% for typical forms, leading to the Irish NA advisory to retain BS 6399-2 for flat roof zones. By contrast, the present results show larger and more spatially variable shifts: qp(z) differences over 50% at 10 m in some urban cases (Table 2), net coefficient differences up to 35% (Figure 4), and base-shear differences of 30–45% for low-rise urban buildings near smoother terrain and over 30% for large low-rise rural buildings (Table 4; Figure 15 and Figure 16). These shifts reflect the revised qp(z) formulation, changes to exposure treatment, the introduction of Cpeg, and discrete terrain-transition rules that create context-sensitive discontinuities across boundaries. Because flat roof coefficients are now in a normative annex (no national choice), implementation should rely on targeted national guidance, including when Cpeg versus Cpe,10 should govern and how to assess exposure near terrain transitions.

7.5. Practical Structural Implications for Design

The identified increases in global wind actions translate into higher member demands and larger foundations under standard Eurocode checks; simple tension, bending, and bearing relations in EN 1993 [43] and EN 1997 [44] indicate the scaling.
For low-rise industrial buildings with base shear about 30% higher, lateral-resisting components scale nearly linearly with that increase. For tension-only bracing, a 30% force increase implies about a 30% increase in required gross area AA, all else equal. If design moments rise by 30%, the required section modulus rises by a similar amount, often needing one or more section upsizes or a higher grade. Higher forces also increase bolt/weld demands and end-plate thicknesses, leading to thicker plates and larger bolt groups.
For shallow foundations (EN 1997 [44] Annex D), wind overturning is captured via eccentricity and effective bearing area. If base shear and overturning increase by 30% with unchanged gravity, the minimum footing dimension in the moment direction increases by about 30%, implying a plan-area increase of roughly 30–70% depending on aspect ratio and eccentricity. Equivalently, qmax grows with eccentricity; options include increasing breadth/length, reducing eccentricity by redistributing gravity, or using strip/mat foundations to satisfy bearing and uplift.
Where urban sites downstream of smoother terrain show Irish NA to 2nd GEN EN base-shear ratios up to 1.30–1.45 (Table 4), expect similar proportional increases in bracing areas and section moduli, moderated by frame redundancy and axial participation. For columns under combined bending and compression, the EN 1993 [43] interaction reduces moment capacity as axial load grows; a 30–45% rise in lateral moments can imply a 10–30% rise in column tonnage depending on gravity-to-wind ratio and slenderness.
Conversely, for flat roofs the 2nd GEN EN coefficients are lower than BS 6399-2 in Zones F and G for typical parapet heights, allowing modest purlin reductions or increased spacing in edge zones; this gain is local and usually smaller than the global increases. For 1–10 m2 façade elements, logarithmic interpolation increases Cpe by about 4–6% for common panel sizes, implying similar increases in fixings and sub-framing when governed by façade actions.

8. Conclusions

In this paper, a detailed assessment of the impact of the proposed 2nd GEN EN on the global wind forces determined for buildings has been made through comparison with the existing code of practice in Ireland (the Irish NA). The analysis covered a range of building typologies and site locations representative of the modern Irish built environment, examining concrete and steel structures with various heights and plan geometries across city and country terrain. The global wind forces were determined for various building geometries and site conditions, enabling a comprehensive assessment of the proposed 2nd GEN EN procedures.
It was found that the proposed terrain roughness procedures in the 2nd GEN EN can result in both significantly higher and lower peak velocity pressure values compared to the existing Irish NA. Similarly, the updated values of CsCd in the 2nd GEN EN were found to be both lower and higher than the Irish NA by more than 5%, depending on the building geometry. This complexity is likewise seen in the structural factor calculations (CsCd), where differences between the codes hinge on building geometry and terrain categorization—urban, rural, and transitional sites respond differently according to each standard.
An impactful proposed change is that of the global pressure coefficients, which produce significantly higher values of net pressure coefficient than the Irish NA for all building geometries. For flat roofs, changes in procedures may lead to reduced external pressures, affecting the design of supporting elements in single-story and high-rise buildings. For façade elements between 1 m2 and 10 m2, the 2nd GEN EN introduces logarithmic interpolation for pressure coefficients, increasing design pressure values by approximately 5% compared to the Irish NA approach.
When total wind loads are considered, the 2nd GEN EN produces consistently greater base shear values for all building types in country terrain—over 30% for large, low-rise industrial buildings—due to higher net pressure and peak velocity values. In contrast, for urban sites, the differences are more nuanced: depending on building height, geometry, and site location, either larger or smaller wind loads may result, with low-rise buildings notably subject to higher loads at city sites adjacent to rural or seaside terrain. The impact of these changes results in significantly higher values of wind loading compared to the Irish NA for all building types in country terrain. For urban sites, significantly larger and smaller values of total wind loading can be determined using the 2nd GEN EN, depending on building geometry and site location.
The Eurocode framework anticipates national calibration where local wind climate, terrain and practice warrant adaptation, and many Member States operate living National Annexes and application guidance that are periodically updated as datasets and practice evolve. For Ireland, the National Annex should be treated as a continuously maintained instrument, with regular review cycles to incorporate new wind-climate information, improved exposure mapping, and feedback from design and construction, thereby ensuring consistent safety and constructability while avoiding unintended conservatism.
Within the bounds of permitted national choices, a well-developed National Annex should govern over more generic EN provisions for projects in Ireland, with explicit cross-referencing to the relevant national parameters; where clauses are fixed in normative annexes without national choice (e.g., flat roof coefficients), complementary national application guidance should be issued to preserve appropriate safety margins and clarify usage. This approach aligns Irish implementation with international practice across other European countries while maintaining harmonization at the Eurocode level.

9. Recommendations for the National Annex Drafting Committee and Irish Practitioners

The comparative evidence in this study shows that the draft 2nd GEN EN can produce either higher or lower wind actions than the Irish NA depending on terrain and geometry. Based on the results presented in this paper, the following prescriptive recommendations are proposed for the National Annex drafting committee and Irish practitioners:
  • Issue national guidance to smooth terrain-threshold discontinuities by prescribing exposure assessment and sensitivity bracketing across the xs rule, sector-based fetch mapping and a conservative continuity rule for mixed exposures.
  • Clarify when to use Cpeg versus Cpe,10 for global actions; for low rise, large plan industrial forms (aspect ratios < 1), verify with Cpe,10 where Cpeg proves more conservative (up to ~7% in these cases).
  • Either retain Cpe,10 for façade areas > 1 m2 as an acceptable method or set criteria for adopting logarithmic interpolation, noting typical ~5% higher panel pressures and procurement and fixings implications.
  • Provide guidance for urban sites influenced by smoother upwind sectors, noting > 20% qp(z) and 30–45% base shear differences at continuities; prioritize consistency across adjacent plots and phases.
  • Clarify whether to retain the 0.85 lower bound for chart-derived structural factors or permit the detailed method without it where large windward widths would otherwise be penalized.
  • For flat roof coefficients (normative annex), provide national advice on parapets, zone application, and verification to avoid unintended reductions in safety margins as practice moves away from BS 6399-2 [1].
  • Near terrain thresholds, run sensitivity checks with the 2nd GEN EN rule, bracket sector distances, and adopt the governing envelope for qp(z), net/global coefficients, and base shear.
  • For low-rise industrial buildings in rural terrain, budget for ~30% higher base shear and proportional increases in bracing, section moduli, and foundation dimensions.
  • On urban sites downstream of smoother terrain (e.g., Cork, Waterford, Limerick), anticipate 30–45% higher base shear for common 3–5-storey forms and plan corresponding upsizing unless rougher exposure can be robustly justified.
  • For 1–10 m2 façade elements, plan for logarithmic interpolation and allow ~5% higher design pressures for common 4–6 m2 panels.
  • For flat roofs with parapets, note that 2nd GEN EN coefficients are lower than BS 6399-2 [1]; verify any increases in purlin spacing or reductions in fastening against performance in Zones F and G.

Author Contributions

Conceptualization, R.M.; methodology, R.M. and D.C.; software, D.C.; validation, D.C. and J.K.; formal analysis, D.C.; investigation, D.C.; resources, J.K.; data curation, D.C.; writing—original draft preparation, D.C.; writing—review and editing, R.R., J.K. and R.M.; visualization, D.C.; supervision, R.M., J.K. and R.R.; project administration, J.K.; funding acquisition, J.K. All authors have read and agreed to the published version of the manuscript.

Funding

This research was funded by Construct Innovate, grant number CISFC1-24_002.

Institutional Review Board Statement

Not applicable.

Informed Consent Statement

Not applicable.

Data Availability Statement

The raw data supporting the conclusions of this article will be made available by the authors on request.

Conflicts of Interest

Author Rubina Ramponi and Reamonn MacReamoinn was employed by the company Arup Group (United Kingdom). The remaining authors declare that the research was conducted in the absence of any commercial or financial relationships that could be construed as a potential conflict of interest. The funders had no role in the design of the study; in the collection, analyses, or interpretation of data; in the writing of the manuscript; or in the decision to publish the results.

Abbreviations

The following abbreviations are used in this manuscript:
ENEuropean Norm
CFDComputational Fluid Dynamics
NBCCNational Building Code of Canada
ASCEAmerican Society of Civil Engineers
AIJArchitectural Institute of Japan
ISOInternational Standards Organization
AS/NZSAustralian/New Zealand Standards
NANational Annex (local adaptions of the Eurocode for Ireland)
BSBritish Standard
NAONorth Atlantic Oscillation
2nd GEN ENSecond generation Eurocode
CsCdStructural factor
qp(z)Peak velocity pressure at height z (kPa)
CpegGlobal external pressure coefficient (dimensionless)
Cpe,10External pressure coefficient for areas > 10 m2 (dimensionless)
Cpe,1External pressure coefficient for areas < 1 m2 (dimensionless)
CpiInternal pressure coefficient (dimensionless)
ZoSurface roughness length (m)
BPlan breadth (windward width)—(m)
LPlan length (perpendicular to B)—(m)
H/DAspect ratio
B/LPlan aspect ratio—dimensionless
ZHeight above ground where quantities are evaluated (m)
Vm(z)Mean wind speed at height z (m/s)
VbBasic wind speed (m/s)
Vb,0Reference basic wind speed (m/s)
CdirDirectional factor (dimensionless)
CseasonSeasonal factor (dimensionless)
CprobProbability factor (dimensionless)
Cr,(z)Roughness factor at height z (dimensionless)
Co(z)Orography factor at height z (dimensionless)
Iv(z)Turbulence intensity at height z (dimensionless)
k1Terrain/turbulence parameter (dimensionless)
KpPeak factor used in gust formulation (dimensionless
CsSize (lack-of-correlation) factor (dimensionless)
CdDynamic factor (dimensionless).
CsdStructural factor in 2nd GEN EN (dimensionless).
CsCdStructural factor (size × dynamic) in Irish NA (dimensionless).
AGross steel member area (brace)—mm2
h0Reference height parameter in xs expression (m).
xsThreshold fetch distance for terrain-change consideration (m).
x0Length parameter in xs expression (1000) (m).
ρAir density (taken as 1.25) (kg/m3).
qmaxMaximum bearing pressure under foundations (kPa).
caltAltitude factor (dimensionless).
cseasonSeasonal factor (dimensionless).
cprobProbability factor (dimensionless).
cdirDirectional factor (dimensionless).
Vb,mapValue of fundamental basic wind velocity (m/s).
vbBasic wind velocity (m/s).
qbBasic velocity pressure (kPa).
ce(z)Exposure factor at height z (dimensionless).
ce,T(z)Exposure correction factor for sites in town terrain at height z (dimensionless).
ArefReference area for wind force calculation (m2).
krTerrain factor (dimensionless).
z0Surface roughness length (m).
z0,IISurface roughness length for terrain category II terrain (m).
vp(z)Peak wind velocity at height z (m/s).
dDepth of the building plan measured parallel to the wind direction
bBreadth of the building plan measured perpendicular to the wind direction
eZone-extent parameter used to size the roof perimeter zones

Appendix A

This appendix lists the input definitions and equations used to compute the wind action quantities compared in the paper, covering wind climate, exposure, turbulence, peak velocity pressure, pressure coefficients, structural factors, and the derivation of base shear from pressures. Unless otherwise stated, the orography factor was taken as Co(z) = 1.0 in the absence of significant topographic amplification, and air density was taken as ρ = 1.25 kg/m3.
  • Irish NA
v b = c d i r c s e a s o n c p r o b c a l t v b , m a p
q b = 0.613 v b 2
q p z = c e z c e , T ( z ) q b
F o r c e = q p z c s c d A r e f c p e , n e t
  • 2nd GEN EN
v b = c p r o b c d i r c s e a s o n c a l t v b 0
c r z = k r ln z z 0
k r = 0.19 z 0 z 0 , I I 0.07
v m z = c r z c o z v b
I u z = 1 c 0 z ln z z 0
v p z = v m z 1 + 2.9 I u z
q p z = 1 2 ρ v p 2 ( z )
F o r c e = q p z c s d A r e f c p e g

References

  1. BS6399-2:1997; Loading for Buildings—Part 2: Code of Practice for Wind Loads. British Standard Institute: London, UK, 1997.
  2. Arup. Wind Loading Calibration Study; Arup: London, UK, 2009. [Google Scholar]
  3. Holmes, J.D. Wind Loading of Structures; CRC Press: Boca Raton, FL, USA, 2015. [Google Scholar]
  4. Davenport, A.G. The application of statistical concepts to the wind loading of structures. Proc. Inst. Civ. Eng. 1961, 19, 449–472. [Google Scholar] [CrossRef]
  5. Simiu, E.; Yeo, D. Wind Effects on Structures: Modern Structural Design for Wind; John Wiley and Sons: Hoboken, NJ, USA, 2019. [Google Scholar]
  6. Kareem, A.; Zhou, Y. Gust loading factor—Past, present and future. J. Wind Eng. Ind. Aerodyn. 2003, 91, 1301–1328. [Google Scholar] [CrossRef]
  7. Zhou, Y.; Kareem, A. Gust loading factor: New model. J. Struct. Eng. 2001, 127, 168–175. [Google Scholar] [CrossRef]
  8. Yang, Q.; Chen, B.; Wu, Y.; Tamura, Y. Wind-induced response and equivalent static wind load of long-span roof structures by combined Ritz-proper orthogonal decomposition method. J. Struct. Eng. 2013, 139, 997–1008. [Google Scholar] [CrossRef]
  9. Pierre, L.S.; Kopp, G.; Surry, D.; Ho, T. The UWO contribution to the NIST aerodynamic database for wind loads on low buildings: Part 2. Comparison of data with wind load provisions. J. Wind Eng. Ind. Aerodyn. 2005, 93, 31–59. [Google Scholar] [CrossRef]
  10. Stathopoulos, T.; Alrawashdeh, H. Wind loads on buildings: A code of practice perspective. J. Wind Eng. Ind. Aerodyn. 2020, 206, 104338. [Google Scholar] [CrossRef]
  11. Uematsu, Y.; Isyumov, N. Wind pressures acting on low-rise buildings. J. Wind Eng. Ind. Aerodyn. 1999, 82, 1–25. [Google Scholar] [CrossRef]
  12. Chen, F.; Zhu, Y.; Wang, W.; Shu, Z.; Li, Y. A review on aerodynamic characteristics and wind-induced response of flexible support photovoltaic system. Atmosphere 2023, 14, 731. [Google Scholar] [CrossRef]
  13. Tamura, Y.; Kareem, A.; Solari, G.; Kwok, K.; Holmes, J.D.; Melbourne, W.H. Aspects of the dynamic wind-induced response of structures and codification. Wind Struct. 2005, 8, 251–268. [Google Scholar] [CrossRef]
  14. Cook, N.J. The Deaves and Harris ABL model applied to heterogeneous terrain. J. Wind Eng. Ind. Aerodyn. 1997, 66, 197–214. [Google Scholar] [CrossRef]
  15. Khanduri, A.; Stathopoulos, T.; Bédard, C. Wind-induced interference effects on buildings—A review of the state-of-the-art. Eng. Struct. 1998, 20, 617–630. [Google Scholar] [CrossRef]
  16. Caracoglia, L.; Crisman, D.; Noè, S. Wind Pressure and Load Analysis on Large Building Roofs: Applicability of Database-Assisted Design to Eurocode 1 and Italian Standards. J. Struct. Eng. 2025, 151, 04025193. [Google Scholar] [CrossRef]
  17. Zheng, X.; Montazeri, H.; Blocken, B. CFD simulations of wind flow and mean surface pressure for buildings with balconies: Comparison of RANS and LES. Build. Environ. 2020, 173, 106747. [Google Scholar] [CrossRef]
  18. Fernández-Cabán, P.L.; Masters, F.J.; Phillips, B.M. Predicting roof pressures on a low-rise structure from freestream turbulence using artificial neural networks. Front. Built Environ. 2018, 4, 68. [Google Scholar] [CrossRef]
  19. Guo, Y.; Wu, C.-H.; Kopp, G.A. A method to estimate peak pressures on low-rise building models based on quasi-steady theory and partial turbulence analysis. J. Wind Eng. Ind. Aerodyn. 2021, 218, 104785. [Google Scholar] [CrossRef]
  20. ASCE/SEI 7-22; Minimum Design Loads and Associated Criteria for Buildings and Other Structures. American Society of Civil Engineers: Reston, VA, USA, 2022.
  21. PrEN 1991-1-4; Second Generation Eurocode Draft: Eurocode 1: Actions on Structures—Part 1–4: General Actions—Wind Actions. CEN: Brussels, Belgium, 2025.
  22. National Research Council of Canada. National Building Code of Canada 2020; NRC: Ottawa, ON, Canada, 2020. [Google Scholar]
  23. Architectural Institute of Japan. Recommendations for Loads on Buildings; AIJ: Tokyo, Japan, 2015. [Google Scholar]
  24. AS/NZS 1170.2:2021, Amd 1:2023; Structural Design Actions—Part 2: Wind Actions. Standards Australia: Sydney, Australia; Standards New Zealand: Wellington, New Zealand, 2021.
  25. Zhou, Y.; Kijewski, T.; Kareem, A. Along-wind load effects on tall buildings: Comparative study of major international codes and standards. J. Struct. Eng. 2002, 128, 788–796. [Google Scholar] [CrossRef]
  26. Jayasundara, H.; Koliyabandara, S.; Wijesundara, K. Wind loads on tall buildings: A comparative study of the international wind codes and numerical simulation. Eng. J. Inst. Eng. Sri Lanka 2018, 51, 31–45. [Google Scholar] [CrossRef]
  27. Weerasuriya, A.; Jayasinghe, M. Wind loads on high-rise buildings by using five major international wind codes and standards. Eng. J. Inst. Eng. Sri Lanka 2014, 47, 13–25. [Google Scholar] [CrossRef]
  28. Lee, S.; Kim, S.; Kwon, S.-D. A Comparative Study of Wind Tunnel Tests and Design Codes in Evaluation of Along-Wind Effects on Towers. Shock Vib. 2021, 2021, 8818057. [Google Scholar] [CrossRef]
  29. Moore, N.; Keenahan, J. Wind Forces on Medium-Span Bridges: A Comparison of Eurocode 1 Part 4 and Computational Fluid Dynamics. CivilEng 2022, 3, 794–808. (In English) [Google Scholar] [CrossRef]
  30. Outten, S.; Sobolowski, S. Extreme wind projections over Europe from the Euro-CORDEX regional climate models. Weather Clim. Extrem. 2021, 33, 100363. [Google Scholar] [CrossRef]
  31. Donat, M.; Leckebusch, G.; Wild, S.; Ulbrich, U. Future changes in European winter storm losses and extreme wind speeds inferred from GCM and RCM multi-model simulations. Nat. Hazards Earth Syst. Sci. 2011, 11, 1351–1370. [Google Scholar] [CrossRef]
  32. Haylock, M. European extra-tropical storm damage risk from a multi-model ensemble of dynamically-downscaled global climate models. Nat. Hazards Earth Syst. Sci. 2011, 11, 2847–2857. [Google Scholar] [CrossRef]
  33. Outten, S.; Esau, I. Extreme winds over Europe in the ENSEMBLES regional climate models. Atmos. Chem. Phys. 2013, 13, 5163–5172. [Google Scholar] [CrossRef]
  34. Nolan, P.; Lynch, P.; McGrath, R.; Semmler, T.; Wang, S. Simulating climate change and its effects on the wind energy resource of Ireland. Wind Energy 2012, 15, 593–608. [Google Scholar] [CrossRef]
  35. Pinto, J.G.; Raible, C.C. Past and recent changes in the North Atlantic oscillation. Wiley Interdiscip. Rev. Clim. Change 2012, 3, 79–90. [Google Scholar] [CrossRef]
  36. Irish National Annex to EN1991-1-4; NSAI: Dublin, Ireland, 2010.
  37. EN 1991-1-4:2005; Eurocode 1: Actions on Structures—Part 1–4: General Actions—Wind Actions. CEN: Brussels, Belgium, 2005.
  38. Department of Housing. Building Regulations 2014—Technical Guidance Document K—Stairways, Ladders, Ramps and Guards; Department of Housing, Local Government and Heritage: Dublin, Ireland, 2014. [Google Scholar]
  39. Dyrbye, C.; Hansen, S.O. Static Wind Load. In Wind Loads on Structures; European Union—The CEN: Brussels, Belgium, 1996; Chapter 4; pp. 49–73. [Google Scholar]
  40. Davenport, A.G. Note on the distribution of the largest value of a random function with application to gust loading. Proc. Inst. Civ. Eng. 1964, 28, 187–196. [Google Scholar] [CrossRef]
  41. PD6688-1-4:2015; Background Information to the National Annex to BS EN 1991-1-4 and Additional Guidance. British Standard Institute: London, UK, 2015.
  42. Harris, R. The structure of strong winds. In Proceedings of the CIRIA Conference on Wind Engineering in the Eighties, Edinburgh, UK, 12–13 November 1981. [Google Scholar]
  43. EN 1993-1-1:2022; Eurocode 3: Design of Steel Structures—Part 1-1: General Rules and Rules for Buildings. European Committee for Standardization (CEN): Brussels, Belgium, 2022.
  44. EN 1997-1:2024; Eurocode 7: Geotechnical Design—Part 1: General Rules. European Committee for Standardization (CEN): Brussels, Belgium, 2024.
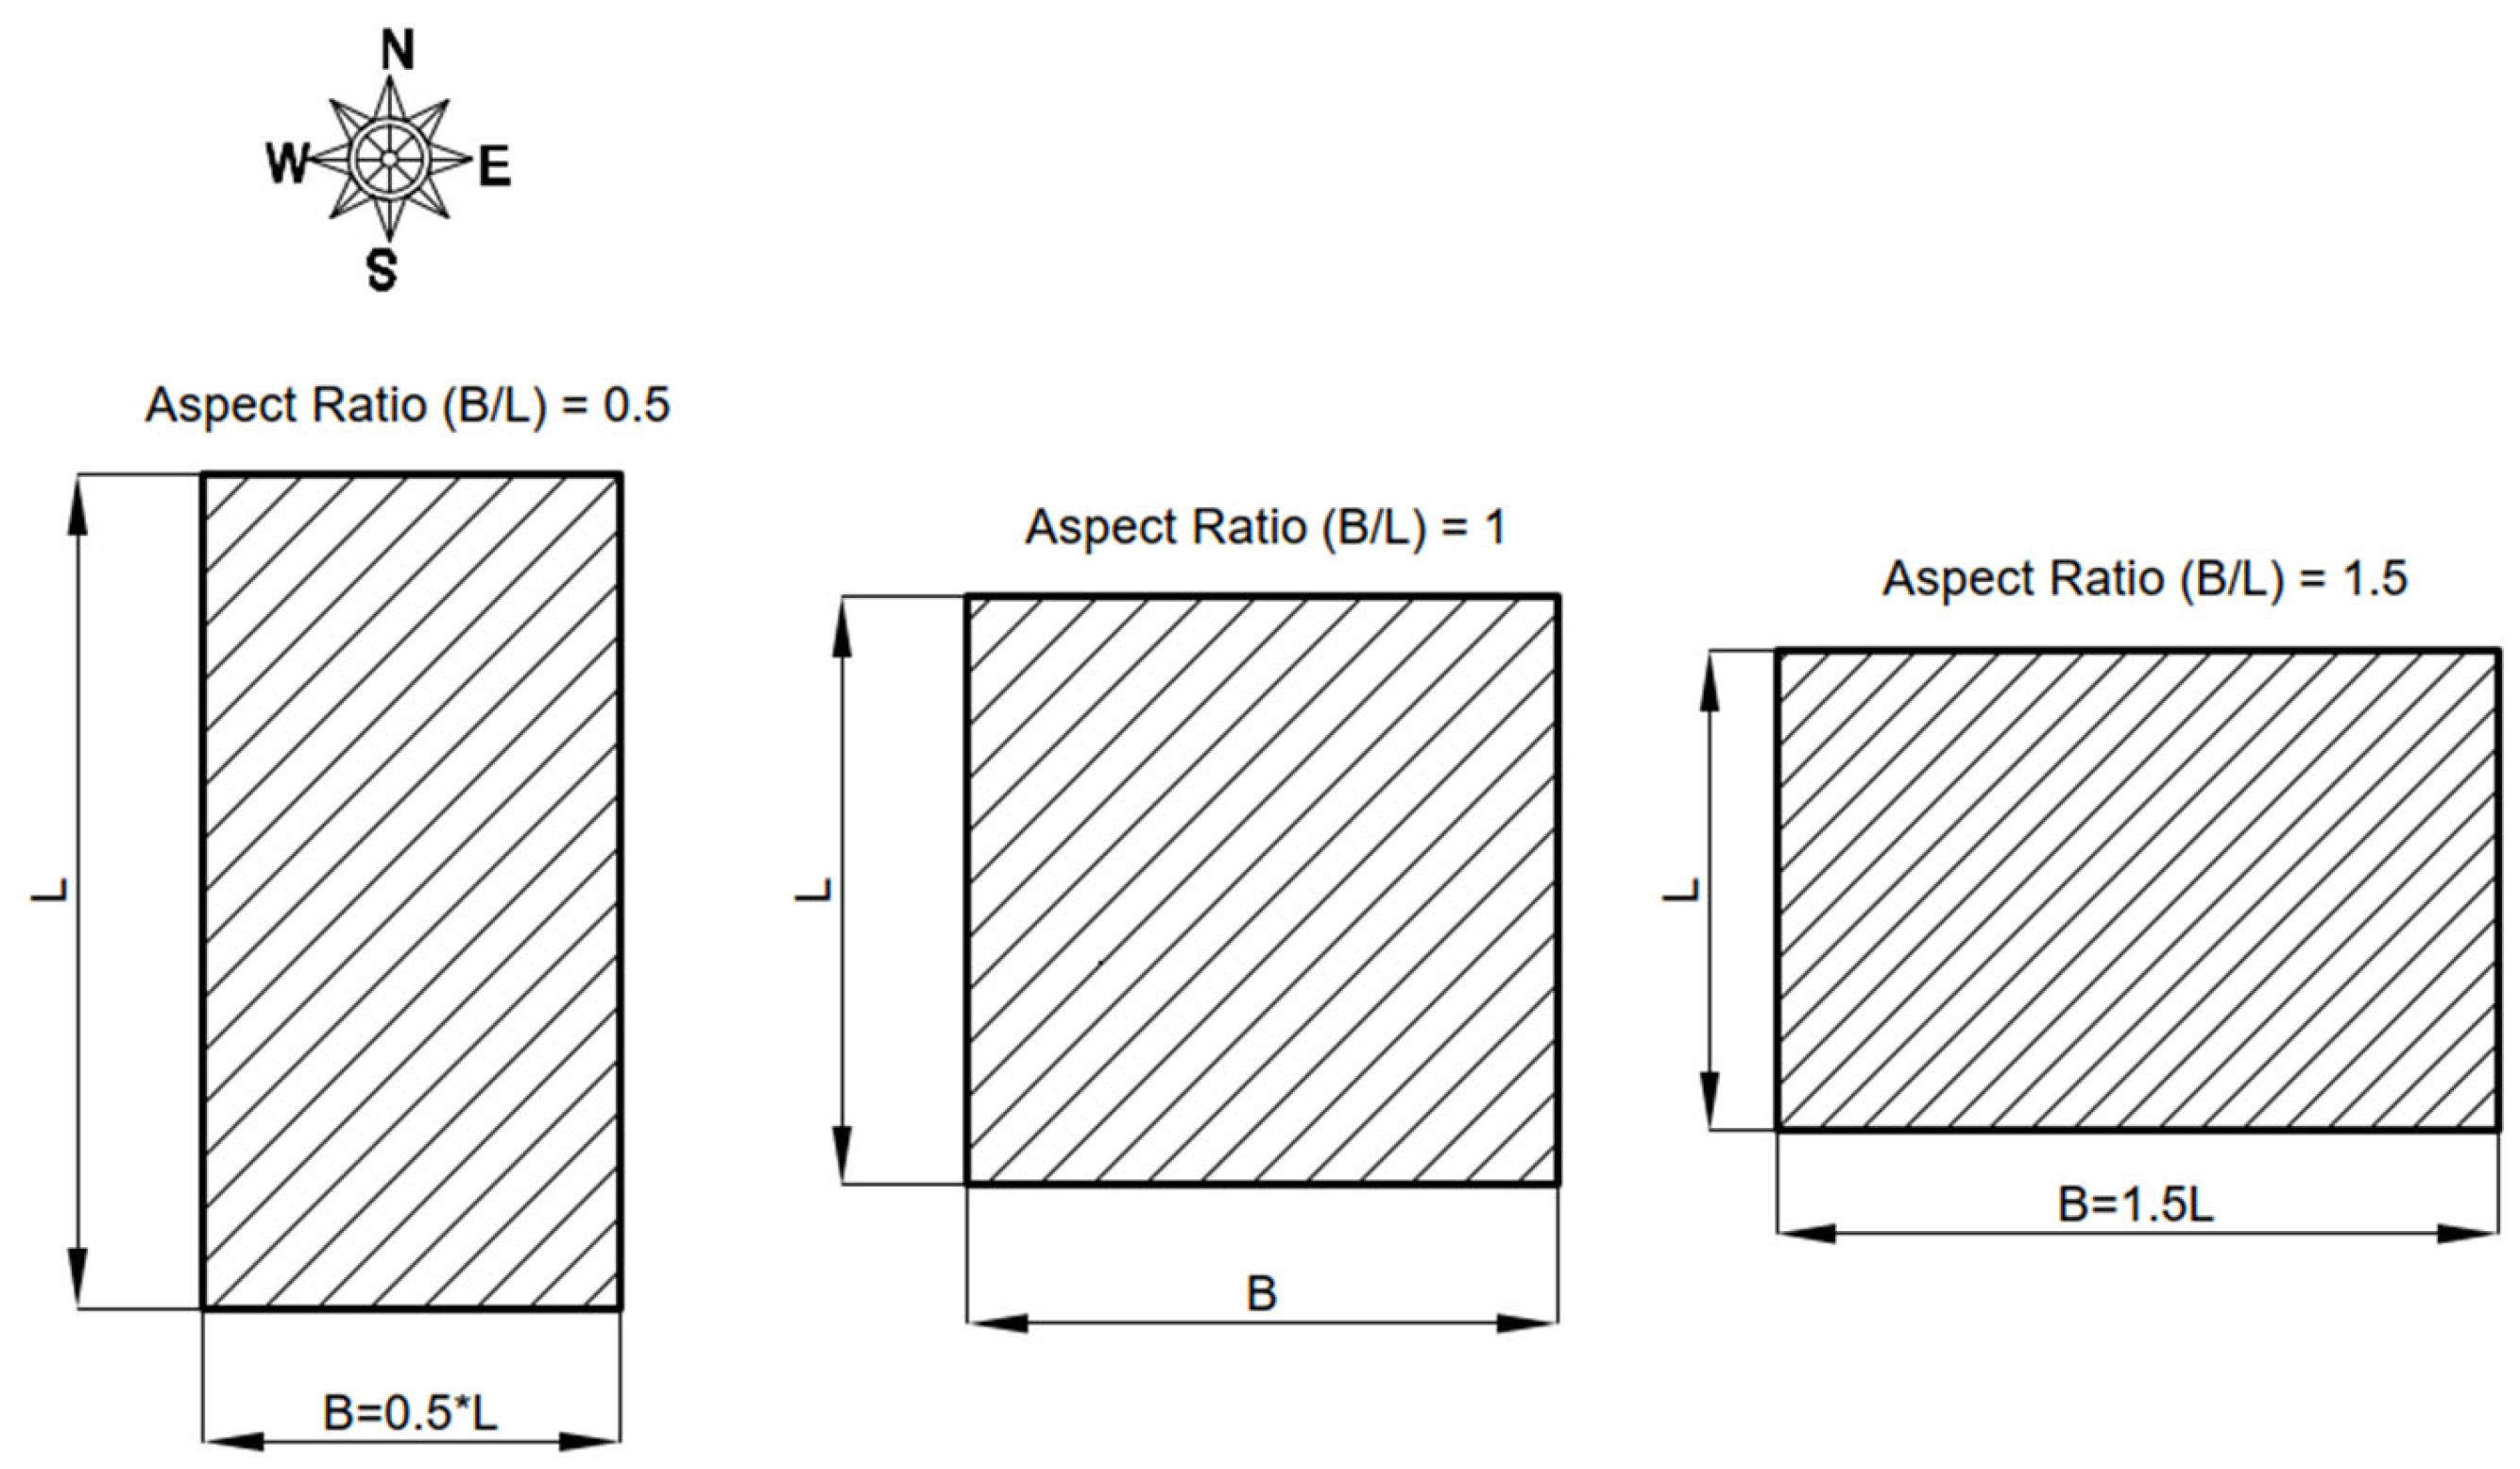
Figure 1. Buildings of equal plan area and varying aspect ratio.
Wind 05 00026 g001
Figure 2. Comparison of the CsCd ratio for a concrete building with varying building height and width located in an urban context in Dublin.
Wind 05 00026 g002
Figure 3. Comparison of the CsCd ratio for a concrete building with varying building height and width located in a rural context near Dublin.
Wind 05 00026 g003
Figure 4. Comparison of net pressure coefficient values: (a) Variation in net pressure coefficients (Cpe,net) with H/D for each code of practice; (b) Comparison of net pressure coefficient values (Cpe,net) values to those of the 2nd GEN EN.
Wind 05 00026 g004
Figure 5. Comparison of flat roof pressure coefficients (Cpe) between codes for roofs with a 1.1 m high parapet (a) Zone F; (b) Zone G. Axes denote building height bins (H) and windward width bins (B); values are evaluated at bin mid-points on a regular grid, and lines between bins are not implied—points represent discrete evaluated combinations.
Wind 05 00026 g005
Figure 6. Zones with different pressure coefficient values on a flat roof (e = min(b,2h) which is the characteristic length, where b is the cross-wind plan dimension for the wind direction under consideration and h is the building height to the roof. F, G H and I denote the different zones of the building) [37].
Wind 05 00026 g006
Figure 7. Comparison of façade element pressure coefficients (Cpe) for varying façade areas in Zone A, (a) Distribution of Cpe values with area for each code of practice and (b) Ratio of Irish NA to 2nd GEN EN Cpe values.
Wind 05 00026 g007
Figure 8. Peak velocity pressure profiles for a site in County Dublin exposed to Easterly wind, (a) Variation of qp(z) values with height for each code and (b) Ratio of qp(z) values of existing codes to the 2nd GEN EN.
Wind 05 00026 g008
Figure 9. Peak velocity pressure profiles for a site in Dublin City exposed to Easterly wind, (a) Variation of qp(z) values with height for each code and (b) Ratio of qp(z) values of existing codes to the 2nd GEN EN.
Wind 05 00026 g009
Figure 10. Ratio of Irish NA to 2nd GEN EN qp(z) values for sea-to-country terrain transitions at sites located at various distances to the shoreline.
Wind 05 00026 g010
Figure 11. Effect of changes in upstream surface roughness on qp(z) for sites of terrain category III with smoother upstream terrain of terrain category II, demonstrating country-to-city terrain transitions at a height of 20 m. Points denote discrete evaluated parameter combinations; markers share color/shape within a series and are intentionally not connected to avoid implying interpolation between unsampled settings.
Wind 05 00026 g011
Figure 12. qp(z) ratios for city sites at various distances to country terrain, at a reference height of 20 m.
Wind 05 00026 g012
Figure 13. Base shear values for square-plan concrete buildings in Dublin City experiencing an easterly wind. Points denote discrete evaluated parameter combinations; markers share color/shape within a series and are intentionally not connected to avoid implying interpolation between unsampled settings.
Wind 05 00026 g013
Figure 14. Comparison of base shear values calculated using the NA and 2nd GEN EN for concrete buildings in Dublin city.
Wind 05 00026 g014
Figure 15. Comparison of base shear values calculated using the Irish NA and 2nd GEN EN for a braced steel frame building at a rural site in Dublin, exposed to easterly winds. Points denote discrete evaluated parameter combinations; markers share color/shape within a series and are intentionally not connected to avoid implying interpolation between unsampled settings.
Wind 05 00026 g015
Figure 16. Irish NA to 2nd GEN EN base shear values for a braced steel frame at a rural site in Dublin.
Wind 05 00026 g016
Table 1. Details of site locations.
LocationSiteCritical Wind DirectionDistance to Shoreline (km)Distance to Town Edge (km)Site Terrain CategorySmoother Upstream Terrain Category
CorkCityWest1300.243
WaterfordCityEast94540
DublinCityEast4.54.540
LimerickCityWest700.443
GalwayCitySouth1.71.730
CorkCountrySouth45 10
WaterfordCountrySouth9 10
DublinCountryEast6.8 10
LimerickCountryWest70 21
GalwayCountryEast150 21
Table 2. qp(z) ratios (Irish NA/2nd GEN EN) for buildings of varying height at city sites.
SiteMax. RatioMin. RatioRatios > 1Ratios < 1
% of DomainMean% of DomainMean
Cork1.561.081001.220
Waterford1.631.00971.2030.99
Dublin1.470.92741.42260.94
Limerick1.561.041001.220
Galway1.300.92611.22390.94
Table 3. qp(z) ratios (Irish NA/2nd GEN EN) for sites in town terrain located at varying distances to smoother country and sea terrain.
Height
(m)
Max. RatioMin. RatioRatios > 1Ratios < 1
% of DomainMean% of DomainMean
101.40.95821.13180.97
201.370.97841.13160.98
401.270.97821.10180.98
801.170.96751.04250.97
Table 4. Base shear ratios (Irish NA/2nd GEN EN) for concrete buildings of varying geometry at city sites.
SiteMax. RatioMin. RatioRatios > 1Ratios < 1
% of DomainMean% of DomainMean
Cork1.380.92621.05380.98
Waterford1.450.81111.25890.91
Dublin1.300.84681.19320.93
Limerick1.270.93791.04210.98
Galway1.170.81211.09790.87
Disclaimer/Publisher’s Note: The statements, opinions and data contained in all publications are solely those of the individual author(s) and contributor(s) and not of MDPI and/or the editor(s). MDPI and/or the editor(s) disclaim responsibility for any injury to people or property resulting from any ideas, methods, instructions or products referred to in the content.