Abstract
Bridges, as critical transportation infrastructure, are highly vulnerable to aerodynamic forces, particularly vortex-induced vibrations (VIV), which severely compromise their structural integrity and operational safety. These low-frequency, high-amplitude vibrations are a primary challenge to serviceability and fatigue life. Ensuring the resilience of these structures demands advanced understanding and robust mitigation strategies. This paper comprehensively addresses the multifaceted challenges of bridge aerodynamics, presenting an in-depth analysis of contemporary testing methodologies and innovative solutions. We critically examine traditional wind tunnel modeling, elucidating its advantages and inherent limitations, such as scale effects, Reynolds number dependence, and boundary interference, which can lead to inaccurate predictions of aerodynamic forces and vibration amplitudes. This scale discrepancy is critical, as demonstrated by peak pressure coefficients being underestimated by up to 64% in smaller-scale wind tunnel environments compared to high-Reynolds-number open-jet testing. To overcome these challenges, the paper details the efficacy of open-jet testing at facilities like the Windstorm Impact, Science, and Engineering (WISE) Laboratory, demonstrating its superior capability in replicating realistic atmospheric boundary layer flow conditions and enabling larger-scale, high-Reynolds-number testing for more accurate insights into bridge behavior under dynamic wind loads. Furthermore, we explore the design principles and applications of various aerodynamic mitigation devices, including handrails, windshields, guide vanes, and spoilers, which are essential for altering airflow patterns and suppressing vortex-induced vibrations. The paper critically investigates the innovative integration of green energy solutions, specifically solar panels, with bridge structures. This study presents the application of solar panel arrangements to provide both renewable energy production and verifiable aerodynamic mitigation. This strategic incorporation is shown not only to harness renewable energy but also to actively improve aerodynamic performance and mitigate wind-induced vibrations, thereby fostering both bridge safety and sustainable infrastructure development. Unlike previous studies focusing primarily on wind loads on PV arrays, this work demonstrates how the specific geometric integration of solar panels can serve as an active aerodynamic mitigation device for bridge decks. This dual functionality—harnessing renewable energy while simultaneously serving as a passive geometric countermeasure to vortex-induced vibrations—marks a novel advancement over single-purpose mitigation technologies. Through this interdisciplinary approach, the paper seeks to advance bridge engineering towards more resilient, efficient, and environmentally responsible solutions.
1. Introduction
Bridges are critical in modern infrastructure, facilitating transportation and connecting communities [1]. However, they are subject to various environmental forces, including wind, which can induce complex aerodynamic phenomena, leading to structural vibrations and fatigue [2]. Understanding and mitigating these effects are paramount to ensuring bridges’ safety, durability, and performance.
In this comprehensive examination, we delve into the intricate realm of bridge aerodynamics, focusing on critical aspects such as wind tunnel modeling, aerodynamic mitigation devices, open-jet testing, and integrating aerodynamic mitigation with green energy solutions. We aim to elucidate the challenges and opportunities inherent in mitigating aerodynamic effects on bridges through meticulous analysis and empirical studies.
Firstly, we explore the advantages and limitations of wind tunnel modeling in bridge aerodynamics. Wind tunnels offer controlled environments for simulating wind-induced forces on bridge structures, allowing engineers to assess aerodynamic performance and refine design parameters [3]. However, scale effects and boundary interference pose significant challenges, necessitating careful interpretation of results and consideration of alternative testing methodologies [4,5,6,7]. Subsequently, we delve into aerodynamic mitigation devices, crucial in reducing vortex-induced vibrations and enhancing bridge safety. Devices such as handrails, windshields, guide vanes, spoilers, and fairings can act as aerodynamic mitigation devices [8,9,10,11,12,13,14]. Section 3 provides a detailed review of aerodynamic mitigation devices.
Next, we focus on open-jet testing, a specialized approach for simulating atmospheric boundary layer flow and studying bridge aerodynamics in realistic conditions. By analyzing the validation of flow properties and model placement in open-jet facilities, we gain insights into the advantages of large-scale testing and its implications for understanding bridge behavior under dynamic wind conditions. Finally, we explore the emerging trend of integrating aerodynamic mitigation with green energy solutions, such as installing solar panels on long-span bridges. While previous studies have analyzed wind loading on PV arrays or utilized small wind turbines for energy generation, this work focuses on utilizing PV panel arrangements as a passive aerodynamic mitigation device that simultaneously generates energy. This innovative approach enhances bridge safety and contributes to sustainable infrastructure development by harnessing renewable energy sources. Specifically, the strategic utilization of PV geometry to actively re-profile pressure distributions and induce favorable flow re-attachment distinguishes this approach from prior studies focused merely on the structural loading of PV systems. By integrating solar panel arrangements, we seek to balance energy production and aerodynamic performance, paving the way for resilient and eco-friendly bridge infrastructure.
2. Wind Tunnel Modeling in Aerodynamics: Advantages and Limitations
Traditionally, most analyses of deck performance have been conducted in wind tunnels [15]. The AASHTO LRFD Bridge Design Specifications state that wind tunnel testing is an appropriate tool for designing long-span bridges [16]. These tunnels can be closed-circuit or open-circuit. Wind tunnel tests are typically done on scaled models of the desired bridge. Scaling factors usually range from 1:50 to 1:200 [15]. Over the years, multiple researchers have provided insight into the drawbacks of wind tunnel testing for bridge decks. One study found that the small scales used in wind tunnel tests made it difficult to accurately model mitigation devices like guide vanes, as they became too small to correctly model, relative to the bridge [17]. Wind tunnel tests are usually performed at lower Reynolds numbers because high velocities are needed in the tunnel to scale the Reynolds number to match full-scale conditions correctly. A comparative study was performed on a streamlined single box girder at 1:50 scale in a wind tunnel and at full scale using CFD. The results showed that under small-scale conditions, aerodynamic forces are more sensitive to Reynolds number changes, leading to inaccurate estimations of vibration amplitude [18].
However, another type of wind testing called open-jet testing can alleviate some of the issues inherent in typical wind tunnel testing. This is particularly crucial for bridge decks, where open-jet testing enabled the use of a 1:20 scale model to achieve a Reynolds number of 1 million, thus enhancing the fidelity of simulated turbulent flow interactions. Open-jet facilities allow for larger-scale testing than typically possible in other types of wind tunnels. Because of the larger flow domain, interference from wall boundaries does not affect the size of the vortices produced in the flow. One study in an open-jet facility at Louisiana State University compared small-scale wind tunnel tests of low-rise buildings to a larger-scale open-jet test. The results showed that in the smaller-scale tests, the vortices were not allowed to reach peak size due to the constriction of the tunnel, resulting in an underestimation of peak pressure values [19]. Furthermore, another study on high-rise building cladding pressures, produced in the same open-jet facility, corroborated the previous study’s findings. The results showed that higher pressures were achieved using larger-scale open-jet testing than typical wind tunnel testing [20].
In conjunction with wind tunnel and open-jet testing, computational fluid dynamics (CFD) is also used to analyze aerodynamic loads. Fundamentally, CFD uses the Navier–Stokes equations to solve for velocity and pressure at desired points within the flow. CFD analysis also provides solutions to the issues with wind tunnel tests. It allows for larger-scale testing, which enables Reynolds numbers to be maintained, and it allows for data collection at all points on the deck section with no intrusion of sensors. One drawback of CFD analysis is computational cost. Depending on the quality of the mesh used in the model and the method used to solve it, computational cost can be significant [15]. Typically, wind tunnel testing is used in combination with CFD analysis in order to validate the results [13]
All aerodynamic analyses aim to produce Reynolds numbers that match those measured at full scale. The scaling of the Reynolds number is significant because the prediction of different fluid flow attributes depends on its size. Under-estimation or over-estimation could lead to inaccurate results. Notably, in the case of most scaled analyses, the Reynolds number is underestimated [21]. A few modifications can be made to the wind tunnel to increase the Reynolds number and match the high Reynolds numbers measured in the field. These modifications include increasing the flow velocity, the characteristic length of flow, pressurizing the wind tunnel, and lowering the wind tunnel temperature [22].
The Reynolds number Re is a dimensionless number defined by the relationship between inertial and viscous forces in a fluid. When viscous forces dominate, the flow is considered laminar; when inertial forces dominate, the flow is turbulent. The relationship is expressed symbolically as [21]:
In the preceding equation, is fluid density, V is flow velocity, L is the length scale of flow, and μ is dynamic viscosity [21]. It is crucial to develop the correct Reynolds number for the type of flow being modeled. Internal flows are laminar for Reynolds numbers up to 2300 and turbulent for Reynolds numbers larger than 4000. In contrast, external flows are turbulent at Reynolds numbers greater than 3 × 10⁵ [23].
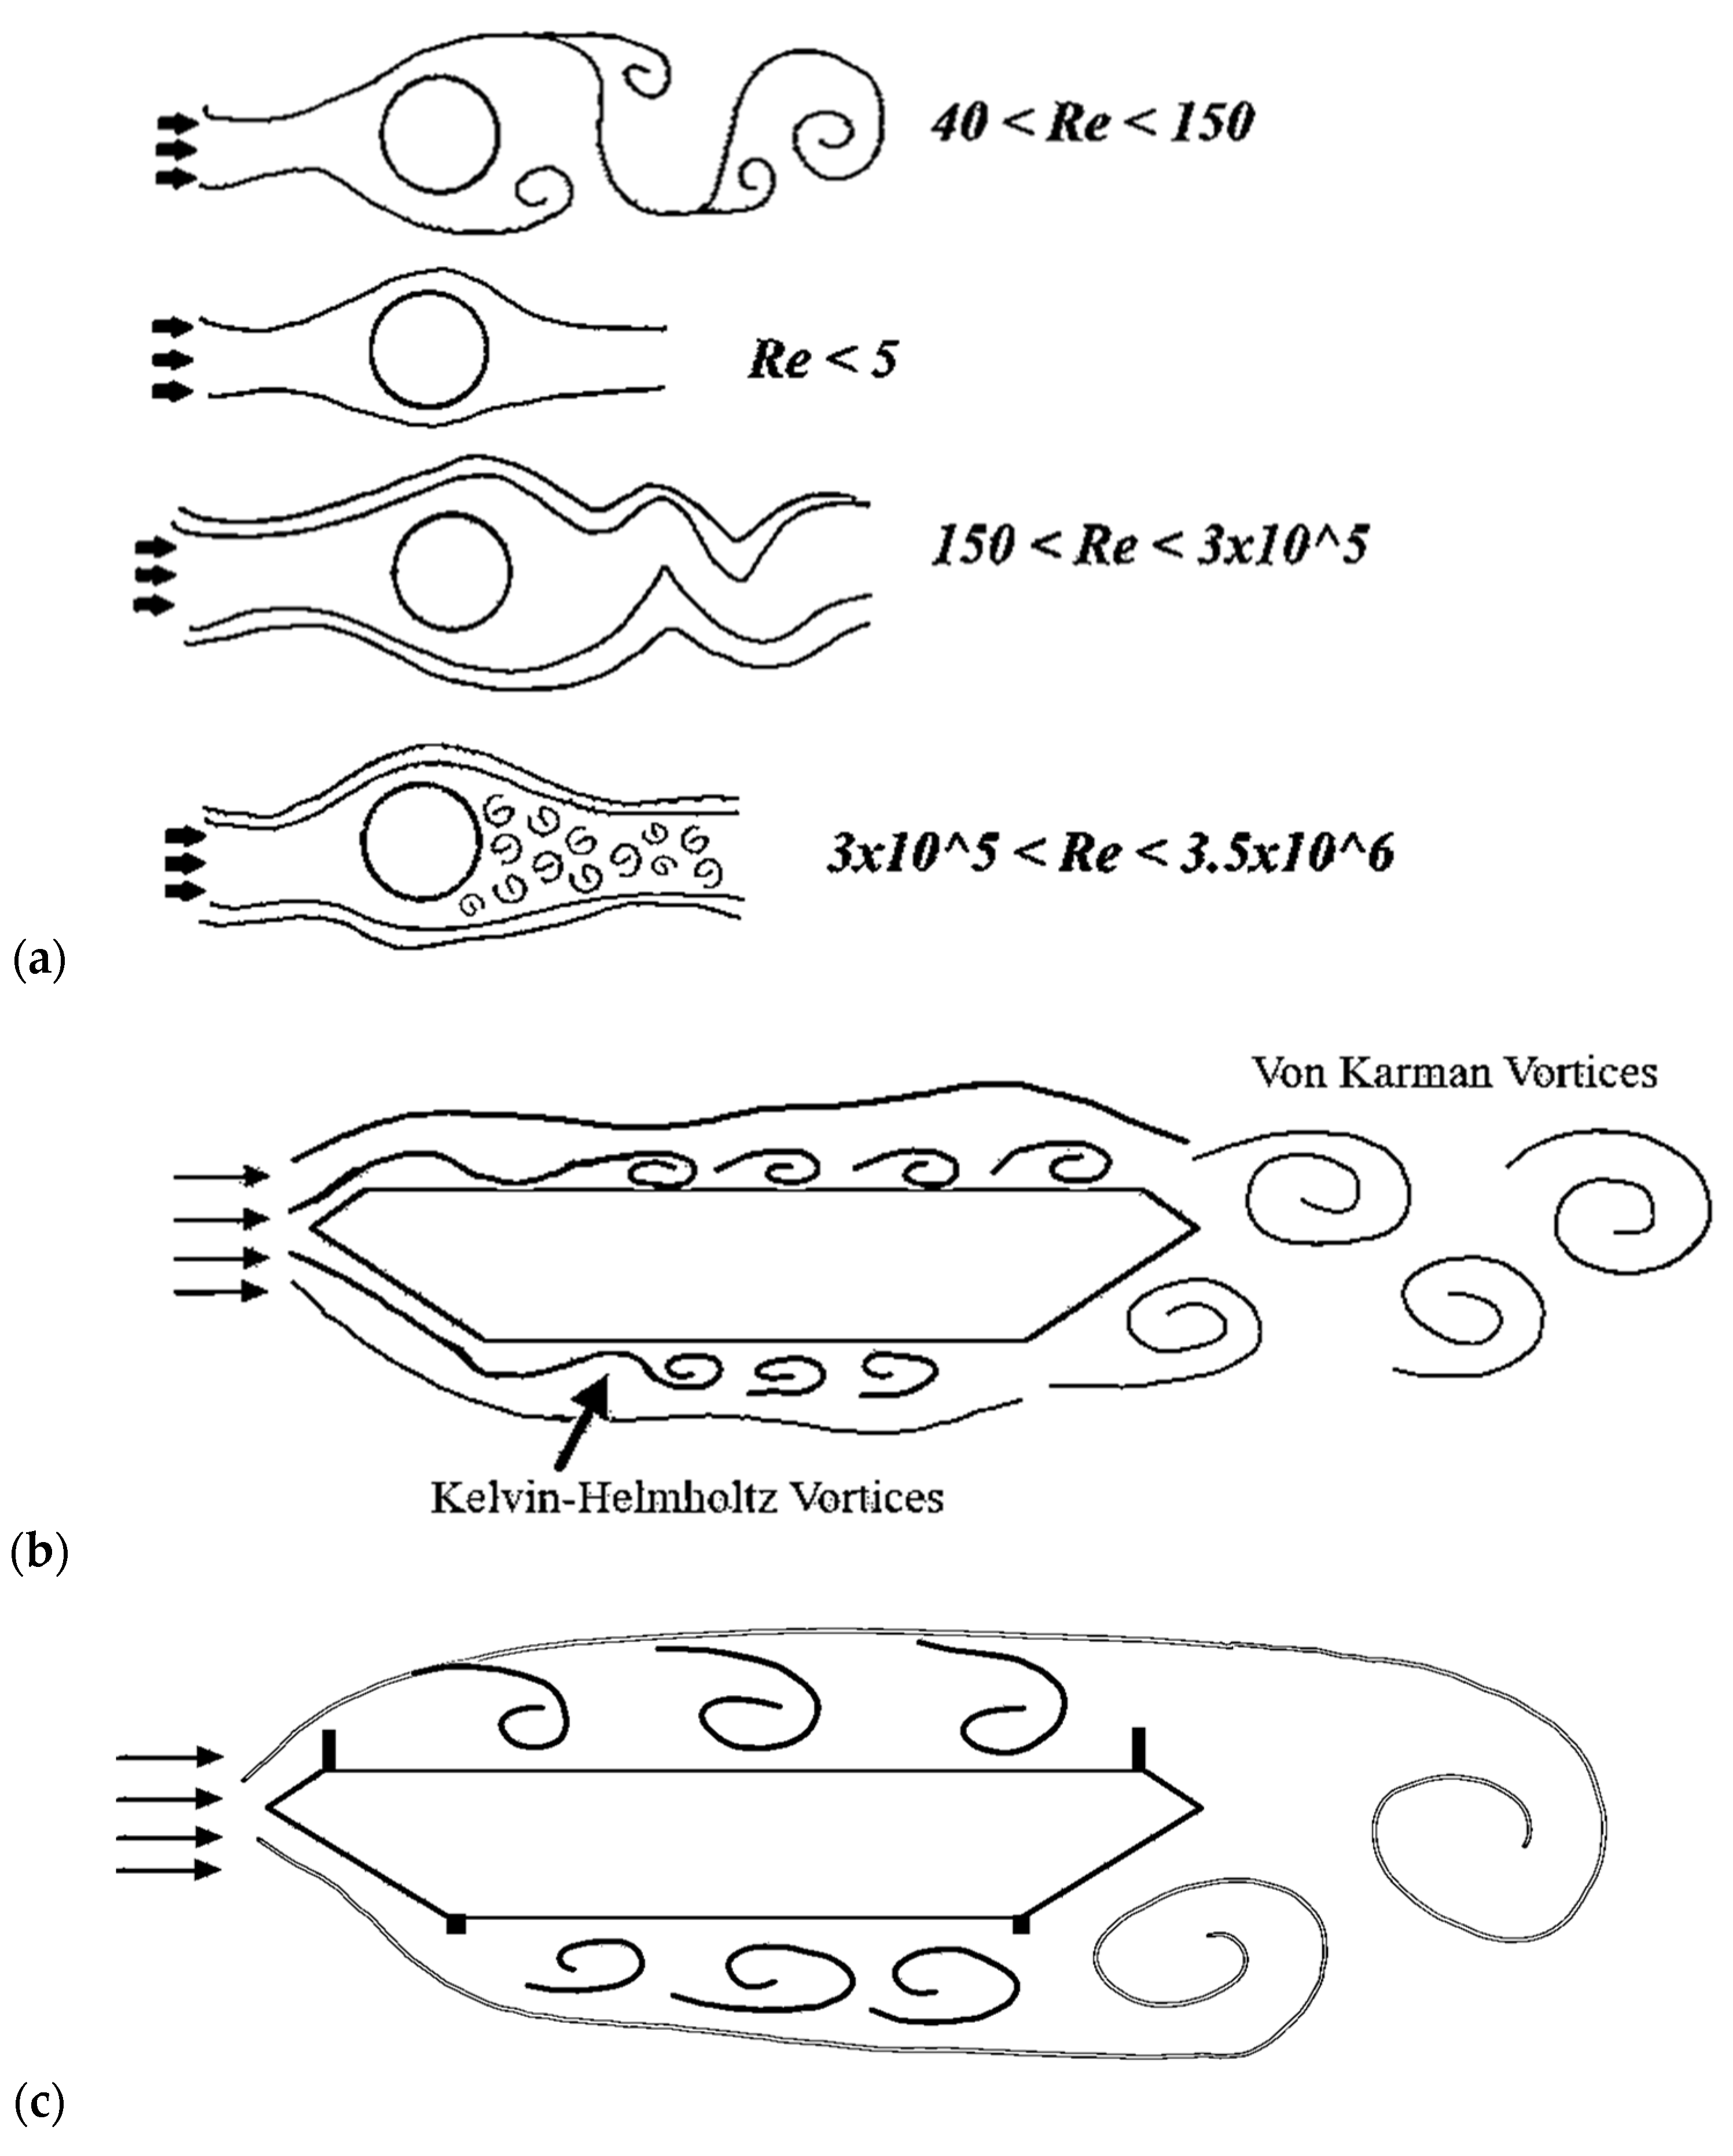
The changes in fluid behavior are highly dependent on . For instance, observing flow over a cylinder (Figure 1a), increasing transitions the flow from laminar with no separation ( < 5) to the formation of stable vortices, to eventual vortex shedding instability (40), and fully turbulent shedding (300 < < 3 × 10⁵). At very high Reynolds numbers (3.5 × 10⁶), the wake narrows, the shear layer becomes turbulent, and vortex shedding dissipates [24].
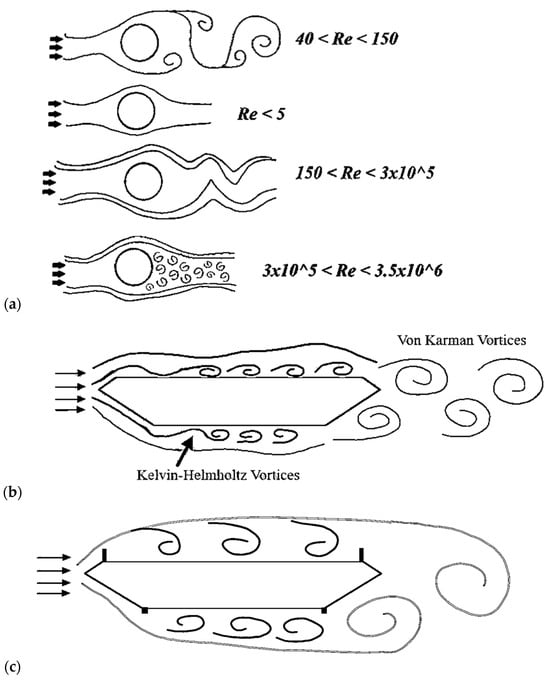
Figure 1.
Flow visualization for increasing Reynolds number: (a) visualization of flow around a cylinder with the increase in Reynolds number [24], (b) vortices over a bridge deck (bare-deck with von Karman and K-H vortices), and (c) von Karman and K-H vortices on a deck with mitigation devices [10].
Reynolds number dependence and scaling are critical in the turbulent boundary layer. This layer is developed by the interaction of the shear force at the face of the wall with the flow along the wall. The result of this interaction is a logarithmic velocity profile [21]. In this region, the vorticity is non-zero. In other words, for high Reynolds number cases, the boundary layer is composed of turbulent eddies [25]. Two significant effects result from increasing the Reynolds number. First, the velocity profile’s curvature increases when everything is held constant and the velocity increases. Second, when everything is held constant, and the characteristic length is increased, the extent to which velocity and vorticity govern the overall domain is reduced because the shear layer becomes a smaller fraction of the overall domain. The second effect is the most important for wind tunnel tests and designing scaled models [21]. One study compared flow with Reynolds numbers of 3.62 × 10⁵ and 1.8 × 10⁴ over a deck modified with guide vanes. There was a more significant flow blockage at the lower Reynolds number at the guide vane due to the larger shear layer at low Reynolds numbers [17].
Another critical component of the turbulent boundary layer is the friction velocity, which is tied to the shear force at the boundary wall. It is a function of the Reynolds number and is essential for predictive modeling of eddy formation in the boundary layer [26]. One significant aspect of the turbulence generated by wind tunnel tests is that it has a large scaling range. The difference between the smallest and largest eddy in the flow is significant. These large scaling ranges can only be achieved at high Reynolds numbers and are comparable to those measured at full scale in the field, which was shown by a study that used a wind tunnel with an active grid that allowed the characteristic length of flow to be altered in order to achieve a very high Reynolds number, Re = 2.2 × 10⁷ [27].
Similarly, a different study employed an active grid to increase the Reynolds number. It found a measurable change in the quality of the turbulence produced as the Reynolds number increased. An extensive scaling range of eddies was produced at the high Reynolds numbers. The range was similar to full-scale atmospheric conditions [28]. Another study performed a wind tunnel test on a flat plate to test different Reynolds number scaling attributes. A logarithmic velocity profile was found to be an acceptable assumption for Reynolds numbers between Re = 1.4 × 10³ and 3.1 × 10⁴ [29].
Specifically, the Reynolds number is vital for modeling and designing long-span bridges due to its relationship with the Strouhal number and vortex-induced vibrations [10]. Vortex-induced vibrations became prominent due to the Tacoma Narrows Bridge collapse in 1940. These vibrations are created by wind flowing over a bluff deck, creating alternating vortices at the top and bottom of the deck [30]. The vortices apply a force normal to the flow direction and, as a result, induce vibrations in the deck. These alternating vortices are called von Karman vortex shedding. The bluff bodies’ Strouhal number (S) defines the frequency at which the shedding occurs. N, D, and U are shedding frequency, defining dimension, and velocity, respectively [31].
The Strouhal number is based on the geometry of the deck and, under most conditions, remains constant (along with the defining dimension, D). To maintain a constant Strouhal number, shedding frequency increases linearly with wind speed [31]. However, when the wind speed increases to a certain velocity (critical velocity), an aerodynamic phenomenon called lock-in occurs. This happens when the wind velocity causes vortex shedding that produces a shedding frequency similar to the bridge’s natural frequency. As a result, the wind velocity no longer controls the shedding frequency, and they do not maintain their linear relationship; instead, the natural frequency of the bridge controls. During lock-in, the velocity keeps increasing, but the shedding frequency remains constant with the bridge’s natural frequency. The most prominent deck vibrations occur when the bridge is locked into this zone [32].
The Strouhal number is sensitive to changes in the Reynolds number. One study showed this by analyzing fluid flow over a sphere. The results showed that the Strouhal number increased linearly with the Reynolds number until the Reynolds number was approximately 3 × 10⁵, after which the Strouhal number began to decrease and levels out around a Reynolds number of 1 × 10⁵. Higher Strouhal numbers are representative of higher frequency vortex shedding occurring in the wake [33], which was corroborated by a study that also found the Strouhal number increased linearly with the Reynolds number [34]. Another study found that the attachment of mitigation devices like handrails and windshields reduced the Reynolds number sensitivity of the deck, producing a lower Strouhal number that did not fluctuate with changing Reynolds numbers. Comparatively, the bare deck was shown to have significant Reynolds number sensitivity, resulting in a Strouhal number that fluctuated with changes in Reynolds number [10]. The angle of attack can also affect the Reynolds number sensitivity of the Strouhal number of a long-span bridge deck, which was determined by a study that used a 9 m × 9 m wind tunnel to test a 1:10 scale model. The Strouhal number became more sensitive to the Reynolds number at larger angles of attack, such as + or −5 degrees [35].
Pressure distribution is also affected by the Reynolds number. Analysis of the pressure coefficients Cp determines the flow behavior around the bluff body. For bridge decks, positive pressure coefficients indicate no flow separation around the deck. Conversely, negative pressure coefficients indicate that suction or flow separation is occurring. Pressure coefficients vary with the angle of attack. With negative angles of attack, positive pressure coefficients are observed at the leading edge of the deck. However, the pressure coefficients become negative as the angle decreases to zero and then increase back into the positive range. This suggests that positive angles of attack lead to more flow separation at the leading edge [36]. In the following equation, p, , and V represent pressure, fluid density, and velocity.
These coefficients can be plotted over the bridge deck’s width to understand better the flow characteristics around the deck [37]. One study used an open-jet facility for testing. It compared the wind pressures measured at low (Re = 6 × 10⁴) versus high (Re = 0.1 × 10⁷) Reynolds number tests. The results showed that wind pressures are underestimated at lower Reynolds numbers [19]. Another study performed in the NRCC wind tunnel tested a 1:10 scale long-span bridge model. It was shown that there is sensitivity of pressure distribution to changes in Reynolds number, especially at larger angles of attack [35].
Furthermore, testing a 1:50 scale high-rise building in an open-jet facility produced higher peak pressure coefficients than the model tested at a smaller scale in a typical wind tunnel. The open-jet model had a Reynolds number of 0.1 × 10⁷ while the wind tunnel model’s Reynolds number was approximately 6 × 10⁴. The study concluded that the higher peak pressures resulted from larger-scale turbulence forming at higher Reynolds numbers [20].
Producing a CFD model with a Reynolds number that is too low will lead to inaccurate modeling of the vortices in the flow. At lower Reynolds numbers, the flow modeled is laminar. It will not accurately represent the turbulent action occurring in the wake because viscous shear stresses dominate at low Reynolds numbers [23]. As the Reynolds number increases, the flow transitions into a flow with 2D oscillations [38]. One study compared the results from a wind tunnel and CFD model. The model scale used for both was 1:20, considered large-scale, to ensure the smallest possible Reynolds number effects from the wind tunnel model. The vortex-induced vibration response showed discrepancies where a model 2.5 times smaller was used [39]. It was concluded that Reynolds number scaling was the cause [13]. Another comparison of wind tunnel versus CFD was performed by comparing the results of the Re = 2000 wind tunnel model versus the Re = 20,000 CFD model. It was found that the wind tunnel underestimated the vortex-induced vibration amplitude, leading to the conclusion that vortex-induced vibrations are highly dependent on Reynolds number [37], which was supported by another study that found a correlation between increase in Reynolds number and vibration amplitude by analyzing a CFD model at different Reynolds numbers [34].
3. Aerodynamic Mitigation Devices: Principles and Applications
Aerodynamic mitigation devices are integral to proactively safeguarding the structural integrity and serviceability of long-span bridges by counteracting detrimental wind-induced vibrations. These devices, either integrated into initial bridge designs or strategically retrofitted, serve to fundamentally modify the airflow patterns around the bridge deck, thereby suppressing the formation and intensity of vortices that induce vibrations [15]. Their implementation represents a critical advancement in modern bridge engineering, ensuring enhanced safety and performance under dynamic wind loads.
The fundamental principle governing these devices is the alteration of deck geometry to disrupt organized vortex shedding, primarily impacting von Karman and Kelvin-Helmholtz (K-H) vortices (Figure 1). von Karman vortices arise from the interaction of shear layers in the wake, while K-H vortices result from shear layer unsteadiness around the deck. Through engineered flow separation and wake widening, mitigation devices effectively reduce both the frequency and amplitude of these vortices, thereby diminishing vortex-induced vibrations. By increasing the distance between the upper and lower shear layers at the trailing edge, mitigation devices achieve larger-scale, lower-frequency vortex shedding, a condition less likely to coincide with the bridge’s natural frequencies [40]. Comprehensive analysis using wind tunnel testing and computational fluid dynamics (CFD) is essential for predicting and optimizing these flow alterations.
Below, we detail the application, mechanisms, and performance of several key aerodynamic mitigation devices:
3.1. Handrails
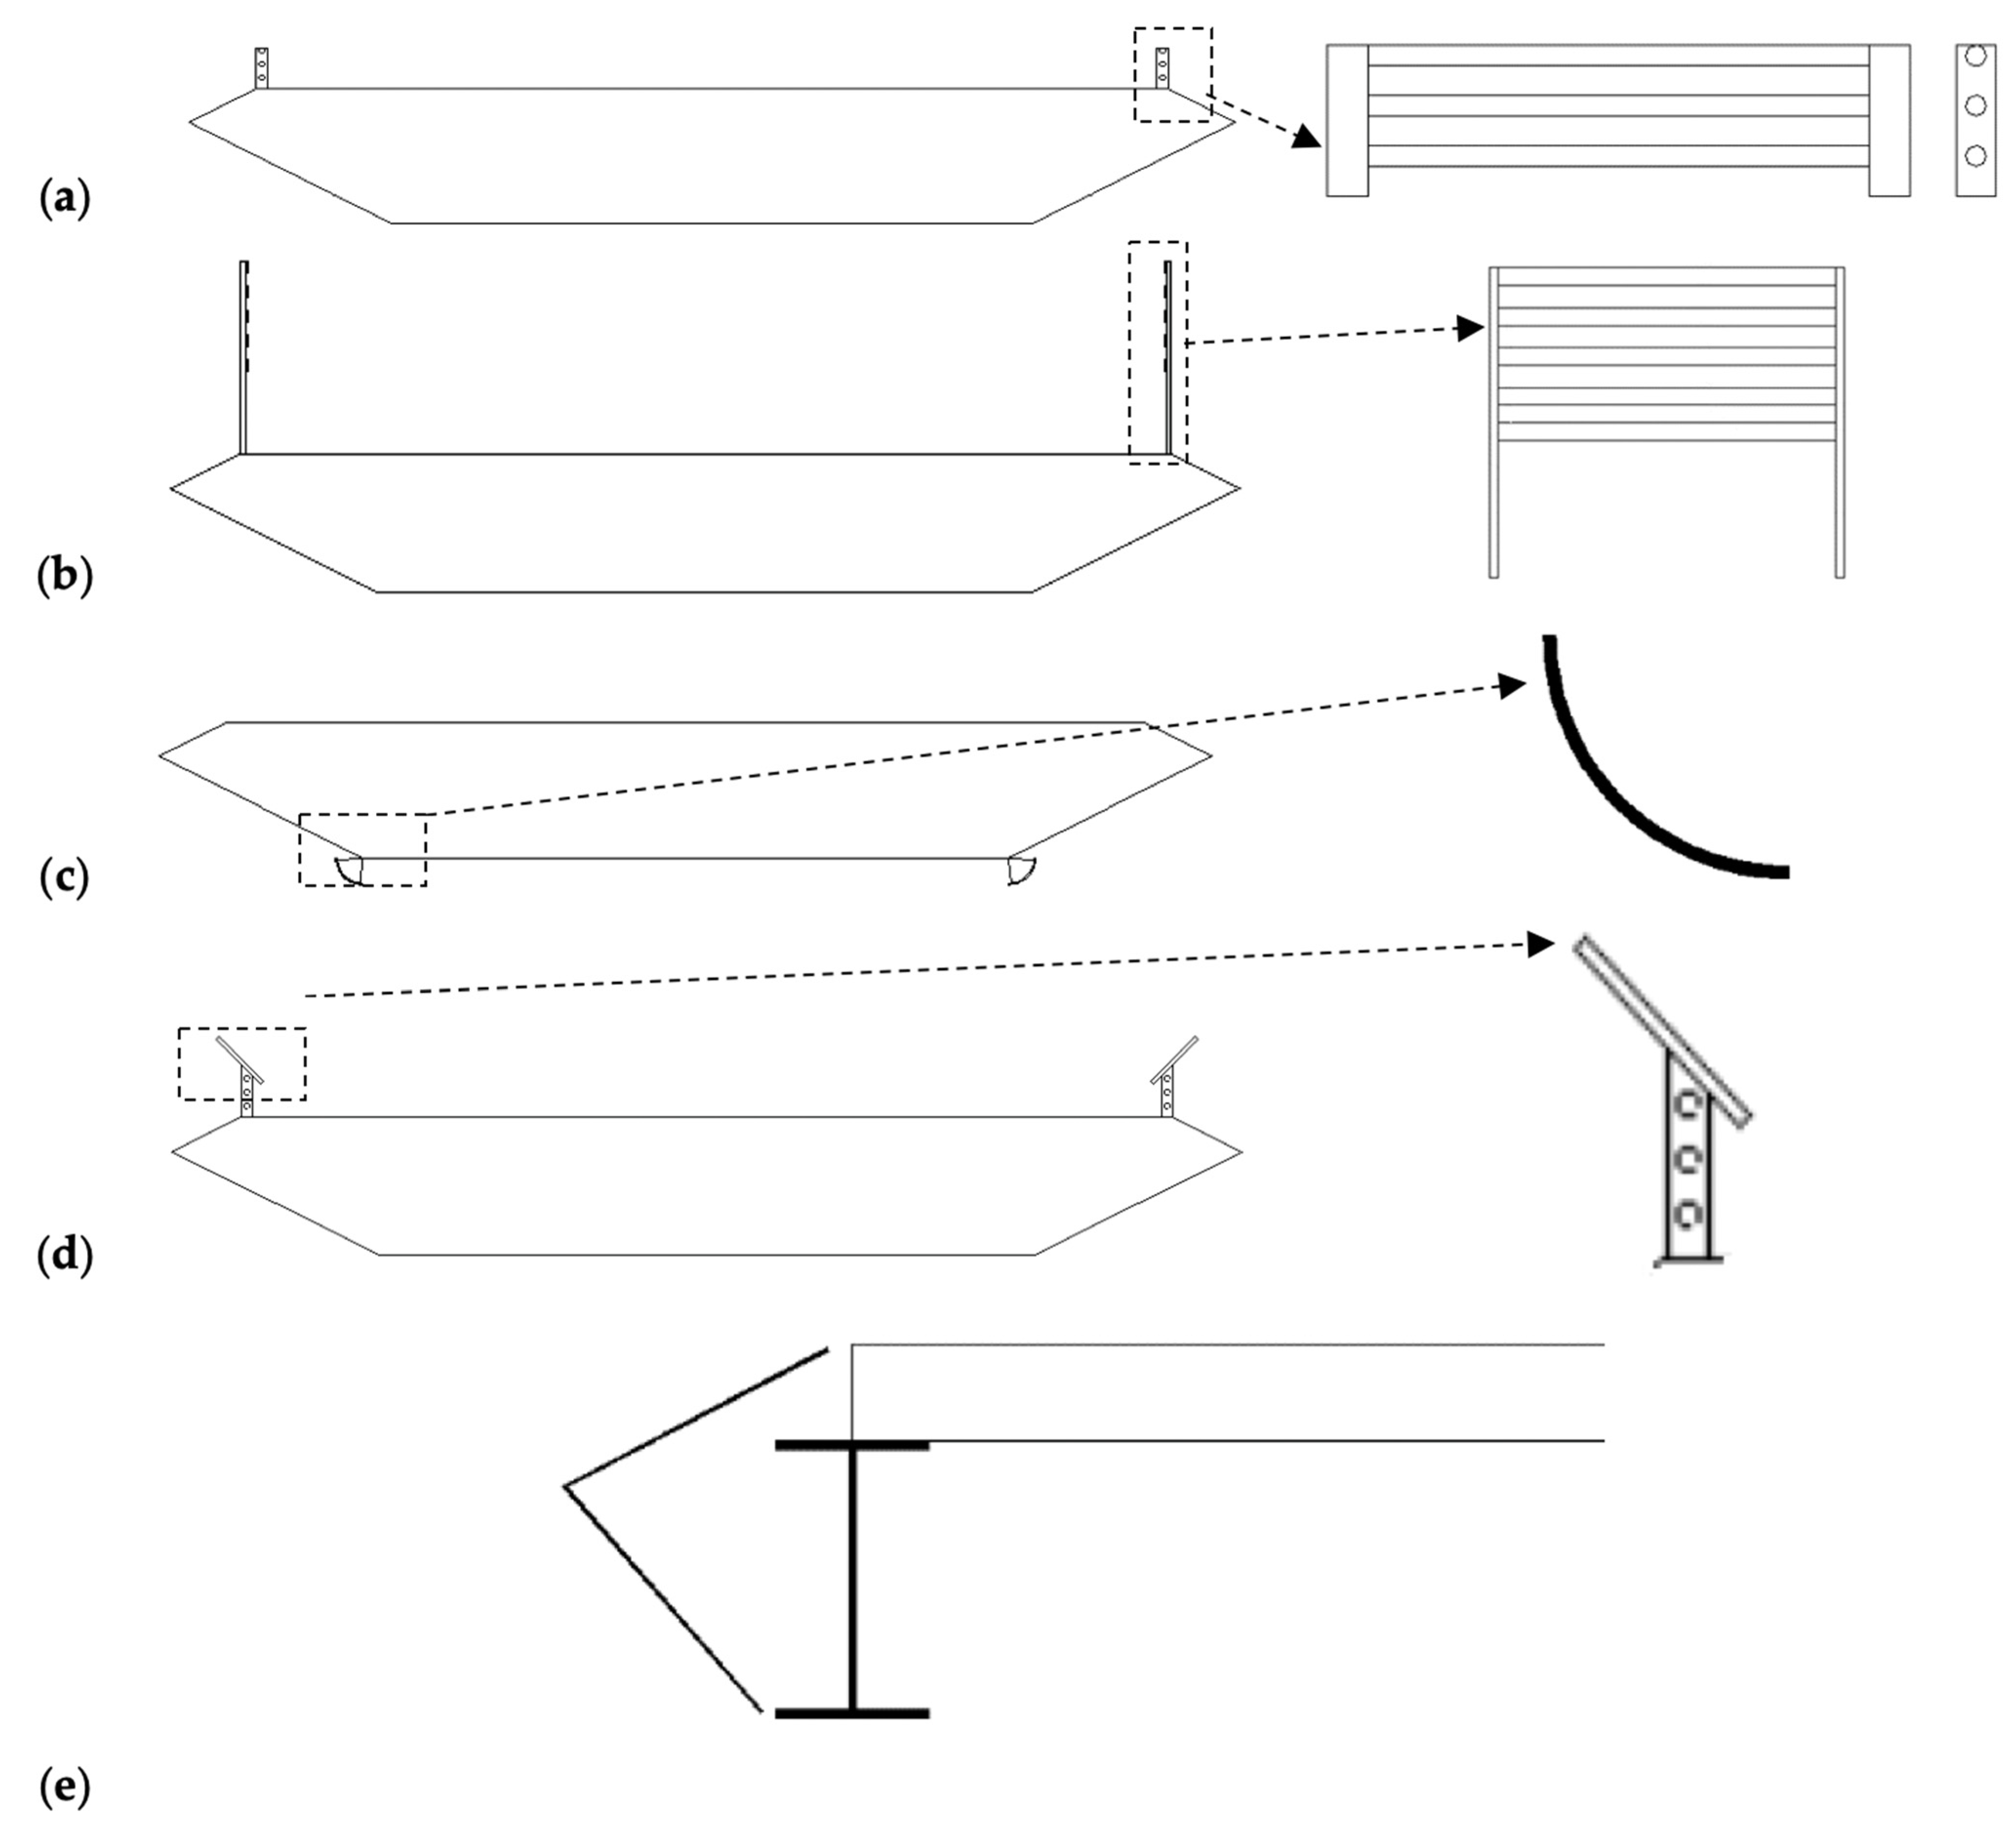
Handrails, while primarily fulfilling essential pedestrian and driver safety functions on long-span bridges (Figure 2a), simultaneously provide significant aerodynamic mitigation benefits [41]. Research indicates that handrails can induce positive pressure on the top surface of the deck by slowing down the airflow, which in turn reduces localized vortex shedding. Furthermore, handrails increase flow separation at the leading edge of the deck, contributing to a reduction in the vortex shedding frequency. Studies on design parameters, such as railing bar placement, have shown differential impacts on vibration modes; for instance, a mid-railing height placement is effective for vertical vibrations but less effective for torsional vibrations. Crucially, the inclination angle of handrails is directly correlated with vibration suppression, with an inclination of 20 degrees determined to be optimal for reducing streamwise velocity in the wake and providing superior vibration control compared to a perpendicular alignment [38,42]. These findings underscore the importance of integrating aerodynamic considerations into the multi-functional design of handrails.
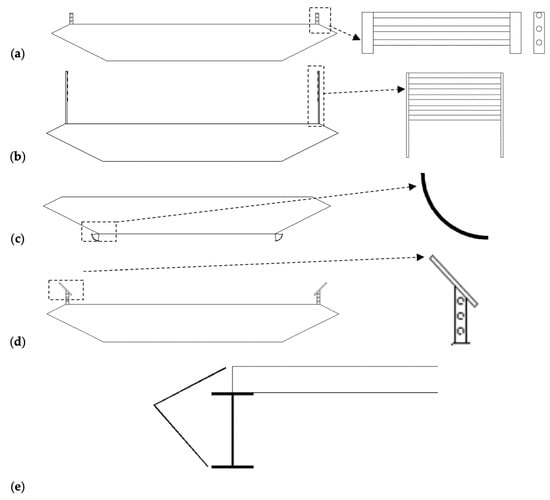
Figure 2.
Aerodynamic mitigation devices for bridges: (a) barrier rail [10], (b) windshield [11], (c) guide vanes [12], (d) spoilers [13], and (e) Fairing [14].
3.2. Windshields
Windshields (Figure 2b [11]) are employed on long-span bridges to create areas of reduced wind exposure, enhancing driver comfort and safety [10]. Their design, characterized by reduced porosity, directly contributes to a reduction in mean wind velocity over the bridge deck [43]. From an aerodynamic perspective, lower porosity barriers generally exert a greater influence on the surrounding airflow. Windshields promote significant flow separation at the leading edge of the bridge deck, leading to the formation of large-scale, low-frequency vortex shedding in the wake. While this effectively reduces vertical vortex-induced vibrations, it can paradoxically increase torsional vibrations, potentially escalating the bridge’s vulnerability to torsional flutter [44]. This dual aerodynamic impact necessitates meticulous design optimization and, often, the strategic combination with other mitigation devices to address the increased torsional response and maintain overall stability.
3.3. Guide Vanes
Guide vanes (Figure 2c) are typically positioned beneath the bridge deck, frequently alongside maintenance rails, which themselves can induce vortex-induced vibrations. Their primary function is to redirect airflow and reduce pressure fluctuations at the base of the deck, thereby suppressing vortex formation [13]. Studies on various placements have demonstrated that internal guide vanes, particularly on the leeward side, are effective in mitigating vortex formation and suppressing vibrations, whereas external placement may have limited effect [45]. A notable real-world success story includes the Storbælt suspension bridge, where guide vanes installed at the bottom deck’s windward and leeward edges effectively suppressed significant post-erection vortex-induced vibrations [12]. While guide vanes can influence pressure distribution by increasing negative pressure (suction) at the leading edge, their principal benefit lies in their capacity to actively control flow separation beneath the deck, preventing detrimental vortex formation and enhancing stability [40].
3.4. Spoilers
Spoilers (Figure 2d) are typically affixed to the top of barriers or handrails and can be inclined at various angles. These devices have demonstrated remarkable efficacy in suppressing vortex-induced vibrations [13]. Research indicates that spoilers can completely eliminate vertical vortex-induced vibrations and effectively suppress the pressure fluctuations that lead to them, showing minimal dependency on inclination angle for vibration response. Furthermore, spoilers can significantly reduce torsional vibration amplitude by generating turbulent flow that actively counteracts these vibrations [40]. A compelling case study is the Humen Suspension Bridge in China, where the installation of spoilers successfully reduced vertical vortex-induced vibration amplitude by half, addressing a critical low damping ratio [46]. Spoilers thus represent a highly effective and robust mitigation strategy for improving the aerodynamic stability of bridge decks.
3.5. Fairings
Fairings are specifically designed aerodynamic mitigation devices that streamline the bluff edges of a box girder (Figure 2e), fundamentally altering the flow patterns around bridge decks and reducing aerodynamic instabilities. Their primary mechanism involves modifying the geometry to achieve a more favorable aerodynamic shape, which can lead to reduced vortex formation and associated vibrations.
However, the effectiveness of fairings is highly dependent on precise design parameters, particularly their inclination and geometry. For instance, one study revealed that sub-optimal placement or design, such as a slight bottom angle (around 10 degrees), can paradoxically escalate vortex formation at the top of the deck, leading to an increase in vibration amplitude [47]. This emphasizes that not all fairing configurations will yield positive mitigation outcomes.
Further research investigating the influence of different angles highlighted this sensitivity: while shallow bottom angles were found to increase vortex shedding, fairings with bottom angles ranging from 15 to 25 degrees effectively angled the nose upward, resulting in a demonstrable decrease in aerodynamic response [48]. This critical insight underscores the necessity of optimized design and extensive aerodynamic analysis to ensure fairings achieve their intended mitigation.
Real-world applications further illustrate these complexities. For example, the Trans-Tokyo Bay Bridge experienced significant vortex-induced vibrations, reaching up to 50 cm under transverse winds. Although wind tunnel tests on a bridge model incorporating fairings alongside double flaps and a skirt successfully reduced the vibration amplitude to 18 cm, this still did not meet the stringent allowable amplitude of 10 cm [49]. This case study demonstrates that while fairings can contribute to vibration reduction, they may require integration with other mitigation strategies or more refined optimization to fully address severe aerodynamic challenges on long-span bridges.
Overall, fairings offer a viable pathway for aerodynamic mitigation by streamlining bridge deck geometries. Nevertheless, their successful implementation is contingent upon rigorous aerodynamic design and validation, with particular attention to factors like inclination angles, to ensure they effectively reduce rather than exacerbate wind-induced vibrations.
3.6. Summary of Aerodynamic Mitigation Devices
The diverse array of aerodynamic mitigation devices—including handrails, windshields, guide vanes, spoilers, and fairings—offers multifaceted solutions for enhancing bridge stability against wind-induced vibrations. While each device operates on distinct aerodynamic principles, ranging from shape modification and flow streamlining to targeted vortex suppression and reattachment control, their individual efficacy is often contingent on precise design, optimal placement, and site-specific environmental conditions. Critical insights gleaned from both advanced laboratory experiments (such as wind tunnels and open-jet facilities) and real-world case studies consistently highlight the imperative of comprehensive aerodynamic analysis to accurately predict and optimize their performance. Furthermore, the inherent complexities of long-span bridge aerodynamics frequently necessitate the integrated application of multiple mitigation strategies to achieve stringent vibration reduction targets, thereby contributing to the development of more resilient and durable infrastructure. This necessity for integrated solutions provides the foundational rationale for exploring multi-functional geometric modifications, such as the proposed integration of photovoltaic systems for simultaneous aerodynamic control and energy production. Future research efforts should continue to explore novel designs, synergistic combinations, and adaptive control mechanisms to address increasingly intricate aerodynamic challenges in contemporary bridge engineering.
4. Methodology
This study employed a combined computational and experimental methodology to evaluate the aerodynamic efficacy of integrated solar panel systems. The methodology included (1) Initial validation of Open-Jet facility flow properties against established standards, and comparison with previous wind tunnel studies; (2) Computational Fluid Dynamics (CFD) pre-analysis using the k-ω Shear Stress Transport (SST) model to evaluate various solar panel arrangements and select the most aerodynamically favorable configuration; and (3) Large-scale open-jet testing of the selected optimal arrangement (Arrangement 4) for detailed pressure measurement and comparative analysis against the bare-deck model.
4.1. CFD Modeling and Turbulence Closure
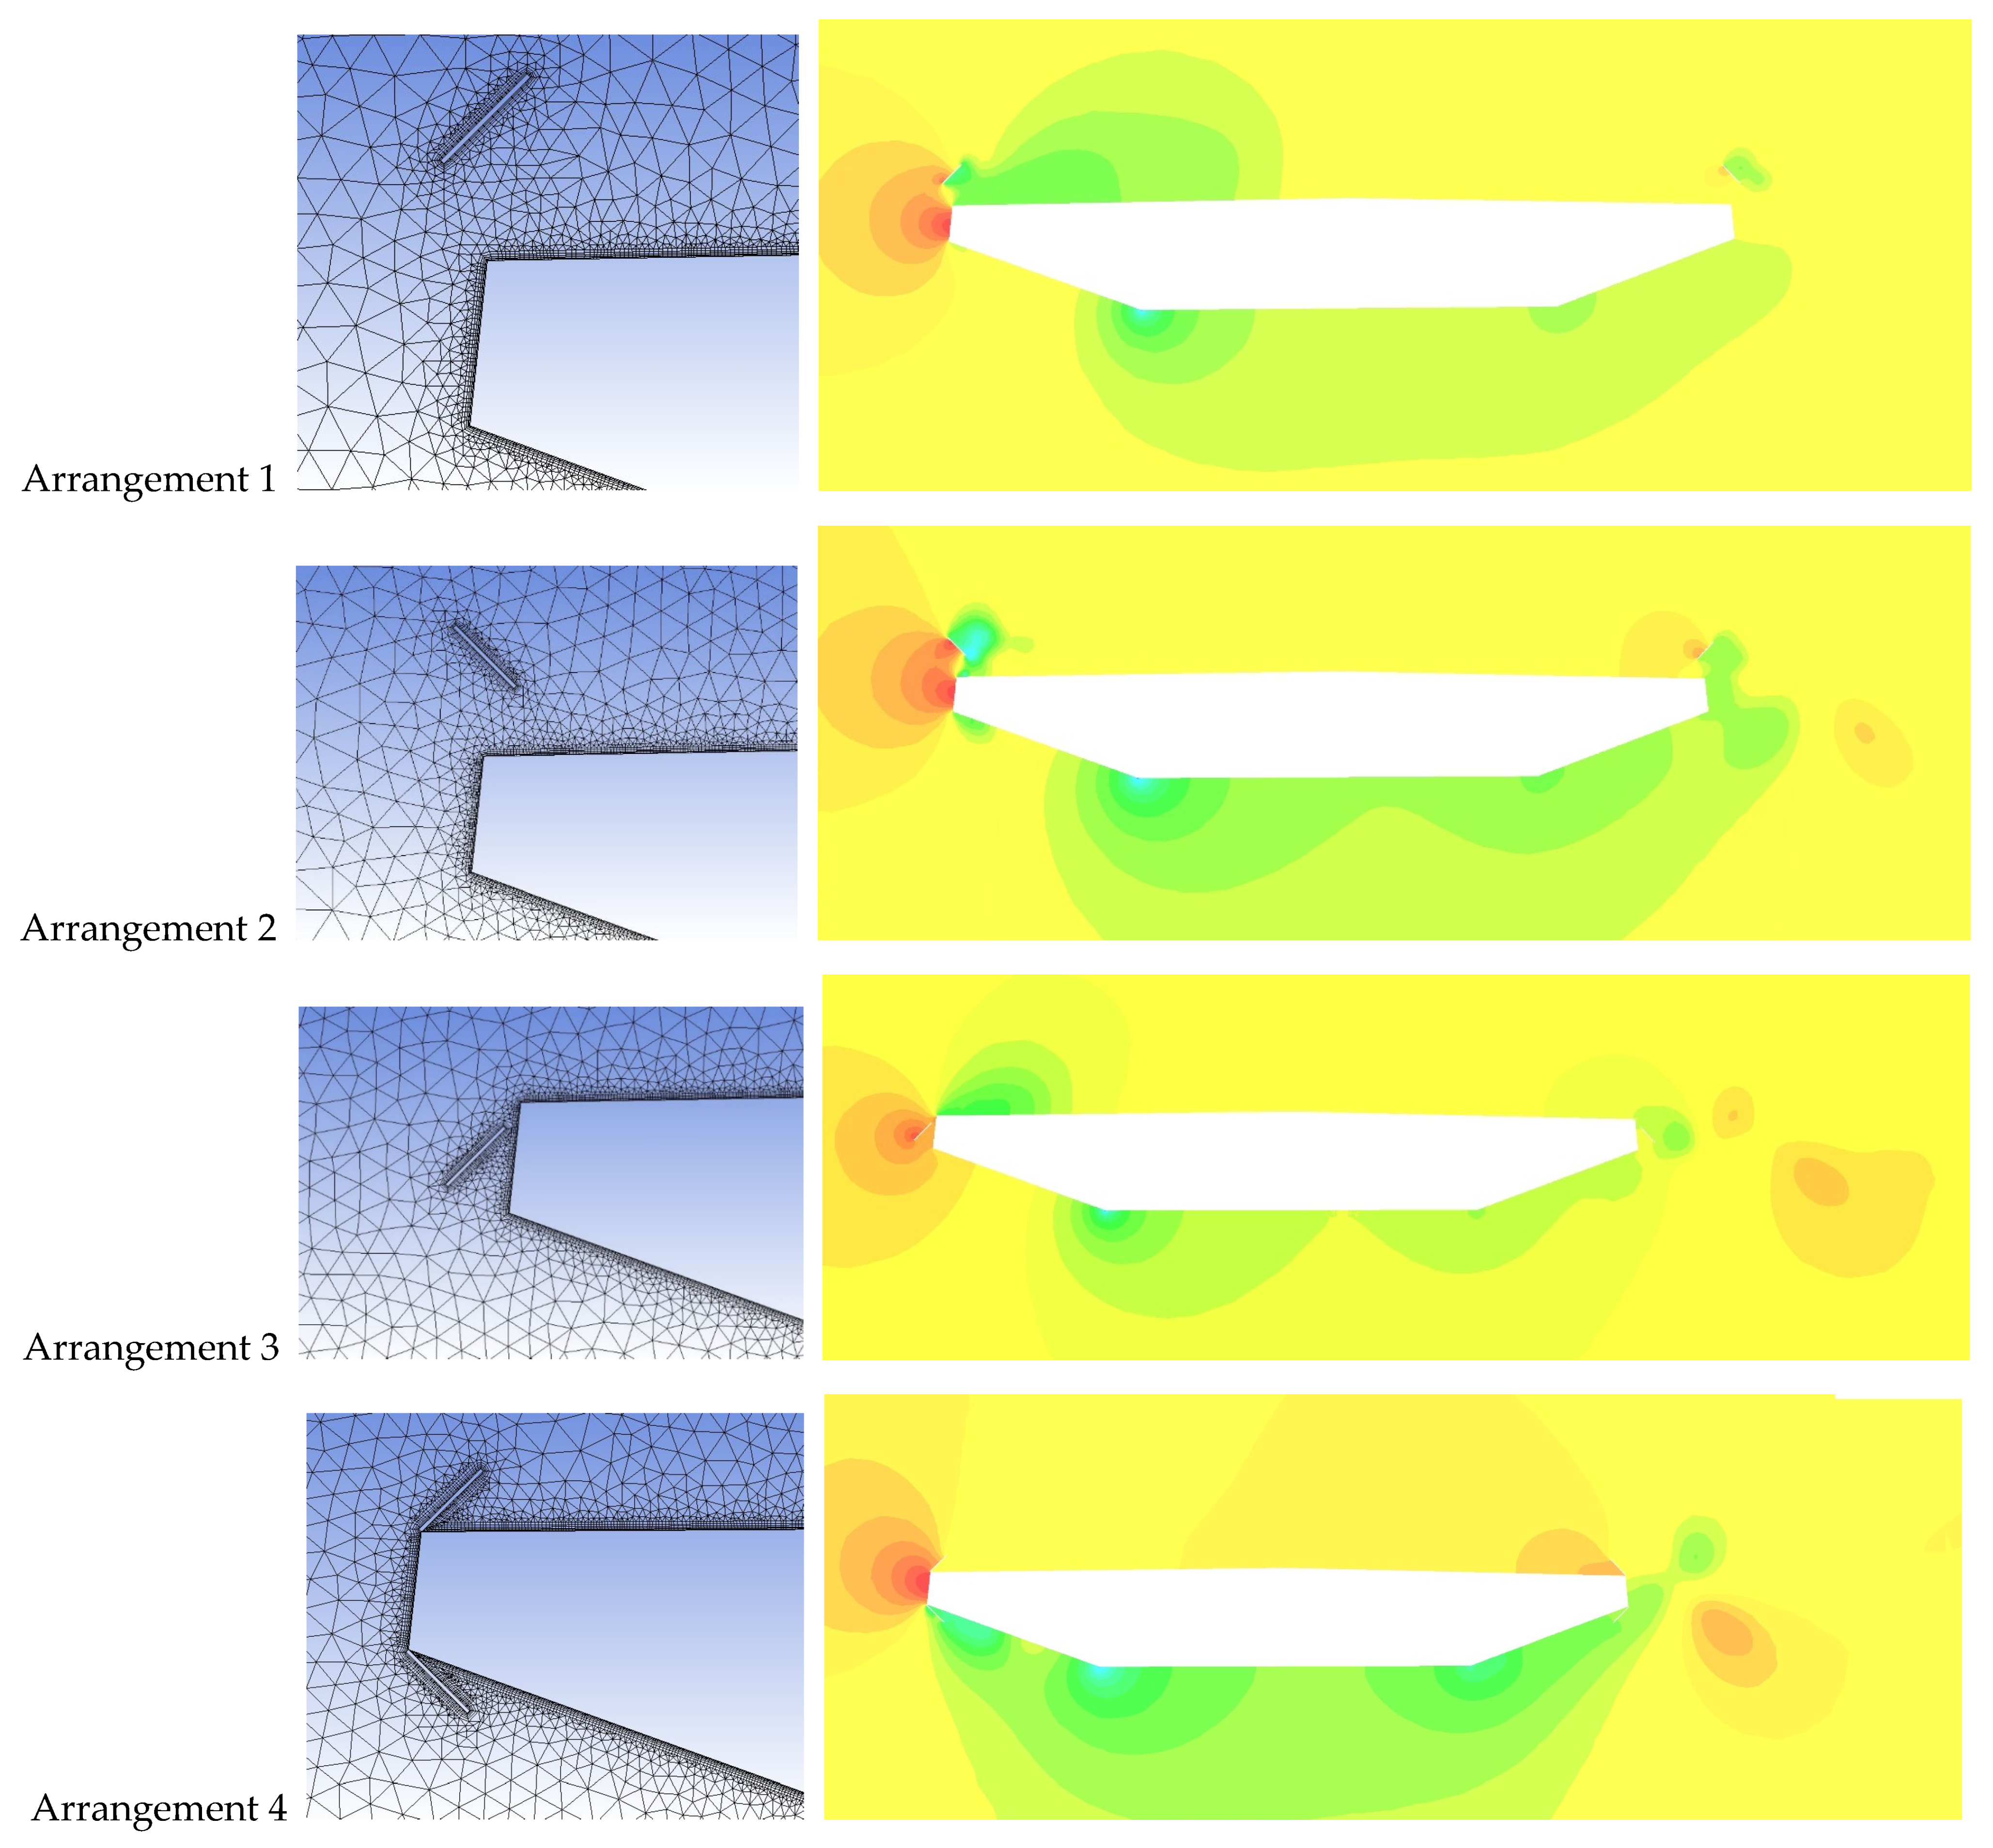
CFD analysis was crucial for testing various configurations without physical model fabrication. The RANS-based k-ω SST turbulence closure model was utilized, selected for its balance of accuracy and computational cost, particularly in predicting flow separation. This choice was critical given that initial attempts using the Reynolds Stress Transport (RST) model failed to achieve convergence for the flow separation profile at the deck’s leading edge. The computational domain dimensions were established to adhere to standard CFD guidelines, maintaining a blockage ratio of 4.87%. For numerical accuracy, the mesh included structured prism elements near the deck walls (0.4 mm height, six layers) to capture viscous effects, transitioning to tetrahedral elements in the far field, resulting in a mesh with approximately 1.1 million elements. Grid independence was ensured by iteratively refining the mesh until results converged accurately, with Mesh 3 providing the optimal balance of refinement and computational cost (Table 1). Mesh 3 (1.1 million elements) was rigorously selected as the final configuration, ensuring a numerically stable prediction of aerodynamic forces. The CFD simulations were performed under atmospheric boundary layer (ABL) conditions defined by a logarithmic velocity profile and 20% turbulence intensity, ensuring relevance to real-world wind environments. The initial CFD screening of Arrangements 1, 2, and 3 revealed that configurations promoting flow asymmetry or excessive flow separation were aerodynamically inferior, qualitatively validating the selection of the highly streamlined Arrangement 4 for further experimental analysis. Specifically, this preliminary analysis demonstrated the inferiority of the alternative arrangements: Arrangement 1 induced fluctuating vertical forces that would compromise driver comfort and lead to deck oscillations; Arrangement 2 created detrimental Kelvin-Helmholtz vortices over the deck top, which are undesirable for stability; and Arrangement 3 produced aerodynamic characteristics nearly identical to the bare-deck case, suggesting insufficient mitigation potential. This qualitative ranking justified isolating Arrangement 4 for high-fidelity open-jet testing. This RANS methodology, while underestimating pressures by up to 73% in later validation, successfully captured the dominant flow topology changes necessary for the comparative qualitative ranking of the four mitigation configurations [50].

Table 1.
Mesh characteristics.
4.2. Experimental Setup and Testing Protocol
The large-scale Open-Jet facility at the WISE Laboratory was used for experimental validation, enabling high Reynolds number testing (Re = 1 × 10⁶). The test model, a 1:20 scale streamlined single box girder, had dimensions of 1.5 m wide, 1.828 m long, and 0.195 m high. It was strategically placed at 1.75H from the fan exit to ensure accurate measurement within the fully developed ABL flow region. To control the boundary layer and ensure 2D flow conditions, large plywood sheets were employed to counteract crossflow. These sheets were integral to maintaining the two-dimensional (2-D) flow assumption required for the section model testing. The physical setup, utilizing large-scale components, was meticulously configured to minimize parasitic drag and ensure clean flow over the section model. Pressure data were collected via 78 pressure taps across two rings, monitored by scanner modules for accurate distribution analysis. The low blockage ratio (4.87%) was crucial in replicating unbounded atmospheric flow, minimizing wall interference and flow acceleration.
5. Open-Jet Testing
5.1. Case Study
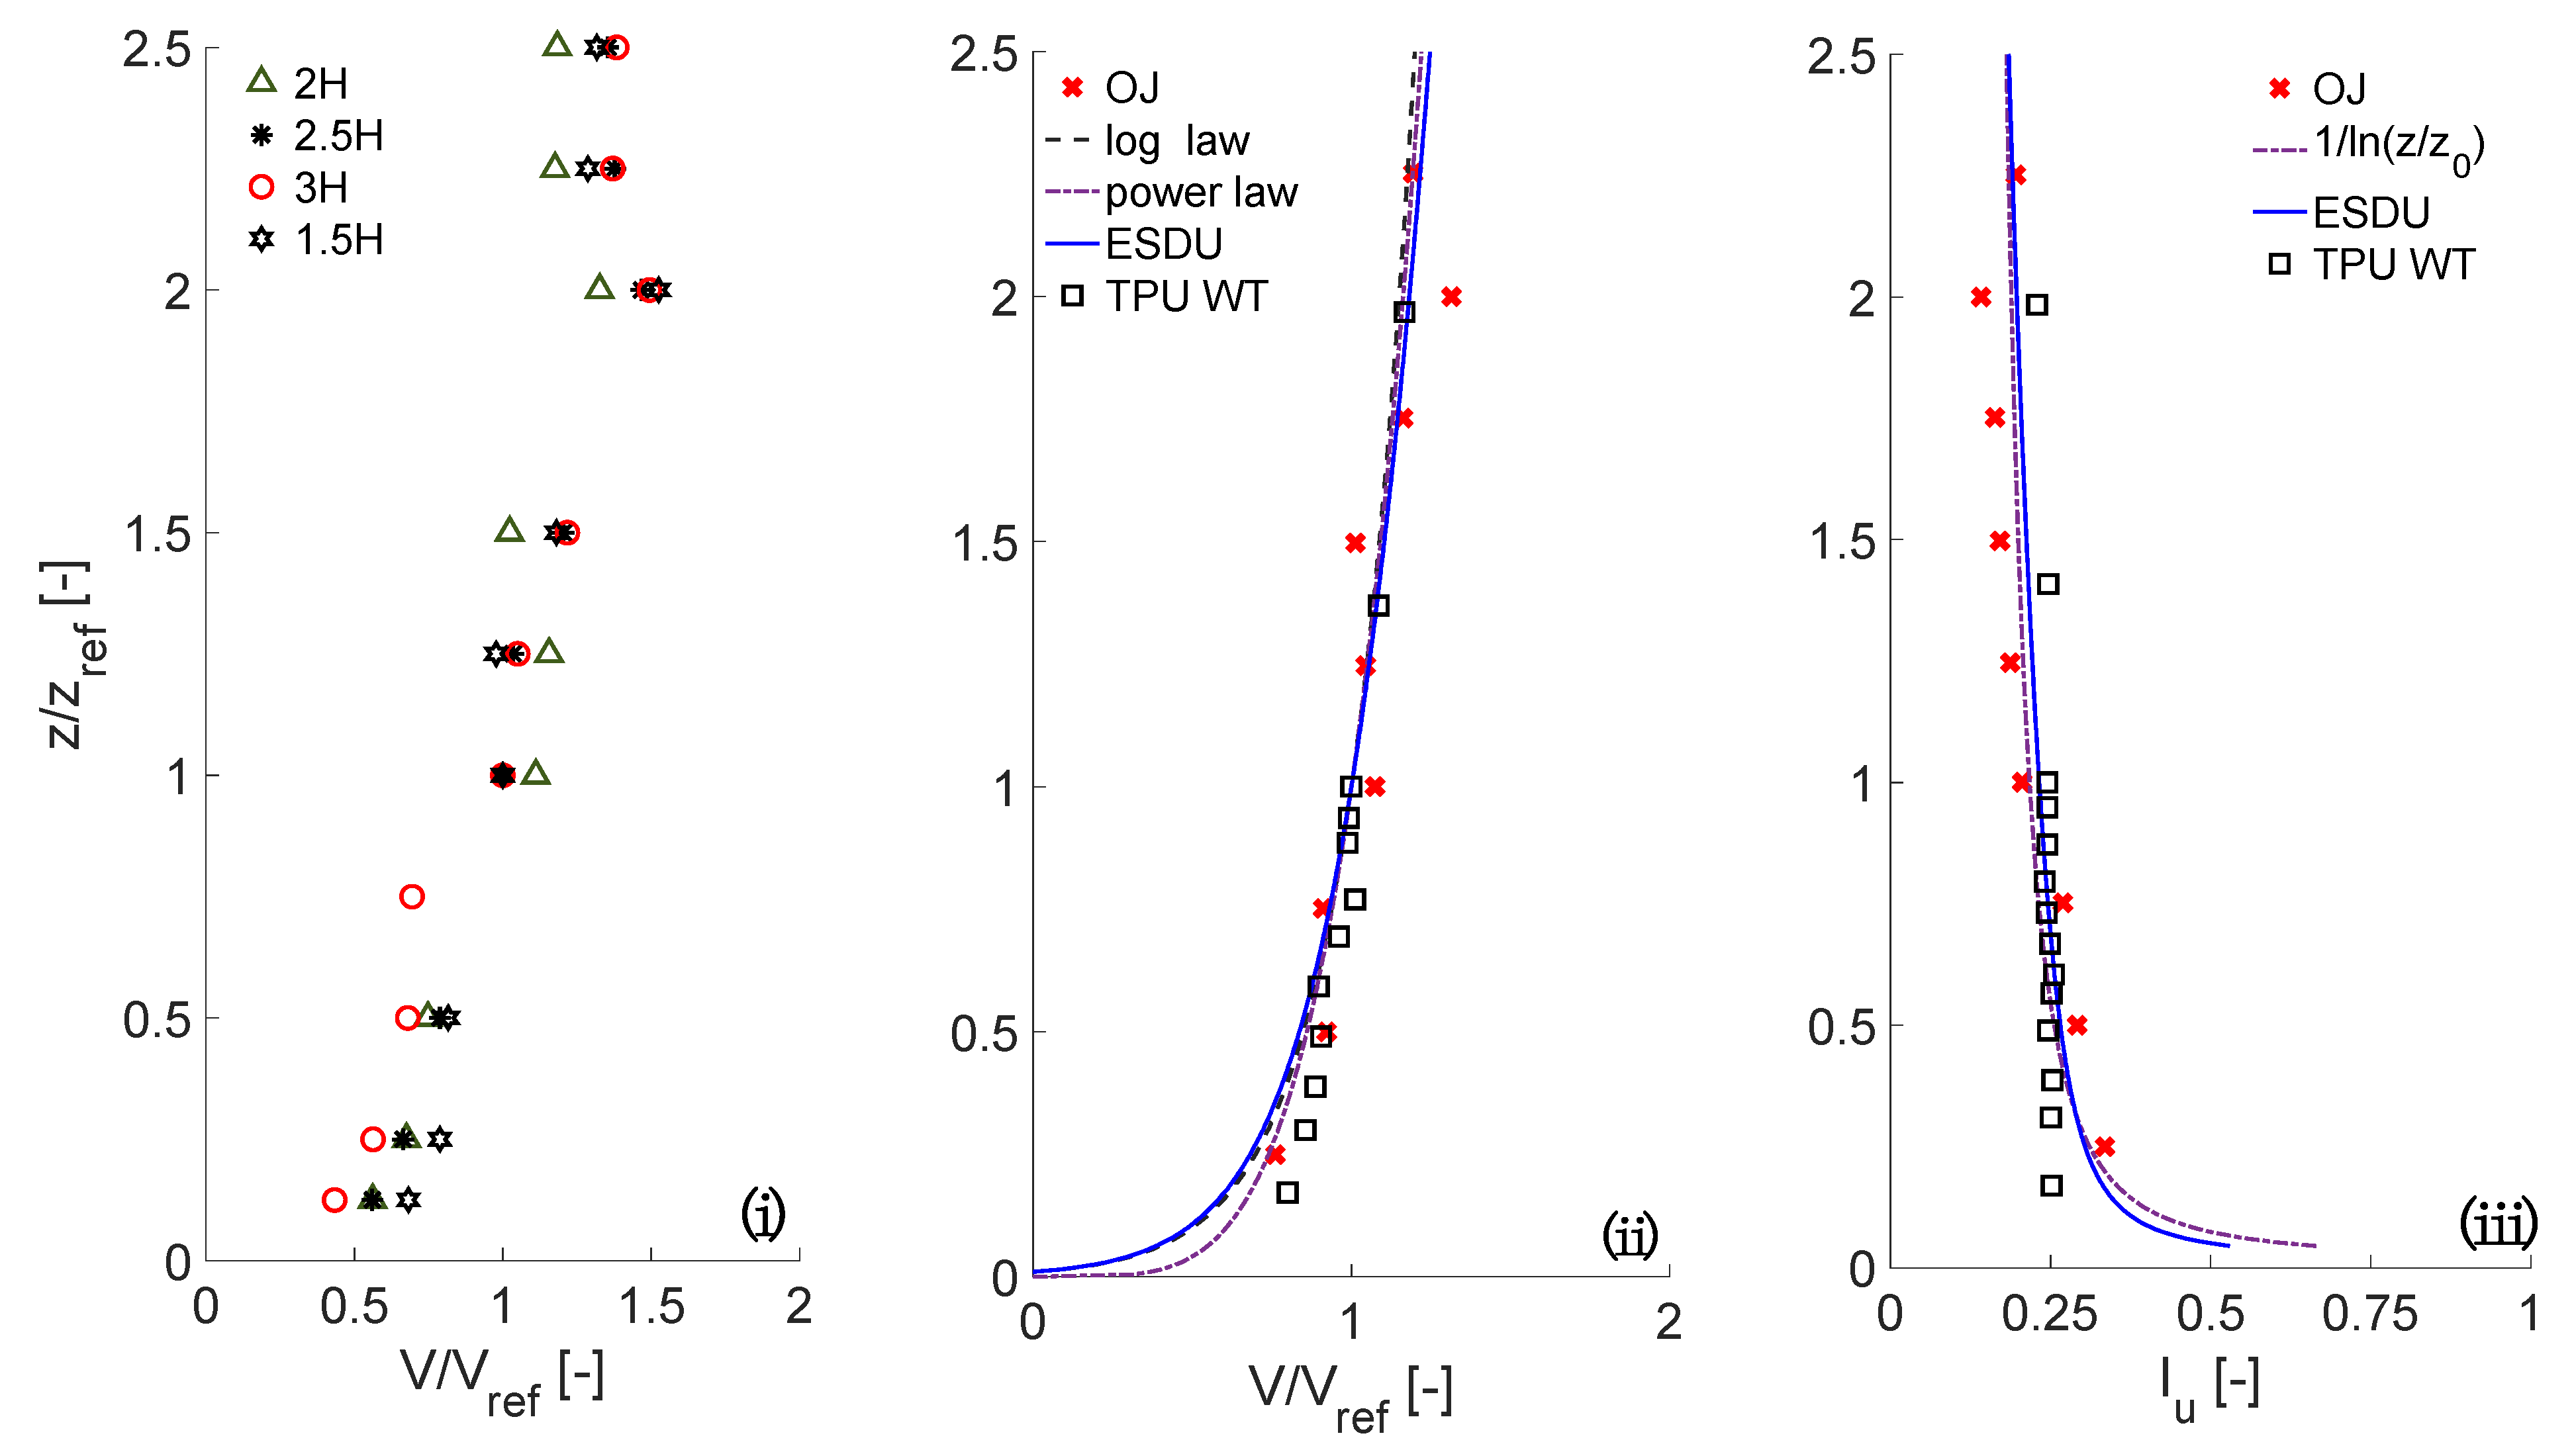
The Open Jet at the Windstorm Impact, Science, and Engineering (WISE) research facility was analyzed and compared against the Tokyo Polytechnic University (TPU) wind tunnel and Silose full-scale data. The first part of the test was flow validation. The velocity profiles produced by the Open Jet compare well with those produced by the TPU wind tunnel, and the theoretical Log law and Power law profiles are shown in Figure 3 [51]. The same logarithmic velocity profile was used for the experiment described in this paper. Full-scale velocity profiles follow the characteristics of atmospheric boundary layer (ABL) flow. Two characteristics of ABL flow are a logarithmic velocity profile and turbulence intensity profile, both dependent upon z0 and the height, z, measured from the ground [51]. In the following equations, zd represents zero displacement, and k represents the von Karman constant [51].
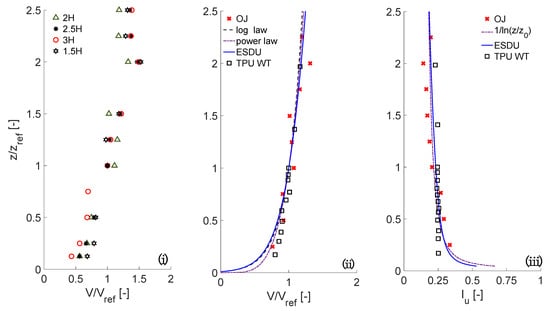
Figure 3.
Along-Wind Velocity and Turbulence Intensity Profiles: (i) Variation in Mean Wind Velocity at Various Locations (1.5 H, 2 H, 2.5 H, and 3 H) in the Open-Jet Environment; (ii) Comparison of Mean Velocity at an Optimal Location (2 H) in the Open-Jet Facility, Wind Tunnel, and Theoretical Profiles (Log Law and Power Law); (iii) Profiles of Turbulence Intensity.
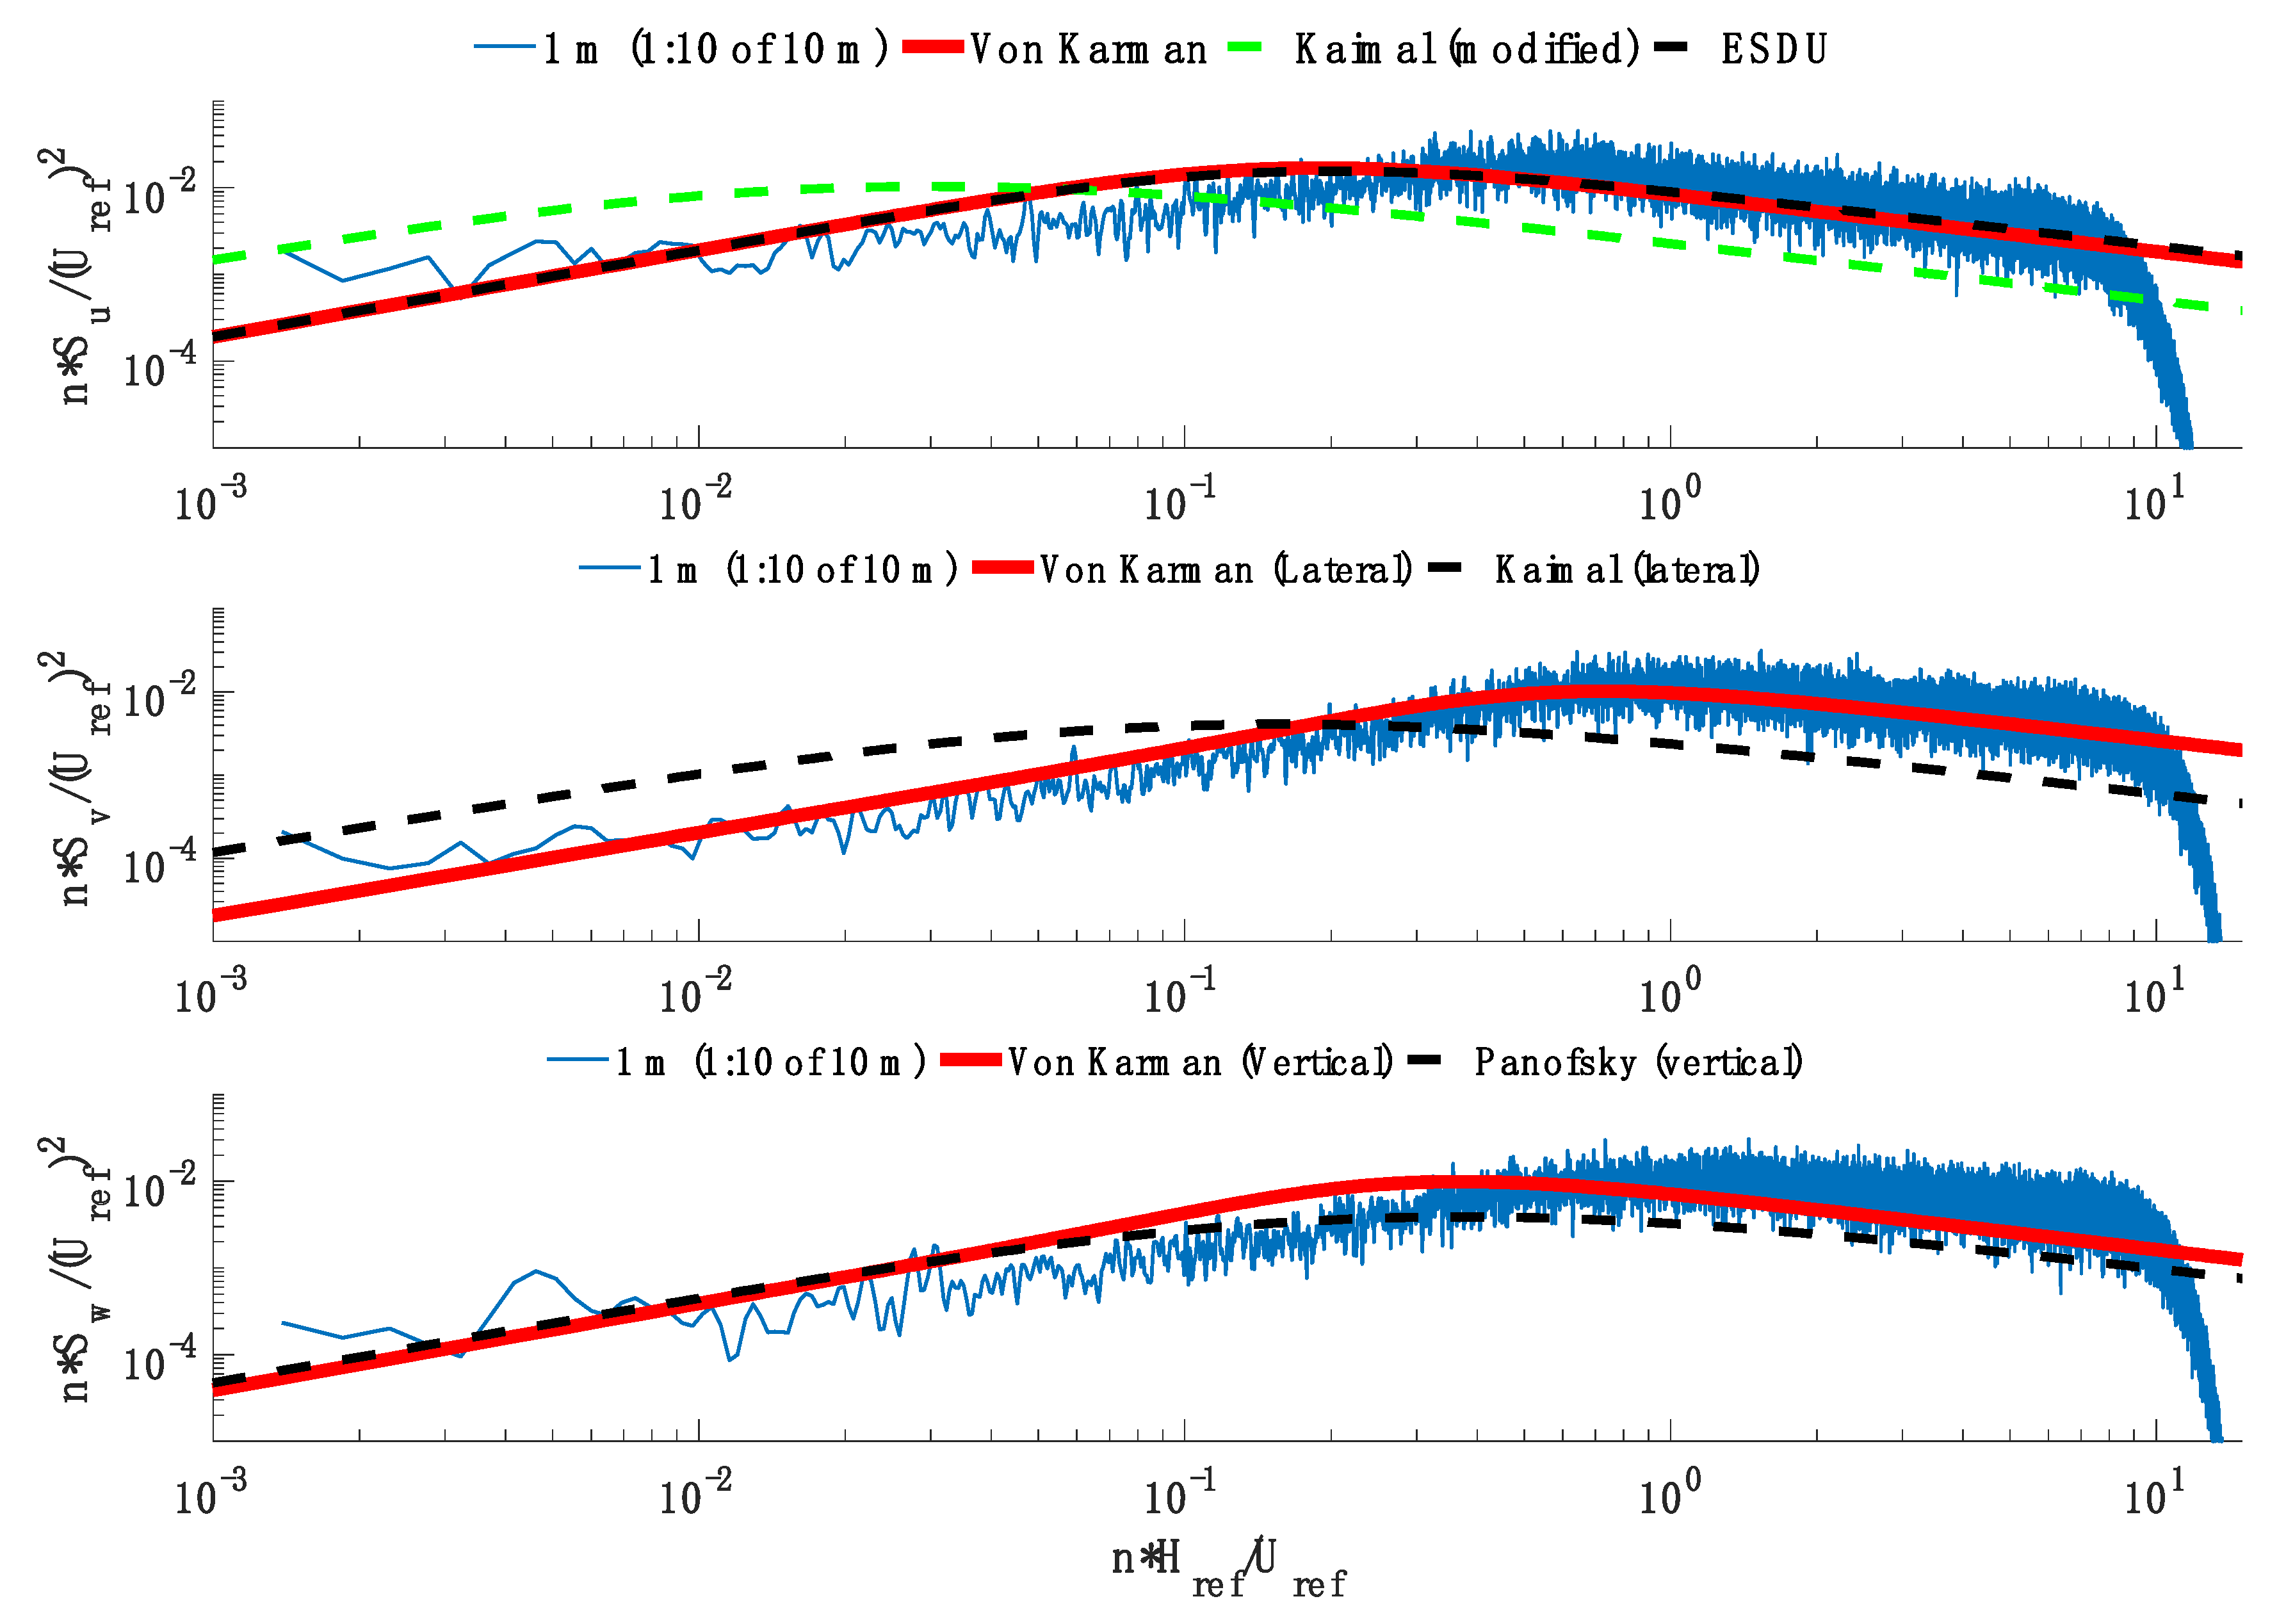
The successful validation of ABL flow characteristics against established theoretical spectra (Von Karman, ESDU) provided the qualitative confidence required for large-scale physical modeling. The next step in flow validation is determining the velocity spectra of the flow. It is typically seen that wall-bounded test sections fail to produce large-scale turbulence (low-frequency content) at large scales [52]. Proper ABL flow contains both types of vortices. The velocity spectra of the Open Jet were shown to match well with the theoretical von Karman and Engineering Sciences Data Unit (ESDU) spectra (Figure 4). These results showed that the Open Jet matches full-scale ABL flow excellently [51,53].
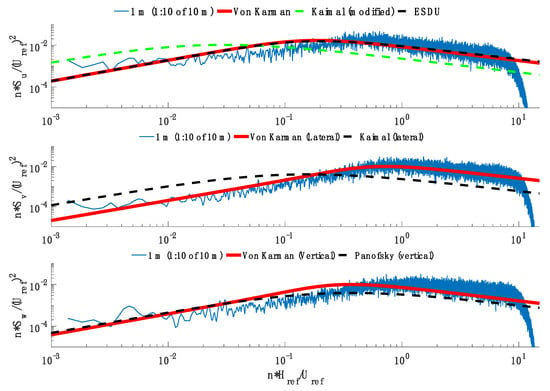
Figure 4.
Velocity Spectra Comparison. Measured velocity spectra for three components (u, v, w) at a height of 1 m within the open-jet facility compared against theoretical models (Von Karman, Kaimal, ESDU, and Panofsky) to validate ABL flow characteristics. The measured spectra, taken at a height of 1 m, are non-dimensionalized relative to the reference height Href (10 m) and reference velocity Uref to align with standard ABL theoretical models.
The second part of the experiment was to determine where to place models from the exit of the Open Jet. The pressure coefficients depend on the model’s location from the fans. Higher peak and mean pressure coefficients were recorded when the model was closer to the fans due to the large-scale turbulence. Two scale models were tested at various distances from the fans (1H, 1.5H, 2H, and 2.5H). The resulting pressure contours were compared to the Silose full-scale data. Based on the results, it was concluded that large-scale models should be tested further away from the fans, while small-scale models should be tested closer [51]. From these findings, the model was placed at 1.75H from the fans for this experiment.
Rocchi et al. [36] studied the pressure distribution and global forces acting on a streamlined single-box girder. Both wind tunnel and CFD analysis were used to analyze the static forces. The wind tunnel tests were performed at the Politecnico di Milano (Polimi) wind tunnel. The model developed by Rocchi et al. [36] was 2.91 m long and 1 m wide, having an overall height of 0.13 m. The model is a 1:30 scale representation of a long-span bridge. No barriers or handrails were modeled at the top of the deck to allow for the aerodynamic forces to be derived directly through the integration of the pressure distribution. Seventy-eight pressure taps were placed in one ring around the cross-section at the center of the deck. Additional taps were placed along the span to measure changes in spanwise pressure. Rocchi et al. [36] used a flow speed of 10 m/s, resulting in a Reynolds number Re = 7 × 10⁵.
The open jet has a test section that measures 4 m × 4 m and a mean roof height of approximately 10 m. It is considered a large-scale testing facility, which is vital due to the issues that arise from small-scale testing. These typically include producing lower Reynolds numbers than full-scale, underestimating peak pressures, and inaccurate turbulence distributions.
Because of the large scale of the testing facility, it can be said that the flow generated in the facility has no boundaries. In other words, there is no wall interference on the flow and no flow acceleration due to constrictions. The tunnel open jet has four fans that can each run separately from the other with attached turbulence adjusters. Both the fans and turbulence adjusters contribute to the velocity profile of the wind being produced. They allow for the ability to produce a very controlled flow. Cobra probes are used to measure velocity. They are placed upstream from the tested model and can measure real-time pitch, yaw, and local static pressure.
5.2. Test Model
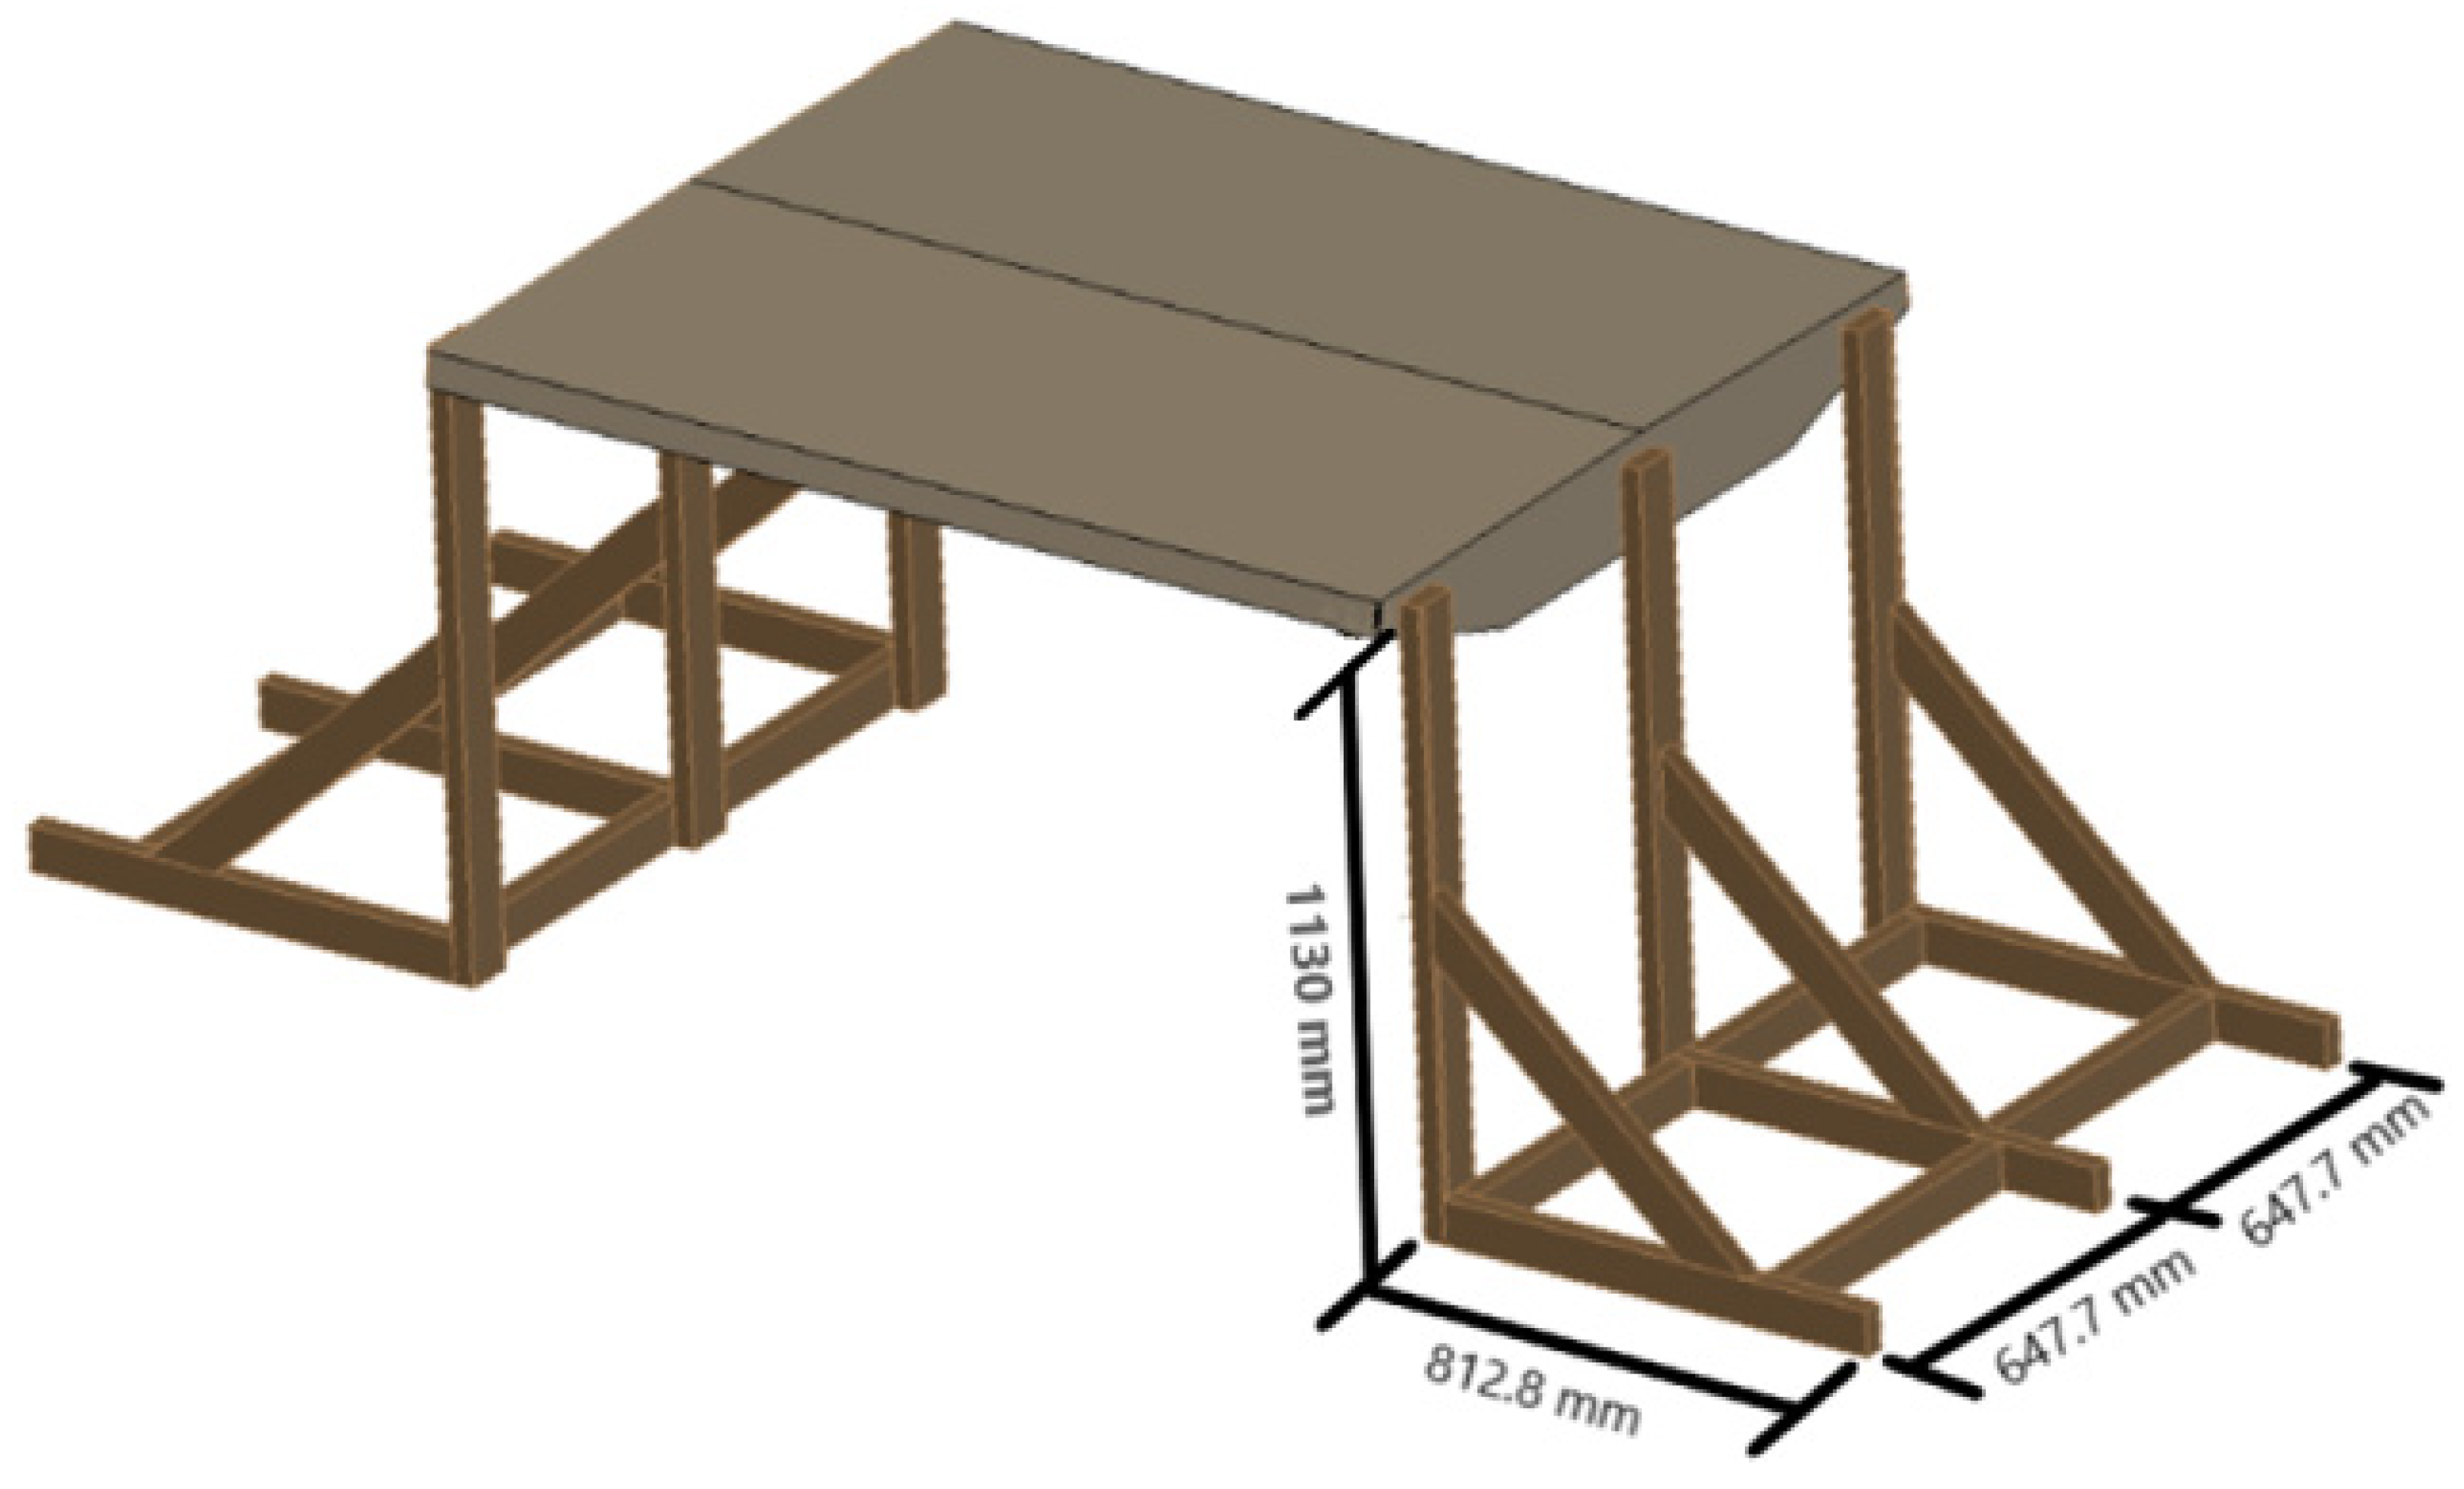
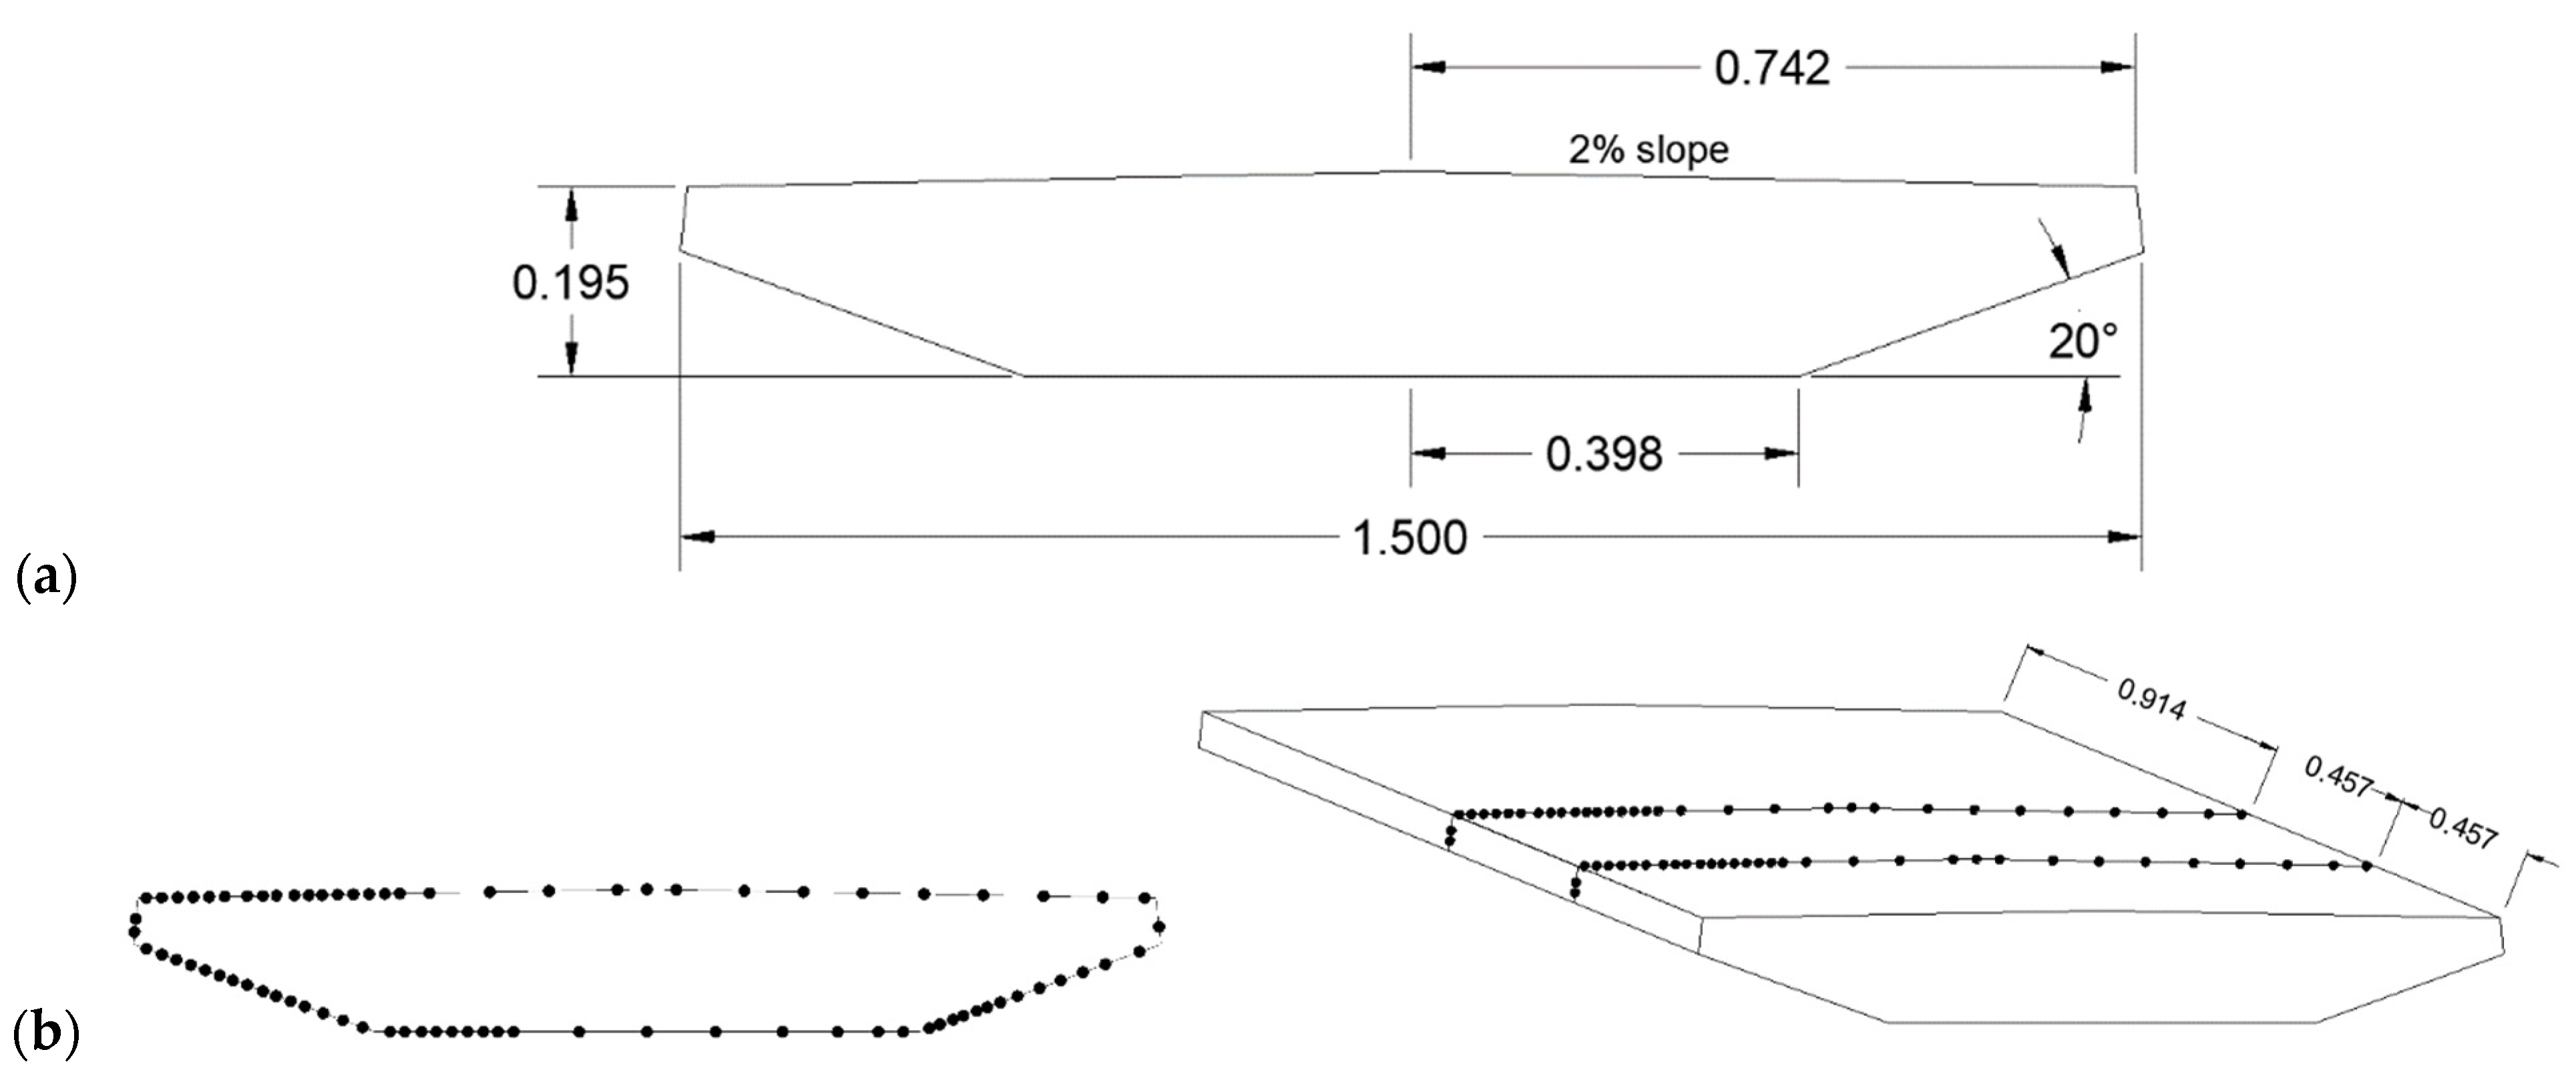
The model for this study is based on the model developed by Rocchi et al. [36]. However, it has been scaled up to be a 1:20 scale model. The overall width of the deck is 1.5 m, the length is 1.828 m, and the height is 0.195 m. The deck is elevated so that the center of the deck is 1.13 m above the ground.
The height of the deck was chosen to provide unconstrained flow under the deck and keep the deck at a manageable distance above the ground for better accessibility. In order to elevate the section, a support frame was built out of wood lumber, as seen in Figure 5. Three vertical supports were placed on either side of the deck with cross-bracing in between to provide stability during testing. Large plywood sheets (1.22 m × 2.44 m) were also used to counteract possible instances of crossflow to keep the flow two-dimensional over the deck (2-D model).
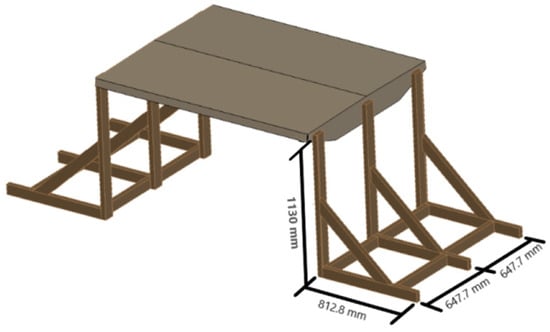
Figure 5.
Schematic Representation of Deck and Supports.
The deck model was constructed using wood lumber for the interior frame with 6.35-mm thick plywood placed on top, as seen in Figure 6. When building the model, special care was taken in designing an internal frame that allowed for structural integrity and easy access to the pressure taps. Three vertical pieces of 50.8 mm × 101.6 mm lumber were placed in the center of the deck to support the connection of the two top panels. The 2 × 4 s that make up the exterior portion of the frame were cut at the exact angles required for the model to make attaching the plywood panels easier. The edges of the plywood were cut to match the exterior angles of the deck and allow for a seamless connection.

Figure 6.
Model Framing: (a) Internal Frame; (b) Exterior Plywood; (c) Assembled Model.
Two rings of 78 pressure taps were placed at the half and fourth points along the length of the deck, as shown in Figure 7. The ring at the half point was numbered 1–78, while the ring at the quarter point was numbered N1–N78. The tubes were labeled and grouped for three different connectors to get the pressure data to the scanner modules. Connector 1 comprised all the pressure taps at the top of the deck, 1–31 and N1–31. Connectors 2 and 3 contained the rest of the taps for each ring, N32–78 and 32–78, respectively.
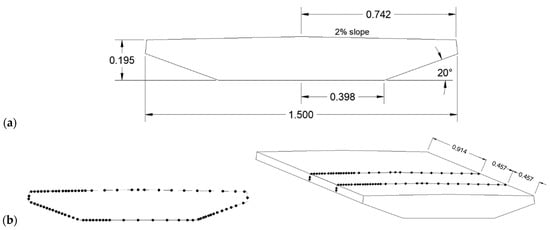
Figure 7.
Model Dimensions: (a) Model Dimensions; (b) Pressure Tap Layout.
Two Cobra probes were used to measure flow velocity. One was placed upstream of the model and the other downstream. Both were placed at the center height of the deck. The two doors at each end of the tunnel were opened to full height, ensuring there was no flow constriction. A vacuum was used to check that each pressure tap was placed in its proper location and attached to the correct connector. Tape was placed at every plywood connection to seal the model tightly. Lastly, before the test, the area was cleaned so that no debris was present to affect the results. The test lasted approximately 5 min, and the exact atmospheric pressure, air temperature, and relative humidity were recorded at the time of the test. Figure 8 shows the final setup of the model.

Figure 8.
Experimental Setup Configuration. Detailed view of the 1:20 scale bridge deck model placed at 1.75H from the open-jet exit, showing the support frame, plywood cross-flow prevention sheets, and upstream Cobra probes.
5.3. Results
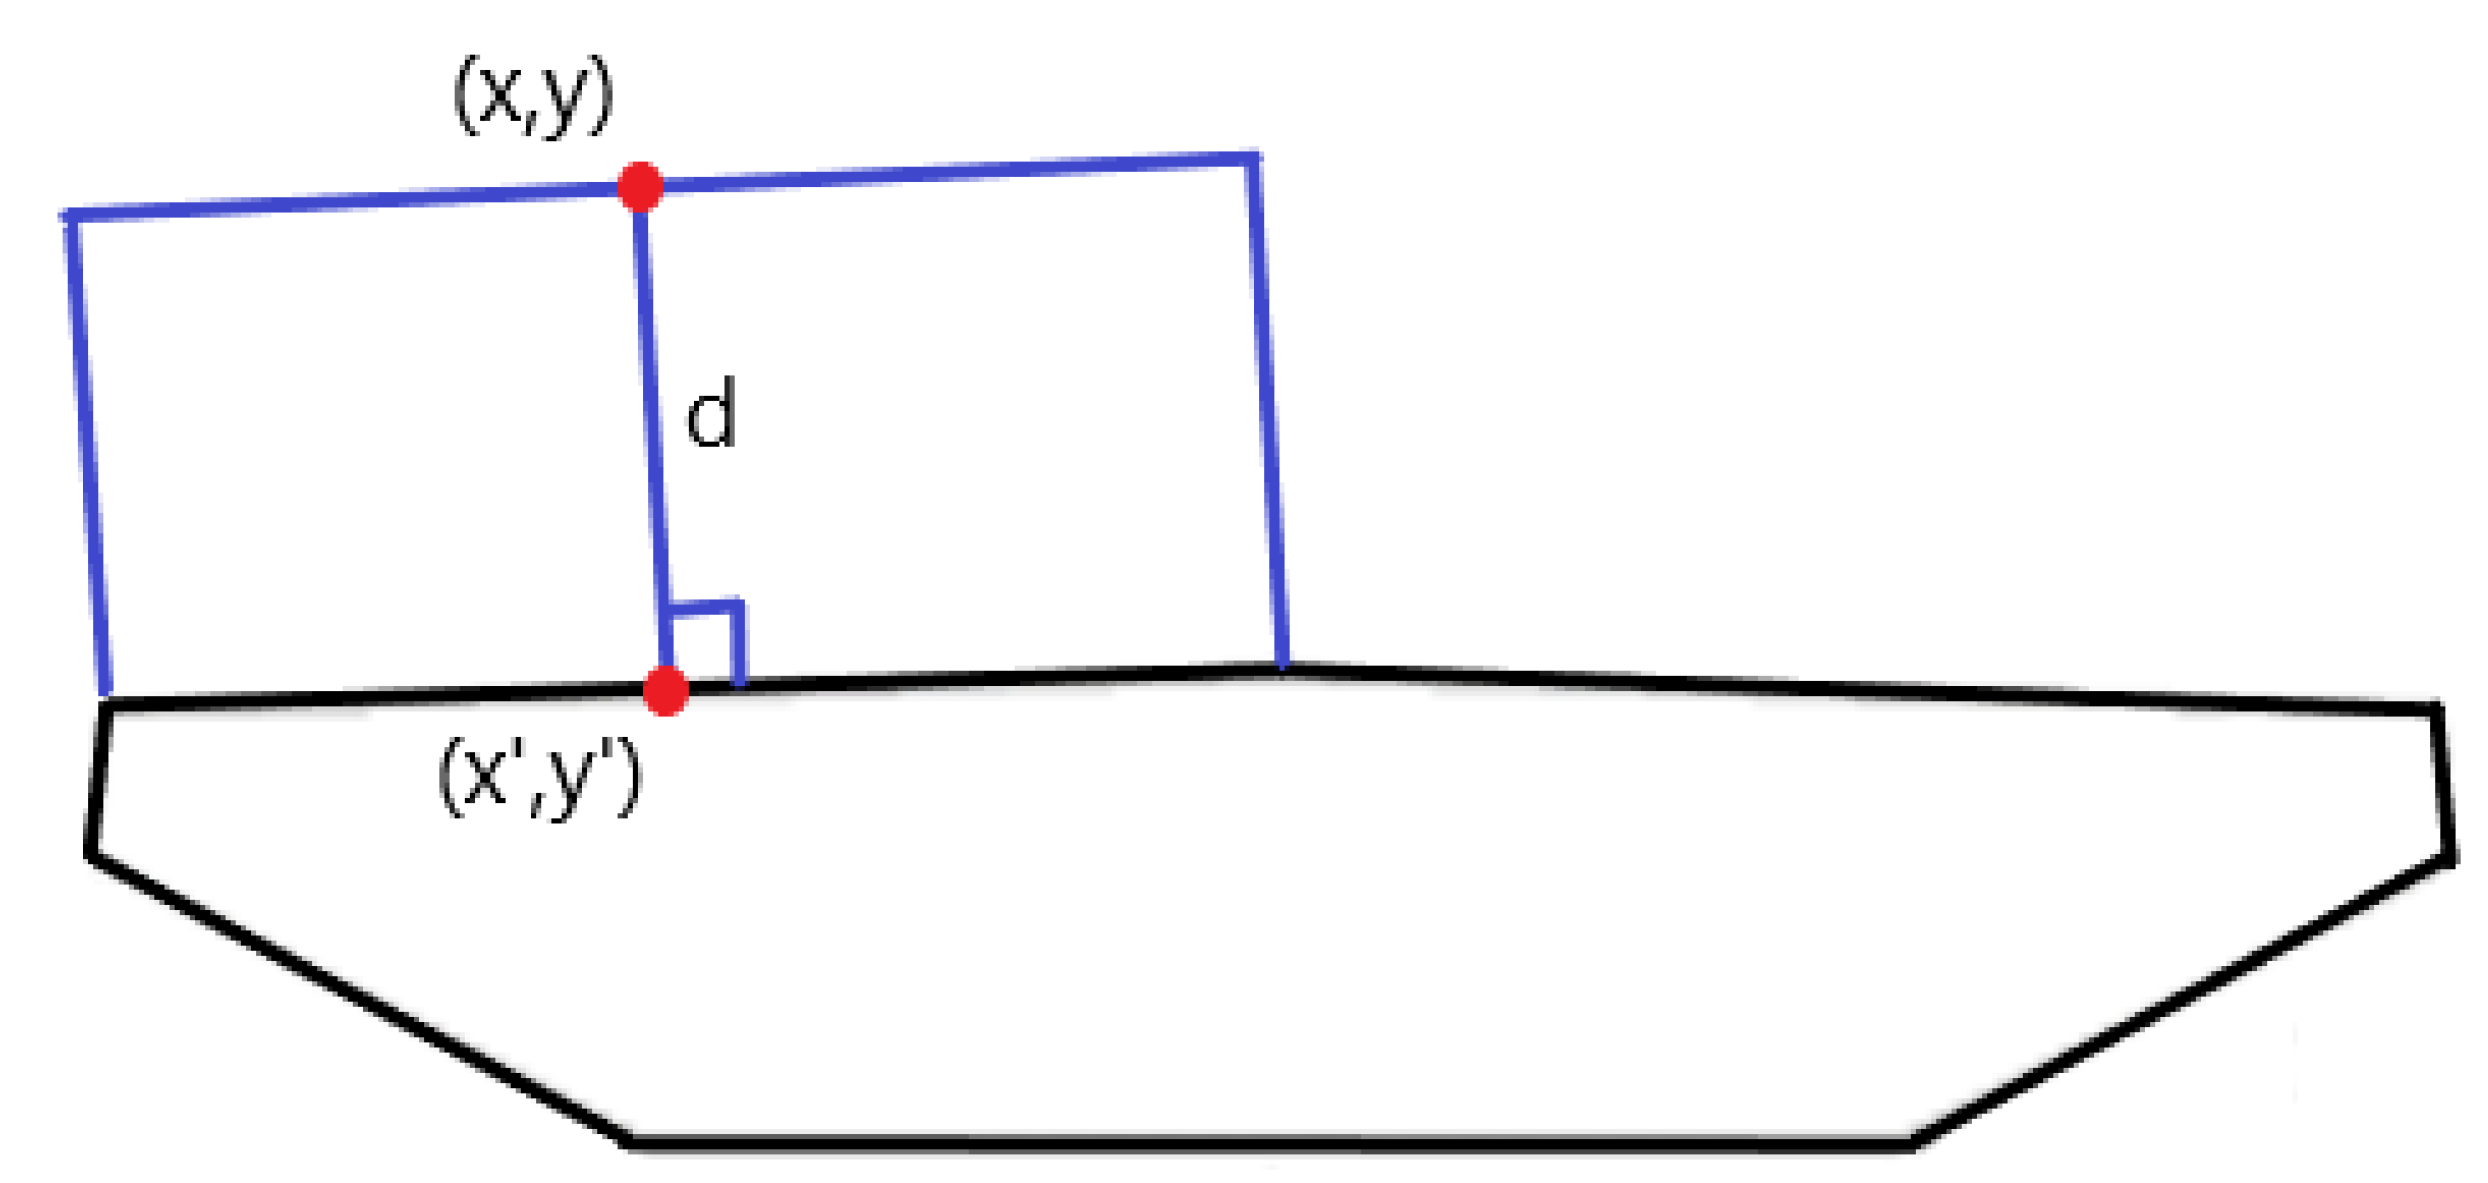
Data produced from the test were organized and analyzed using MATLAB (R2023a). The code uses average pressure coefficients derived from the pressure tap readings and plots them perpendicular to the angle of inclination of each face of the deck. The following equations served as the code’s basis (Figure 9):
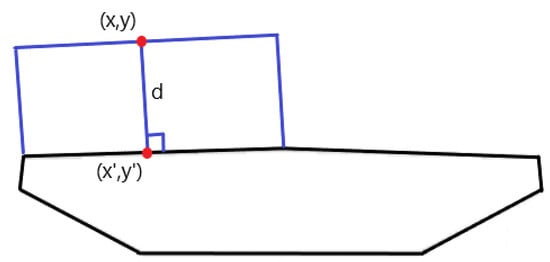
Figure 9.
Coordinate Representation for Calculating Pressure Magnitudes on Each Face of the Deck.
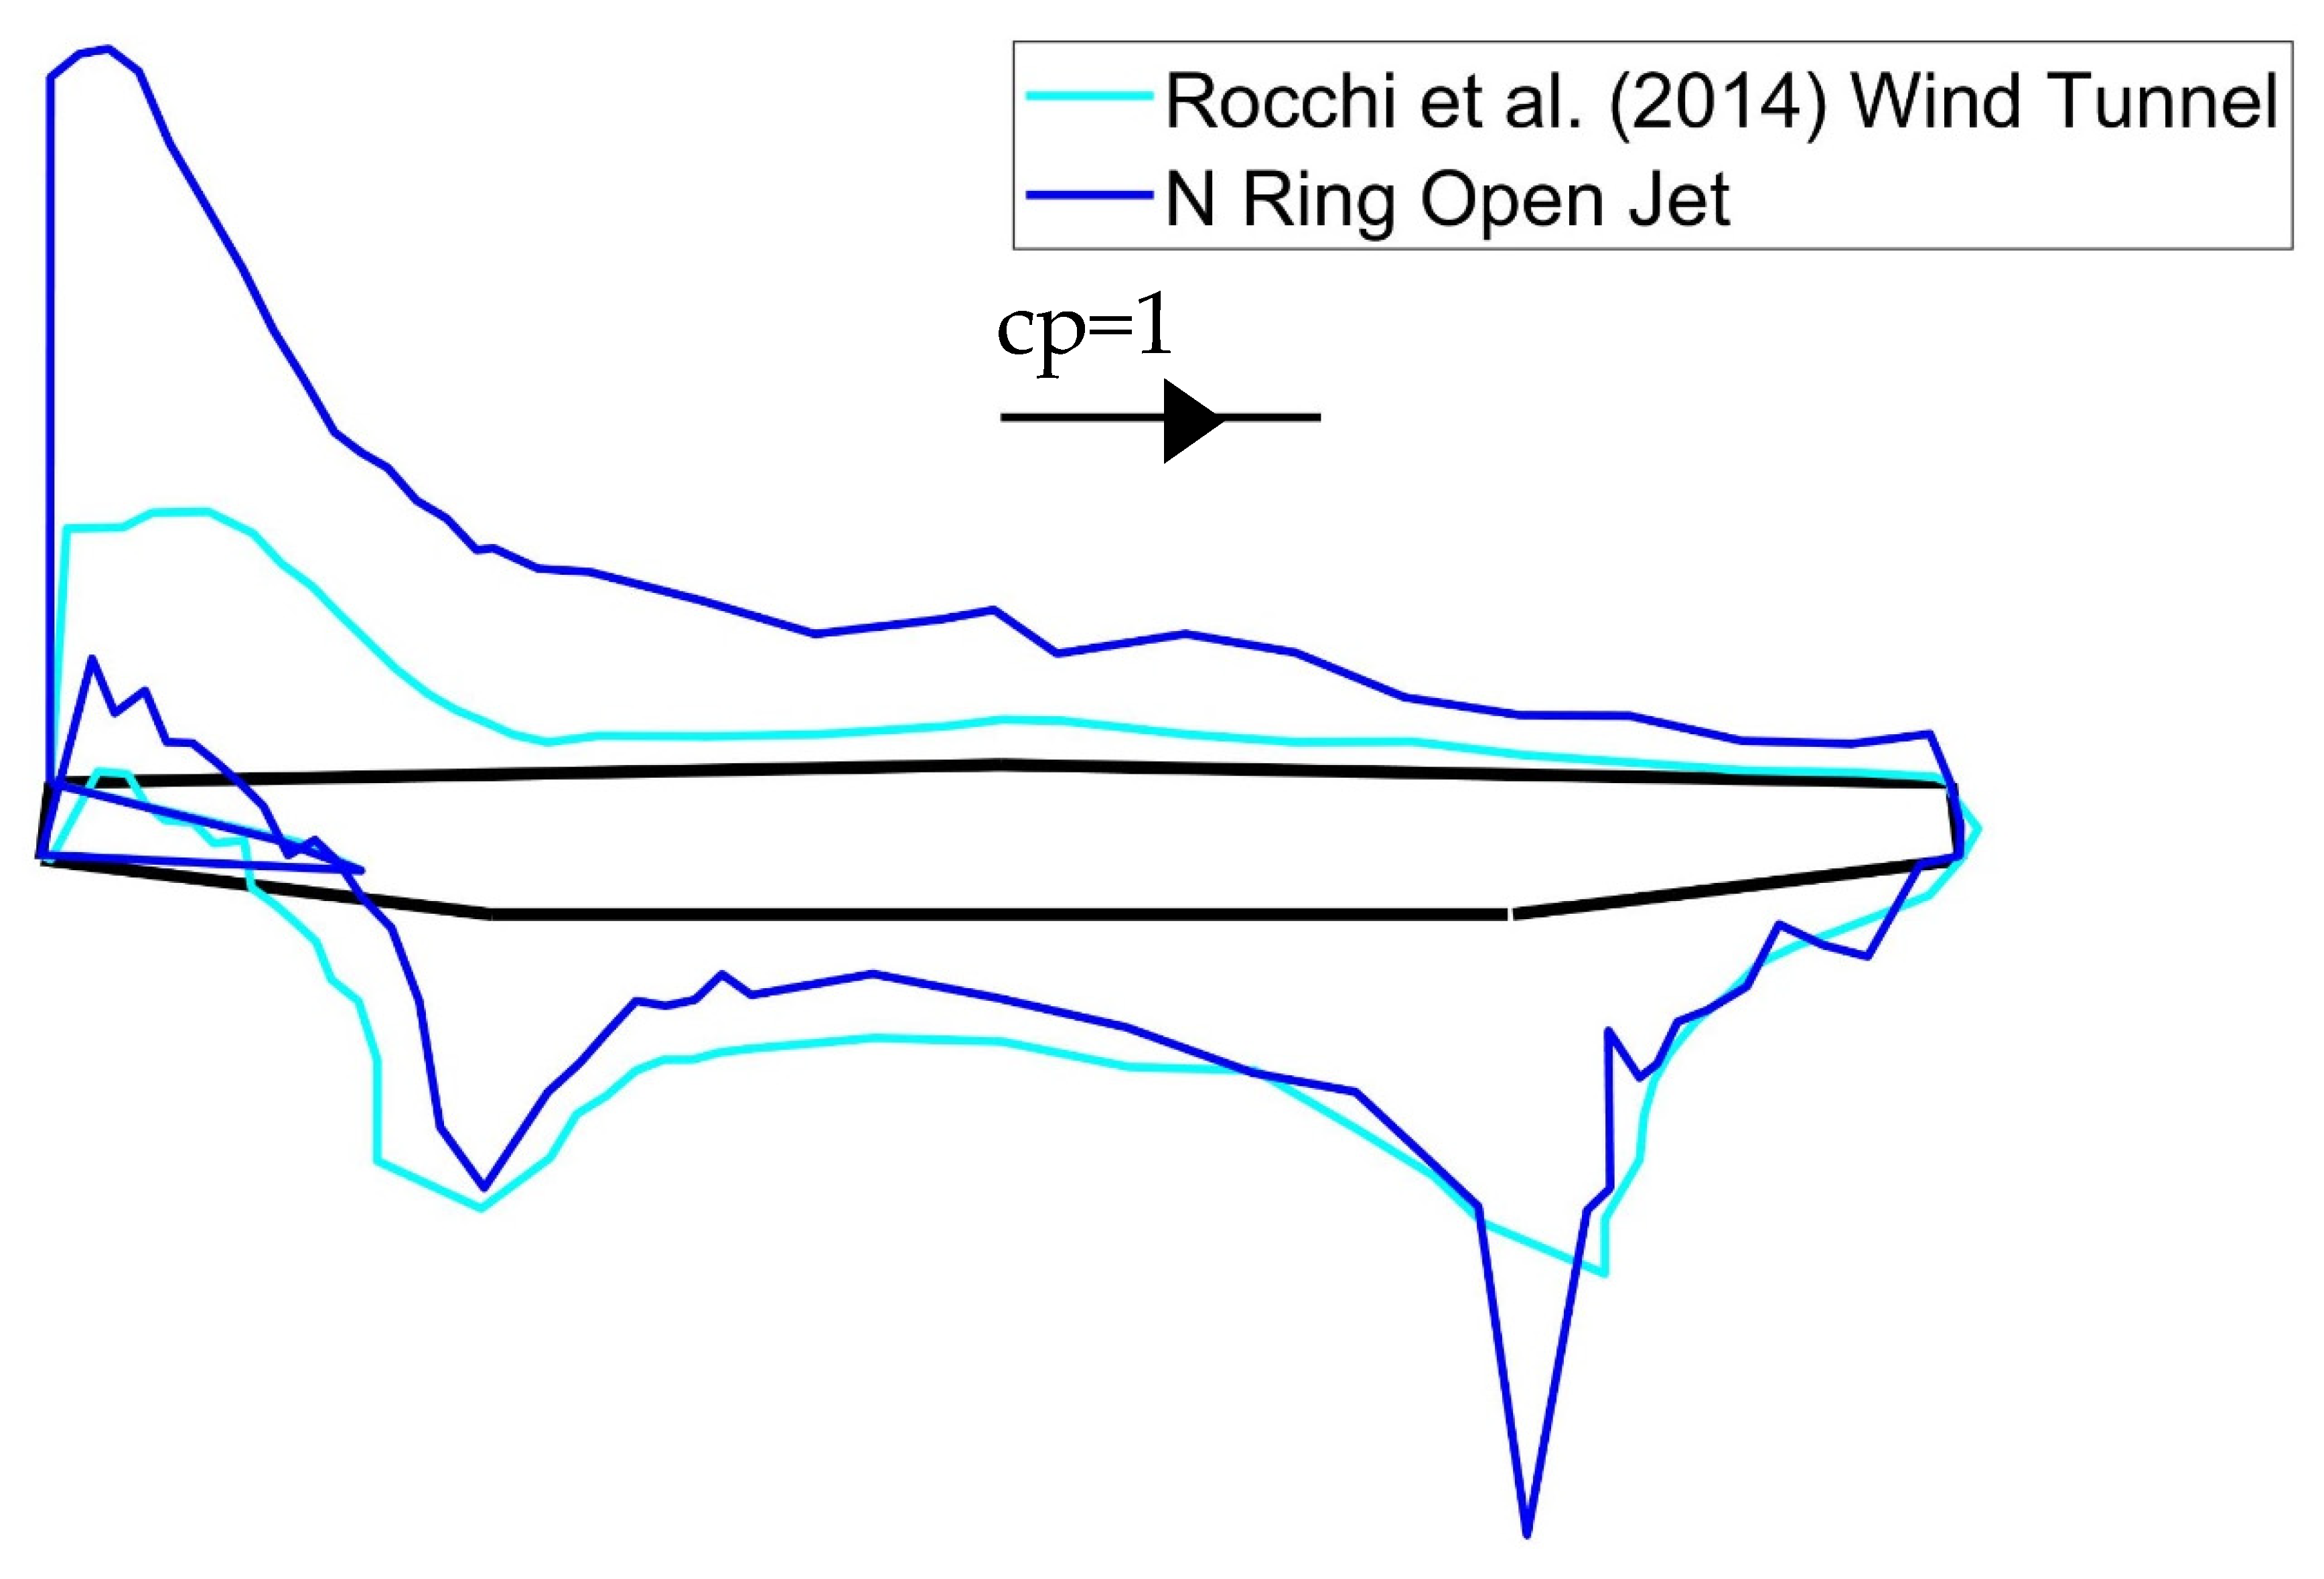
The known values from the open-jet tests are pressure coefficient magnitude, d, and placement along the deck, x′. y′ can be calculated for each x′ value from the known slope, m, of each face of the deck. By rearranging the above equations, both the x and y values of the pressure coefficient, with respect to the deck, can be calculated. From this, a pressure field around the deck can be seen in Figure 10. Positive pressures are plotted inwards, and negative pressures are plotted outwards. The cyan lines show the location of the point (x′, y′) on the deck and (x, y) in the pressure field. The black arrow labeled cp = 1 is a scale bar that can be used to find the magnitude of the pressure coefficients from any pressure ring.
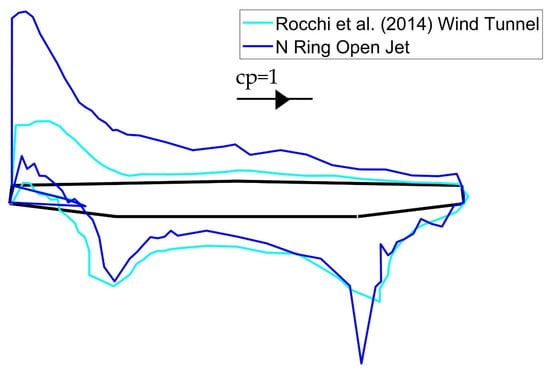
Figure 10.
Comparison of Pressure Field for N-Ring Configuration with Rocchi et al. [36] Results.
The results from the bare-deck model results show a high negative pressure at the windward edge of the deck, which is caused by a sharp change in angle at the leading edge of the deck, producing a large amount of flow separation. The flow separation begins to re-attach to the deck around the mid-point of the deck. The pressure coefficient at the windward face of the deck is positive, and its magnitude is approximately unity due to the flow slowing down to low or zero velocity at the deck face as a result of the face being close to perpendicular to the flow. The angle of the windward face at the deck-bottom also induces positive pressure. The pressure coefficients here never reach 1 because the angle is not sharp enough to create a stagnation point. The bottom of the deck sees mostly negative pressure due to the flow separation induced at the bottom edge. Negative pressure is also seen at the leeward deck face, developed by the flow separation off both the bottom and top deck faces.
A comparison of the results produced in the Open Jet versus those produced in the Polimi wind tunnel is shown in Figure 10. The Polimi wind tunnel produced a Reynolds number around 7 × , while the Open Jet produced a Reynolds number of 1 × 10⁶. This increase in scale and Reynolds number enabled the Open-Jet bare-deck model to record a peak negative pressure coefficient of −2.296, which was 64% larger than the peak coefficient observed in the comparative lower-Reynolds number study. The difference in Reynolds number is due to the increase in length scale from 1 m to 1.5 m, as the scale increased from 1:30 to 1:20. The increased turbulence effects are seen numerically and visually. Numerically, the Reynolds number increased due to the increase in the model scale. As a result of the higher Reynolds number, there is a vortex distribution in the flow that closely resembles the distribution found in full-scale flow. Visually, the effects of the larger vortices can be seen by the much larger flow separation at the leading edge of the deck, which correlates well with a study performed in Ref. [19]. The referenced study found that testing in an open-jet facility induced a more significant flow separation at the leading edge of a low-rise building model compared to the same model tested in a wind tunnel. The study cited a higher Reynolds number due to large-scale testing as the reason for the more significant flow separation. For smaller-scaled models with lower Reynolds numbers, the shear layer has a more significant effect on the flow, which could reduce the magnitude of flow separation due to the effects of friction around the deck. Opposingly, larger models with higher Reynolds numbers would not be as affected.
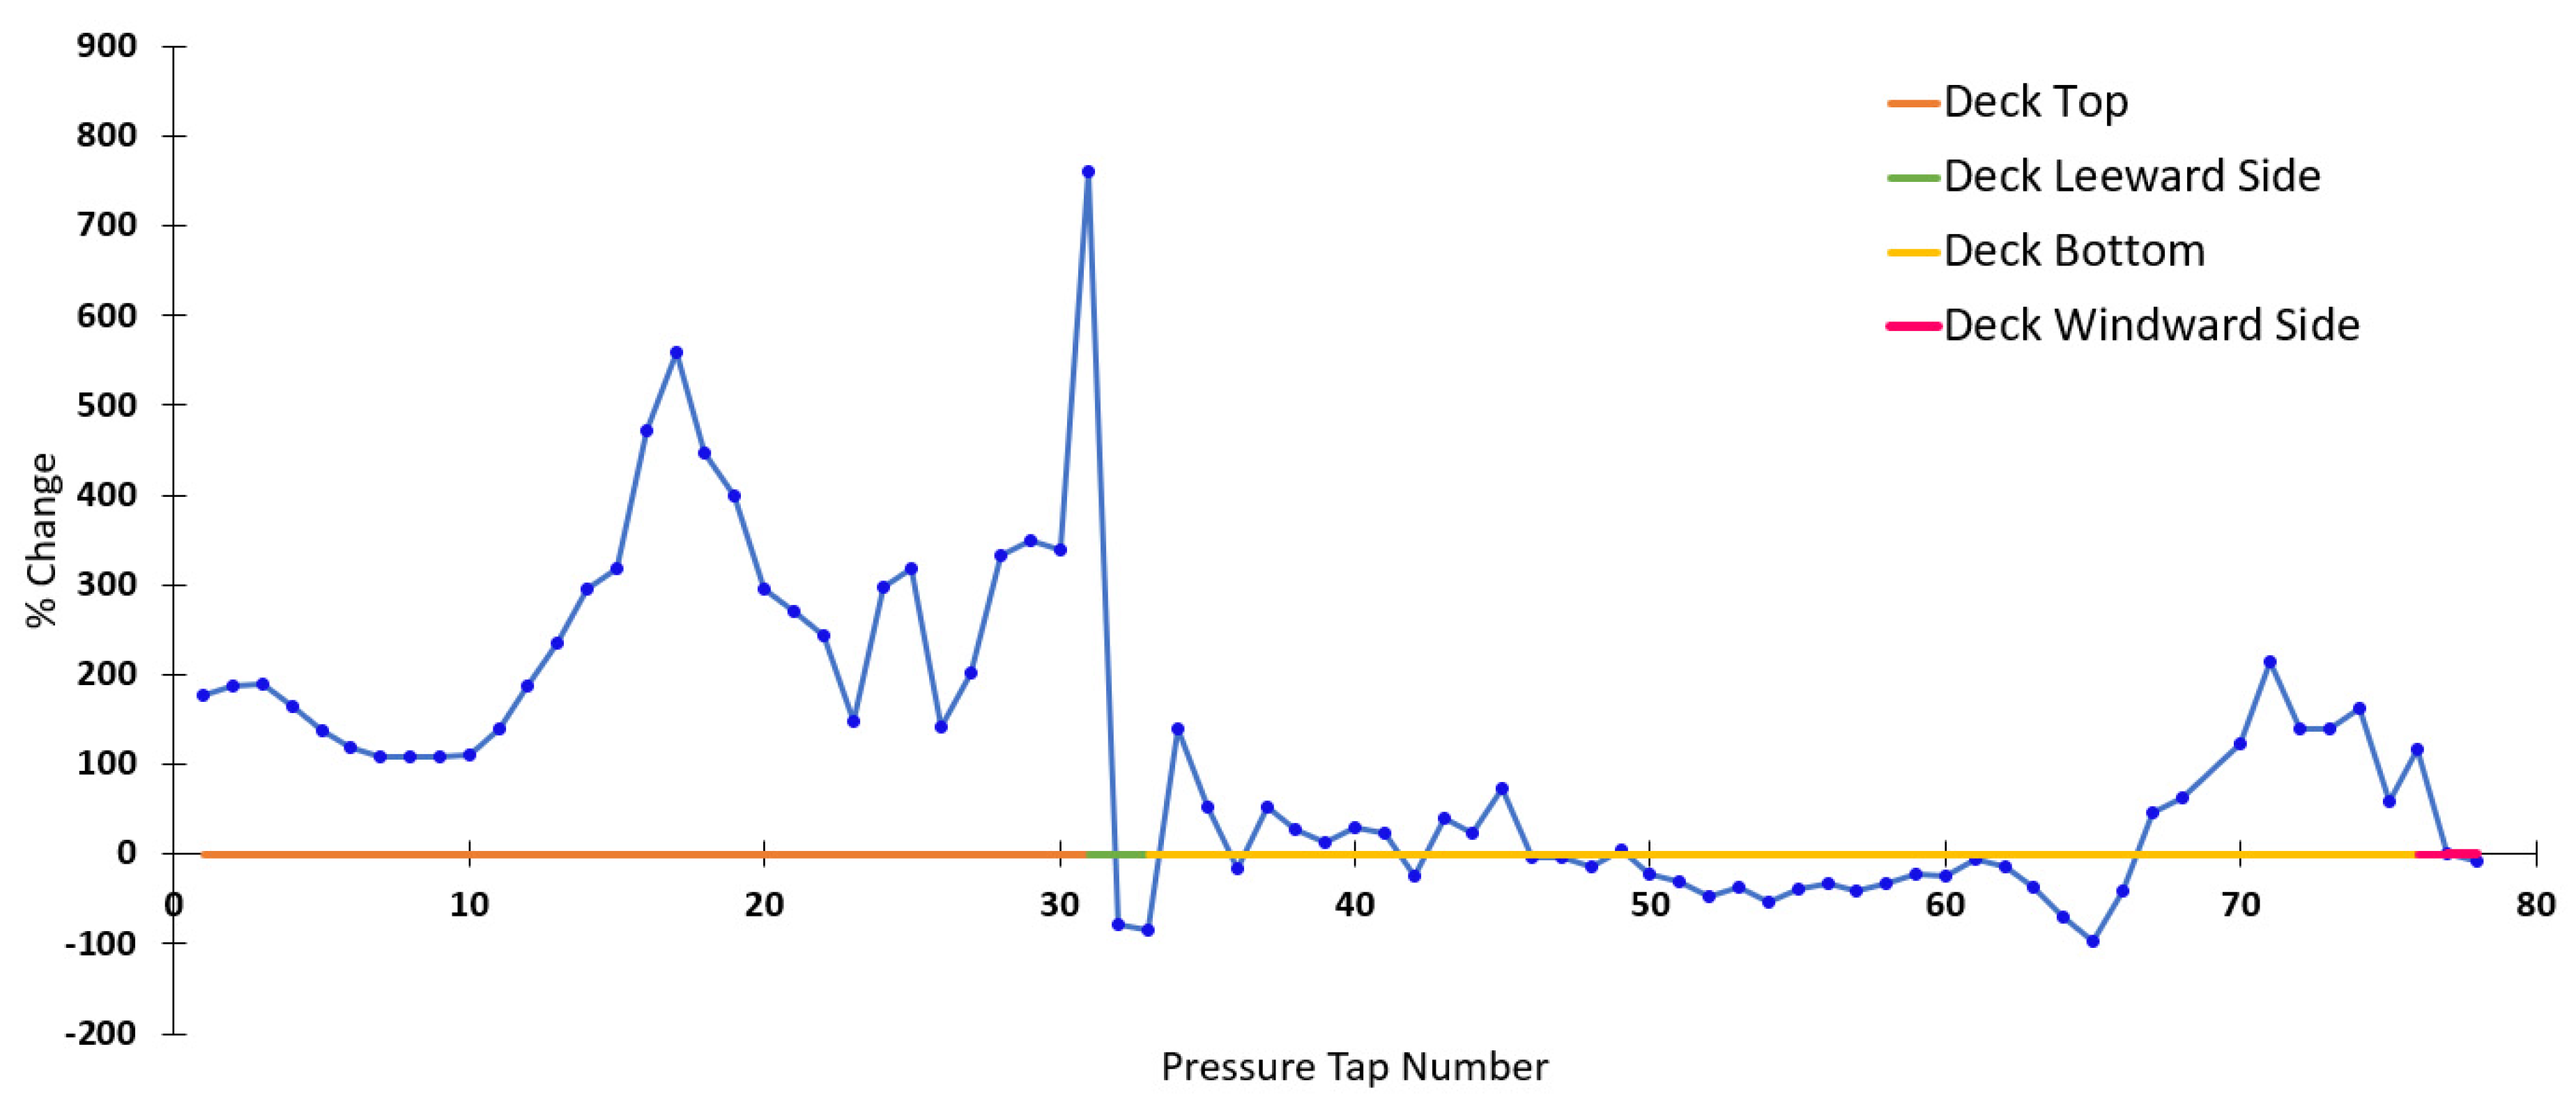
The pressure taps are numbered clockwise starting at the top windward side, as shown in Figure 11, which plots percentage change and highlights regions of discrepancy between the Open-Jet (N-Ring) and Rocchi et al. [36] wind tunnel data. Negative percent change indicates that the Rocchi et al. [36] model produced higher magnitude pressure coefficients. Key measurement points include Tap 31, which represents the highest discrepancy (highest percent change) and corresponds to the endpoint of flow separation on the top deck. Tap 32 is the first location where the open-jet model registers a pressure coefficient with a smaller magnitude than the Polimi model [36]. The region between taps 32 and 66 exhibits the smallest percentage change, representing the leeward deck edge and most of the bottom deck.
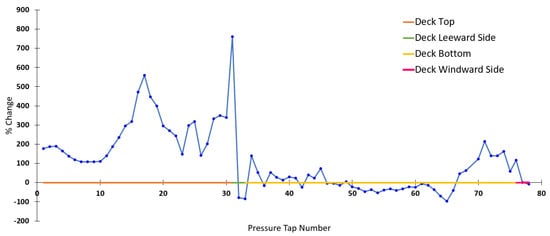
Figure 11.
Percentage Change in Pressure Coefficient Magnitude: Comparison between N-Ring Open-Jet and Rocchi et al. [36] Wind Tunnel Studies.
Interestingly, the highest percent change occurs at tap 31. Tap 31 is the last tap located on the deck top. The lowest-magnitude pressure coefficient for the Rocchi et al. [36] model is measured at this tap. Figure 11 also shows that the difference in pressure coefficient magnitude was most prominent at the top of the deck, followed by the windward-bottom-face. Overall, the deck-bottom and deck leeward-side are the least affected by the change in scale and testing facility. The flow hitting the windward edge of the deck appears to produce the most significant change in coefficient magnitude. As flow-deck interaction occurs, the larger vortices over the top of the deck are maintained, while the bottom can break the vortices into smaller ones. The smaller vortices would be similar to those produced in a typical wind tunnel, so the magnitudes have the slightest percent change in that deck section. The deck windward-side has the stagnation point; therefore, the pressure readings in this location will always be similar if there are no changes in geometry.
The case study for this experiment defined the flow properties used by the Open Jet. The flow properties were developed to produce ABL flow that correlated well with full-scale models. The open-jet model produced higher windward-edge pressures than the Rocchi et al. [36] model. Multiple factors caused this. The Rocchi et al. [36] model was more affected by the shear layer due to its smaller scale. Furthermore, due to the model being tested in a wind tunnel, it can be concluded that larger vortices could not develop because of flow constraints. However, larger vortices could develop in the Open Jet, where they became the catalyst for the more significant pressure coefficients produced by that model.
6. Aerodynamic Mitigation Through Integrated Solar Panel Systems
6.1. Background and Innovative Approach
Traditional aerodynamic mitigation devices (Section 3), such as spoilers and guide vanes, achieve vortex suppression by fundamentally altering the deck geometry and modifying flow separation points. However, their function is solely limited to these mitigation roles, often incurring additional construction and maintenance costs. Building upon the understanding that minor geometric modifications can significantly stabilize bridge decks, this paper introduces the unifying hypothesis that solar photovoltaic (PV) panel systems, strategically designed and integrated, can function as passive aerodynamic mitigation devices while fulfilling the critical role of renewable energy production. In response to the growing global demand for sustainable infrastructure, this paper details this innovative strategy: the strategic integration of solar panels into bridge designs. This approach is designed to provide a dual benefit: both renewable energy production and active aerodynamic mitigation of detrimental wind-induced vibrations. Long-span bridges offer substantial surface area suitable for solar panel installation, which can then power essential bridge features such as lighting and sensors, thereby enhancing the bridge’s operational autonomy and environmental contribution. This interdisciplinary method not only bolsters bridge safety and performance but also directly supports sustainable infrastructure development by harnessing clean energy. While a detailed analysis of economic viability (energy production versus mitigation cost) and structural implications (added weight and potential seismic loading) falls outside the scope of this aerodynamic study, these factors are crucial engineering considerations for real-world application. The material selection and low blockage ratio (4.87%) minimize structural loading, positioning this concept as an efficient, low-impact retrofitting alternative.
For the purpose of this study, solar panels, typically comprising 60 or 72 photovoltaic cells that convert sunlight into 250 to 300 watts of power, were scaled to 1:20 for the models [54]. The scaled width of the panels was approximately 1 m. The 60-cell solar panel has dimensions of approximately 1 m × 1.67 m, while the 72-cell panel is 1 m × 1.95 m. Both are 40 mm thick. For the models in this study, the width of the panel was taken to be the 1 m dimension and scaled down to 1:20, as seen in Figure 12. Arrangement 4 was designed as a dual-panel configuration, incorporating panels on both the top and bottom windward and leeward edges. The top panels, simulating the PV arrays, were set at a 45-degree inclination angle with the photovoltaic cells facing outwards (toward the exterior of the bridge). Crucially, both the top and bottom panels were installed to ensure no flow could pass underneath the panels, effectively sealing the edges against the deck surface. This specific constraint meant that the flow separation point was deliberately governed by the 45-degree angle of the panel geometry rather than the sharp corner of the deck.

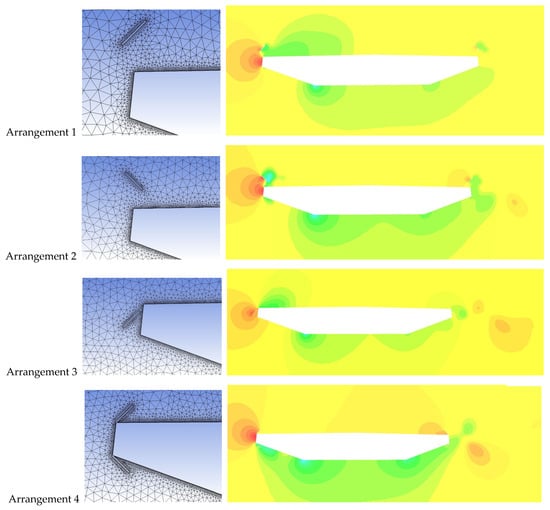
Figure 12.
Integration of Solar Panels with the Bridge: (a) Solar Panel Dimensions, and (b) Arrangement 4 of Solar Panels on the Entire Bridge Section. The contours show qualitative pressure distribution for the 4 arrangements, indicating that Arrangement 4 would result in enhanced stability under aerodynamic forces.
6.2. Experimental Investigation of Arrangement 4 with Open-Jet Testing
Arrangement 4, previously identified for its potential in enhancing both driver comfort and vibration mitigation, was selected for detailed experimental validation within the Open-Jet facility. This specific arrangement incorporated plywood panels positioned along both the leading and trailing edges of the scaled bridge deck model, aligning with its computational design (Figure 13). The physical model featured top panels designed to function as the solar arrays, while the accompanying bottom panels were included solely as geometric countermeasures to induce negative pressure at the deck-bottom face. These bottom panels were critical for achieving the necessary pressure balance by counteracting the high suction forces on the top surface. To facilitate direct performance comparison, the Arrangement 4 Open-Jet model was tested under identical wind conditions as the Open-Jet Bare-Deck configuration. These open-jet results were also cross-validated against the corresponding CFD Arrangement 4 model to assess turbulence closure dependency and scaling effects. The optimal Arrangement 4 configuration was selected because CFD analysis showed that the panels fundamentally alter the shear layer behavior: the leading edge panels reduce the magnitude of initial flow separation while the geometry promotes complete flow re-attachment over the deck top, thus suppressing the Kelvin-Helmholtz vortices that contribute to vibrations (See Figure 12). This optimized geometry effectively simulates the beneficial streamlining effect typically achieved by dedicated aerodynamic fairings, yet provides a distinct, dual-purpose functional outcome.

Figure 13.
Layout of Open-Jet Model Panels: (a) Deck-Top Panel; (b) Deck-Bottom Panel; (c) Overall View.
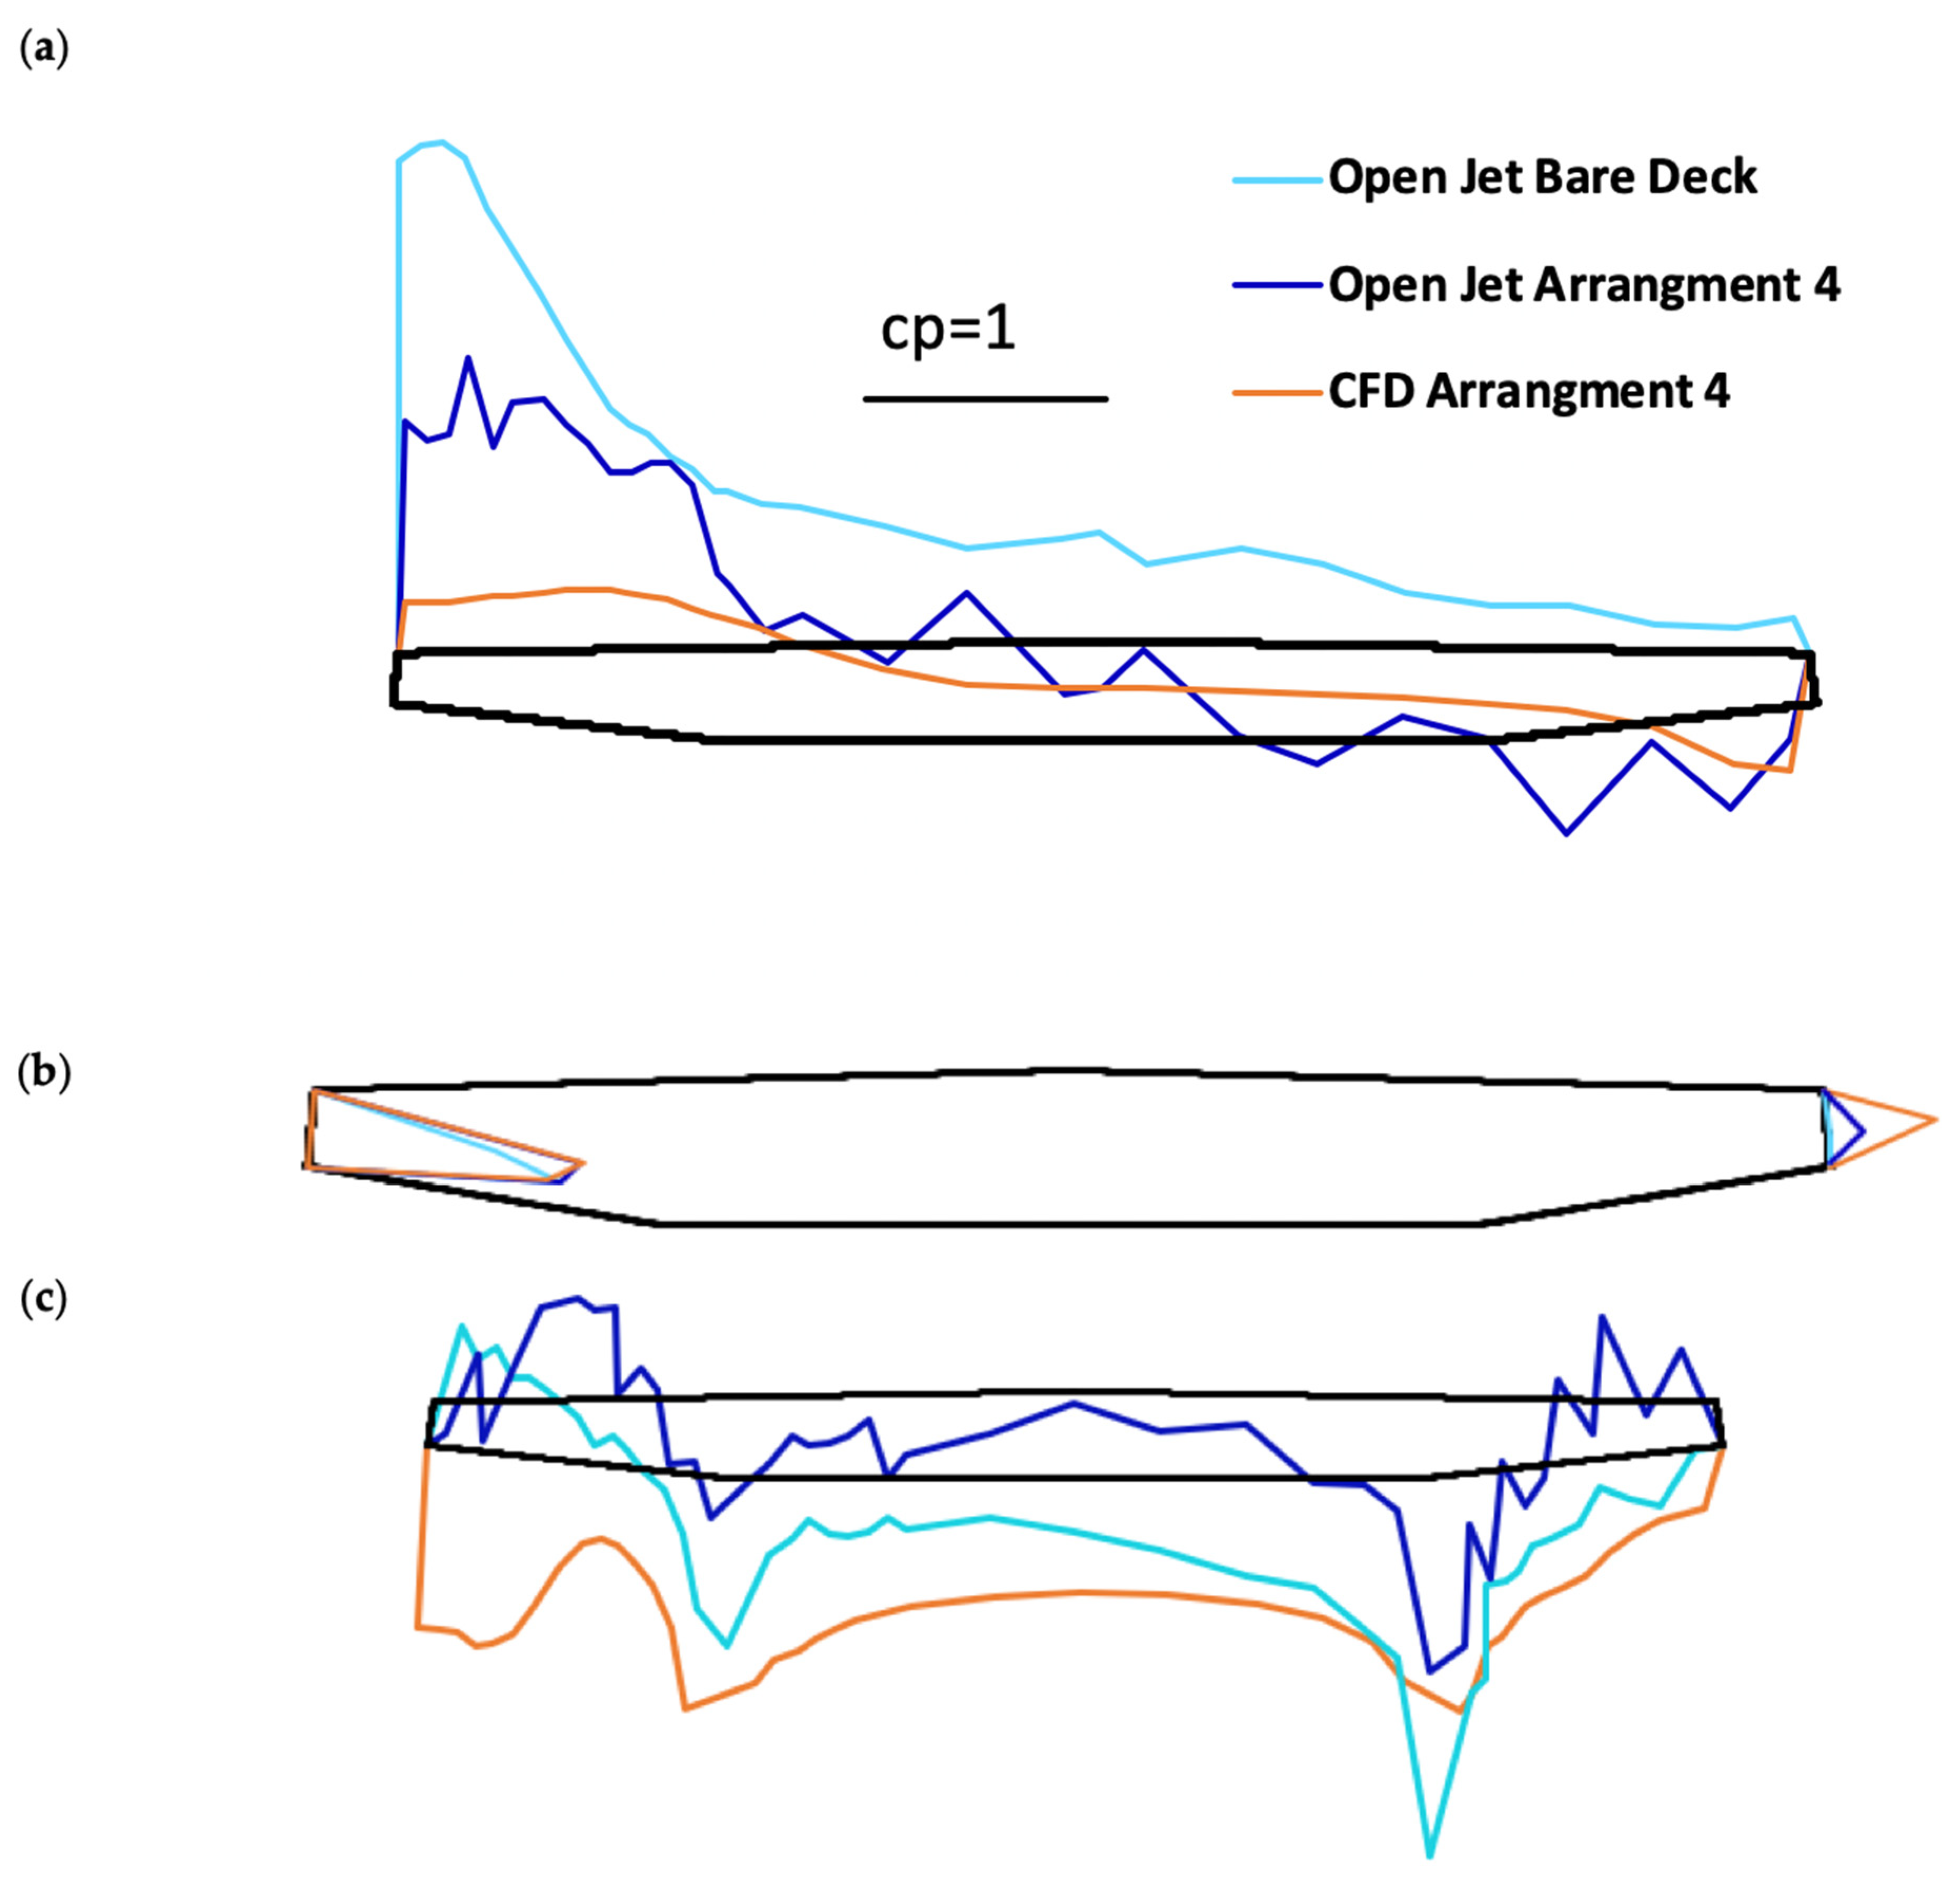
Comparing Arrangement 4 CFD versus open-jet shows that the deck-top pressure coefficients follow the same trend overall (Figure 13). While the open-jet model measures higher pressure coefficients over most of the deck-top, both models show the flow re-attaching at nearly the same location. The maximum mean suction observed in the flow separation zone is 73% smaller than the open-jet model. This finding underscores a critical limitation for RANS-based models in high Reynolds number external flow aerodynamics where capturing transient, high-magnitude turbulent fluctuations is essential for accurate vortex-induced vibrations (VIV) prediction. This significant discrepancy highlights the inherent limitation of the RANS-based k-ω SST model in accurately capturing high-magnitude, transient pressure fluctuations driven by complex turbulent vortex formation at high Reynolds numbers, necessitating future validation using highly resolved Large Eddy Simulation (LES) techniques.
The comparative analysis of pressure coefficient distributions between the Arrangement 4 Open-Jet model and the Open-Jet Bare-Deck model revealed significant improvements in aerodynamic performance:
Reduction in Maximum Negative Pressures: The bare-deck model exhibited a maximum negative pressure coefficient of −2.296 at the windward top face within the flow separation zone (Figure 14a). Conversely, the Arrangement 4 Open-Jet model registered a peak negative pressure coefficient of −1.065 in the same area, demonstrating a substantial 54% reduction in magnitude relative to the bare-deck baseline, a clear quantitative validation of the geometric mitigation efficacy. This substantial 54% reduction in peak suction pressures provides a definitive quantitative measure of geometric mitigation efficacy, suggesting a significantly decreased aerodynamic excitation force, which is directly responsible for initiating VIV. This reduction in suction pressures directly indicates a decrease in the magnitude of wind-induced forces, thereby contributing to enhanced aerodynamic stability and reduced susceptibility to vibrations. This significant reduction in static aerodynamic excitation force (54%) is highly relevant, as studies involving dedicated, single-purpose aerodynamic spoilers have typically achieved an approximate 50% reduction in vertical VIV amplitude by modifying the flow separation profile, lending strong context to the potential dynamic performance of Arrangement 4. While definitive VIV amplitude testing remains future work, the pressure data confirm that Arrangement 4 substantially diminishes the primary exciting force necessary for initiating vibration. This mitigation effect is achieved precisely because the integrated solar panels modify the bridge deck’s geometry and introduce roughness, fundamentally altering the flow separation mechanism and leading to a more favorable pressure distribution. The top and bottom panels were able to slow down the flow velocity so that, globally, there was less flow separation over the deck compared to the bare-deck model. The geometric modification provided by the PV arrangement successfully induced complete flow re-attachment, a mechanism that strategically replicates the flow stabilization benefits commonly sought through optimal design of dedicated fairings and spoilers.
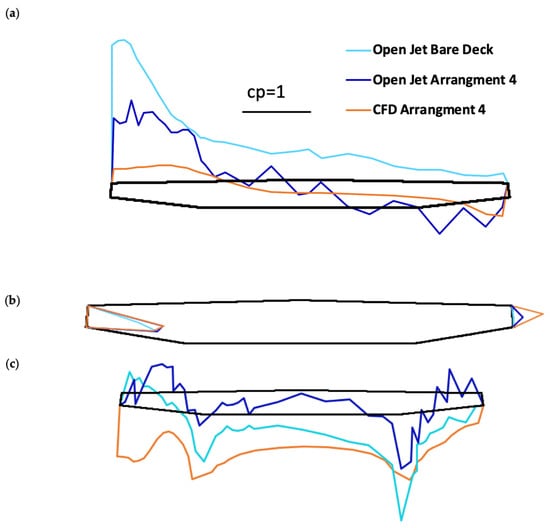
Figure 14.
Model Comparisons of Pressure Coefficient Distributions. Comparison between Open-Jet Bare-Deck and Open-Jet Arrangement 4 configurations across: (a) Top-Deck Pressure Ring Comparisons, (b) Side-Deck Pressure Ring Comparisons, and (c) Bottom-Deck Pressure Ring Comparisons. The bare-deck data provides the baseline for mitigation assessment.
Promotion of Flow Reattachment: Unlike the bare-deck model, which showed no positive pressure coefficients on its top surface (indicating persistent flow separation), the Arrangement 4 Open-Jet model demonstrated complete flow reattachment at the deck top. This reattachment was quantified by a peak positive pressure coefficient of 0.669 at tap 28, representing a notable 71% increase in magnitude compared to the bare-deck’s reading at the same location, thereby confirming the effectiveness of the panels in restoring favorable pressure recovery. Tap 28, located centrally on the top deck face, confirms that the PV geometry successfully functions as a flow stabilizer, promoting favorable pressure recovery. Effective flow reattachment is critical for suppressing the formation of detrimental vortices and mitigating vortex-induced vibrations.
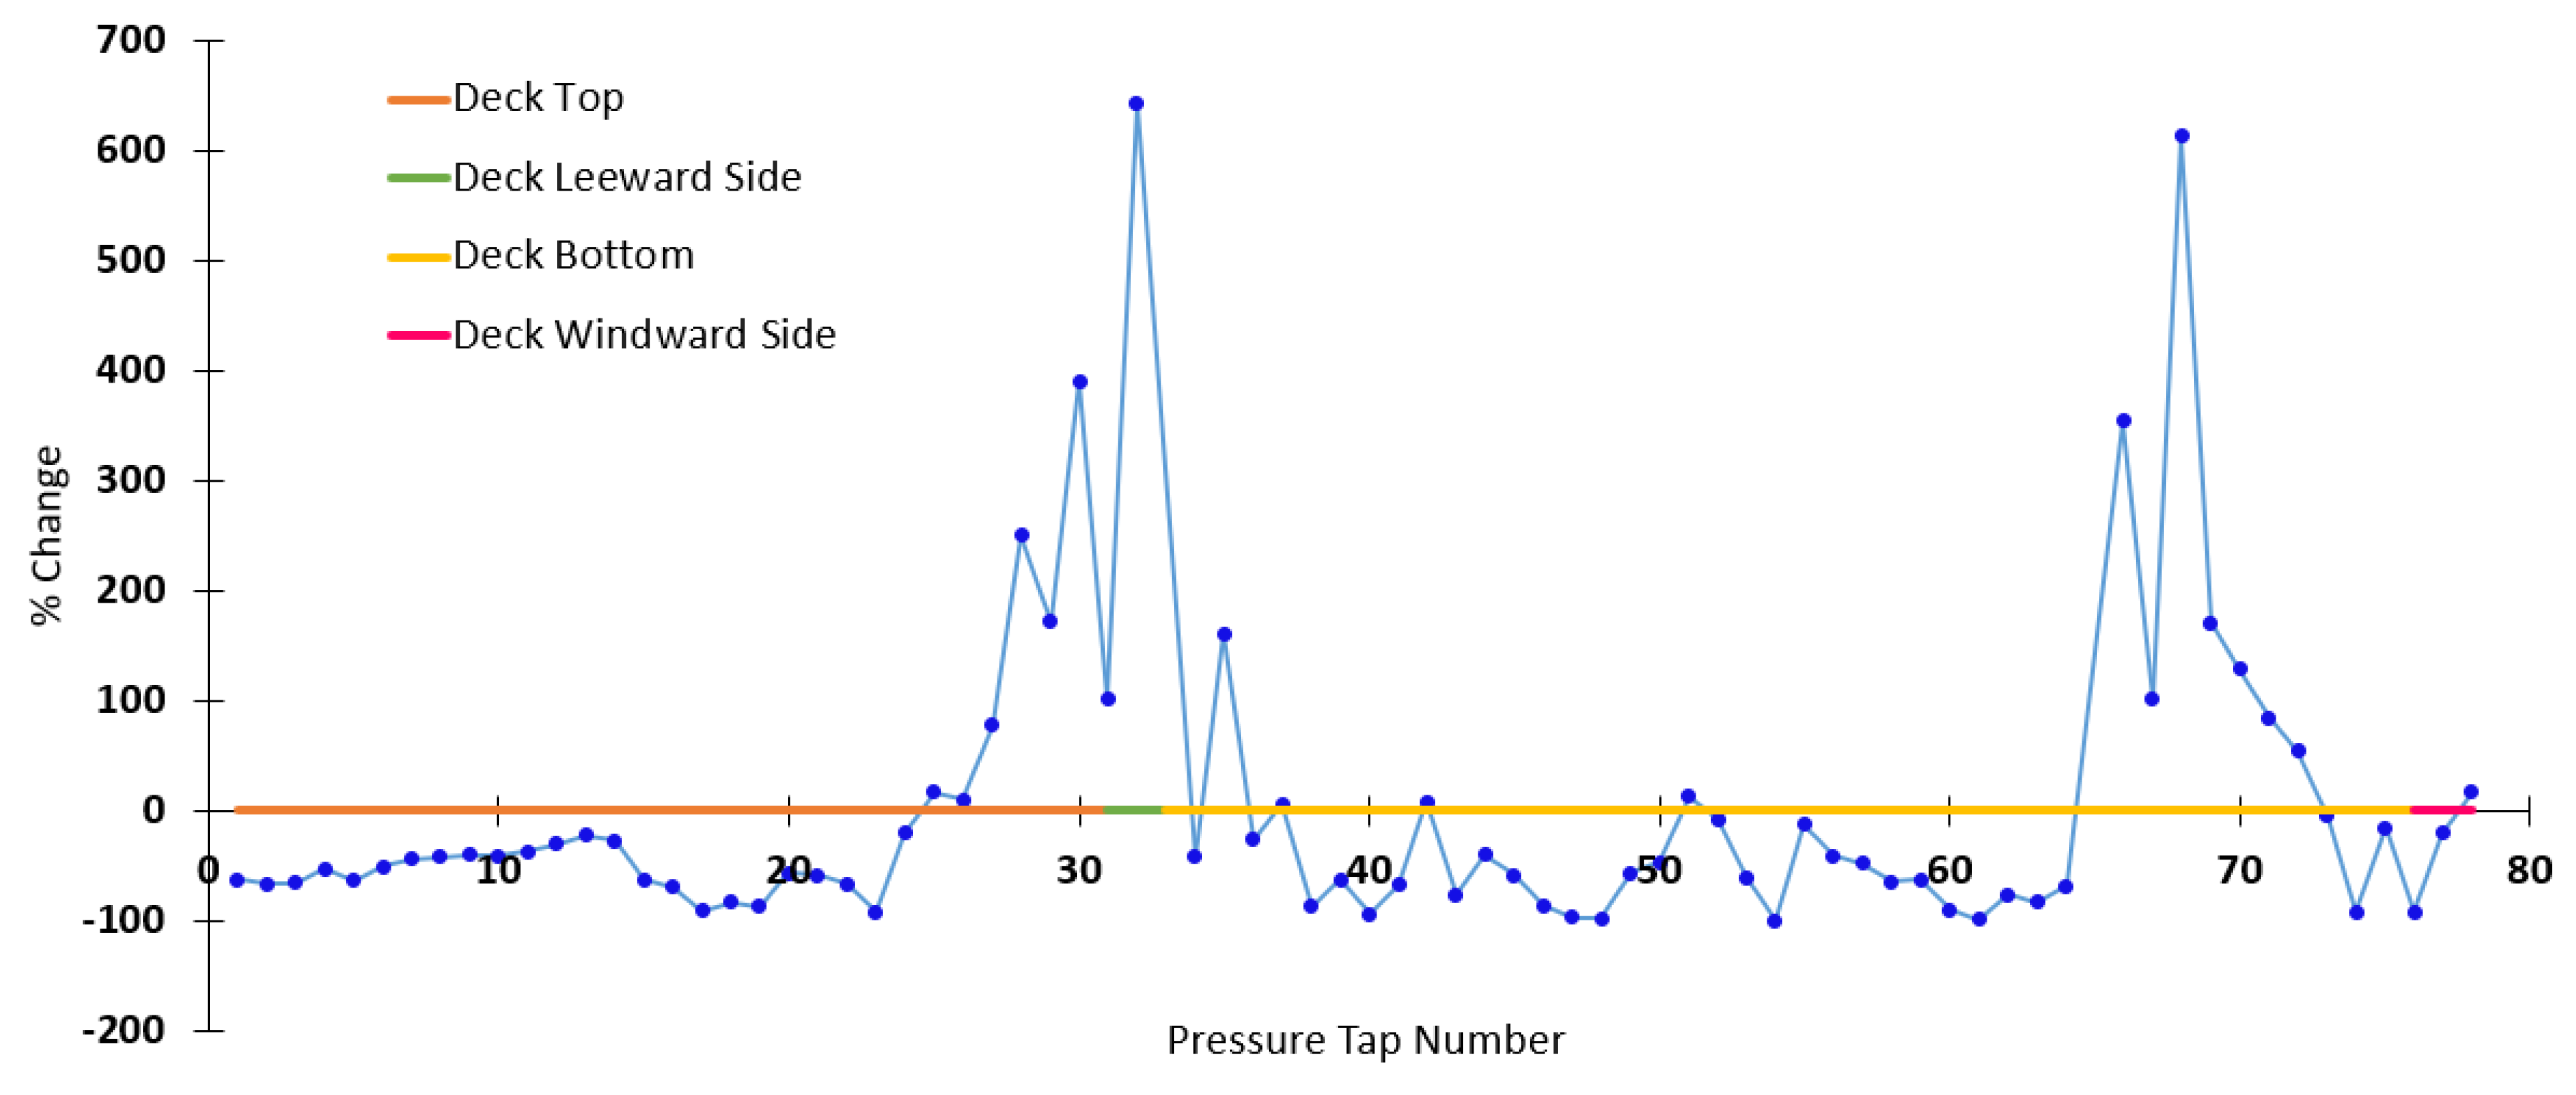
Overall Pressure Coefficient Modifications: Beyond peak values, the integration of solar panels in Arrangement 4 generally resulted in a reduced magnitude of pressure coefficients across the deck’s top and bottom surfaces in regions not dominated by flow reattachment or separation. As illustrated in Figure 15, the highest percentage changes were observed at the leeward edge and the windward-bottom-face, while the deck-bottom and leeward-side exhibited less sensitivity to changes in scale and testing facility.
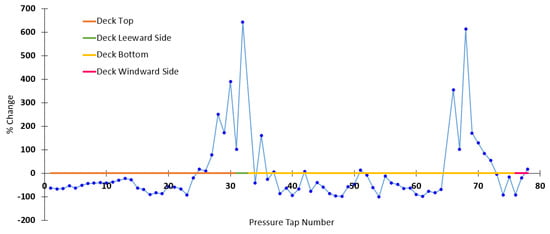
Figure 15.
Percentage Change in Pressure Coefficient Magnitude: Comparison between Arrangement 4 and N-Ring Open-Jet Configurations.
Impact on Wind-Induced Forces (Table 2): As detailed in Table 2, the bare-deck model consistently experienced the highest negative pressure coefficients across its various faces, particularly on face 1, signifying its susceptibility to the most significant wind-induced forces. This aligns with the expectation that open-jet facilities would reveal more pronounced coefficients in separation zones, highlighting the severe wind loading on an unmodified bridge deck. In contrast, the data for Arrangement 4 definitively shows that the integrated solar panels effectively re-profile the pressure distribution, leading to a more aerodynamically favorable configuration that mitigates adverse wind effects.

Table 2.
Maximum and minimum mean pressure coefficients found on each deck face. NA indicates that the corresponding pressure coefficient (positive or negative) was Not Applicable or not detected in that face under the given flow conditions.
These experimental findings underscore that the strategic integration of solar panels can significantly enhance the aerodynamic performance of bridge decks by favorably altering pressure distributions and promoting more stable flow behaviors. This dual functionality contributes both to improved structural safety and resilience and to the advancement of sustainable energy infrastructure.
7. Conclusions
This study presents a comprehensive exploration into advancing bridge aerodynamics, notably by integrating green energy solutions with traditional mitigation strategies to foster resilient and sustainable infrastructure. The research specifically addressed critical aspects of wind tunnel modeling, the principles of aerodynamic mitigation devices, and the efficacy of open-jet testing, culminating in an innovative investigation into solar panels as dual-purpose aerodynamic mitigation devices.
Firstly, our analysis affirmed wind tunnel modeling as a valuable tool for understanding complex aerodynamic phenomena, while simultaneously highlighting its inherent limitations, such as scale effects and boundary interference, which necessitate complementary advanced methodologies. This underscored the importance of alternative approaches, particularly large-scale open-jet testing, which was demonstrated to accurately replicate atmospheric boundary layer (ABL) flow conditions and produce more realistic peak pressure coefficients on bridge deck models compared to smaller-scale wind tunnel tests. The Open-Jet facility at the Windstorm Impact, Science, and Engineering (WISE) research facility provided crucial insights by enabling tests at higher Reynolds numbers and allowing for the development of larger-scale turbulence, thus enhancing the fidelity of flow measurements relevant to full-scale bridge behavior. It is important to note that while this research focused on a streamlined single box girder, the principle that higher-Reynolds-number testing more accurately captures turbulent flow characteristics (vortex size, pressure coefficients) applies broadly to bluff body aerodynamics, suggesting similar benefits for non-streamlined bridge deck sections. However, the specific geometry optimization developed here (Arrangement 4) is currently tailored for the streamlined single box girder, suggesting that customized PV configurations would be necessary to achieve comparable mitigation performance on inherently bluff sections.
Furthermore, while conventional aerodynamic mitigation devices like handrails, windshields, guide vanes, spoilers, and fairings effectively modify airflow patterns to suppress vortex-induced vibrations, this research introduced a paradigm shift by demonstrating the aerodynamic efficacy of integrated solar panel systems. Our experimental validation of Arrangement 4 in the Open-Jet facility yielded significant quantitative improvements in aerodynamic performance:
- The integration of solar panels resulted in a remarkable 54% reduction in the peak negative pressure coefficient at the windward top face of the bridge deck, decreasing from −2.296 (bare-deck) to −1.065. This substantial reduction directly translates to a diminished magnitude of wind-induced forces, thereby enhancing overall aerodynamic stability and reducing susceptibility to vibration. This result favorably compares the geometric mitigation efficacy of the integrated PV system to single-purpose traditional mitigation devices like spoilers, while simultaneously providing renewable energy production. This level of peak pressure reduction (54%) is highly competitive with reported performance metrics of high-impact, single-purpose devices, such as spoilers, which have been shown to reduce vertical VIV amplitude by approximately 50%.
- Crucially, complete flow reattachment at the deck top was observed with Arrangement 4, evidenced by a 71% increase in the peak positive pressure coefficient (0.669 at tap 28) compared to the bare-deck model. This reattachment capability is vital for suppressing detrimental vortex formation and mitigating vortex-induced vibrations.
- Overall, the addition of the solar panels in Arrangement 4 led to a general decrease in the magnitude of pressure coefficients across the deck, effectively re-profiling the pressure distribution into a more aerodynamically favorable configuration that mitigated adverse wind effects. This solar panel integration offers a sustainable alternative, suitable especially for long-span bridges where energy autonomy is desired and where initial aerodynamic stability challenges allow mitigation through geometric modification. Conversely, highly complex or extreme aeroelastic problems (e.g., flutter) might still necessitate the application of optimized traditional devices (spoilers, guide vanes) or mechanical solutions (TMDs).
These findings definitively conclude that strategically integrated solar panels serve as highly effective aerodynamic mitigation devices, simultaneously producing renewable energy and substantially enhancing the safety and performance of long-span bridges. This interdisciplinary approach, combining advanced aerodynamic analysis with sustainable design principles, paves the way for the development of more resilient, efficient, and eco-friendly bridge infrastructure capable of meeting future environmental and energy demands.
Future research should prioritize optimizing solar panel parameters (e.g., specific tilt angles and spacing) to maximize simultaneous energy generation and aerodynamic stability across varying wind conditions. Specifically, comprehensive wind tunnel or open-jet testing comparing Arrangement 4 performance against optimized traditional mitigation devices (e.g., highly inclined spoilers or fairings) is required to definitively position this system within the existing hierarchy of mitigation solutions. Furthermore, addressing the scale disparity observed in Open-Jet testing requires investigation using models with larger panel dimensions or employing computationally intensive methods such as Large Eddy Simulation (LES) to accurately capture complex turbulence interactions near the panel geometry, potentially yielding higher peak pressures consistent with experimental findings.
Author Contributions
Conceptualization, methodology, formal analysis, investigation, data curation, writing—original draft preparation, writing—review and editing, visualization: A.M.A. Methodology, formal analysis, visualization: H.D. All authors have read and agreed to the published version of the manuscript.
Funding
Author Aly’s research and expertise, which inform this paper, have been supported by: (1) LA Board of Regents (BOR), Originating Sponsor: National Aeronautics & Space Administration (NASA) EPSCoR RID-RAP (Grant N. LEQSF-EPS(2025)-RAP-59); and (2) the Institute for Energy Innovation (Grant No. Phase II Energy Innovation). The findings in this paper are those of the authors and do not necessarily reflect the opinion of the supporting agencies.
Institutional Review Board Statement
Not applicable.
Informed Consent Statement
Not applicable.
Data Availability Statement
The data presented in this study are available on request from the corresponding author.
Conflicts of Interest
The authors declare no conflicts of interest.
References
- Zou, L.; Feng, W.; Masci, O.; Nico, G.; Alani, A.M.; Sato, M. Bridge Monitoring Strategies for Sustainable Development with Microwave Radar Interferometry. Sustainability 2024, 16, 2607. [Google Scholar] [CrossRef]
- Zhang, S.; Tan, Y.; Ge, H.; Zhang, Q. Safety–Function–Environment Evaluation System for Large-Span Cable-Supported Bridges: Theory and Case Studies. Sustainability 2024, 16, 1414. [Google Scholar] [CrossRef]
- Diana, G.; Fiammenghi, G.; Belloli, M.; Rocchi, D. Wind tunnel tests and numerical approach for long span bridges: The Messina bridge. J. Wind Eng. Ind. Aerodyn. 2013, 122, 38–49. [Google Scholar] [CrossRef]
- Tieleman, H.W. Wind tunnel simulation of wind loading on low-rise structures: A review. J. Wind Eng. Ind. Aerodyn. 2003, 91, 1627–1649. [Google Scholar] [CrossRef]
- Stathopoulos, T.; Surry, D. Scale effects in wind tunnel testing of low buildings. J. Wind Eng. Ind. Aerodyn. 1983, 13, 313–326. [Google Scholar] [CrossRef]
- Duthinh, D.; Simiu, E. The use of wind tunnel measurements in building design. Wind Tunn. Exp. Fluid Dyn. Res. 2011, 82, 282–300. [Google Scholar]
- Aly, A.M. On the evaluation of wind loads on solar panels: The scale issue. Sol. Energy 2016, 135, 423–434. [Google Scholar] [CrossRef]
- Bai, H.; Ji, N.; Xu, G.; Li, J. An alternative aerodynamic mitigation measure for improving bridge flutter and vortex induced vibration (VIV) stability: Sealed traffic barrier. J. Wind Eng. Ind. Aerodyn. 2020, 206, 104302. [Google Scholar] [CrossRef]
- Bai, H.; Li, R.; Xu, G.; Kareem, A. Aerodynamic performance of Π-shaped composite deck cable-stayed bridges including VIV mitigation measures. J. Wind Eng. Ind. Aerodyn. 2021, 208, 104451. [Google Scholar] [CrossRef]
- Laima, S.; Li, H.; Chen, W.; Ou, J. Effects of attachments on aerodynamic characteristics and vortex-induced vibration of twin-box girder. J. Fluids Struct. 2018, 77, 115–133. [Google Scholar] [CrossRef]
- Zhu, L.; Mccrum, D.; Keenahan, J. Capability analysis of computational fluid dynamics models in wind shield study on Queensferry Crossing, Scotland. Proc. Inst. Civ. Eng. Bridg. Eng. 2022, 177, 4–16. [Google Scholar] [CrossRef]
- Larsen, A.; Esdahl, S.; Andersen, J.E.; Vejrum, T. Storebaelt suspension bridge-vortex shedding excitation and mitigation by guide vanes. J. Wind Eng. Ind. Aerodyn. 2000, 88, 283–296. [Google Scholar] [CrossRef]
- Hu, C.; Zhao, L.; Ge, Y. Mechanism of suppression of vortex-induced vibrations of a streamlined closed-box girder using additional small-scale components. J. Wind Eng. Ind. Aerodyn. 2019, 189, 314–331. [Google Scholar] [CrossRef]
- Lee, S.; Kwon, S.-D. Improvement of Aerodynamic Performance and Energy Supply of Bridges Using Small Wind Turbines. J. Bridge Eng. 2015, 20, 04014116. [Google Scholar] [CrossRef]
- Zhang, Y.; Cardiff, P.; Keenahan, J. Wind-induced phenomena in long-span cable-supported bridges: A comparative review of wind tunnel tests and computational fluid dynamics modelling. Appl. Sci. 2021, 11, 1642. [Google Scholar] [CrossRef]
- American Association of State Highway and Transportation Officials (AASHTO). Aashto LRFD Bridge Design Specifications; American Association of State Highway and Transportation Officials (AASHTO): Washington, DC, USA, 2012; ISBN 9781560515234. [Google Scholar]
- Larsen, A.; Savage, M.; Lafrenière, A.; Hui, M.C.H.; Larsen, S.V. Investigation of vortex response of a twin box bridge section at high and low Reynolds numbers. J. Wind Eng. Ind. Aerodyn. 2008, 96, 934–944. [Google Scholar] [CrossRef]
- Helgedagsrud, T.A.; Bazilevs, Y.; Mathisen, K.M.; Øiseth, O.A. ALE-VMS methods for wind-resistant design of long-span bridges. J. Wind Eng. Ind. Aerodyn. 2019, 191, 143–153. [Google Scholar] [CrossRef]
- Aly, A.M.; Khaled, M.F. Open-jet testing: Investigating turbulence and geometric scale effects on surface pressures in the atmospheric boundary layer. Phys. Fluids 2024, 36, 125141. [Google Scholar] [CrossRef]
- Aly, A.M.; Chapain, S. Large-Scale Open-Jet Testing for Cladding Design in High-Rise Buildings: Higher Peak Pressures Compared to Wind Tunnels. Pract. Period. Struct. Des. Constr. ASCE 2022, 27, 04022016. [Google Scholar] [CrossRef]
- Klewicki, J.C. Reynolds Number Dependence, Scaling, and Dynamics of Turbulent Boundary Layers. J. Fluids Eng. 2010, 132, 094001. [Google Scholar] [CrossRef]
- Pettersson, K. Scaling Techniques Using CFD and Wind Tunnel Measurements for use in Aircraft Design. Licentiate Thesis, Department of Aeronautical and Vehicle Engineering, KTH Royal Institute of Technology, Sweden. KTH Royal Institute of Technology. 2006. Available online: https://kth.diva-portal.org/smash/get/diva2:10823/FULLTEXT01 (accessed on 20 September 2025).
- Computational Fluid Dynamics. LEAP Australia. Available online: https://www.leapaust.com.au/cfd/ (accessed on 20 September 2025).
- Lienhard, J.H. Synopsis of Lift, Drag, and Vortex Frequency Data for Rigid Circular Cylinders. Washingt. State Univ. Coll. Eng. Res. Div. Bull. 1966, 300, 1–32. [Google Scholar]
- Sherman, F.S. Viscous Flow; McGraw-Hill: New York, NY, USA, 1990; p. 746. [Google Scholar]
- Gad-El Hak, M.; Bandyopadhyay, P.R. Reynolds Number Effects in Wall-Bounded Turbulent Flows. Appl. Mech. Rev. 1994, 47, 307–365. [Google Scholar] [CrossRef]
- Neuhaus, L.; Hölling, M.; Bos, W.J.T.; Peinke, J. Generation of Atmospheric Turbulence with Unprecedentedly Large Reynolds Number in a Wind Tunnel. Phys. Rev. Lett. 2020, 125, 154503. [Google Scholar] [CrossRef]
- Mydlarski, L.; Warhaft, Z. On the onset of high-Reynolds-number grid-generated wind tunnel turbulence. J. Fluid Mech. 1996, 320, 331–368. [Google Scholar] [CrossRef]
- Degraaff, D.B.; Eaton, J.K. Reynolds-number scaling of the flat-plate turbulent boundary layer. J. Fluid Mech. 2000, 422, 319–346. [Google Scholar] [CrossRef]
- Larsen, A.; Larose, G.L. Dynamic wind effects on suspension and cable-stayed bridges. J. Sound Vib. 2015, 334, 2–28. [Google Scholar] [CrossRef]
- Cai, C.; Montens, S. Wind Effects on Long Span Bridges. In Bridge Engineering Handbook, 2nd ed.; CRC Press: Boca Raton, FL, USA, 2014. [Google Scholar]
- Ehsan, F.; Scanlan, R.H. VortexInduced Vibrations of Flexible Bridges. J. Eng. Mech. 1990, 116, 1392–1411. [Google Scholar] [CrossRef]
- Sakamoto, H.; Haniu, H. A Study on Vortex Shedding from Spheres in a Uniform Flow. ASME J. Fluids Eng. 1990, 112, 386–392. [Google Scholar] [CrossRef]
- Li, H.; Laima, S.; Jing, H. Reynolds number effects on aerodynamic characteristics and vortex-induced vibration of a twin-box girder. J. Fluids Struct. 2014, 50, 358–375. [Google Scholar] [CrossRef]
- Matsuda, K.; Cooper, K.R.; Tanaka, H.; Tokushige, M.; Iwasaki, T. An investigation of Reynolds number effects on the steady and unsteady aerodynamic forces on a 1:10 scale bridge deck section model. J. Wind Eng. Ind. Aerodyn. 2001, 89, 619–632. [Google Scholar] [CrossRef]
- Rocchi, D.; Argentini, T.; Sbrosi, M. Pressure Distribution and Global Forces on a Bridge Deck Section: Experimental and CFD Analysis of Static Aerodynamic Forces. J. Bridge Eng. 2014, 20, 04014097. [Google Scholar] [CrossRef]
- Noguchi, K.; Ito, Y.; Yagi, T. Numerical evaluation of vortex-induced vibration amplitude of a box girder bridge using forced oscillation method. J. Wind Eng. Ind. Aerodyn. 2020, 196, 104029. [Google Scholar] [CrossRef]
- Xin, D.; Zhan, J.; Zhang, H.; Ou, J. Control of Vortex-Induced Vibration of a Long-Span Bridge by Inclined Railings. J. Bridge Eng. 2021, 26, 04021093. [Google Scholar] [CrossRef]
- Hu, C.X.; Zhao, L.; Ge, Y.J. Time-frequnecy evolutionary characterisitcs of aerodynamic forces around a streamlined closed-box girder during vortex-induced vibration. J. Wind Eng. Ind. Aerodyn. 2018, 182, 330–343. [Google Scholar]
- Xu, F.; Ying, X.; Li, Y.; Zhang, M. Experimental Explorations of the Torsional Vortex-Induced Vibrations of a Bridge Deck. J. Bridge Eng. 2016, 21, 04016093. [Google Scholar] [CrossRef]
- Kusano, I.; Jakobsen, J.B.; Snæbjörnsson, J.T. CFD simulations of a suspension bridge deck for different deck shapes with railings and vortex mitigating devices. IOP Conf. Ser. Mater. Sci. Eng. 2019, 700, 012003. [Google Scholar] [CrossRef]
- Nagao, F.; Utsunomiya, H.; Yoshioka, E.; Ikeuchi, A.; Kobayashi, H. Effects of handrails on separated shear flow and vortex-induced oscillation. J. Wind Eng. Ind. Aerodyn. 1997, 69–71, 819–827. [Google Scholar] [CrossRef]
- Procino, L.; Kozmar, H.; Bartoli, G.; Borsani, A. Wind barriers on bridges: The effect of wall porosity. In Proceedings of the BBAA VI International Colloquium on: Bluff Bodies Aerodynamics & Applications, Milano, Italy, 20–24 July 2008. [Google Scholar]
- Buljac, A.; Kozmar, H.; Pospíšil, S.; Macháček, M. Aerodynamic and aeroelastic characteristics of typical bridge decks equipped with wind barriers at the windward bridge-deck edge. Eng. Struct. 2017, 137, 310–322. [Google Scholar] [CrossRef]
- Liu, J.; Liao, H.; Wan, J.; Ma, C. Effect of guide vane beside maintenance rail on vortex-induced vibration of streamlined box girder. Xinan Jiaotong Daxue Xuebao/J. Southwest Jiaotong Univ. 2015, 50, 789–795. [Google Scholar] [CrossRef]
- Gao, D.; Deng, Z.; Yang, W.; Chen, W. Review of the excitation mechanism and aerodynamic flow control of vortex-induced vibration of the main girder for long-span bridges: A vortex-dynamics approach. J. Fluids Struct. 2021, 105, 103348. [Google Scholar] [CrossRef]
- Sarwar, M.W.; Ishihara, T. Numerical study on suppression of vortex-induced vibrations of box girder bridge section by aerodynamic countermeasures. J. Wind Eng. Ind. Aerodyn. 2010, 98, 701–711. [Google Scholar] [CrossRef]
- Haque, M.N.; Katsuchi, H.; Yamada, H.; Nishio, M. Investigation of edge fairing shaping effects on aerodynamic response of long-span bridge deck by unsteady RANS. Arch. Civ. Mech. Eng. 2016, 16, 888–900. [Google Scholar] [CrossRef]
- Fujino, Y.; Yoshida, Y. Wind-Induced Vibration and Control of Trans-Tokyo Bay Crossing Bridge. J. Struct. Eng. 2002, 128, 1012–1025. [Google Scholar] [CrossRef]
- DiLeo, H.N. Aerodynamic Mitigation in Bridges: Open-Jet Testing and Computational Fluid Dynamics. Master’s Thesis, Louisiana State University, Baton Rouge, LA, USA, 2023. [Google Scholar]
- Aly, A.M.; Khaled, M.F.; Clancy, R. Large-Scale Open-Jet Testing: A new frontier in structural wind Engineering. Eng. Struct. 2022, 266, 114567. [Google Scholar] [CrossRef]
- Aly, A.M. Breaking Boundaries in Wind Engineering: LSU WISE Open-Jet Facility Revolutionizes Solar Panel and Building Design. Appl. Sci. 2023, 13, 12546. [Google Scholar] [CrossRef]
- Aly, A.M.; da Fonseca Yousef, N. High Reynolds number aerodynamic testing of a roof with parapet. Eng. Struct. 2021, 234, 112006. [Google Scholar] [CrossRef]
- U.S. Department of Energy. Solar Photovoltaic Technology Basics. Office of Energy Efficiency and Renewable Energy. Available online: https://www.energy.gov/eere/solar/solar-photovoltaic-technology-basics (accessed on 20 September 2025).
Disclaimer/Publisher’s Note: The statements, opinions and data contained in all publications are solely those of the individual author(s) and contributor(s) and not of MDPI and/or the editor(s). MDPI and/or the editor(s) disclaim responsibility for any injury to people or property resulting from any ideas, methods, instructions or products referred to in the content. |
© 2025 by the authors. Licensee MDPI, Basel, Switzerland. This article is an open access article distributed under the terms and conditions of the Creative Commons Attribution (CC BY) license (https://creativecommons.org/licenses/by/4.0/).

