Abstract
Windborne debris generated during tornadoes and hurricanes plays a critical role in building damage. This damage occurs either through direct impact on structural and nonstructural components or indirectly by increasing internal pressure when debris penetrates openings (e.g., windows and doors) or creates new ones. These breaches can significantly raise internal pressure, even at lower wind speeds compared to debris-free conditions. Current provisions in ASCE 7, the nationally adopted standard for wind load calculations in the United States, account for factors such as building geometry, location, and exposure category. However, they do not consider the effects of windborne debris on internal pressure coefficients. This study proposes an enhancement to ASCE 7 by incorporating debris effects through the use of a more conservative enclosure classification. Real-world damage observations from three tornado-impacted residential buildings are presented, followed by a failure mechanism analysis, supporting analytical fragility data, and numerical simulations of debris effects on building damage. The findings suggest that treating buildings as Partially Enclosed under ASCE 7 can more accurately reflect debris-induced internal pressures and improve building resilience under extreme wind events.
1. Introduction
Tornadoes and hurricanes generate extreme wind pressures and also propel debris at high velocities, significantly contributing to building damage. Windborne debris from trees, soil, and building components (e.g., roof panels and wall sections) can breach building envelopes, exacerbating internal pressure loads (Noda, 2014) [1].
Current design provisions in the ASCE 7-22 [2] standard account for wind loads based on parameters such as exposure, topography, and building geometry. However, the effects of windborne debris, particularly its impact on internal pressure through sudden enclosure breaches, are not explicitly addressed. This omission can result in underestimating wind loads in buildings vulnerable to debris impact, potentially compromising structural integrity.
Early foundational work by Tachikawa (1983) [3] systematically examined the trajectories of flat plate-type debris, such as roofing tiles and slates, through wind tunnel free-flight tests and numerical integration of equations of motion. The study identified distinct modes of motion—auto-rotational, translatory, and intermediate—strongly influenced by initial release conditions and the Magnus effect, and demonstrated that while exact trajectories were difficult to predict, numerical models could approximate the upper and lower bounds of debris paths.
Building on such efforts, Song and Ou (2009) [4] developed a more comprehensive framework for windborne debris damage analysis, integrating debris risk assessment, trajectory modeling for different debris types, and impact resistance evaluation of building envelopes. Their methodology, applied to an industrial building under Typhoon Chanchu (2006), highlighted how debris momentum and envelope strength govern breakage rates and internal pressurization, offering a practical tool for structural risk assessment in severe wind events.
Baker (2015) [5] developed a debris trajectory model considering factors such as the swirl ratio, initial position, and aerodynamic drag. Holmes et al. (2006) [6] introduced the Tachikawa number, a non-dimensional parameter used to characterize debris flight. The US Nuclear Regulatory Commission (USNRC, 2007) adopted a numerical debris impact methodology for nuclear power plants, specifying velocities for various debris types.
Several studies have examined the interaction between debris and buildings. Case et al. (2013) [7] investigated the influence of low-rise building geometry on tornado-induced loads. Ginger et al. (2008) [8] explored fluctuating internal pressures in buildings with dominant openings, highlighting the compounding effect of windborne debris in pressure loads. Guha et al. (2011) [9] developed models for internal pressure fluctuations due to tornado-induced openings, emphasizing the need for robust design against debris penetration.
Since tornadoes exhibit significant variability in wind speed, pressure, and debris behavior, probabilistic models have been proposed for structural design. Ramsdell (2007) [10] compiled a tornado climatology dataset for the U.S., providing recurrence intervals for extreme wind events. Tamura et al. (2015) [11] developed a tornado risk model for nuclear power plants in Japan, incorporating statistical distributions of tornado parameters.
Van de Lindt et al. (2018) [12] provide a comprehensive overview of tornado damage modeling across multiple spatial scales, including individual buildings, communities, and regions. Their study includes a fragility function database covering four damage states for 19 different building archetypes. While the probability of a single building being struck by a tornado is low, making it difficult to justify codified tornado load requirements, community resilience frameworks emphasize the broader impact of tornado outbreaks. The authors argue that when the scale of an event relative to the community is large, recovery shifts from individual to collective responsibility.
Baker and Sterling (2018) [13] present a novel conceptual framework for tornado-induced loading that explicitly integrates windborne debris trajectories and impact forces into structural load assessments. This framework couples a simplified tornado wind field model with a debris flight model, enabling simulation of thousands of tornado events (each with numerous debris flight realizations) to derive a probabilistic cumulative distribution of debris impact loads at specified risk levels. The integration of debris impact into wind pressure calculations, as proposed by Baker and Sterling (2018) [13], represents a significant step toward more resilient building design. However, continued research is necessary to refine probabilistic models, validate experimental data, and integrate these findings into design standards such as ASCE 7.
The ASCE 7 standard includes chapters dedicated to wind loads, which account for wind pressure parameters such as enclosure classification. ASCE 7 defines enclosure classifications based on the area of openings in a wall subjected to wind pressure relative to the openings in the rest of the building envelope. However, in the presence of windborne debris, early failure often occurs in a few window glazings, while the remainder of the windows typically remain intact. This scenario can significantly alter the enclosure classification and, consequently, the internal pressure coefficient used in design. This study proposes a modified framework that incorporates a debris impact into wind pressure calculations. In this study, a gap in the ASCE 7 wind load provisions is identified: The standard does not explicitly account for the possibility that only a portion of openings in the building envelope may be breached during an extreme-wind event. This oversight, largely unaddressed in the literature, can lead to underestimated internal pressures and design loads. Our study highlights this gap and motivates a classification-focused enhancement to better reflect debris-induced breach scenarios.
In this study, we first discuss the wind load equation as defined by ASCE 7 and identify the parameter within the equation that can be influenced by windborne debris, potentially affecting its proper selection. Next, we present three real-world case studies involving building damage caused by tornado events, with a focus on the role of windborne debris. We then examine the failure mechanisms commonly observed in such scenarios. Following that, we review an analytical study that compares building fragility in the presence and absence of windborne debris. We subsequently investigate numerical simulations of debris-induced damage to corroborate the field observations. Finally, we propose a modification to the wind load calculation parameters within ASCE 7 to better account for the effects of windborne debris.
2. Materials and Methods
In the latest ASCE 7 (ASCE 7-22) provision for the Main Wind Force Resisting System for low-rise buildings using the Envelope Procedure, the Design Wind Pressure is calculated at height z using the equation below.
where
- External pressure coefficient;
- Internal pressure coefficient;
- Velocity pressure.
- Velocity pressure exposure coefficient;
- Directionality factor;
- Topographic factor;
- Basic wind speed.
This study proposes incorporating the effect of windborne debris into the internal pressure coefficient, (internal pressure coefficient). The current derivation of this coefficient is based on the building’s enclosure classification, as defined in Table 1, adopted from ASCE 7. According to this table, between the positive and negative values assigned to each enclosure classification, the value with the greatest absolute magnitude should be used, depending on whether the external pressure on a given building envelope surface is positive or negative.

Table 1.
Internal pressure coefficient per enclosure classification.
In the current ASCE 7 wind load calculation method, enclosure classification is determined based on the area of openings in the building envelope, without considering whether these openings remain intact or are breached during an extreme wind event. Consequently, Enclosed buildings use the lower internal pressure coefficient (GCpi = ±0.18), whereas Partially Enclosed buildings use GCpi = ±0.55.
2.1. Real-World Case Studies
The author conducted detailed structural inspections following a tornado event in Clarksville, Tennessee (December 2023), to assess the extent of building damage. At the time of these investigations, the author was a licensed Professional Engineer (PE) in the states of Tennessee and Kentucky.
All the investigated buildings were wood-frame residential structures classified as low-rise buildings. According to ASCE 7, the enclosure classification for all the buildings was Enclosed, which corresponds to an expected lower internal pressure coefficient per design compared to the Partially Enclosed classification. The impact of windborne debris was particularly evident in the damage to windows, garage doors, exterior walls, and roof assemblies. A consistent pattern of damage included one or two blown-out windows on one side of the building and partial to total roof assembly failure near the affected area. The buildings were deemed unsafe to occupy but were considered repairable.
The following case studies examine three buildings inspected for both structural and nonstructural damage following the tornado events. Wind speed data, obtained from the National Weather Service storm reports, correspond to the same tornado event at the locations of the buildings are used as reference values for comparison.
- Case study 1:
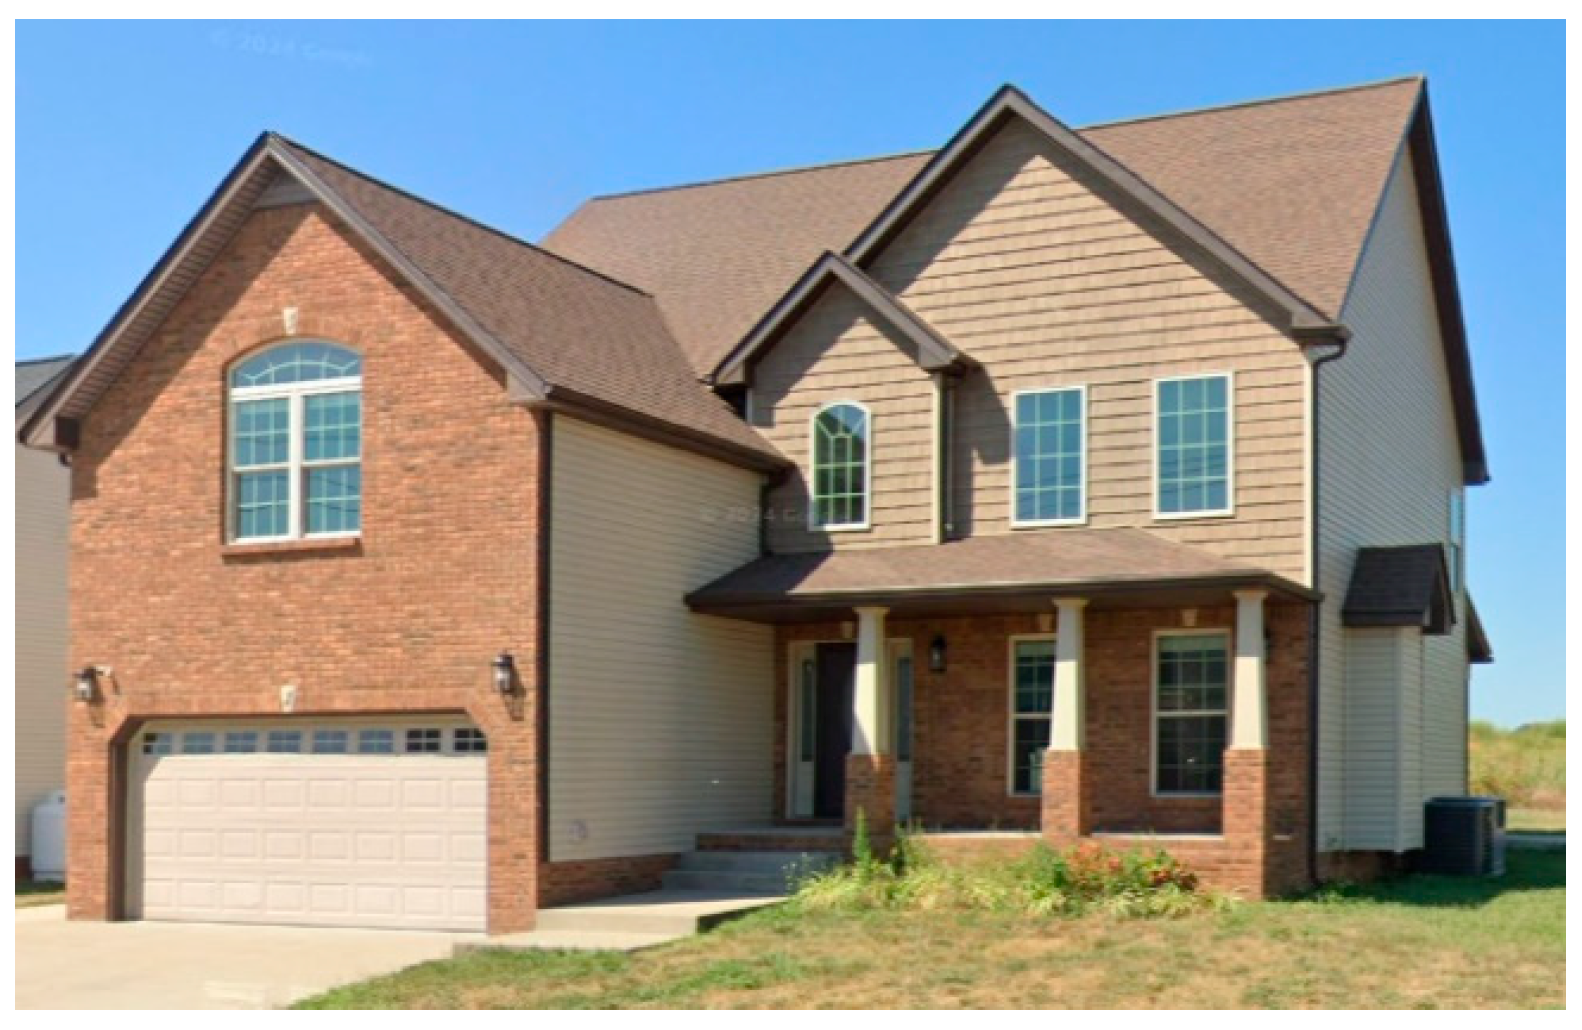
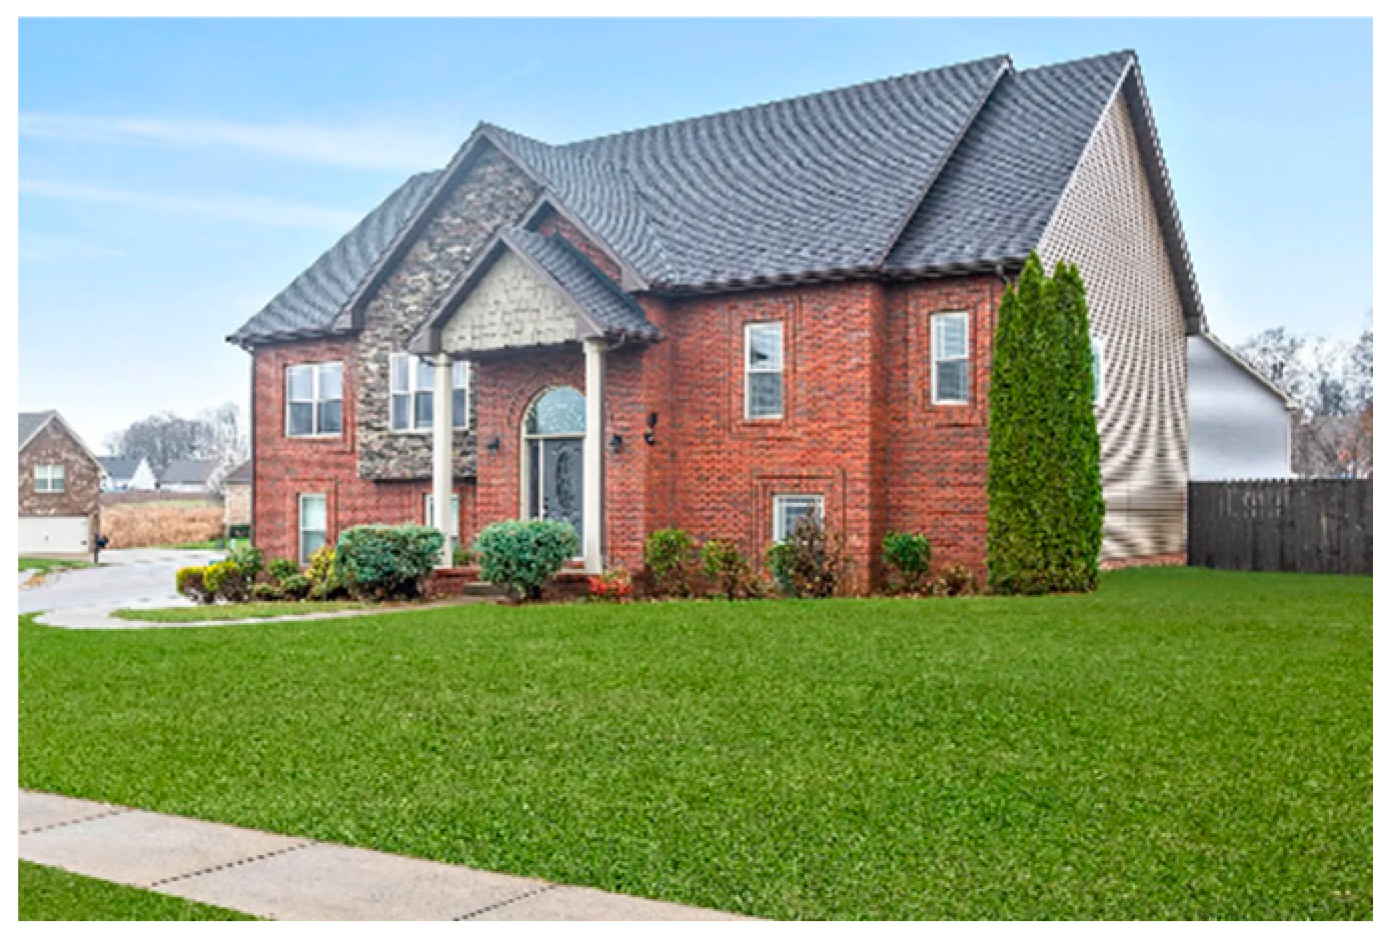
A structural inspection was conducted on 3 February 2024 to assess a residential building located in Clarksville, Tennessee (Figure 1). The subject structure is a two-story, wood-framed residential house, constructed in 2012 (per Realtor.com records), with no basement. Figure 1 illustrates the building prior to the tornado damage.
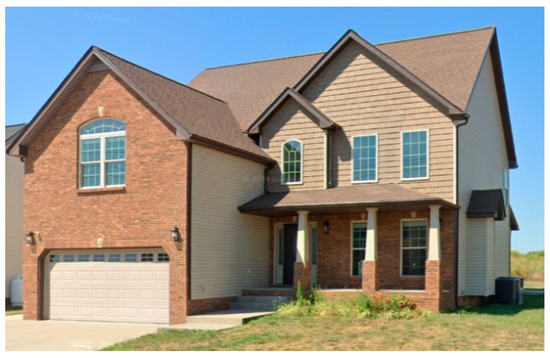
Figure 1.
Case study 1: Two-story wood-frame residential building in Clarksville, TN.
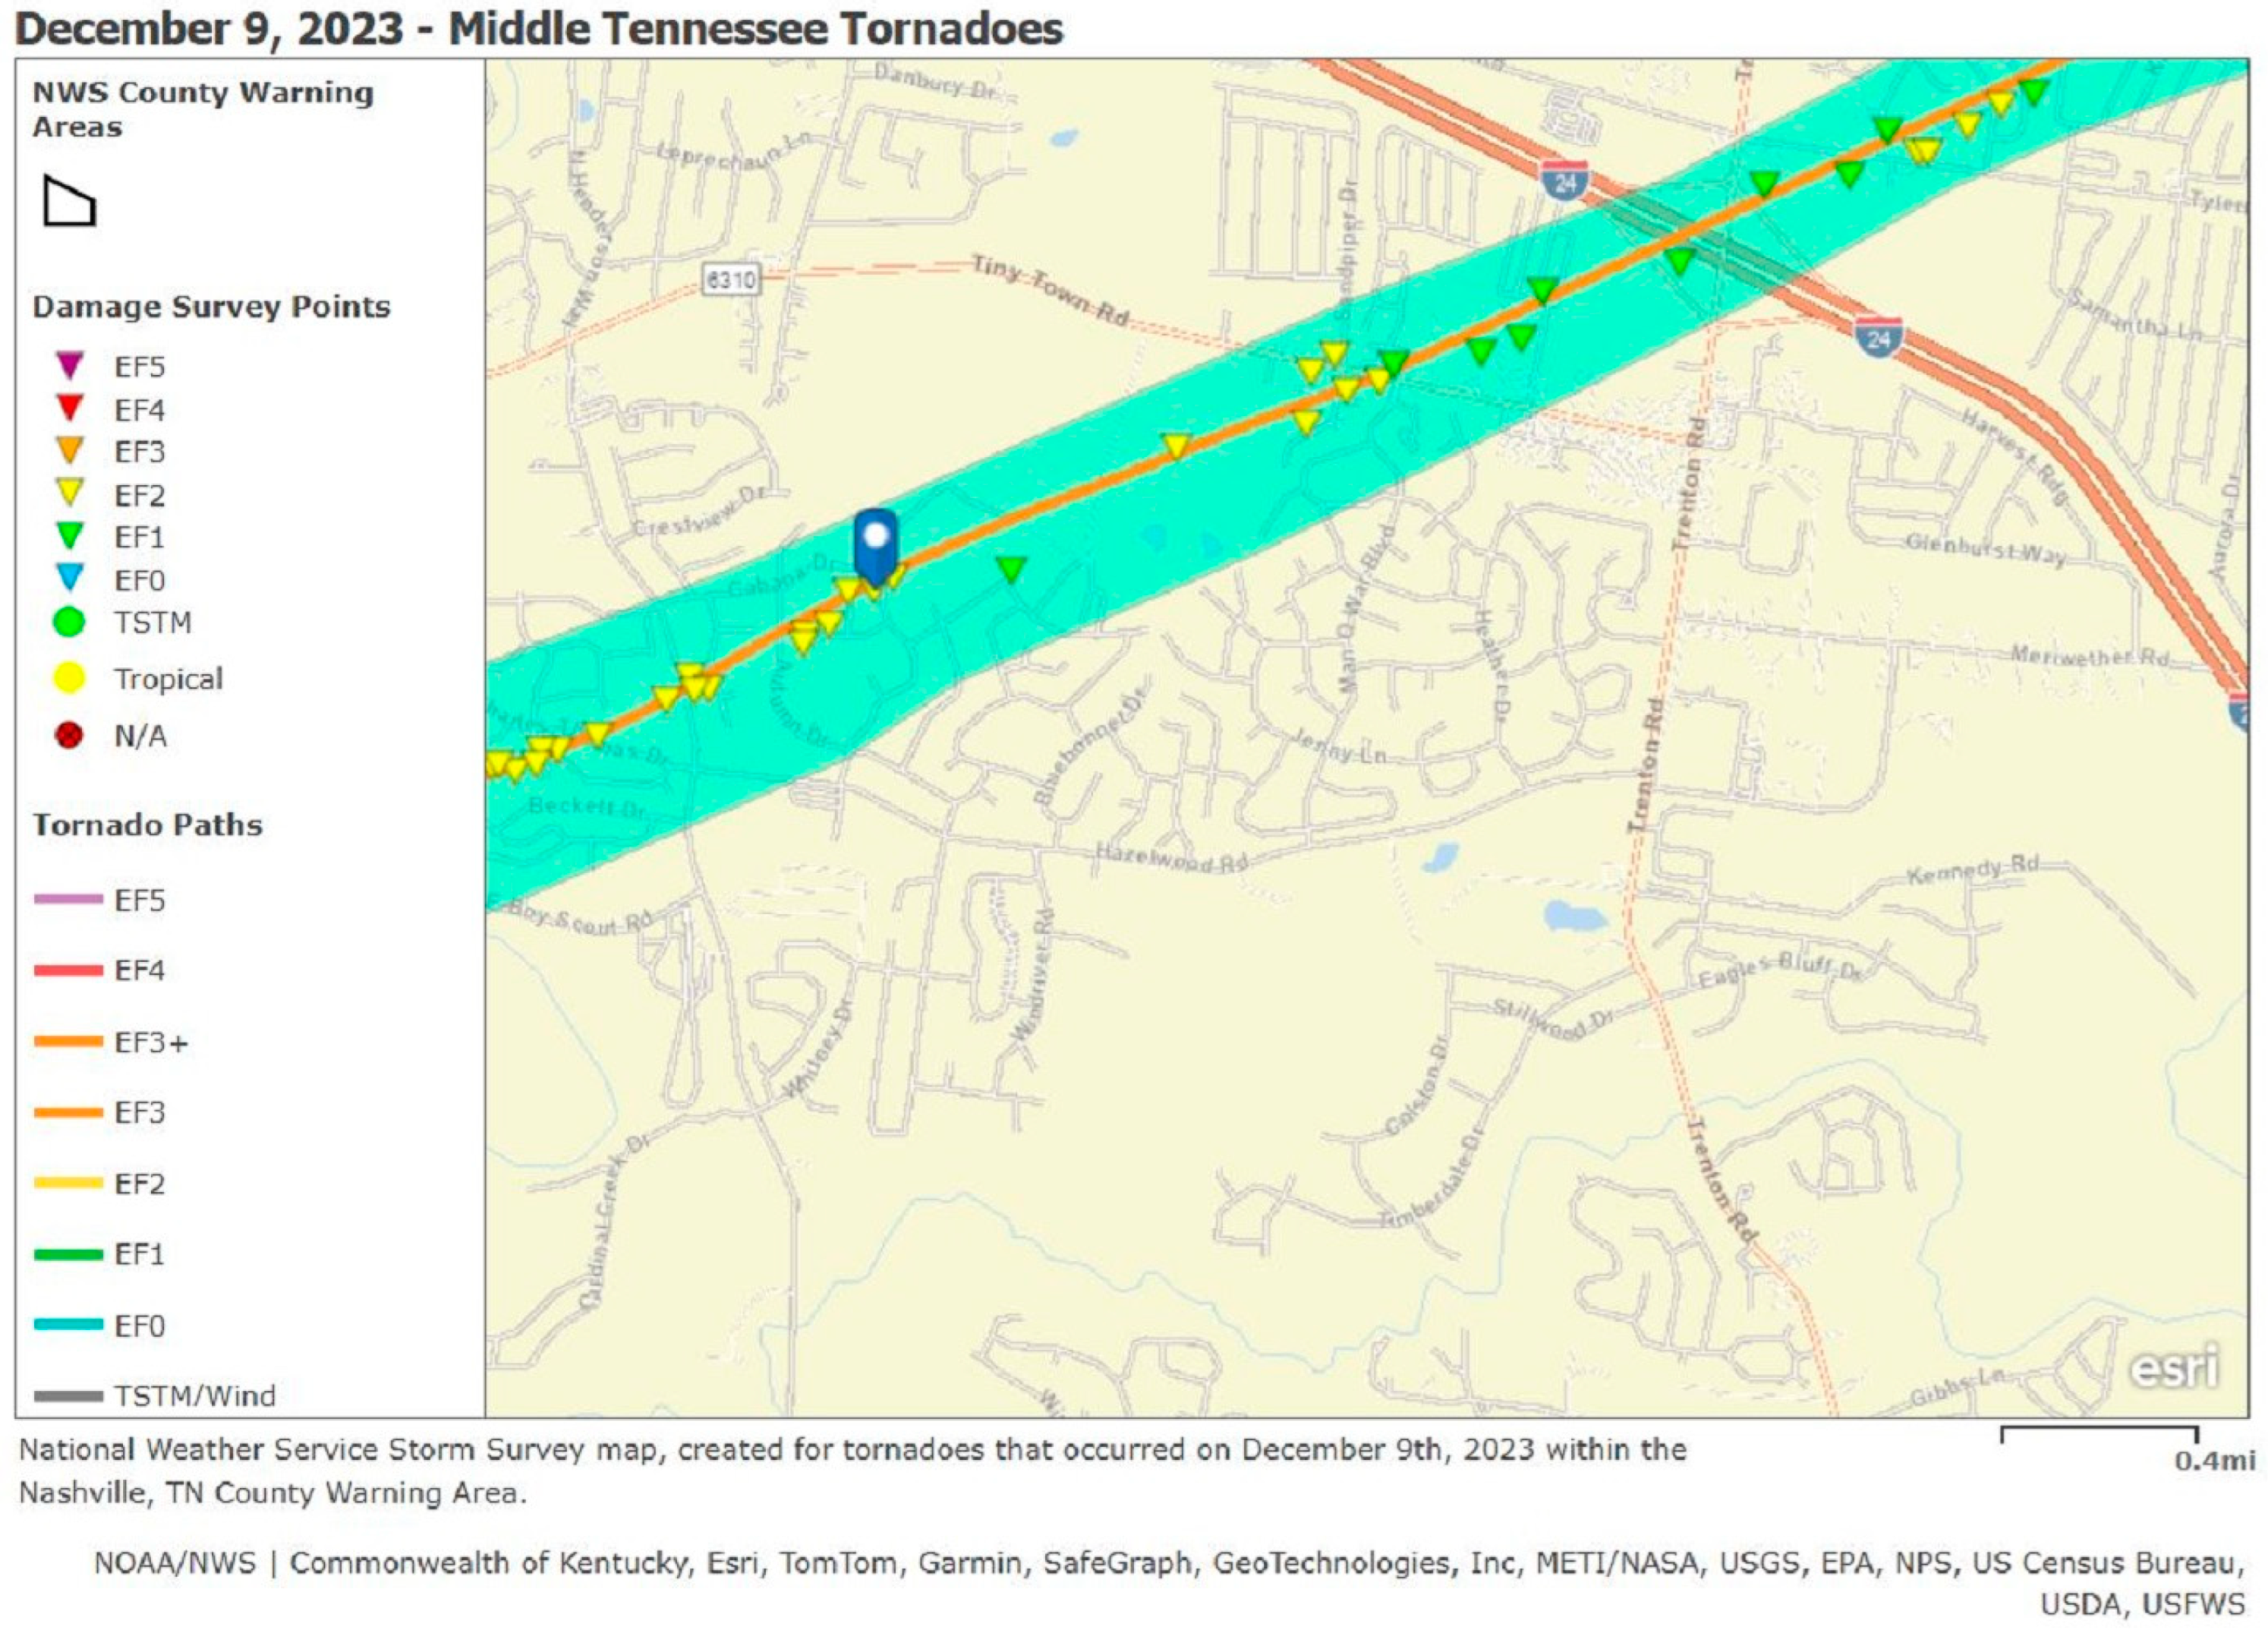
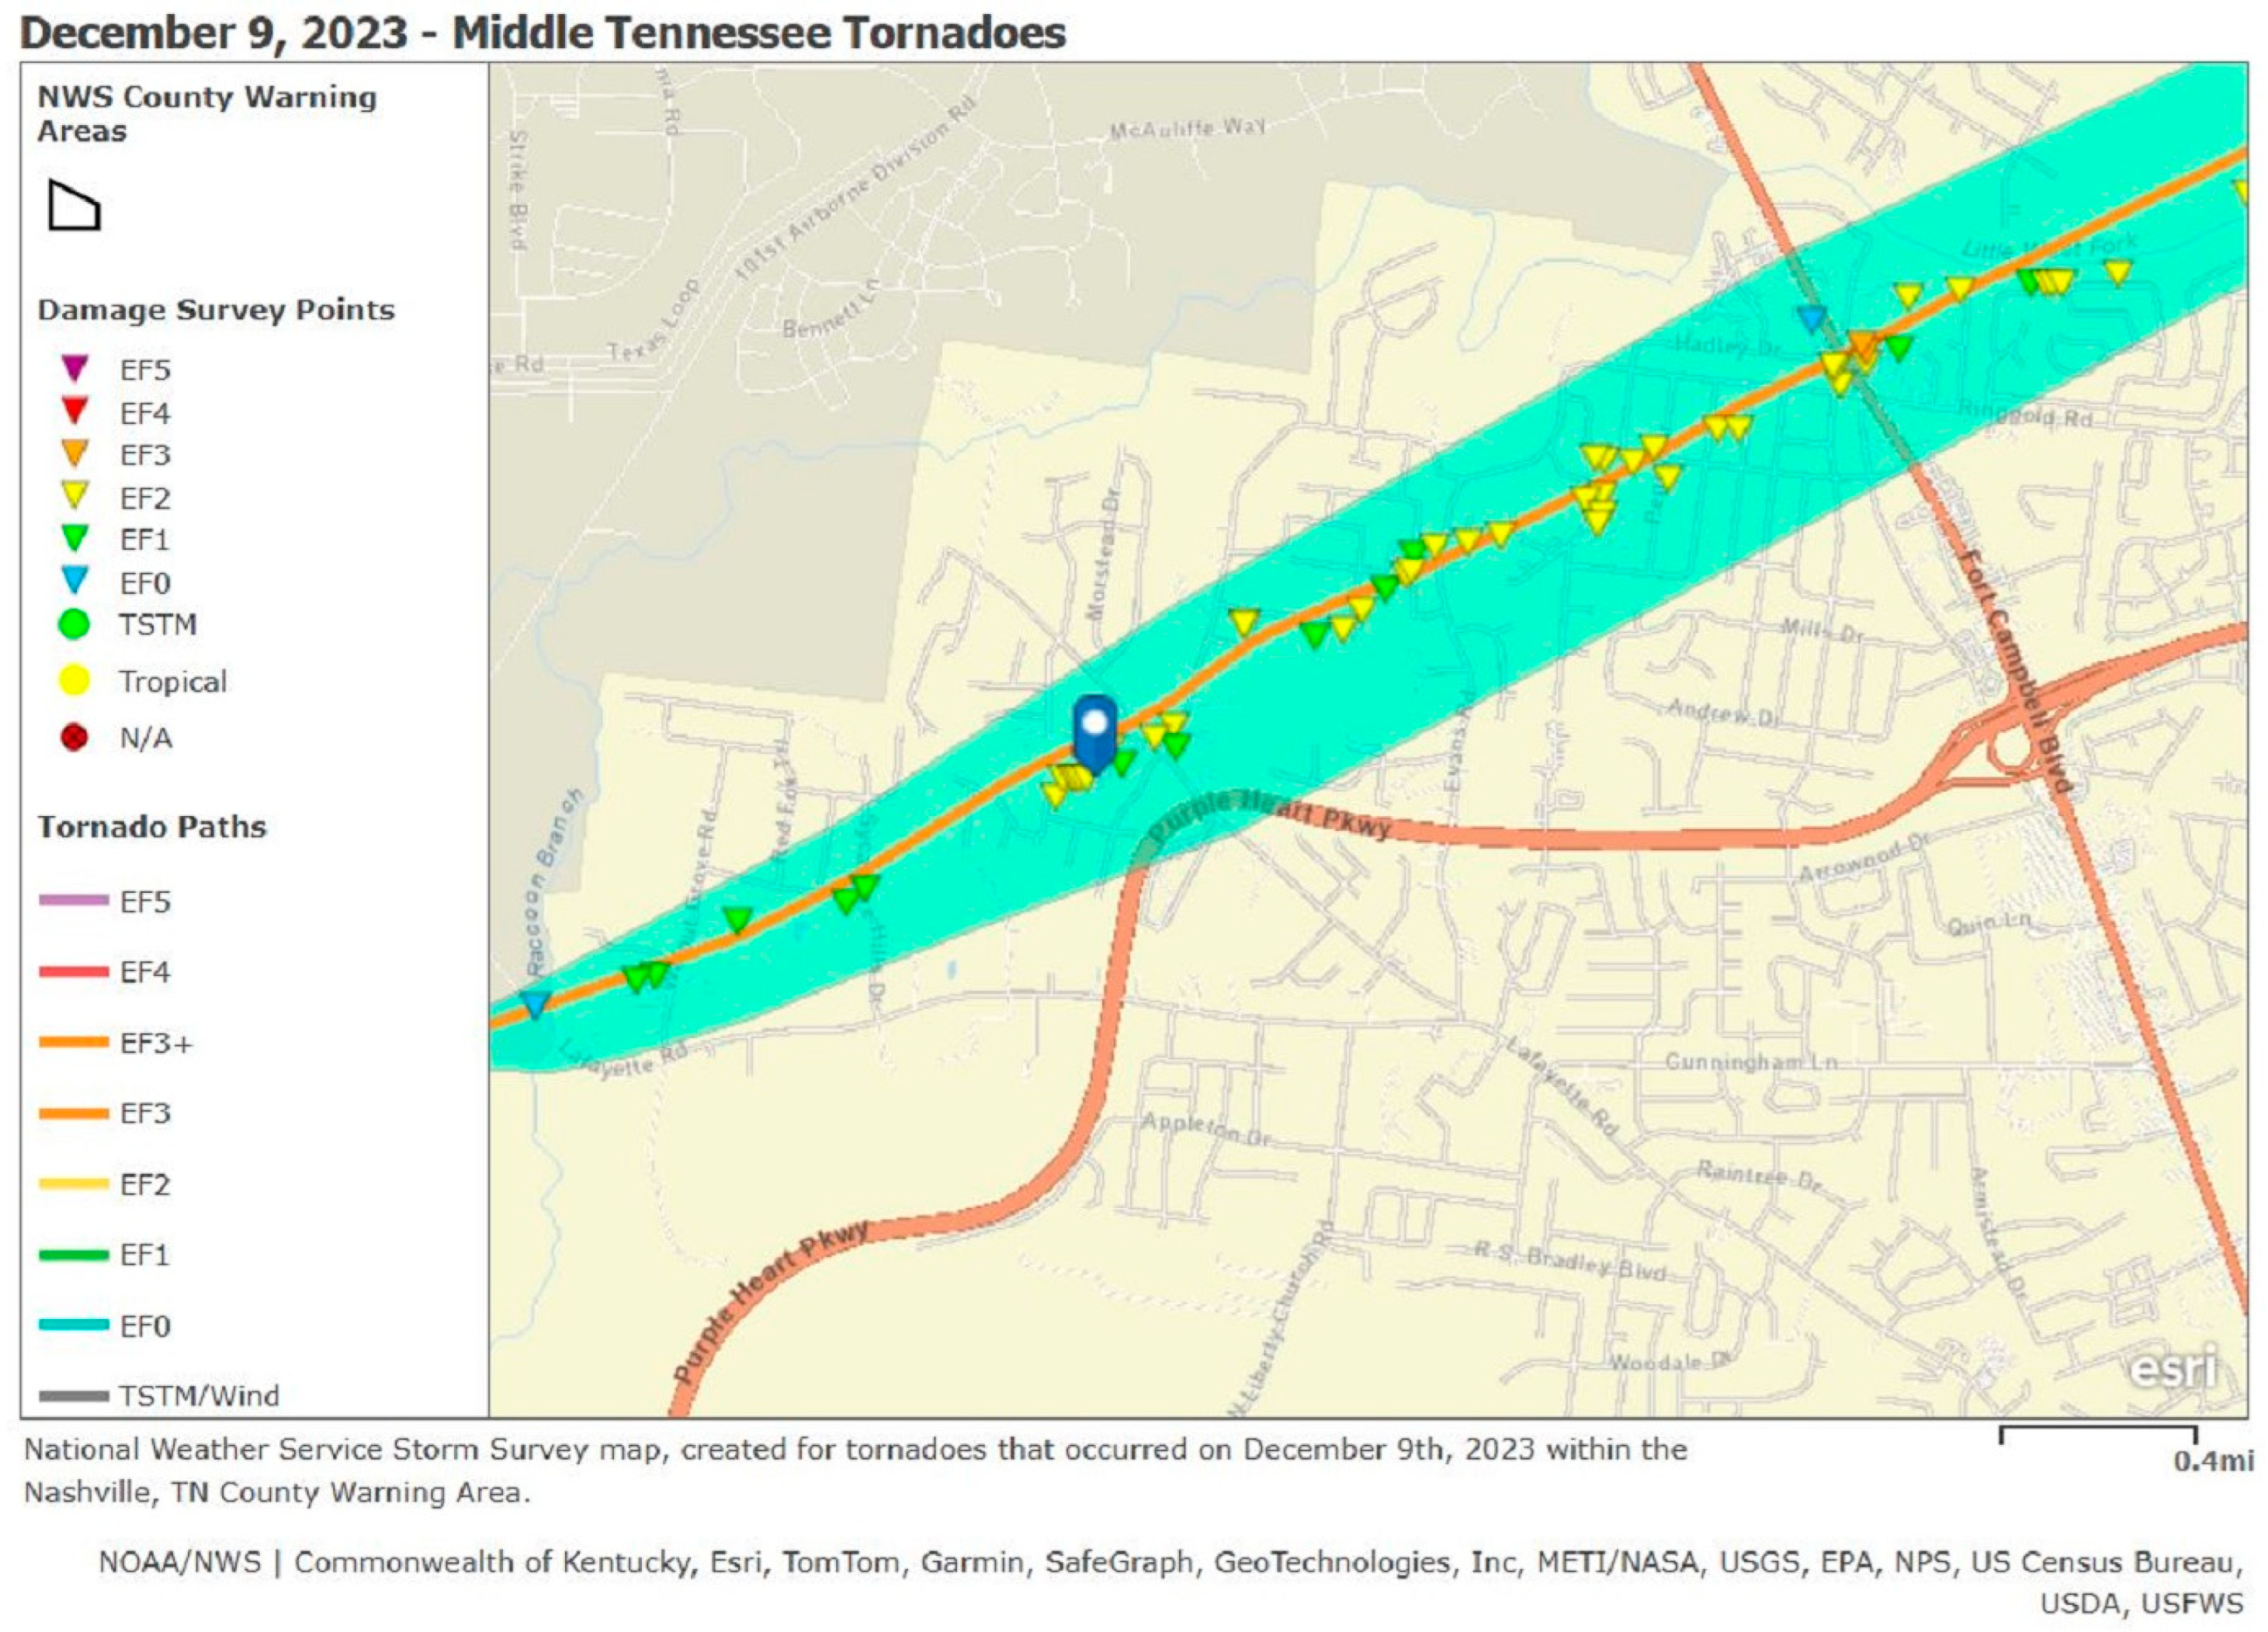
As a result of the tornado event in the Clarksville area on 9 December 2023, the residential building and its surrounding area sustained wind damage. Figure 2 displays the tornado path and illustrates the location of the building in relation to the path. The building is located within the tornado’s estimated damage area of EF2.
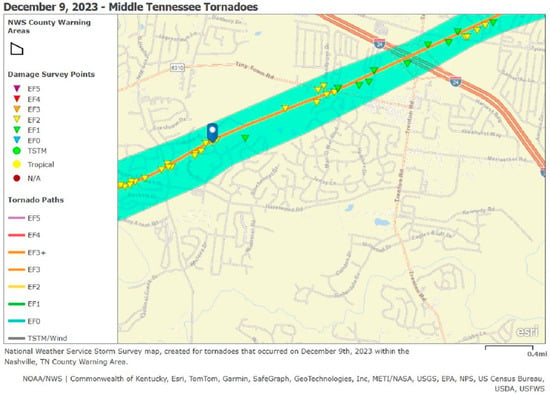
Figure 2.
Tornado path with respect to the location of the building. [Source: National Weather Service].
The entire roof structure assembly, including roof trusses, rafters, and roof decking, was completely displaced due to uplift forces generated by tornado winds. While most of the ceiling joists remain in place, several have sustained damage. Only one room with a vaulted ceiling retains its roof rafters; however, portions of the roof decking are missing in that area. The exterior wall sidings have also been damaged and require full replacement. As a result of the tensile forces exerted by the uplifted roof rafters, the top plates may need to be repaired or replaced. No signs of pull-out or failure of wall anchors or hold-downs were observed, and the foundation system, including the CMU stem walls, showed no evidence of cracking or structural damage. The floor joists and CMU piers in the crawlspace were found to be intact, although some water intrusion was noted in the area. The posts supporting both the front and back porches were damaged and displaced. All wall and floor insulation has been saturated due to water intrusion and must be replaced. In addition, all floor carpeting should be removed down to the subfloor and replaced.
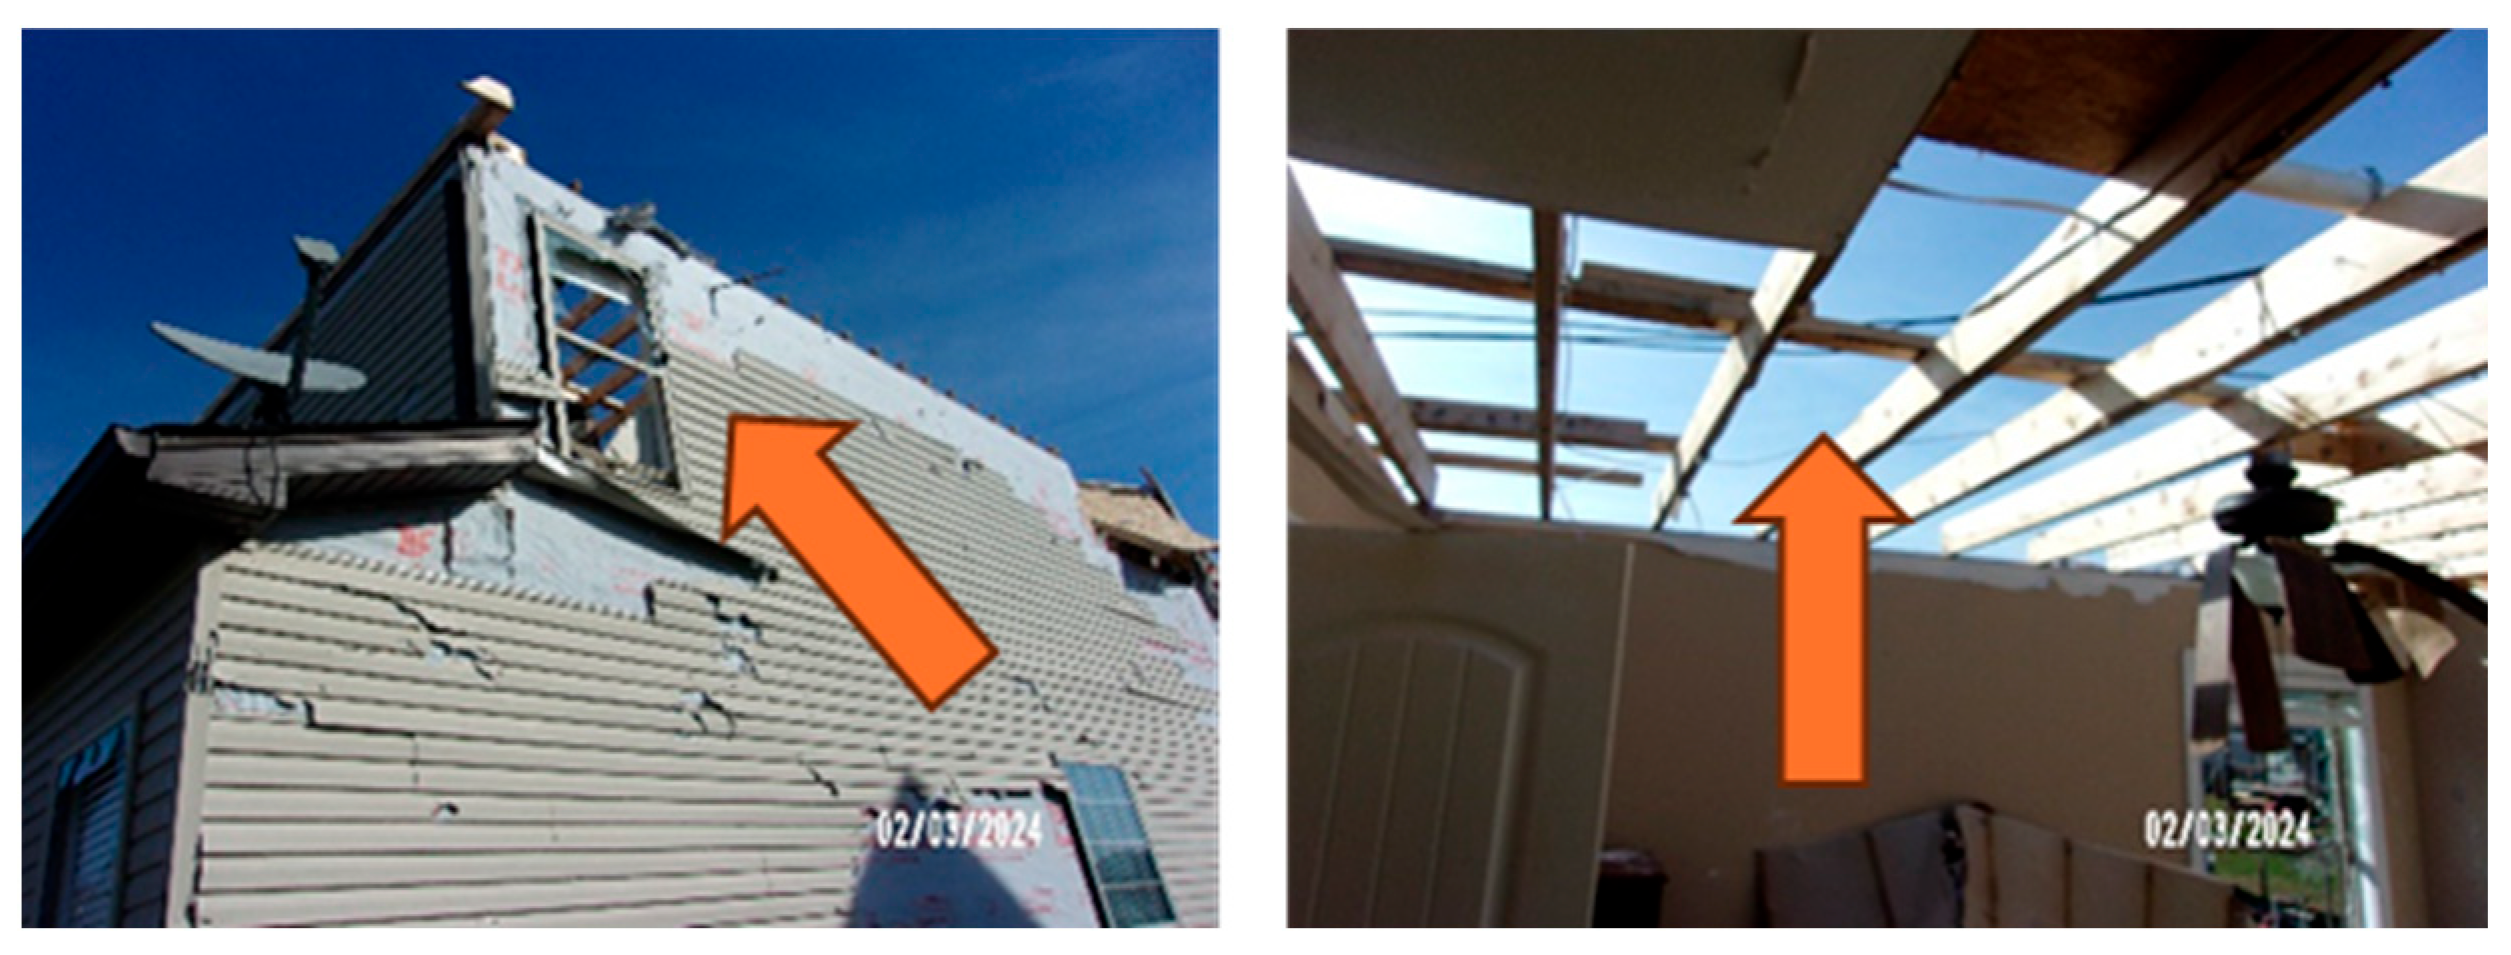
A key observation was that only a couple of windows located on the upper level windward exterior wall were blown-out (Figure 3). In contrast, most other windows across the building envelope remained intact (Figure 4).
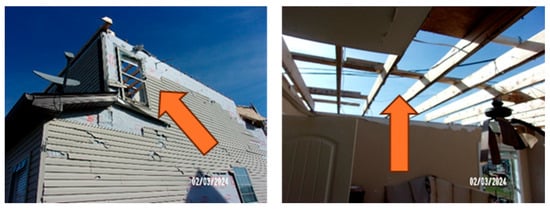
Figure 3.
(Left): Damage to the windward window. (Right): Damage to the roof panels.

Figure 4.
Case study 1: Intact glazing on windows and doors across the remaining areas of the building envelope outside the primary damage zone.
Notably, in the vicinity of the blown-out windows, roof panels were uplifted and completely detached, indicating significant internal pressurization following the initial window failure (Figure 4). This suggests that roof panel uplift occurred primarily in areas near the failed windows, while the remainder of the roof—associated with intact windows—sustained comparatively less damage.
Similar to Case 1, the evidence suggests that roof assembly failure was a consequence of increased internal pressure following localized garage door blowout, rather than occurring simultaneously with or prior to window failure elsewhere on the structure.
- Case study 2:
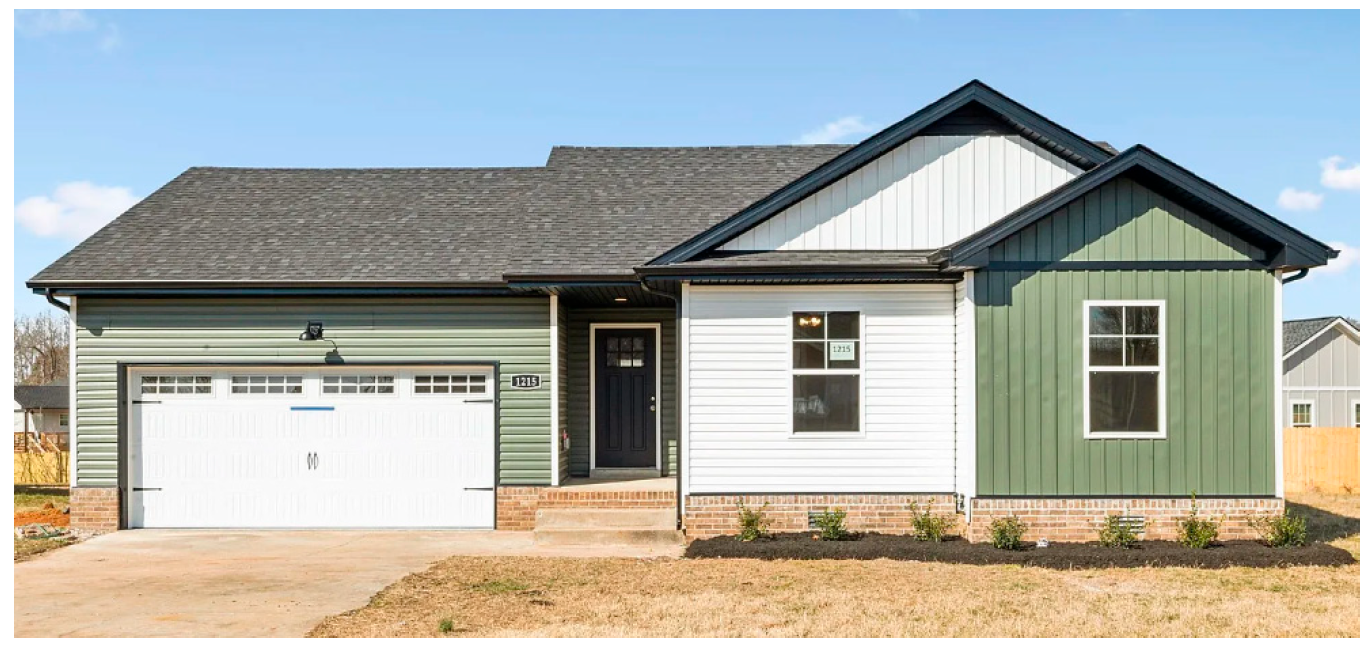
A structural inspection was conducted on 20 April 2024, on a residential building located in Clarksville, Tennessee (Figure 5). The subject building is a one-story, wood-framed residential structure with no basement, constructed in 1999 according to Zillow.com records. Figure 5 illustrates the building post-repair following the tornado event.
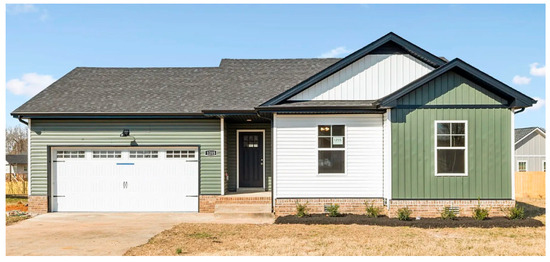
Figure 5.
Case study 2: One-story wood-frame residential building in Clarksville, TN.
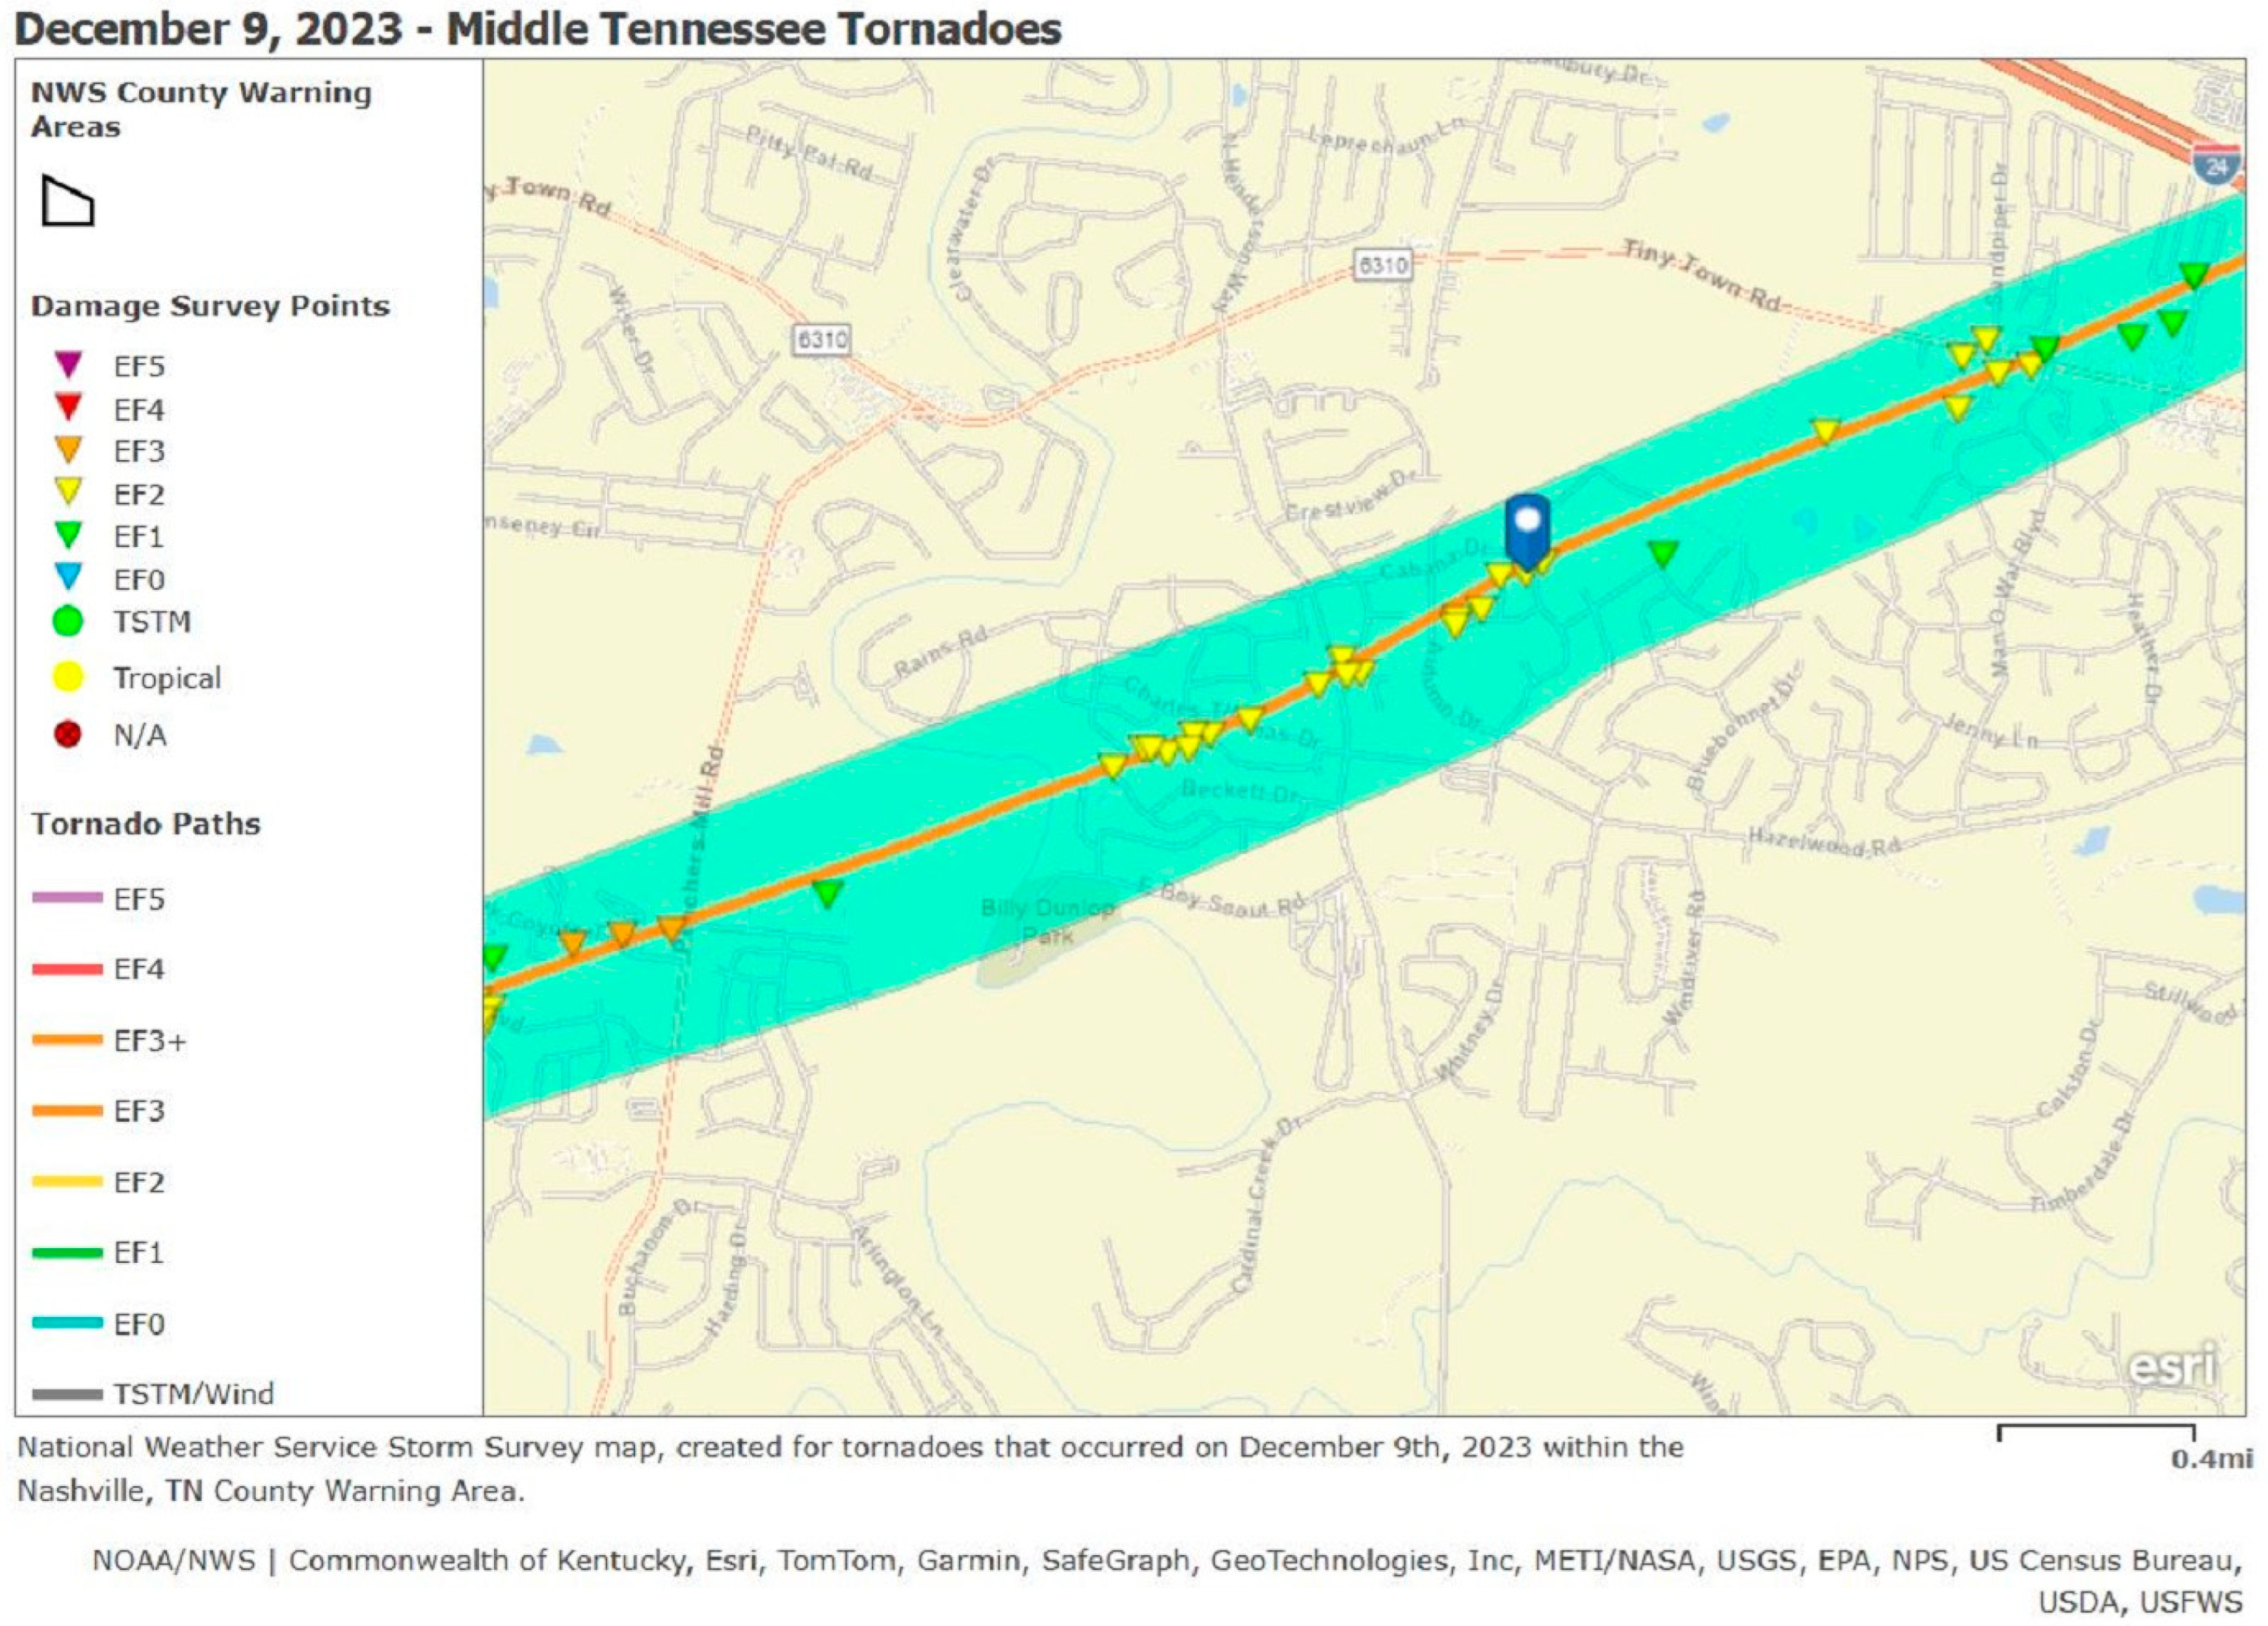
The house was hit by an EF2-level tornado on 9 December 2023 (see the tornado path below in Figure 6). During the structural inspection of the building, several significant damages were identified as a result of tornado-induced wind loading (Figure 7).
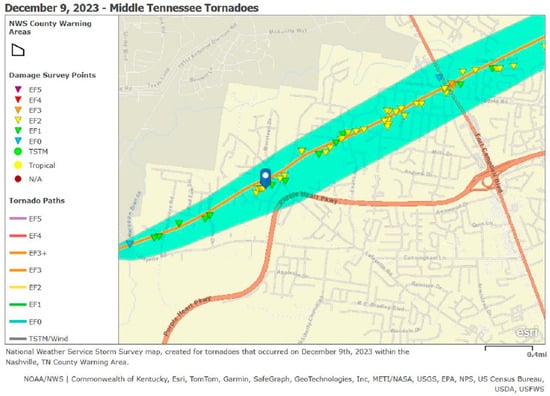
Figure 6.
Tornado path with respect to the location of the house [National Weather Service].

Figure 7.
Case study 2: Damage to the front garage door, the adjacent wall, and the gable-end wall.
The structural frame exhibited extensive damage, including a completely dislodged garage door and wall on the west side of the house, damaged ceiling joists and panels primarily affecting the western portion of the structure, a tilted and partially dislodged exterior wall on the east side, and widespread misalignment of interior stud walls and top plates throughout the building. The concrete masonry unit (CMU) stem walls on the north and west sides also displayed substantial cracking and separation between and within the blocks. The exterior wall on the east side was found to be severely compromised, having detached from both the roof rafters and the top plates, with a large portion of the gable-end of the roof blown off. In addition, the top plates on the north side of the house exhibited significant separation from the roof rafters above the exterior wall, indicating a loss of structural integrity at those connections.
A key observation was that, while the windward garage door and the adjacent wall were completely blown-out, the windows on the remaining portions of the building envelope remained mostly intact (Figure 8). However, a large section of the exterior wall and the adjacent roof framing sustained significant damage due to the increase in internal pressure following the initial breach at the garage door.

Figure 8.
Case study 2: Intact glazing on windows and doors across the remaining areas of the building envelope outside the primary damage zone.
Similar to Case 1, the evidence suggests that gable-end panel failure was a consequence of increased internal pressure following localized garage door blowout, rather than occurring simultaneously with or prior to window failure elsewhere on the structure.
- Case study 3:
A structural inspection was conducted on 15 May 2024 to evaluate a residential building located in Clarksville, Tennessee (Figure 9). The subject property is a two-story, wood-framed house with no basement, constructed in 2014 according to Zillow.com records.
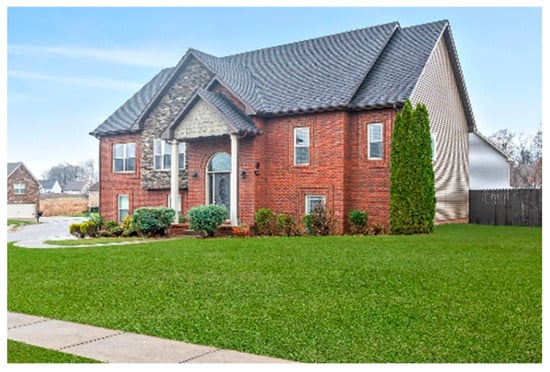
Figure 9.
Case study 3: Two-story wood-frame residential building in Clarksville, Tennessee, damaged due to the tornado event in December 2023.
As a result of the tornado event in the Clarksville area on 9 December 2023, the residential building and its surrounding area sustained wind damage. Figure 10 displays the tornado path with the location of the building in relation to the path. The building is located within the tornado’s estimated damage area of EF2.
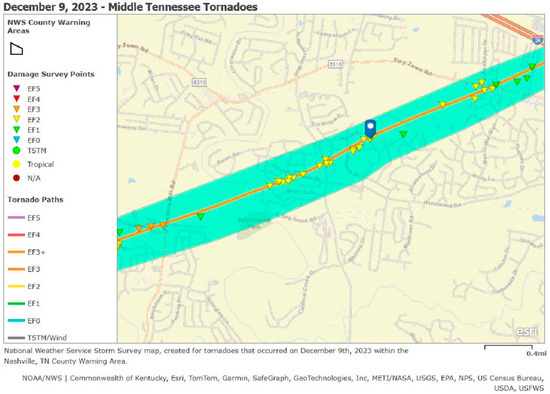
Figure 10.
Tornado path with respect to the location of the building [Source: National Weather Service].
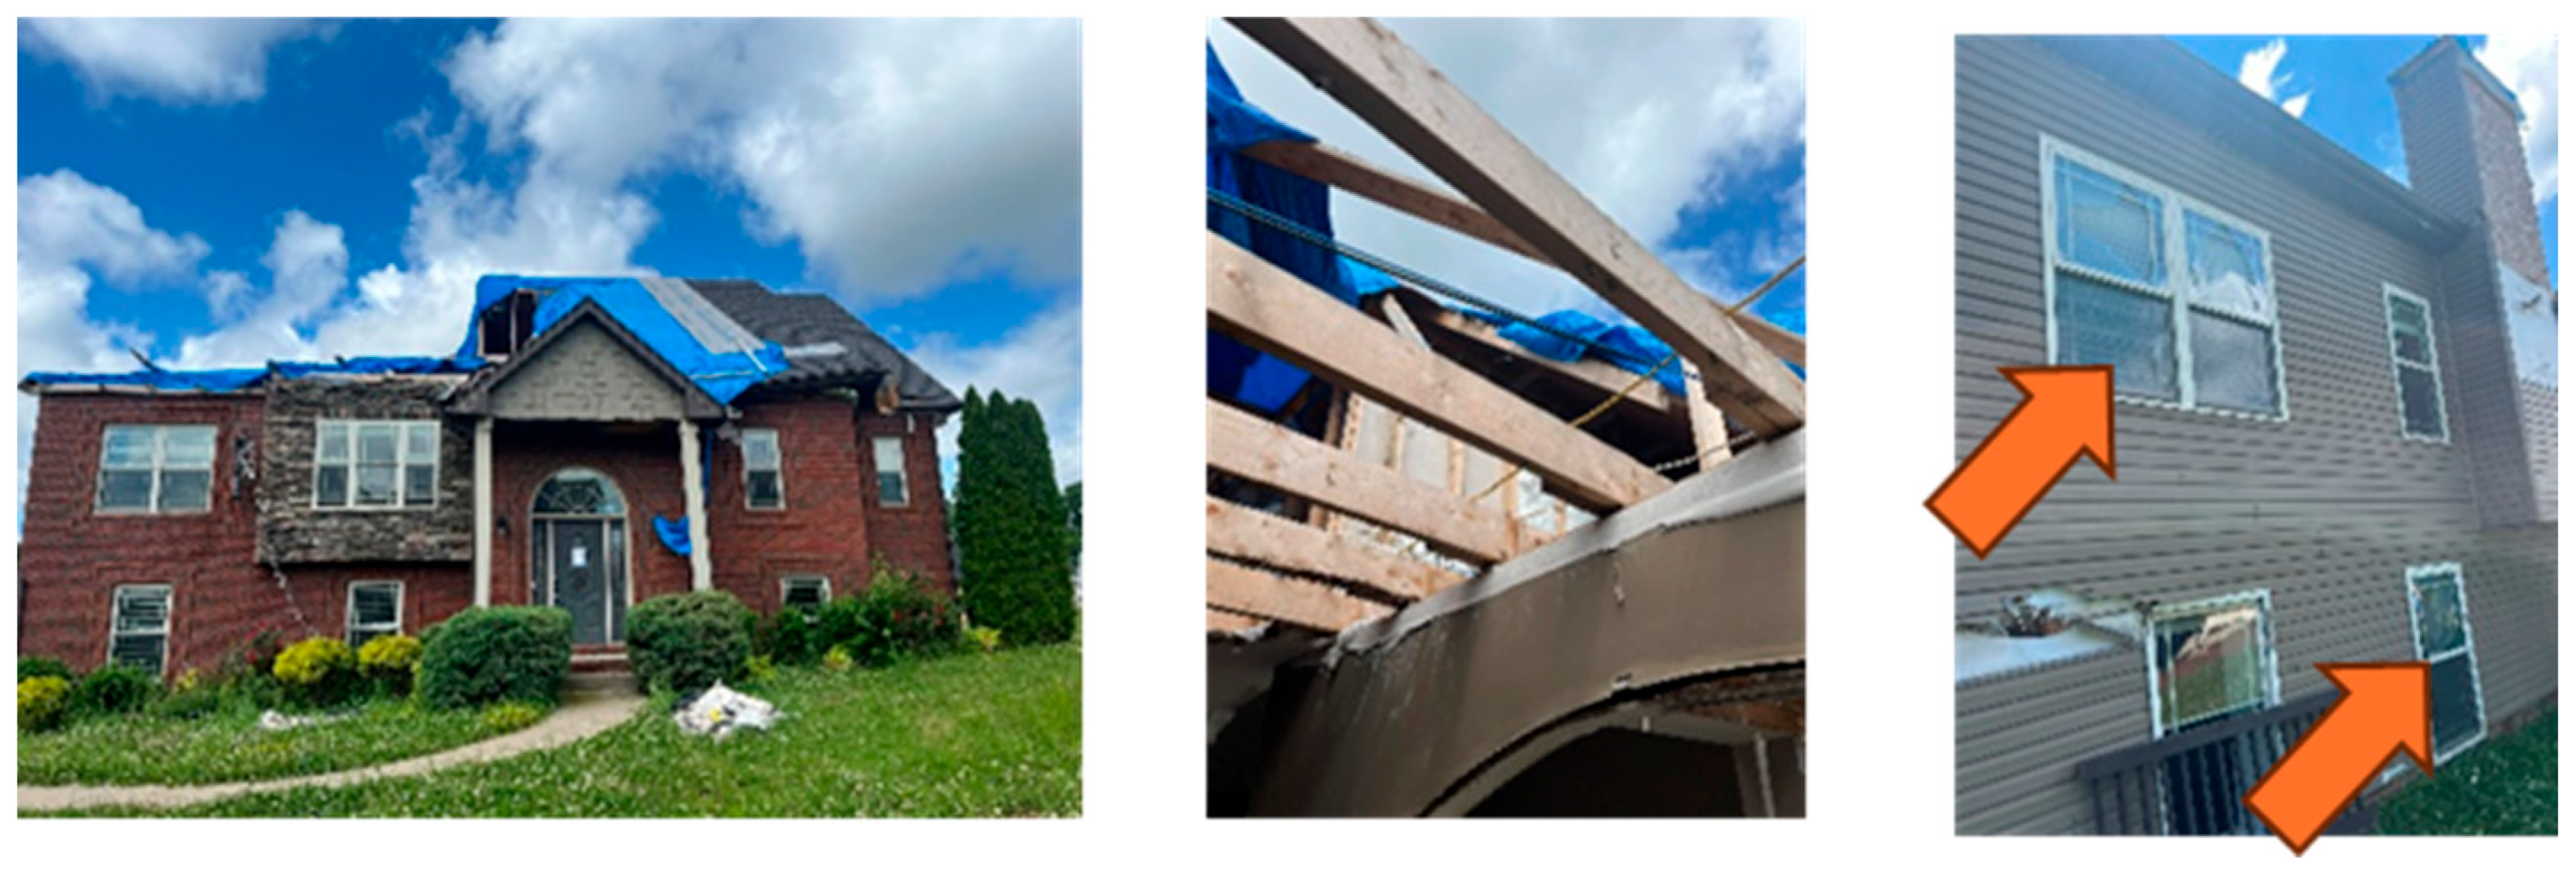
The inspection revealed that most of the roof structure, including trusses, rafters, and roof decking, had been displaced by wind uplift forces, with only a portion of the roof elements near the attic access remaining intact (Figure 11).
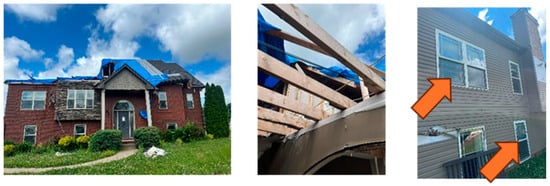
Figure 11.
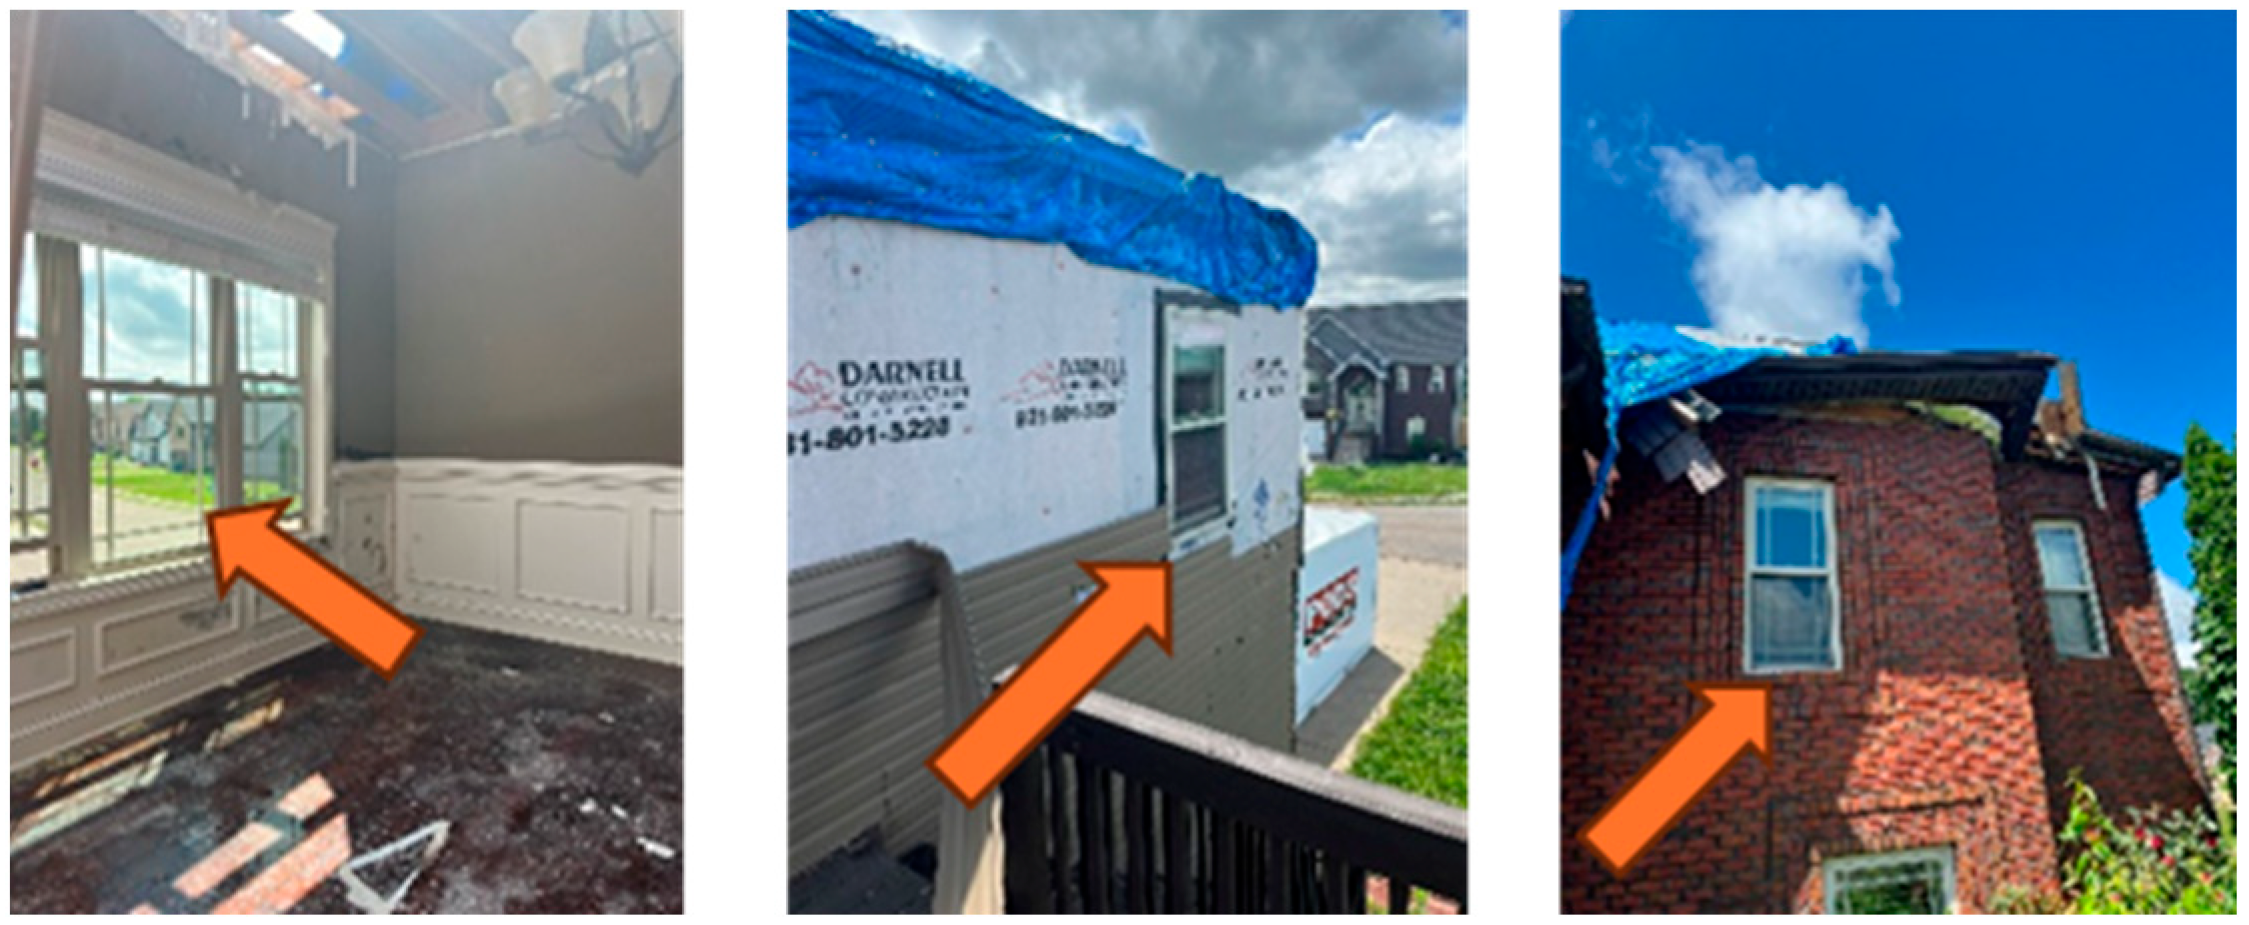
Case study 3: (Left) and (Center): Roof damage. (Right): Blown-out windows.
Several of the ceiling joists were still in place, though some showed signs of damage. The exterior wall sidings sustained notable damage and required full replacement. Tension forces transferred from the roof rafters during uplift likely compromised the top plates, which may require repair or replacement. However, no displacement of wall anchors or hold-downs was observed, and the foundation and CMU stem walls showed no signs of cracking or structural damage. A post on the front porch was found to be damaged and misaligned. Despite the extent of damage, the walls, floors, window frames, and door frames were found to be level and plumb, with no significant permanent deformation detected in the wall framing.
Despite the significant damage to the roof assembly caused by increased internal pressure and external suction, and although the windows on one side of the building were mostly blown-out, the windows on the rest of the building envelope remained largely intact (Figure 12).
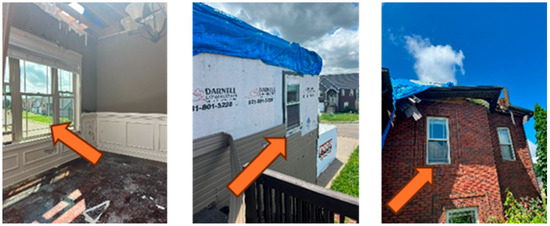
Figure 12.
Case study 3: Intact window glazing on the building envelope.
A similar failure pattern is observed in this case study: a couple of windows were blown-out due to wind pressure and windborne debris, followed by the uplift failure of roof panels as a result of increased internal pressure.
- Case Studies Conclusion:
Based on the damage inspections conducted on the three building case studies, a consistent pattern emerged: one or two blown-out windows caused by windborne debris on one side of the building, accompanied by partial to total roof assembly failure near the affected area, while the remaining windows and doors on the rest of the building envelope remained intact. This indicates that the actual enclosure classification should be considered Partially Enclosed rather than Enclosed. Accordingly, for buildings exposed to windborne debris, using the Partially Enclosed internal pressure coefficient (GCpi = ±0.55), rather than the Enclosed value (GCpi = ±0.18), better aligns with real-world performance and should be used in design. Importantly, the internal pressure coefficients associated with each enclosure category are adopted directly from ASCE 7 without modification; our proposal alters only the classification decision, not the coefficient values.
- Wind Failure Mechanism:
To validate the failure mechanism of the roof panels adjacent to blown-out windows, as observed in the case studies, here we calculate the design uplift force for the roof panels and compare that with window glazing in the balance of the building envelope to see which would fail first.
According to the International Residential Code (IRC 2018) [14], Table R602.3(1), the prescribed fastening schedule for roof sheathing up to 1 inch thick requires 8d common nails spaced at 6 inches on edges and 12 inches at intermediate supports. Per Table 12.2C of the National Design Specification (NDS) for Wood Construction (2018) [15], the maximum withdrawal capacity of an 8d common nail is 32 pounds.
Assuming a common rafter spacing of 16 inches, each nail at intermediate supports has a tributary area of 1.3 square feet (16″ × 12″). With the withdrawal capacity of an 8d common nail, this allows the roof panel with a single nail tributary area to resist up to 25 pounds per square foot in withdrawal for common lumber species such as Hem Fir or Douglas Fir, both with specific gravities of up to 0.5. These species are widely used in wood-frame construction. However, increased rafter spacing enlarges the tributary area per nail, resulting in greater withdrawal demand on each fastener and potentially reducing the allowable wind uplift resistance unless additional fastening is provided.
In comparison, a typical double-pane window with 1/8-inch glass in a vinyl frame is often rated for approximately ±30 psf of wind pressure
On the other hand, according to ASCE 7, the external wind pressure coefficient for the windward roof surface at a 20-degree slope is approximately −0.69, whereas the leeward external pressure coefficient for exterior walls with windows is −0.48. For 30–45-degree roof angles, the corresponding coefficients are −0.43 for the roof and −0.43 for the walls.
This indicates that the net external suction (uplift) on the roof panels is greater than the pressure acting on exterior walls with windows. As a result, roof panel failure due to wind uplift is more probable than window blowout, especially when accounting for both internal and external pressure coefficients acting together under wind load conditions. This failure mechanism aligns with post-event damage surveys, which commonly show roof uplift damage occurring before window blowout on the remaining portions of buildings.
2.2. Analytical Validation
Beyond the real-world case studies, the author applied two analytical investigations of windborne debris effects to corroborate the field observations. The first indicates that the probability of building damage increases in the presence of debris relative to the no-debris case. The second shows the likelihood of debris-induced window failure, supporting the classification of affected structures as Partially Enclosed under ASCE 7.
- Analytical Validation 1:
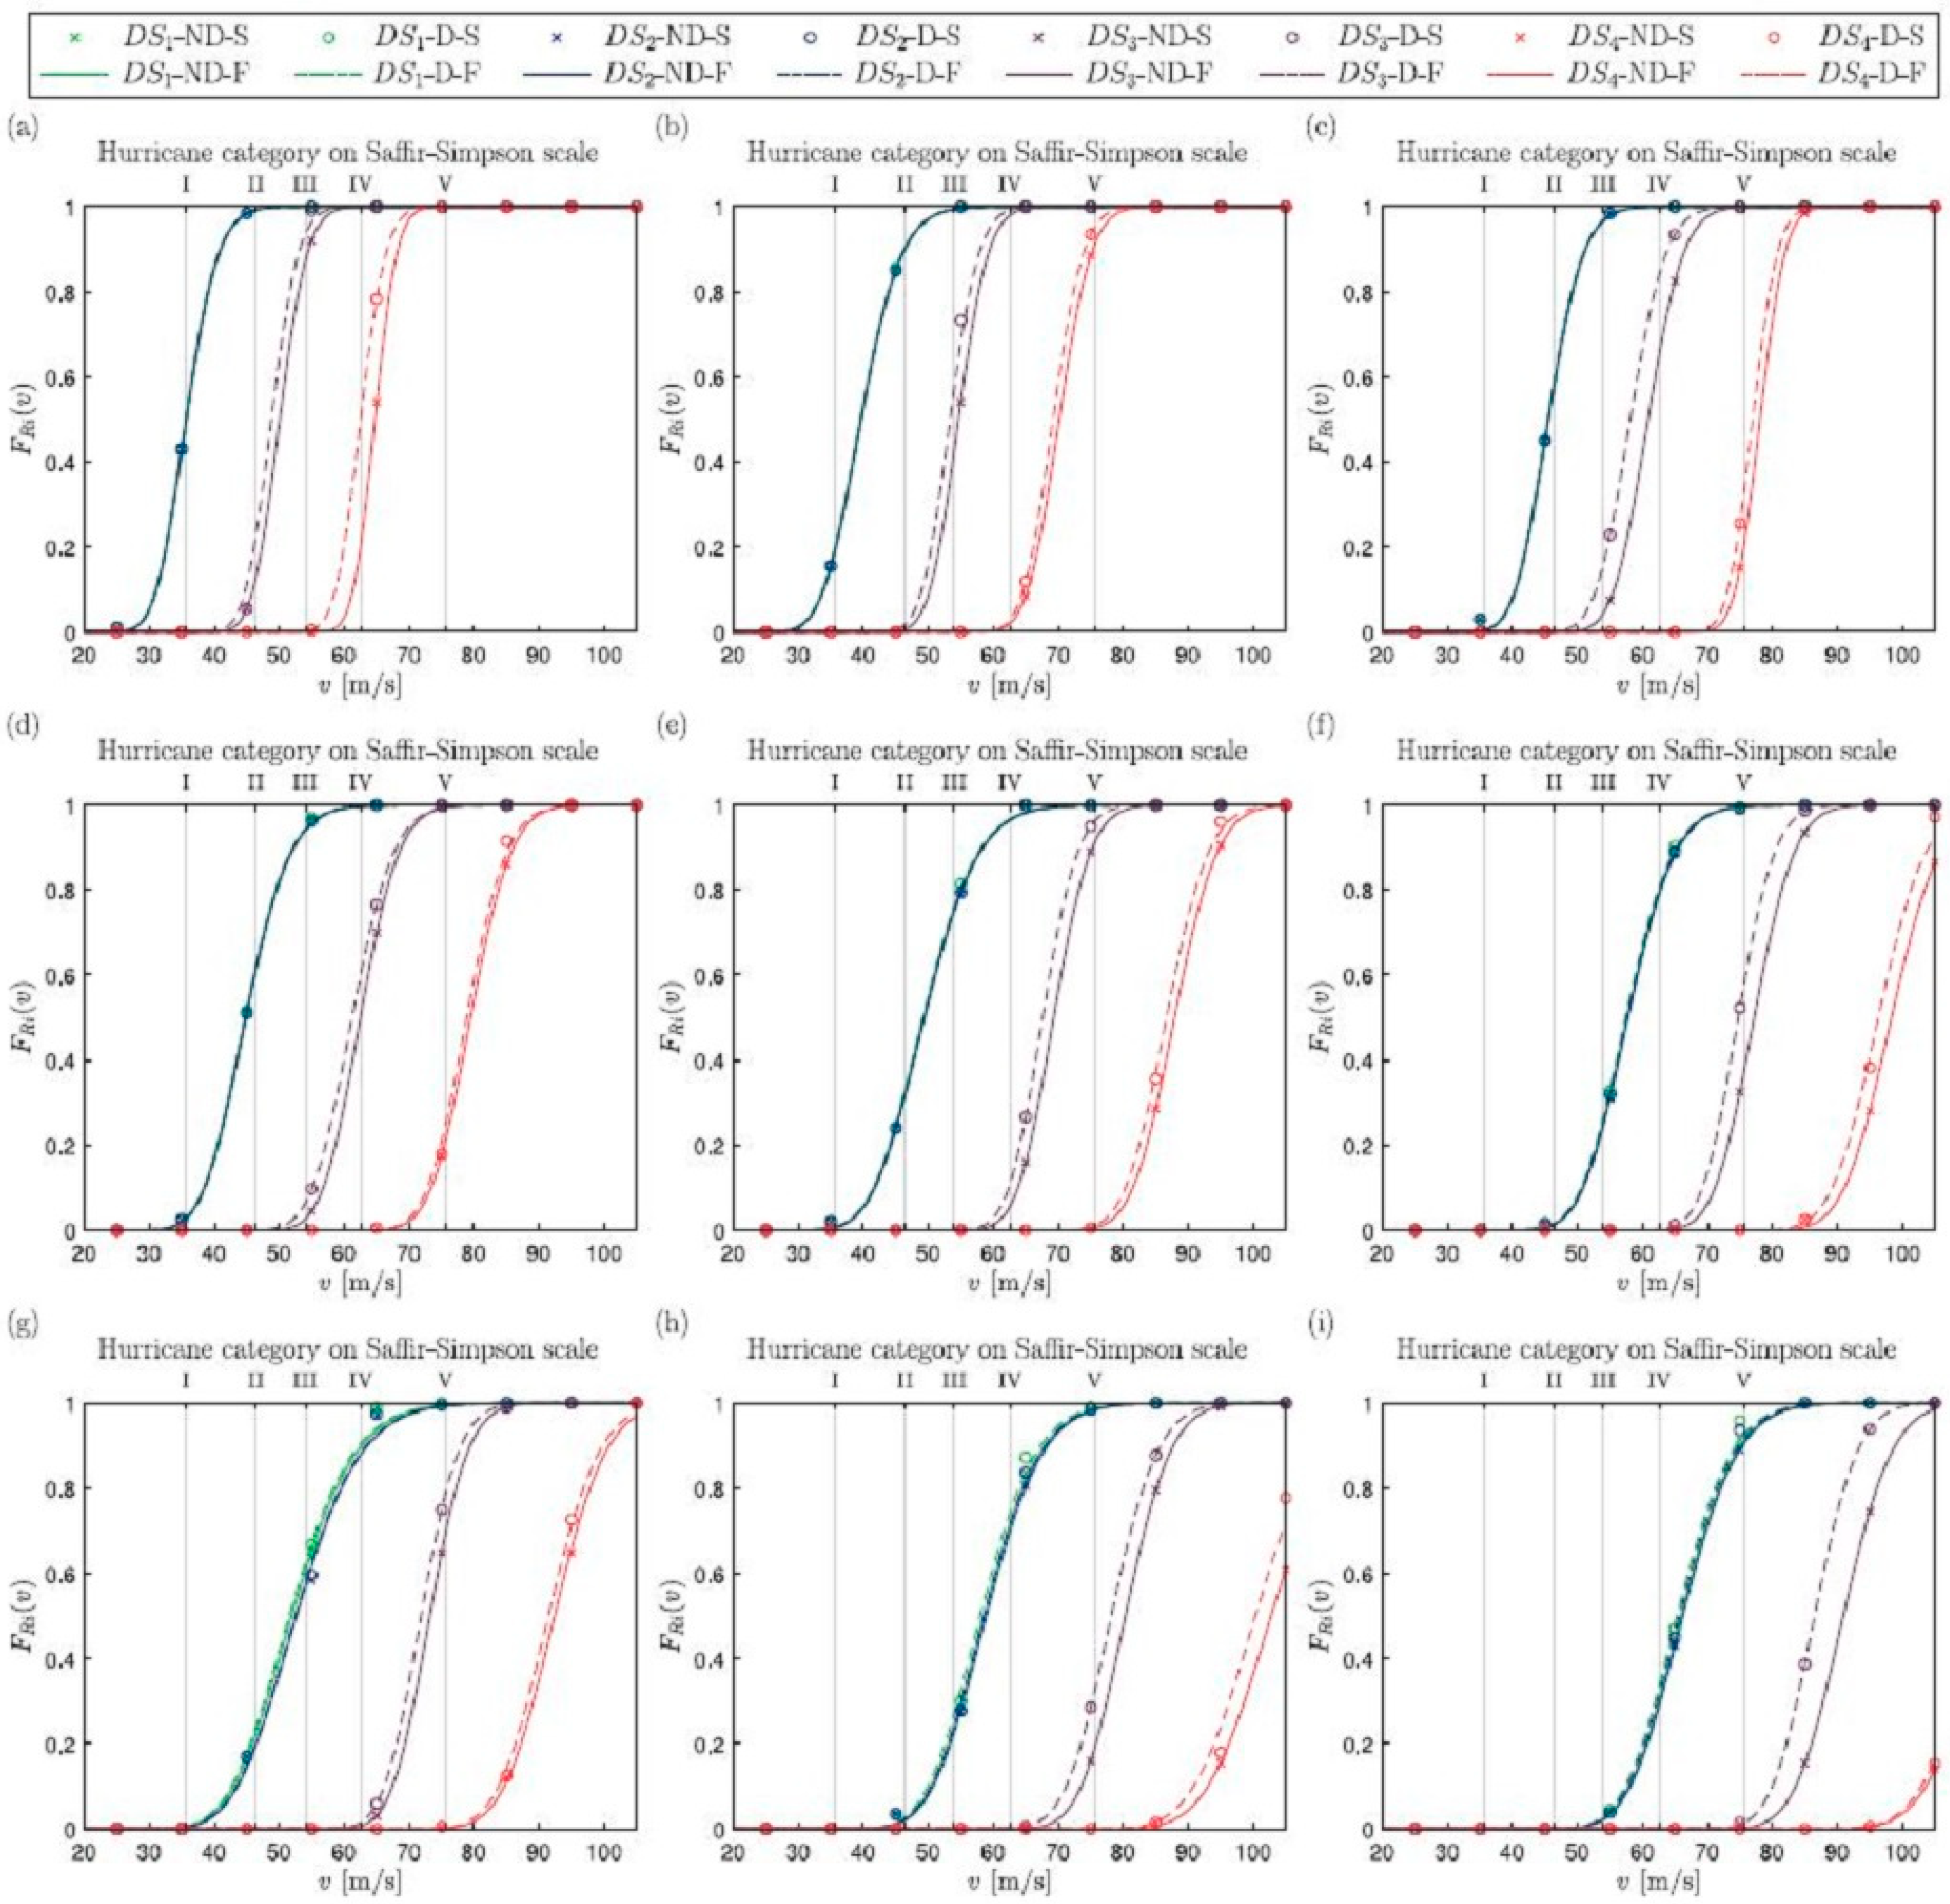
The first study is by Ahmed Abdelhady, Spence, and McCormick (2018) [16], titled “Risk and fragility assessment of residential wooden buildings subject to hurricane winds, investigating the impact of debris on buildings in a community”. This study examined the effect of debris under different building density conditions—comparing cases where a building was surrounded by densely packed structures versus a building located in a more open, dispersed community. The findings indicated that under the same wind speed conditions, the likelihood of higher damage due to debris ranged from 5% to 20%, specifically in higher damage states. Figure 13 illustrates the fragility functions of low-rise wood-frame buildings subjected to wind events, with and without windborne debris, for a gable-roof building archetype.
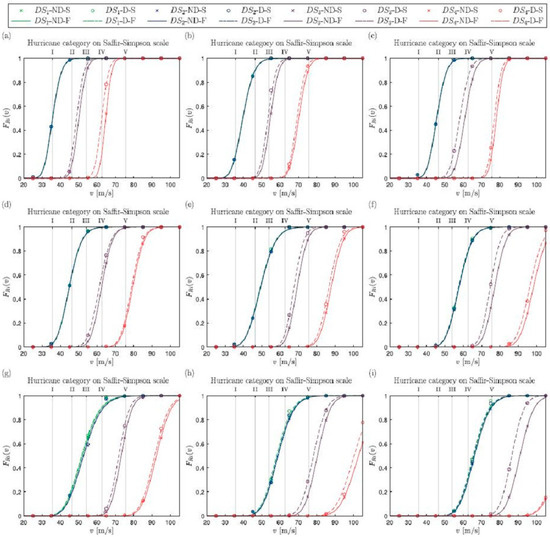
Figure 13.
Building fragility curves: (a) construction case = 3 and FAR = 0.1; (b) construction case = 3 and FAR = 0.3; (c) construction case = 3 and FAR = 0.6; (d) construction case = 5 and FAR = 0.1; (e) construction case = 5 and FAR = 0.3; (f) construction case = 5 and FAR = 0.6; (g) construction case = 7 and FAR = 0.1; (h) construction case = 7 and FAR = 0.3; and (i) construction case = 7 and FAR = 0.6. Nomenclature: no debris (ND); debris (D); simulation results (S); and fitted log-normal CDF (F).
The fragility functions were derived for three different construction types and three floor aspect ratios (FARs). The curves represent both simulation results (S) and fitted lognormal cumulative distribution functions (CDFs). As shown, in most cases, the presence of debris significantly increases the probability of damage.
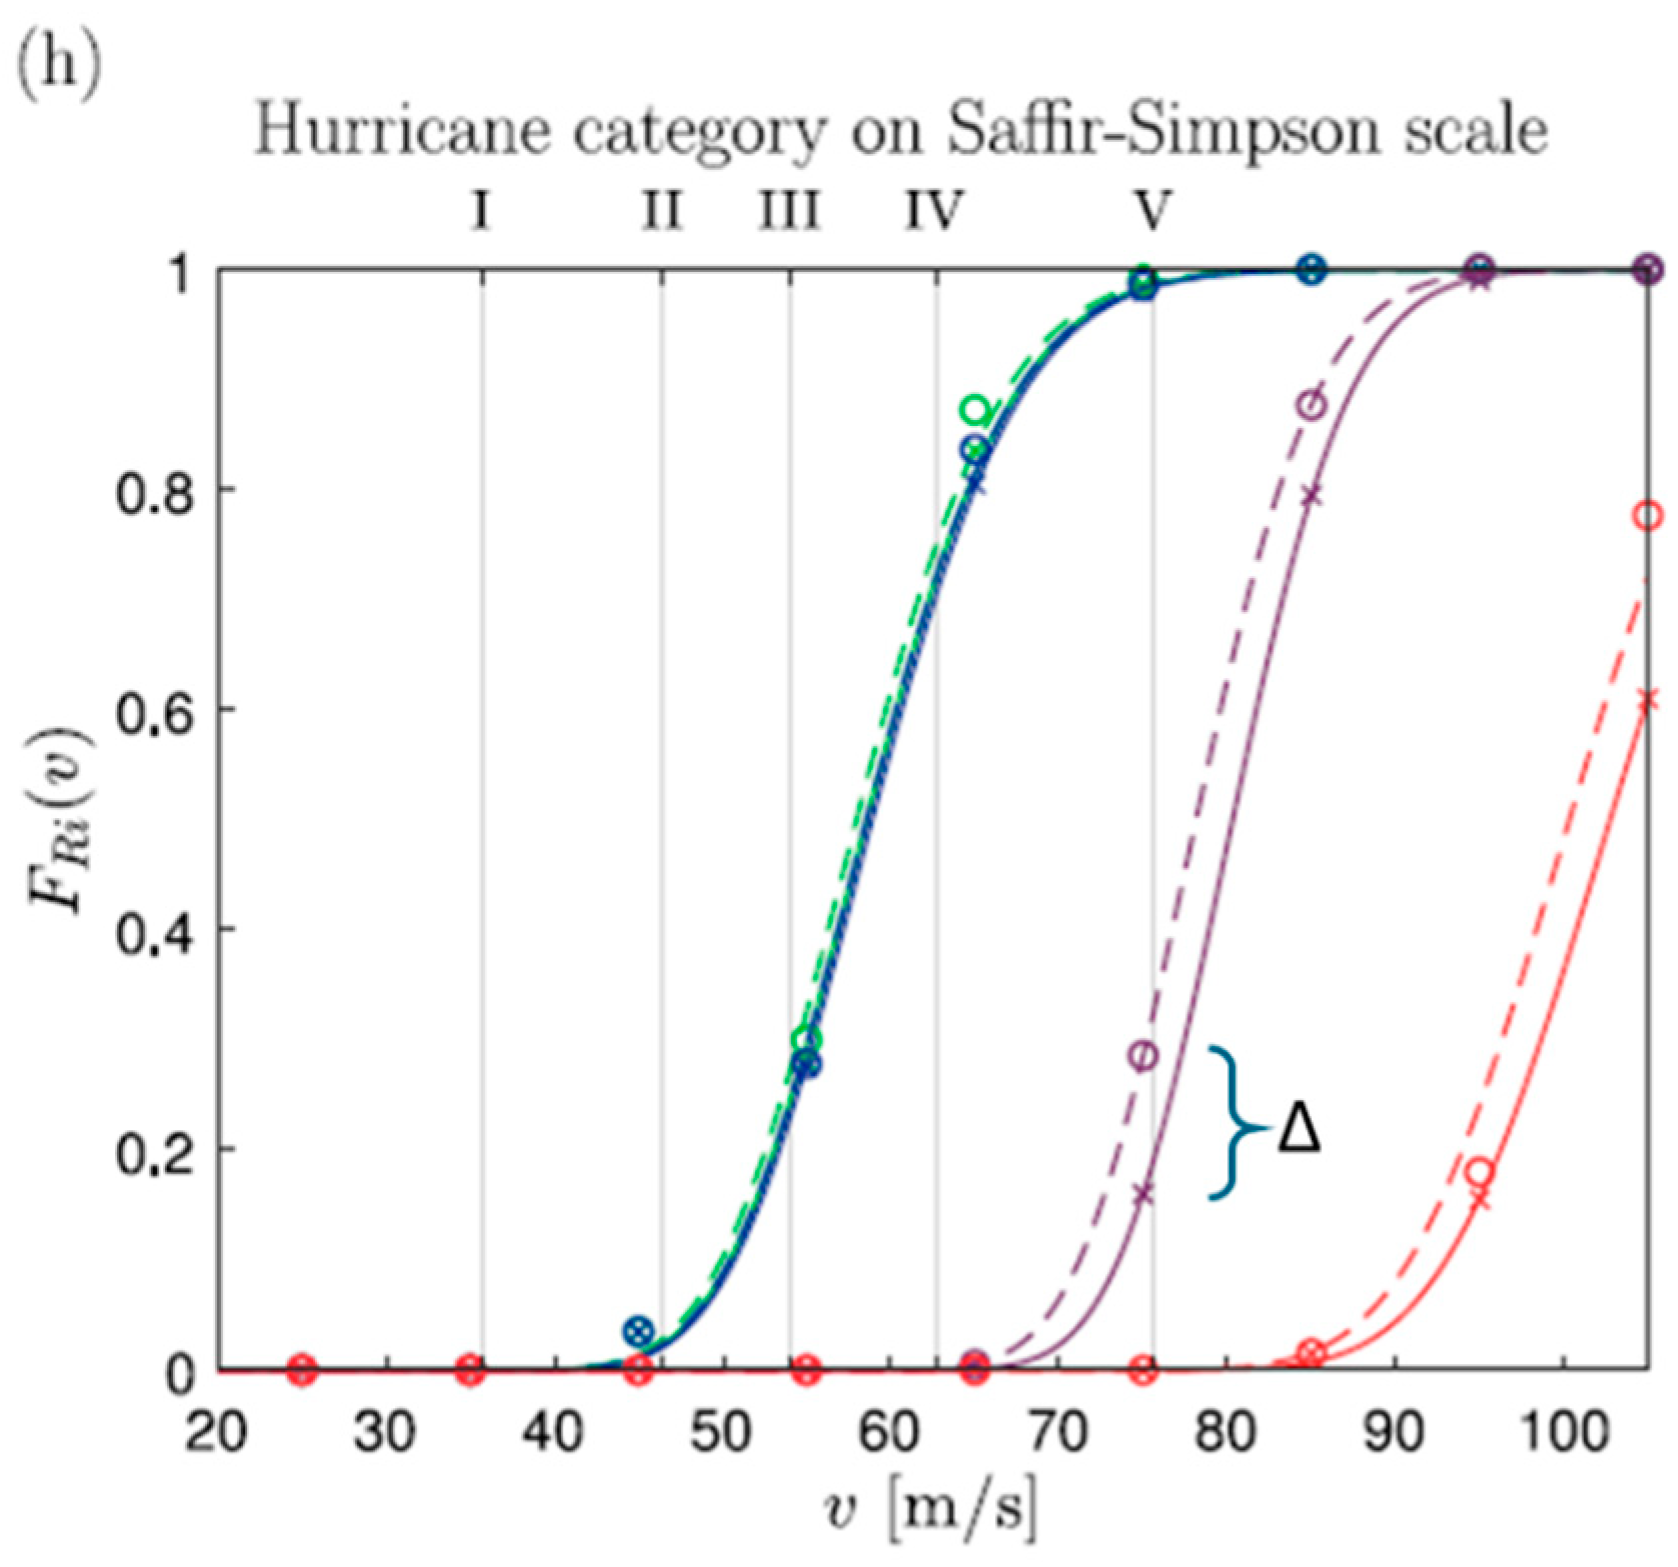
Taking construction case (7) as an example, Figure 14 illustrates the difference in damage probability with and without the effect of windborne debris impact. This difference is about a 10% difference in probability of damage, denoted as Δ, and is shown for a representative wind hazard intensity of 75 m per second.
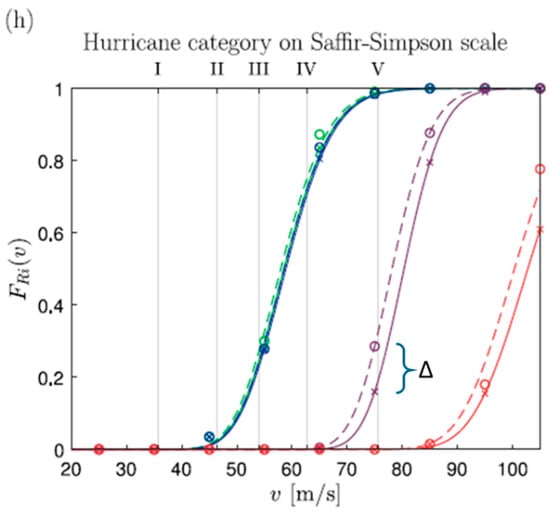
Figure 14.
Construction case (7) and FAR = 0.3.
According to the observations above, the study by Ahmed Abdelhady, Spence, and McCormick (2018) [16] provides analytical evidence supporting the conclusion that windborne debris increases the probability of wind-induced damage in residential buildings. This emphasizes the importance of incorporating the effect of windborne debris in wind design calculations for buildings.
- Analytical Validation 2:
The author applied the study by Song and Ou (2009) [4], who performed a numerical analysis of windborne debris damage to buildings. They adopted analytical equations for debris flying trajectories from an earlier study by Tachikawa (1983) [3] to estimate the total number of debris items in relation to the area of the debris source region, the length of the structure, the radius of the debris region, the wind direction angle, and the distribution density of debris. Furthermore, they proposed trajectory equations that incorporate debris mass, reference length, reference area, and mass moment of inertia, along with kinematic variables such as displacement, velocity, angular rotation, and time. Environmental factors, including wind speed, air density, gravitational acceleration, and the relative wind angle, were also considered, as well as aerodynamic force coefficients for drag, lift, and moment.
- (a)
- Plate-like debris flying trajectories:
In this study, the governing parameters are defined as follows: m represents the debris mass; l is the reference length, taken along the wind direction (for example, the along-wind dimension of a plate or rod); A denotes the reference debris area, typically assumed as the maximum projected face area; and Iₘ is the mass moment of inertia of the debris. The displacement components are given by x (horizontal) and z (vertical), while θ indicates angular rotation. The velocity components include uₘ for horizontal velocity and vₘ for vertical velocity. Wind conditions are represented by U (wind speed) and ρₐ (air density). Aerodynamic effects are accounted for by the coefficients Cᴰ, Cᴸ, and Cᴹ, corresponding to drag, lift, and moment forces, respectively. The angle between the wind vector and the horizontal is denoted by β. Finally, g is the gravitational acceleration, and t is the time variable.
- (b)
- Compact debris flying trajectories:
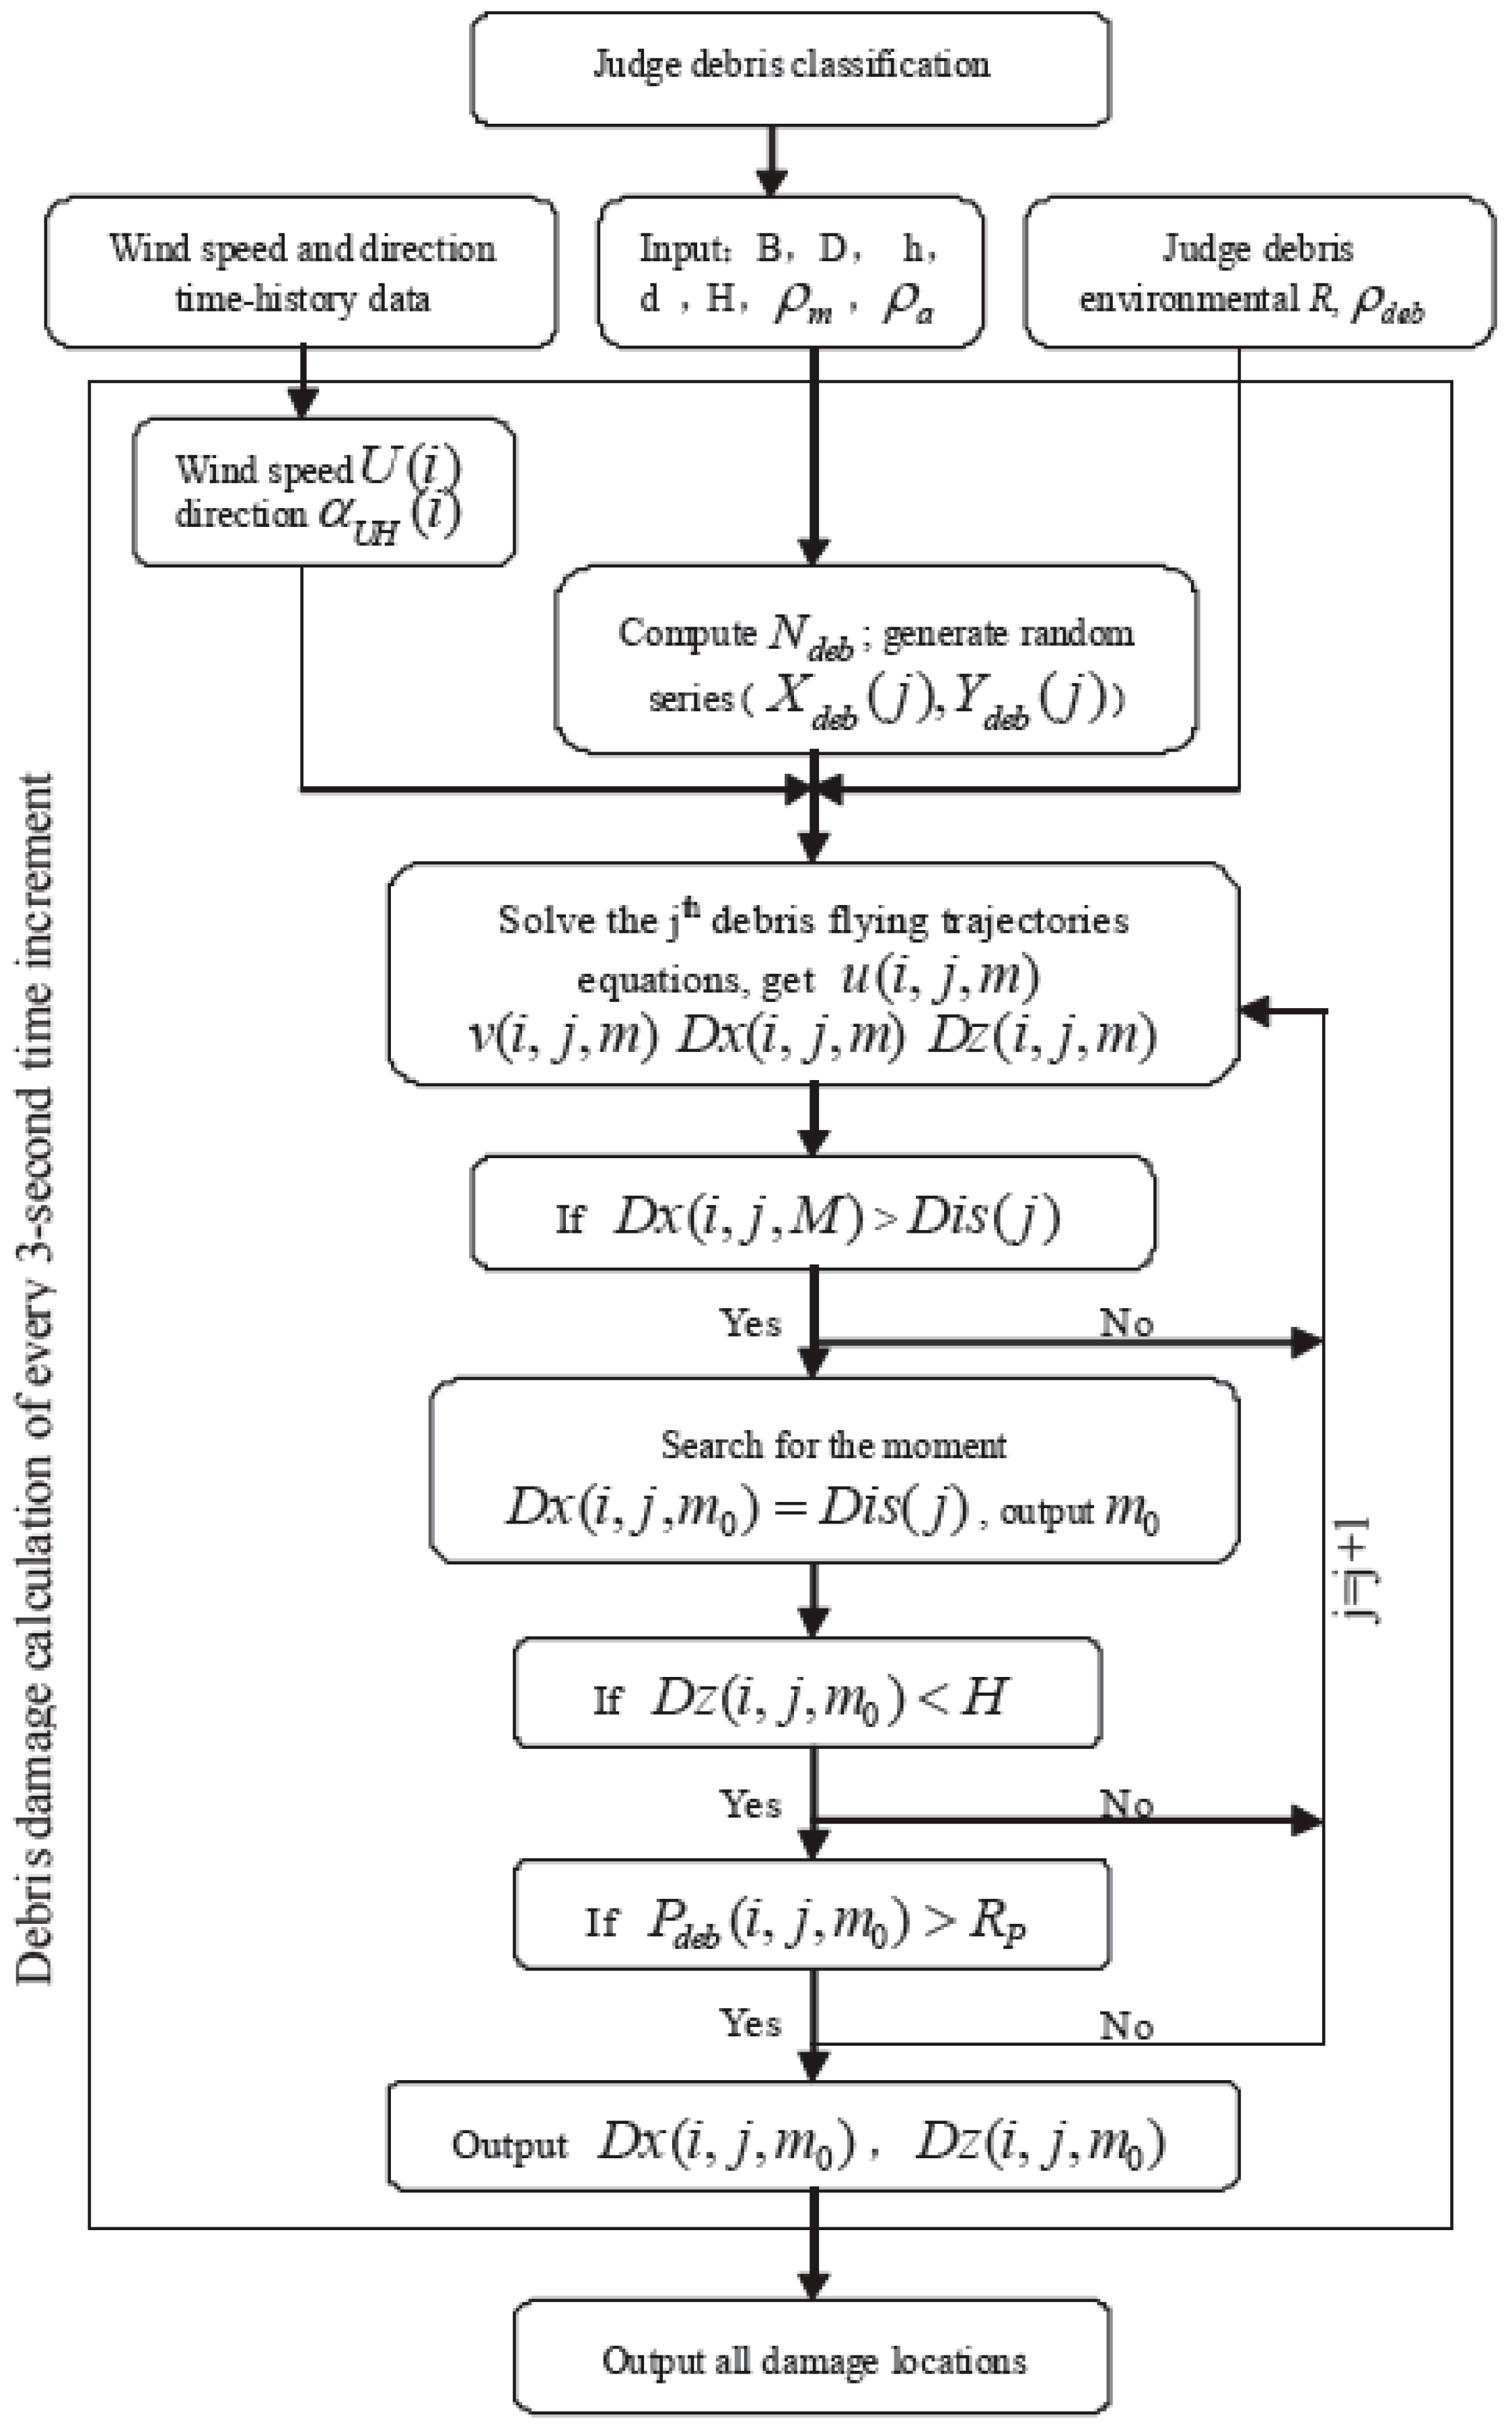
These formulations provide a framework for modeling debris generation and flight, enabling the assessment of impact risks to building envelopes during wind events (Song and Ou 2009) [4]. Below is the flowchart illustrating the numerical analysis conducted by the authors to assess windborne damage to buildings (Figure 15).
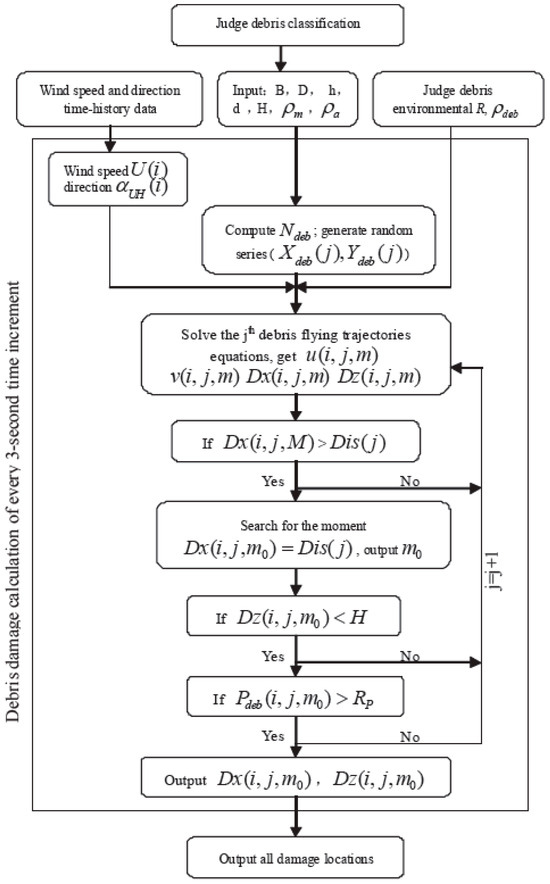
Figure 15.
The flowchart of windborne debris damage estimation of structural envelopes.
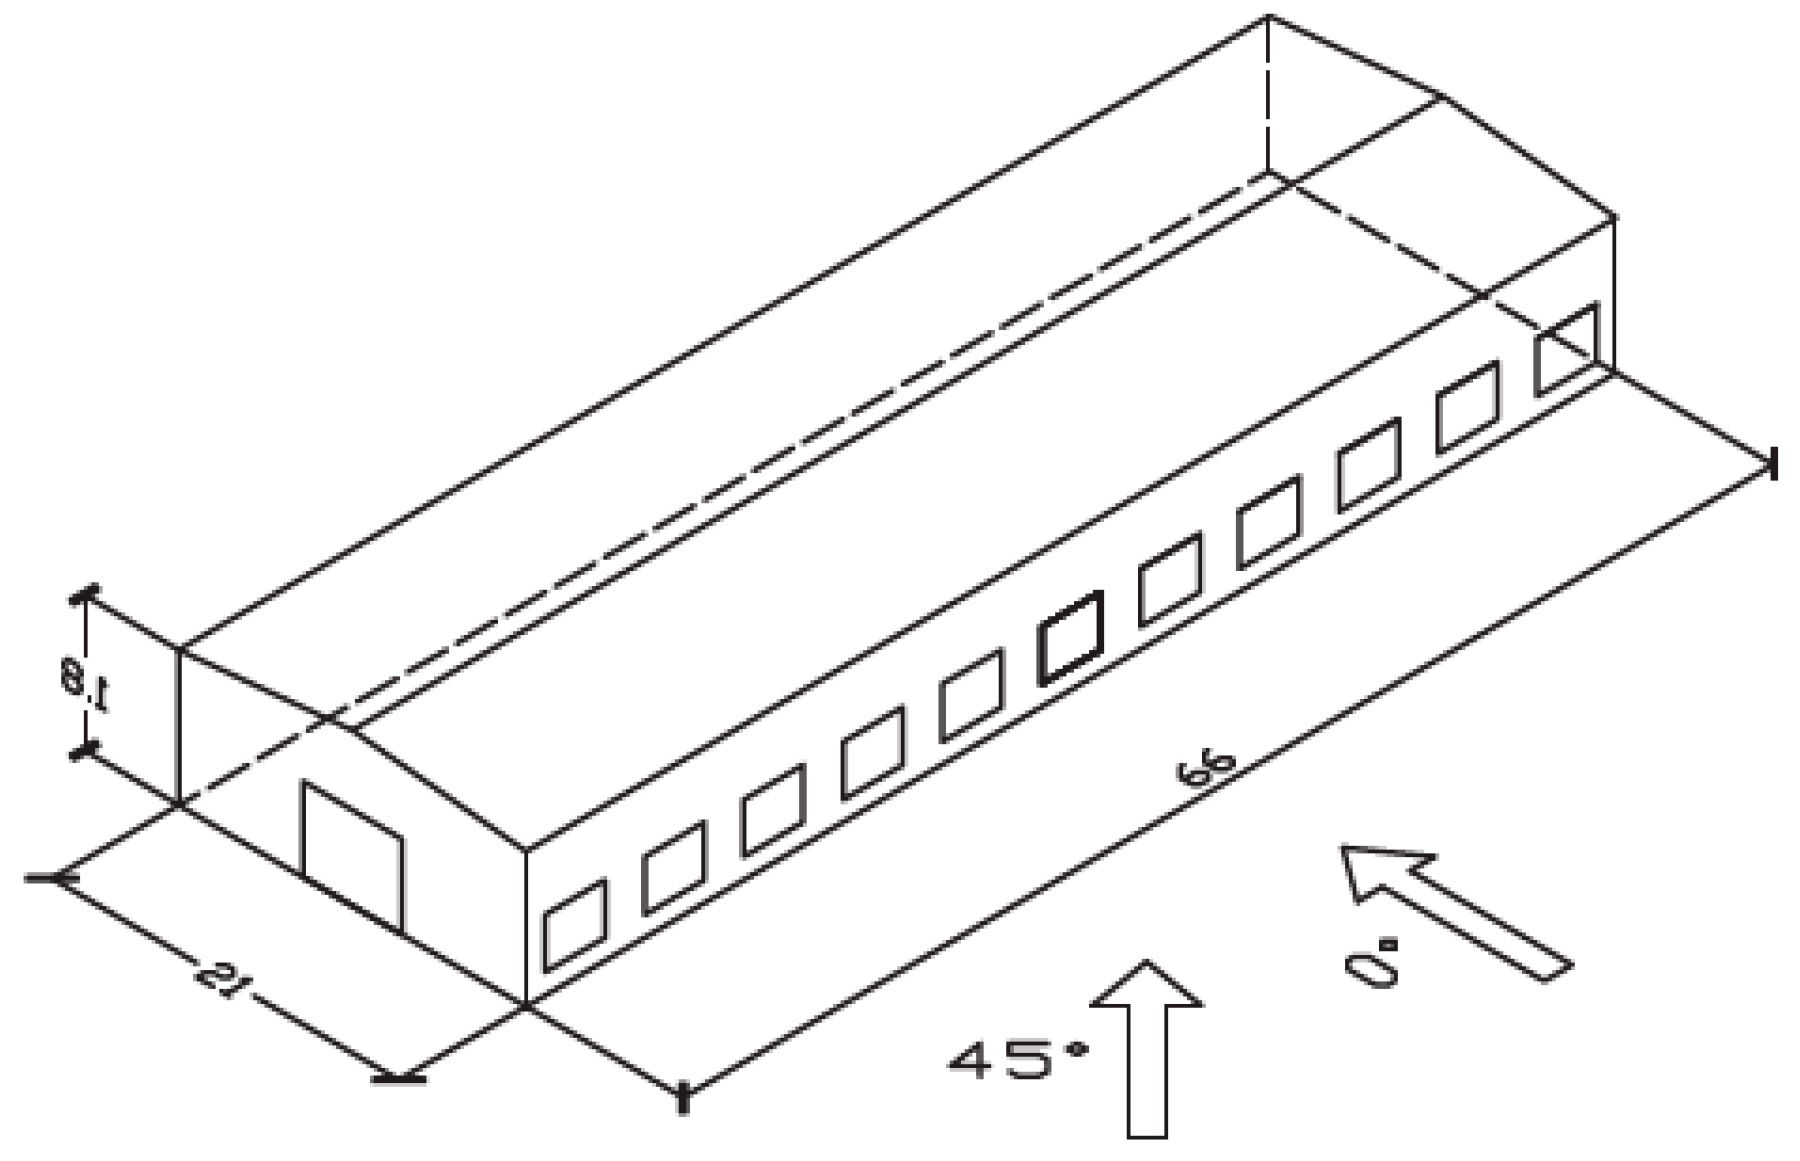
As an illustrative case, a lightweight steel structure with gabled frames was analyzed to demonstrate the process of estimating windborne debris damage (Figure 16). The building included 11 uniformly distributed windows on both the windward and leeward walls, each measuring 3.0 m × 3.6 m. The schematic drawing of the structural dimensions and wind direction is shown in Figure 16. The glazing consisted of 6 mm fully tempered monolithic glass with an estimated breakage threshold momentum of 0.1 kg·m/s (Behr et al. 1994) [17]. Gravel was selected as the representative debris, with a debris region radius of 30 m, a distribution density of 2, diameters ranging from 5 to 15 mm (uniformly distributed), and a material density of 2000 kg/m3.
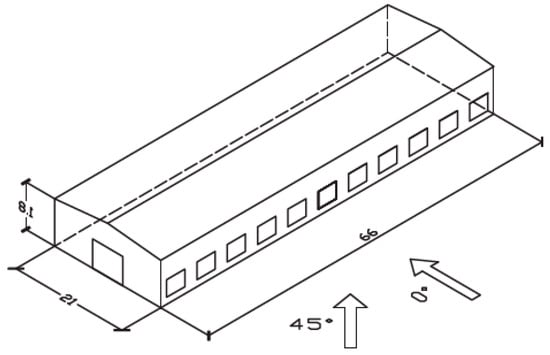
Figure 16.
Schematic drawing of structural dimension and wind direction.
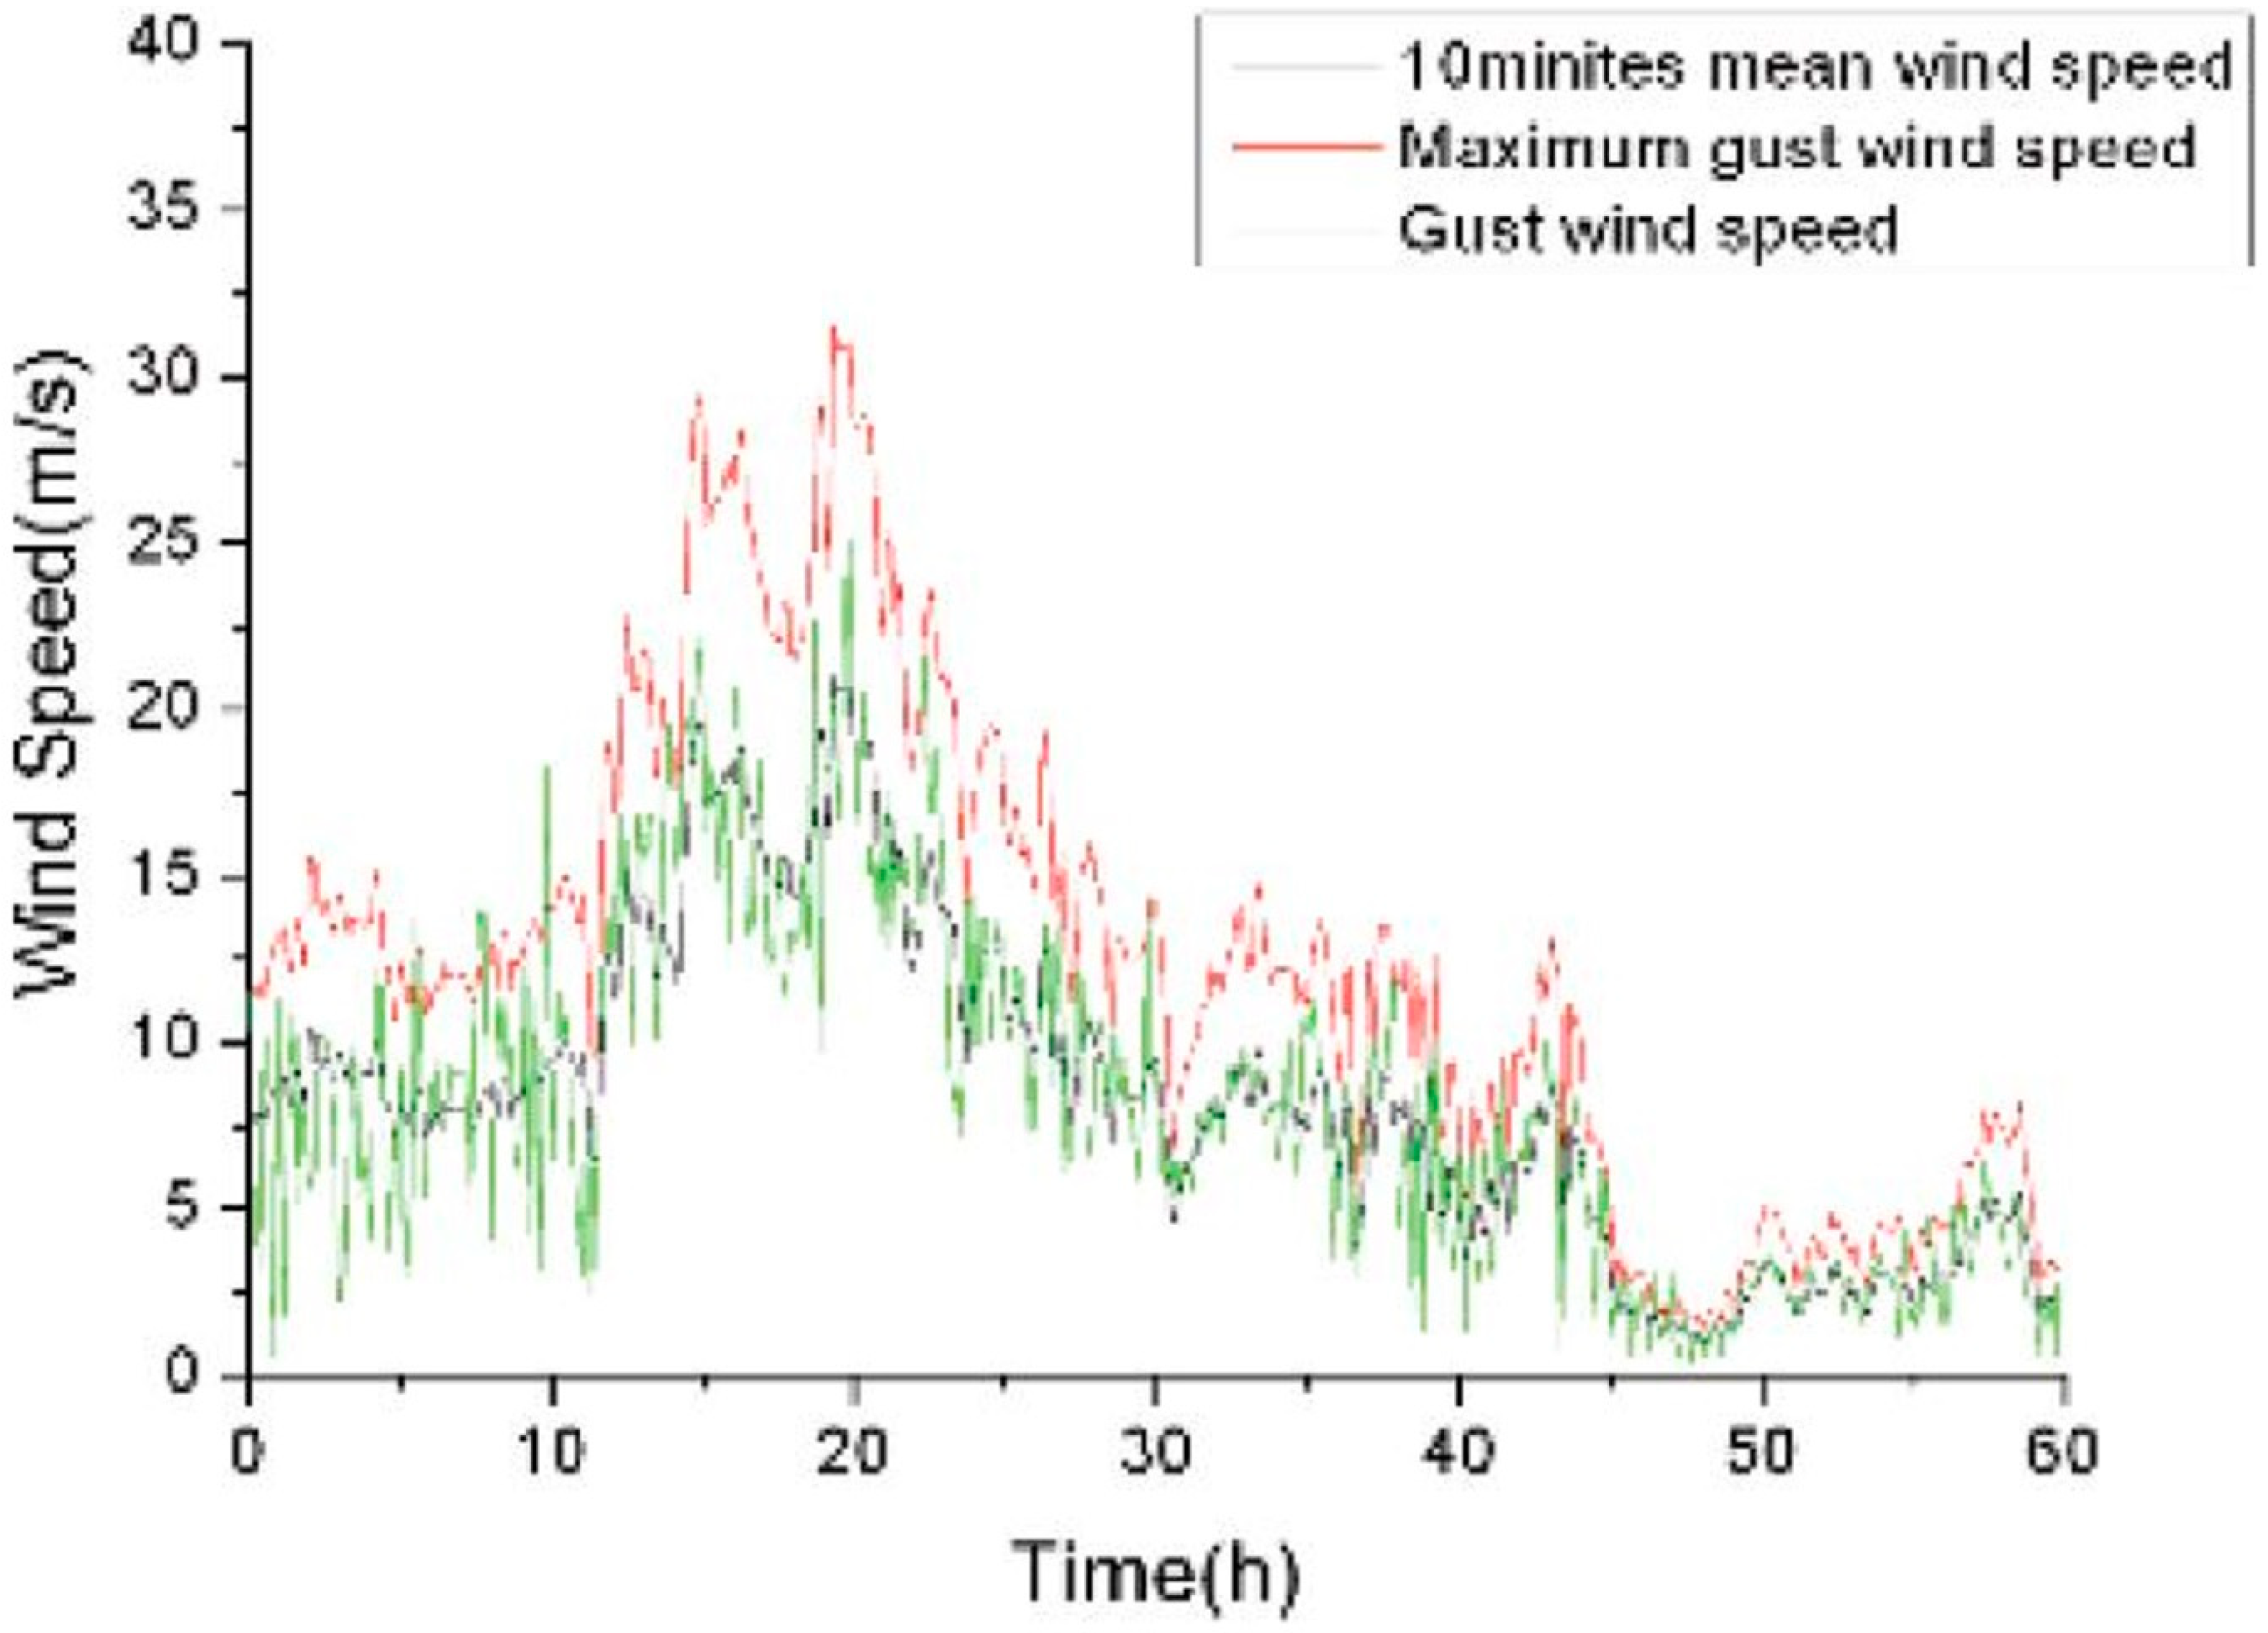
Wind data from Typhoon Chanchu were used as the loading input. The original data were processed and adjusted to the average roof height of 8.625 m (from the reference 325 m). With a time interval of 10 min, the gust speed envelope was obtained by multiplying the mean wind speed by the gust factor. The resulting wind speed–time-history curves are presented in Figure 17.
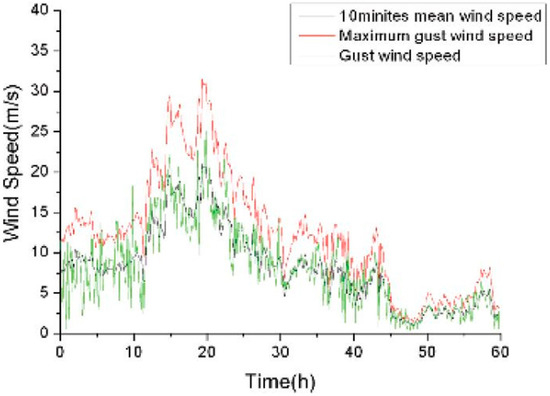
Figure 17.
Gust speed time-history of Typhoon Chanchu.
The numerical analysis showed that only 13.6% of windows were damaged during the 10 min storm period when gravel debris originated at 8 m above ground, while no damage occurred when debris was located at ground level. These results indicate a very low probability of all window openings being damaged during a severe windstorm. This finding supports the importance of considering the Partially Enclosed classification rather than assuming fully enclosed or fully open conditions.
3. Results
Based on the consistent damage patterns observed across the case studies, supported by an analytical fragility study of debris-exposed buildings and numerical simulations of debris-induced window failure, this study recommends a targeted revision to ASCE 7 for buildings susceptible to windborne debris. Specifically, we propose assigning a Partially Enclosed classification by default during design unless it can be demonstrated that openings will remain intact under extreme-wind debris impact. This enhancement may be adopted by homeowners and, more formally, by authorities having jurisdiction (AHJs) in regions with documented or anticipated windborne-debris risk.
This adjustment directly affects the selection of the internal pressure coefficient (GCpi) used in wind load calculations: Using ±0.55 for Partially Enclosed rather than ±0.18 for Enclosed yields higher, but more realistic, design pressures. This conservative assumption better captures worst-case internal pressurization following a debris breach and reduces the likelihood of catastrophic failure.
4. Discussion
While this study suggests incorporating windborne debris effects into wind load calculations for building design by considering the worst-case scenario for internal pressure, further experimental testing on full-scale building models in wind tunnels, along with extensive post-event surveys, is recommended to refine the debris coefficient to be incorporated into the wind load calculations. The adoption of the proposed design enhancement could be pursued by authorities having jurisdiction (AHJs) as a local amendment where debris risk warrants it. Because this enhancement may increase construction costs relative to current provisions, owners and AHJs should evaluate cost–benefit implications prior to implementation.
5. Conclusions
Windborne debris is a critical driver of structural damage during tornadoes and hurricanes. Although ASCE 7 accounts for several wind load factors, it does not explicitly capture the increase in internal pressure caused by debris-induced breaches of the building envelope, which can lead to underestimated design loads in real-world conditions.
Drawing on post-tornado field observations, analytical fragility evidence, numerical simulations, and wind pressure calculations, this study shows that buildings classified as Enclosed under ASCE 7 frequently behave as Partially Enclosed once debris breaches occur. This transition elevates internal pressures and, consequently, the likelihood and severity of damage.
We therefore recommend a practical enhancement to current practice: for buildings susceptible to windborne debris, assign a Partially Enclosed classification by default unless openings are demonstrably protected to remain intact under extreme winds. This change improves the realism of internal pressure estimates and enhances resilience without requiring new analysis methods, only revised, debris-aware classification criteria. Adoption by authorities having jurisdiction would constitute a low-barrier, high-impact update to design practice. By aligning enclosure classification with debris-induced breach realities, this work enables right-sized wind design that improves durability while reducing the materials, energy, emissions, and costs associated with storm repairs, advancing environmental, social, and economic sustainability.
Funding
This research received no external funding.
Institutional Review Board Statement
Not applicable.
Informed Consent Statement
Not applicable.
Data Availability Statement
The data presented in this study are available on request from the corresponding author due to legal restrictions.
Acknowledgments
The author acknowledges the support of Murray State University and Prime Design and Engineering, LLC, in facilitating this research project.
Conflicts of Interest
The author declares no conflicts of interest.
Abbreviations
The following abbreviations are used in this manuscript:
| ASCE | American Society of Civil Engineers |
| USNRC | US Nuclear Regulatory Commission |
References
- Noda, M.; Masai, K.; Ninomiya, M.; Nagao, F. Behavior of flying debris in tornado-like flow. In Proceedings of the 6th International Symposium on Computational Wind Engineering, Hamburg, Germany, 8–12 June 2014. [Google Scholar]
- ASCE7-22 Minimum Design Loads and Associated Criteria for Buildings and Other Structures (ASCE/SEI 7-22); American Society of Civil Engineers (ASCE): Reston, VA, USA, 2022.
- Tachikawa, M. Trajectories of flat plates in uniform flow with applications to wind generated missiles. J. Wind. Eng. Ind. Aerodyn. 1983, 14, 443–453. [Google Scholar] [CrossRef]
- Song, F.; Ou, J. Computational structural engineering. In Proceedings of the International Symposium on Computational Structural Engineering, Shanghai, China, 22–24 June 2009; pp. 497–503. [Google Scholar]
- Baker, J.W. Efficient analytical fragility function fitting using dynamic structural analysis. J. Struct. Eng. 2015, 139, 1796–1804. [Google Scholar] [CrossRef]
- Holmes, J.D.; Wehner, G.; Ginger, J.D. Investigation of plate-type windborne debris. Part I: Experiments in wind tunnel and full scale. J. Wind. Eng. Ind. Aerodyn. 2006, 94, 21–39. [Google Scholar] [CrossRef]
- Case, P.; Smith, D.A.; Friedline, D. Influence of low-rise building geometry on tornado-induced loads. In Proceedings of the ASCE Structures Congress, Pittsburgh, PA, USA, 2–4 May 2013. [Google Scholar]
- Ginger, J.D.; Henderson, D.J.; Holmes, J.D. Fluctuating internal pressures in buildings with a dominant opening. J. Wind. Eng. Ind. Aerodyn. 2008, 96, 1033–1052. [Google Scholar]
- Guha, T.K.; Richards, P.J.; Kopp, G.A. Internal pressure in a building with multiple dominant openings in a single wall: Comparison with the single opening situation. J. Wind. Eng. Ind. Aerodyn. 2011, 99, 1076–1088. [Google Scholar] [CrossRef]
- Ramsdell, J.V. Tornado Climatology of the Contiguous United States; Nuclear Regulatory Commission Report NUREG/CR-4461, Rev. 2; Pacific Northwest National Laboratory: Washington, DC, USA, 2007. [Google Scholar]
- Tamura, Y.; Matsui, M.; Kawana, S.; Kobayashi, F. Statistical properties of tornadoes in Japan and tornado risk model for nuclear power plants. In Proceedings of the 14th International Conference on Wind Engineering, Porto Alegre, Brazil, 21–26 June 2015. [Google Scholar]
- van de Lindt, J.W.; Masoomi, H.; Attary, N.; Standohar-Alfano, C.D. Tornado Damage Modeling: Single buildings, communities, and regions. In Routledge Handbook of Sustainable and Resilient Infrastructure, 1st ed.; Routledge: Abingdon-on-Thames, UK, 2018. [Google Scholar]
- Baker, C.J.; Sterling, M. A conceptual model for wind and debris impact loading of structures due to tornadoes. J. Wind. Eng. Ind. Aerodyn. 2018, 175, 283–291. [Google Scholar] [CrossRef]
- International Code Council. 2018 International Residential Code for One- and Two-Family Dwellings; International Code Council: Country Club Hills, IL, USA, 2017. [Google Scholar]
- ANSI/AWC NDS-2018: National Design Specification for Wood Construction; American Wood Council: Gaithersburg, MD, USA, 2018.
- Abdelhady, A.E.; Spence, S.M.J.; McCormick, J.A. Risk and fragility assessment of residential wooden buildings subject to hurricane winds. Eng. Struct. 2018, 167, 354–366. [Google Scholar]
- Behr, R.A.; Minor, J.E. A survey of glazing system behavior in multi-story buildings during Hurricane Andrew. Struct. Des. Tall Build. 1994, 3, 143–161. [Google Scholar] [CrossRef]
Disclaimer/Publisher’s Note: The statements, opinions and data contained in all publications are solely those of the individual author(s) and contributor(s) and not of MDPI and/or the editor(s). MDPI and/or the editor(s) disclaim responsibility for any injury to people or property resulting from any ideas, methods, instructions or products referred to in the content. |
© 2025 by the author. Licensee MDPI, Basel, Switzerland. This article is an open access article distributed under the terms and conditions of the Creative Commons Attribution (CC BY) license (https://creativecommons.org/licenses/by/4.0/).

