Article

Vibrations from Wind Turbines Increased Self-Pollination of Native Forbs, and White Bases Attracted Pollinators: Evidence Along a 28 km Gradient in a Natural Area

1
Wyoming Natural Diversity Database, University of Wyoming, Laramie, WY 82071, USA
2
Department of Zoology and Physiology, University of Wyoming, Laramie, WY 82071, USA
3
Program in Ecology and Evolution, University of Wyoming, Laramie, WY 82071, USA
*
Author to whom correspondence should be addressed.
Submission received: 1 May 2025 / Revised: 31 May 2025 / Accepted: 9 June 2025 / Published: 19 June 2025

Abstract

:
Knowledge of how wind turbines interact with vertebrate animals is growing rapidly; however, less is known about plants and insects. Turbines produce infrasound (≤20 Hz), and these vibrations decrease with distance from turbines. We measured seed set and pollinators at six sites 0 to 28 km from turbines. We measured the number and mass of seeds produced by self-pollination, insect pollination, and when pollen was not limiting for nine native plants. We assessed pollinators by target netting bees and butterflies during transects, and by using blue vane traps (bees only). Most plants produced fewer or lighter developed seeds through self-pollination. Seed set did not vary between the open- and hand-pollinated treatments, indicating that the pollen was not limiting. The number and mass of seeds in the self-pollination treatment decreased with distance from the turbines. Bees and butterflies were more abundant near the wind facility, based on transects. The vane traps collected the fewest insects within the wind facility, likely due to bees being attracted to the turbine bases. The pollinator assemblage at the wind facility was distinct compared to other sites. Infrasound produced by the turbines appeared to enhance self-pollination, and the turbine bases attracted pollinators. We provide data on a seldom studied yet critical topic to inform land management and agricultural decisions, and to promote new strategies as wind energy development grows.

1. Introduction

Bats, raptors and songbirds respond to wind energy facilities in various ways, including avoiding turbines, being attracted to them, colliding with turbine blades, and reacting to habitat fragmentation caused by power infrastructure [1]. However, few studies have directly investigated interactions among plants, insects and wind energy [2,3]. A study documented that dust and pollution can impair plants at wind facilities [3]. Additionally, insects collide with turbine blades, reducing the power produced by up to 50% at wind speeds > 12 m/s [4], so strategies to minimize collisions should improve energy production. Insects may gather at wind turbines because they are attracted to the heat produced by the rotating blades and the lighting, location (e.g., hilltops), shape and color of turbines; however, only the color hypothesis has been tested [5]. Insects were found to be attracted to the white color of turbine bases and their vertical structure [6,7]. Additionally, insectivorous vertebrates may be attracted to wind farms due to the increased presence of insects [8,9]. We collected data to assess the degree to which wind turbines attract insects, which has been hypothesized in the literature but never tested [5,10,11,12].
The attraction of insects to wind facilities may have cascading consequences that affect other trophic levels. Insects are declining globally, with an estimated loss of 40% of species [13], and conservation is needed to protect the ecosystem services they provide [14,15,16]. The number and biomass of insects striking turbines is largely unknown, but estimated to be large [17]. Pollinators are of special concern because this group is predicted to have some of the largest declines [14], and they are instrumental in plant reproduction [18,19]. Pollinators may be especially attracted to wind facilities because these insects are sensitive to color and shape [5]. Pollinators are also prey for a variety of animals, including passerine birds [20,21]. Passerines are the birds most commonly struck at wind facilities [22], so decreasing insect abundance around turbines may decrease the fatalities of some birds.
Most vertebrate-focused studies have investigated the direct impacts of turbine blades and infrastructure; however, almost nothing is known about the effects of infrasound. We became interested in the potential effects of vibrations when we discovered high rates of self-pollination in Plains Pricklypear (Opuntia polycantha) within a wind facility [23]. We researched what may cause more selfing, including audible sound, changes in wind speeds and precipitation (wake effects), changes in pollinators near wind facilities, and infrasound. Audible sounds are not known to alter self-pollination. Changes in wind speed and precipitation occur downwind of turbines, and we observed the strongest effects within the wind facility. Pollinators may be attracted to turbines [6], but we do not expect higher bee abundance to increase selfing. Low-frequency vibrations from turbines may induce self-pollination by enhancing pollen transfer within flowers or through other unknown mechanisms. Turbines emit infrasound, noise below 20 Hz, which are inaudible to humans [24,25]. Infrasound produced by wind turbines can be detected up to 90 km from turbines during calm atmospheric conditions and up to 20 km away during windy conditions [26]. European Badgers (Meles meles) living in wind farms had higher stress hormones compared to badgers living >10 km from such areas, which was assumed to be due to persistent infrasound [27]. Additionally, fewer earthworms were measured closer to turbines, which was also surmised to be a result of infrasound [28]. Plants may be sensitive to wind farm noise because they rely on external stimuli (e.g., pollinators, wind, vibrations, and sound frequencies) to release and distribute pollen, and they likely interact with infrasound [29]. Infrasound may disrupt plant–pollinator interactions by masking insect communication (via overlapping frequencies), or disturbing nesting or developing insects in the ground [30], but this has not been investigated. We investigated the extent to which infrasound altered seed set in native plants between 0 and 28.5 km from the nearest turbine to assess how wind energy may affect plants.
As sessile organisms, forbs rely on external stimuli, such as soundwaves, to trigger the release of pollen and nectar rewards. Wind facilities produce a variety of frequencies that range from low to high [24,25,26]. Amplitude and frequency describe the characteristics of soundwaves. Amplitude characterizes the height and intensity of soundwaves, while frequency describes the pitch and wavelength. In fact, frequency is how infrasound is defined (<20 Hz). Plant structures can transmit some frequencies while attenuating others [31], and higher frequencies tend to attenuate more quickly. Higher amplitudes cause more energetic vibrations that may release pollen [32]. The petals of some plants physically vibrate when exposed to the frequences made by pollinators (1 kHz) [33]. Sound from wind turbines could vibrate petals if some of the frequencies are similar to insects, but we are not aware of any studies that have addressed this. The degree to which infrasound effects plants is unknown, but could cause anthers to release pollen, resulting in self-pollination, particularly in plants with thigmonastic stamens (which move inward with stimuli). The interaction between sounds produced by wind facilities and plants is an understudied area that has the potential to highly influence crops and native plants in natural areas.
Beyond sound and vibration, turbines change the abiotic environment, which may alter plants and insects. Wind velocity is slower and turbulence is higher behind turbines, which may result in altered snow storage and soil temperatures for overwintering insects [5]. The combination of the vibrations and warmer temperatures, which increase the amount of fat stores burned during hibernation for some species, may result in poorer body conditions when insects emerge in the spring [31]. Additionally, turbines induce changes in wind currents and climate ≤20 km downwind [34], which has unknown effects on plants and insects [5]. A more complete understanding of the relationships among plants, insects, and wind development will help conserve species, reduce vertebrate wildlife mortality, and increase the power produced by wind facilities.
Our objective was to collect baseline information on seed set and pollinators at four locations proposed for wind energy development and compare that data to an operating wind facility and a reference location not proposed for development. We sampled 0 to 28 km from operating turbines to represent a gradient in infrasound. Measuring infrasound is expensive and requires specialized equipment that we do not possess; therefore, we assumed a decrease in infrasound based on the literature [24,25,26,27]. We performed seed-set experiments to calculate the percentage of mature seeds produced by native plants, and we collected butterflies and bees to measure differences in their assemblages along the gradient. We estimated the degree to which native plant species would self-pollinate at the wind facility compared to farther from the turbines. We deployed vane traps and walked transects to measure the abundance and assemblage of pollinators at these sites. Our specific questions were as follows: (1) Does the degree of self-pollination differ with distance to turbines? (2) Does the proportion of developed seeds vary with distance to turbines? (3) To what degree does the abundance and assemblage of pollinators along the gradient differ? Understanding how flowering plants and pollinators respond to the structure and vibrations of wind turbines will foster new ideas on refining wind turbines to minimize effects.

2. Materials and Methods

2.1. Study Area

We assessed the seed set of 9 native plants (Figure 1 and Table 1) and the pollinator assemblage 0 to 28 km from wind turbines in mixed-grass prairie and sagebrush steppe ecosystems in southeastern Wyoming, USA (Figure 2). We collected samples at an operating wind energy facility with 74 turbines and a power generation capacity of 111 MW. The turbines at this facility had a hub height of 80 m, a rotor diameter of 91 m, and a total height of 125.6 m [35]. Four sites proposed for wind turbine development were 4 km (south of turbines), 7 km (east of turbines), 11 km (east of turbines), and 13 km (north of turbines) from the nearest turbines. Finally, the reference site (not proposed for development) was 28.5 km from the nearest operating turbine. We assessed seed set and pollinators at the reference site where infrasound was minimal and the turbines were not visible. The annual mean high temperature for the area was 13 °C, and the mean low temperature was −3 °C [36]. An average of 28 cm of precipitation falls annually. The wind blows predominantly from the west, with average wind speeds of 8–10 m/s [37]. The conditions during mid-summer in 2022 were severe drought, and 2023 was abnormally dry [38]. In addition to our study species, we observed pollinator activity on the plant genera Cirsium, Erysimum, Mertensia, Pediocactus, Sphaeralcea, Opuntia, Senecio, Crepis, Antenarria, Phlox, and Thermopsis at our sites.

2.2. Measuring Seed Set of Flowering Plants

We assessed seed set at varying distances from the wind turbines. We measured the distance between the nearest turbine and our sites to calculate the distance from the turbines using QGIS. We measured seed set on nine plant species at six sites during summer 2022. Seed set was assessed for five plant species present at one site, and four plant species present at two sites (Figure 2; Table 1). We selected 20 individual plants of the same species at each site to measure the number and mass of seeds produced in three treatments. One of each treatment (bagged, open-, and hand-pollinated) was performed on each plant or plant cluster. Tea bags (<1 mm mesh) were secured over flower buds prior to blooming (Figure 1i), prohibiting pollinators from visiting flowers to allow for measurement of self-pollination. Flowers in the open treatment were unmanipulated and represented natural pollination from insect visitation; seed set in this treatment resulted from pollinator visitation and self-pollination. Hand-pollinated flowers received excess pollen, providing an estimate of seed set when pollen was not a limiting factor. Donor pollen was collected ≥50 m away from the recipient plant to minimize genetic relatedness. Pollen was transferred by holding the anthers in forceps and gently brushing the stamen. Once fruit development began, we placed a bag over the open- and hand-pollinated treatments to treat flowers similarly and minimize seed loss. We monitored the treatments weekly from mid-May to August. We harvested ripe fruits and dried them at room temperature in paper bags for at least a week before extracting the seeds. We counted and weighed all seeds from one fruit capsule to 0.01 mg. We counted the number of seeds per flowerhead and measured the mass of seeds for each treatment. We divided the seeds into those that were developed and those that were undeveloped based on visual inspection of their size and condition. Developed seeds are generally larger and rounder based on tetrazolium assays [39,40]. We divided the number of developed seeds by the total number of seeds (developed and undeveloped) to calculate the proportion of developed seeds. We divided the total mass by the number of seeds to calculate the average seed mass per fruit. We estimated the proportion of maximum seed mass by dividing the mean seed mass in each treatment by the maximum seed mass measured for a plant species.
We estimated differences among the treatments and sites using generalized linear models (glm) and mixed-effects models (glmer) to measure the degree to which the plants were pollen-limited. The models did not converge when all plants were in one model, so we analyzed the data by species. We analyzed the proportion of developed seeds and the proportion of maximum seed mass using a gamma distribution after inspecting histograms in R [version 2.3.2]. We transformed the proportional data by adding one to each value. We used mixed-effects models where the fixed effects were the treatment (bagged, open or hand-pollinated) and site (for only 3 plants that were measured at 2 sites), and the random effect was the plant number. Each plant received one of each treatment and we identified individuals by plant number. Some mixed-effects models did not converge, so we removed the plant number from the random effects and included the parameter as a fixed effect in a glm. Finally, we estimated the differences in the proportion of developed seeds and the proportion of maximum seed mass as a function of distance from the turbines using mixed-effects models, where the treatment and site were the fixed effects, and the plant number and plant species were the random effects. Differences among the treatments were calculated using emmeans (version 1.7.2) [41].

2.3. Abundance and Assemblage of Pollinators

We assessed the abundance and assemblage of pollinators at varying distances from the wind turbines. We placed three blue vane traps (hereafter vane traps) at each site biweekly to collect bees between mid-May and July in 2022 and 2023. The vane traps were deployed dry for 10 to 48 h at about ~0.5 m above the ground. We stored the insects from the traps in Whirl-Pak bags. Additionally, we walked transects and target-netted bees and butterflies using nets with a 38 cm diameter and a 1 m handle. Different people walked transects for each insect group to focus their search. The air temperature and wind speed were measured at the beginning and end of the transects, and the vane traps were deployed and retrieved using a shaded Kestrel weather meter. The transects were timed for both butterflies and bees. The bees were transferred to a pop-cap vial, and the butterflies were placed in glassine envelopes. All samples were stored in a cooler and frozen upon returning to the laboratory. The bees were pinned and identified under a dissecting microscope using Michener et al. [42], and bumble bee species were identified according to Williams et al. [43]. The butterflies were pinned, and their wings spread before identifying them using the method of Brock and Kaufman [44]. We categorized the bees by tongue length based on family [45]. We categorized the flowers observed at the sites by ease of access to compare the nectar sources among the sites. Hidden nectar is limited to bees with long tongues or nectar thieves (difficult), partially limited nectary access is limited to pollinators with medium and long tongues, and easily accessed nectar can be used by any bee, because the nectaries are relatively exposed.
We analyzed how bee abundance in the vane traps (insects/h), bee abundance along the transects (bees/h), and butterfly abundance along the transects (butterflies/h) varied among the sites and conditions. We measured the degree to which butterfly and bee abundance varied from 0 km (within the wind facility) to 13 km (farthest site affected by infrasound) to calculate the degree to which their abundance changed with distance from the turbines using glm. We excluded the reference site at 28 km because abundance was usually higher there. The predictor variables in our models were distance to turbines, bloom density, bloom richness, mean air temperatures during surveys, mean wind speed during surveys, and survey time. We also analyzed abundance when the sites were divided into the categories of wind facility, sites 4 to 13 km from turbines (those influenced by infrasound), and the reference site 28 km from turbines. We used glm with the same predictors as the model above. Both models used a Poisson distribution after examining histograms of the data. The data were summarized and analyzed in Program R [46].
We used non-metric multidimensional scaling (NMDS) in the vegan package [47] (https://cran.r-project.org/web/packages/vegan/vegan.pdf, accessed on 8 June 2025) to assess the overlap in butterfly and bee assemblages among habitats. We removed taxa only collected at one site or whose abundance was <0.1% of the total. Stress values below 0.1 are considered a fair fit, while values ~0.2 are thought to result in a weak relationship. We used analysis of similarity (ANOSIM) and dissimilarity ranks to compare the sites. The dissimilarity ranks calculated the dissimilarity among the sites. Box width represents the number of samples, and box height represents the dissimilarity ranks. Comparing the dissimilarity calculated between sites to that within individual sites suggests the degree to which the assemblages differed. An R-value near 1 indicates a strong relationship, while a smaller value suggests a weak relationship.

3. Results

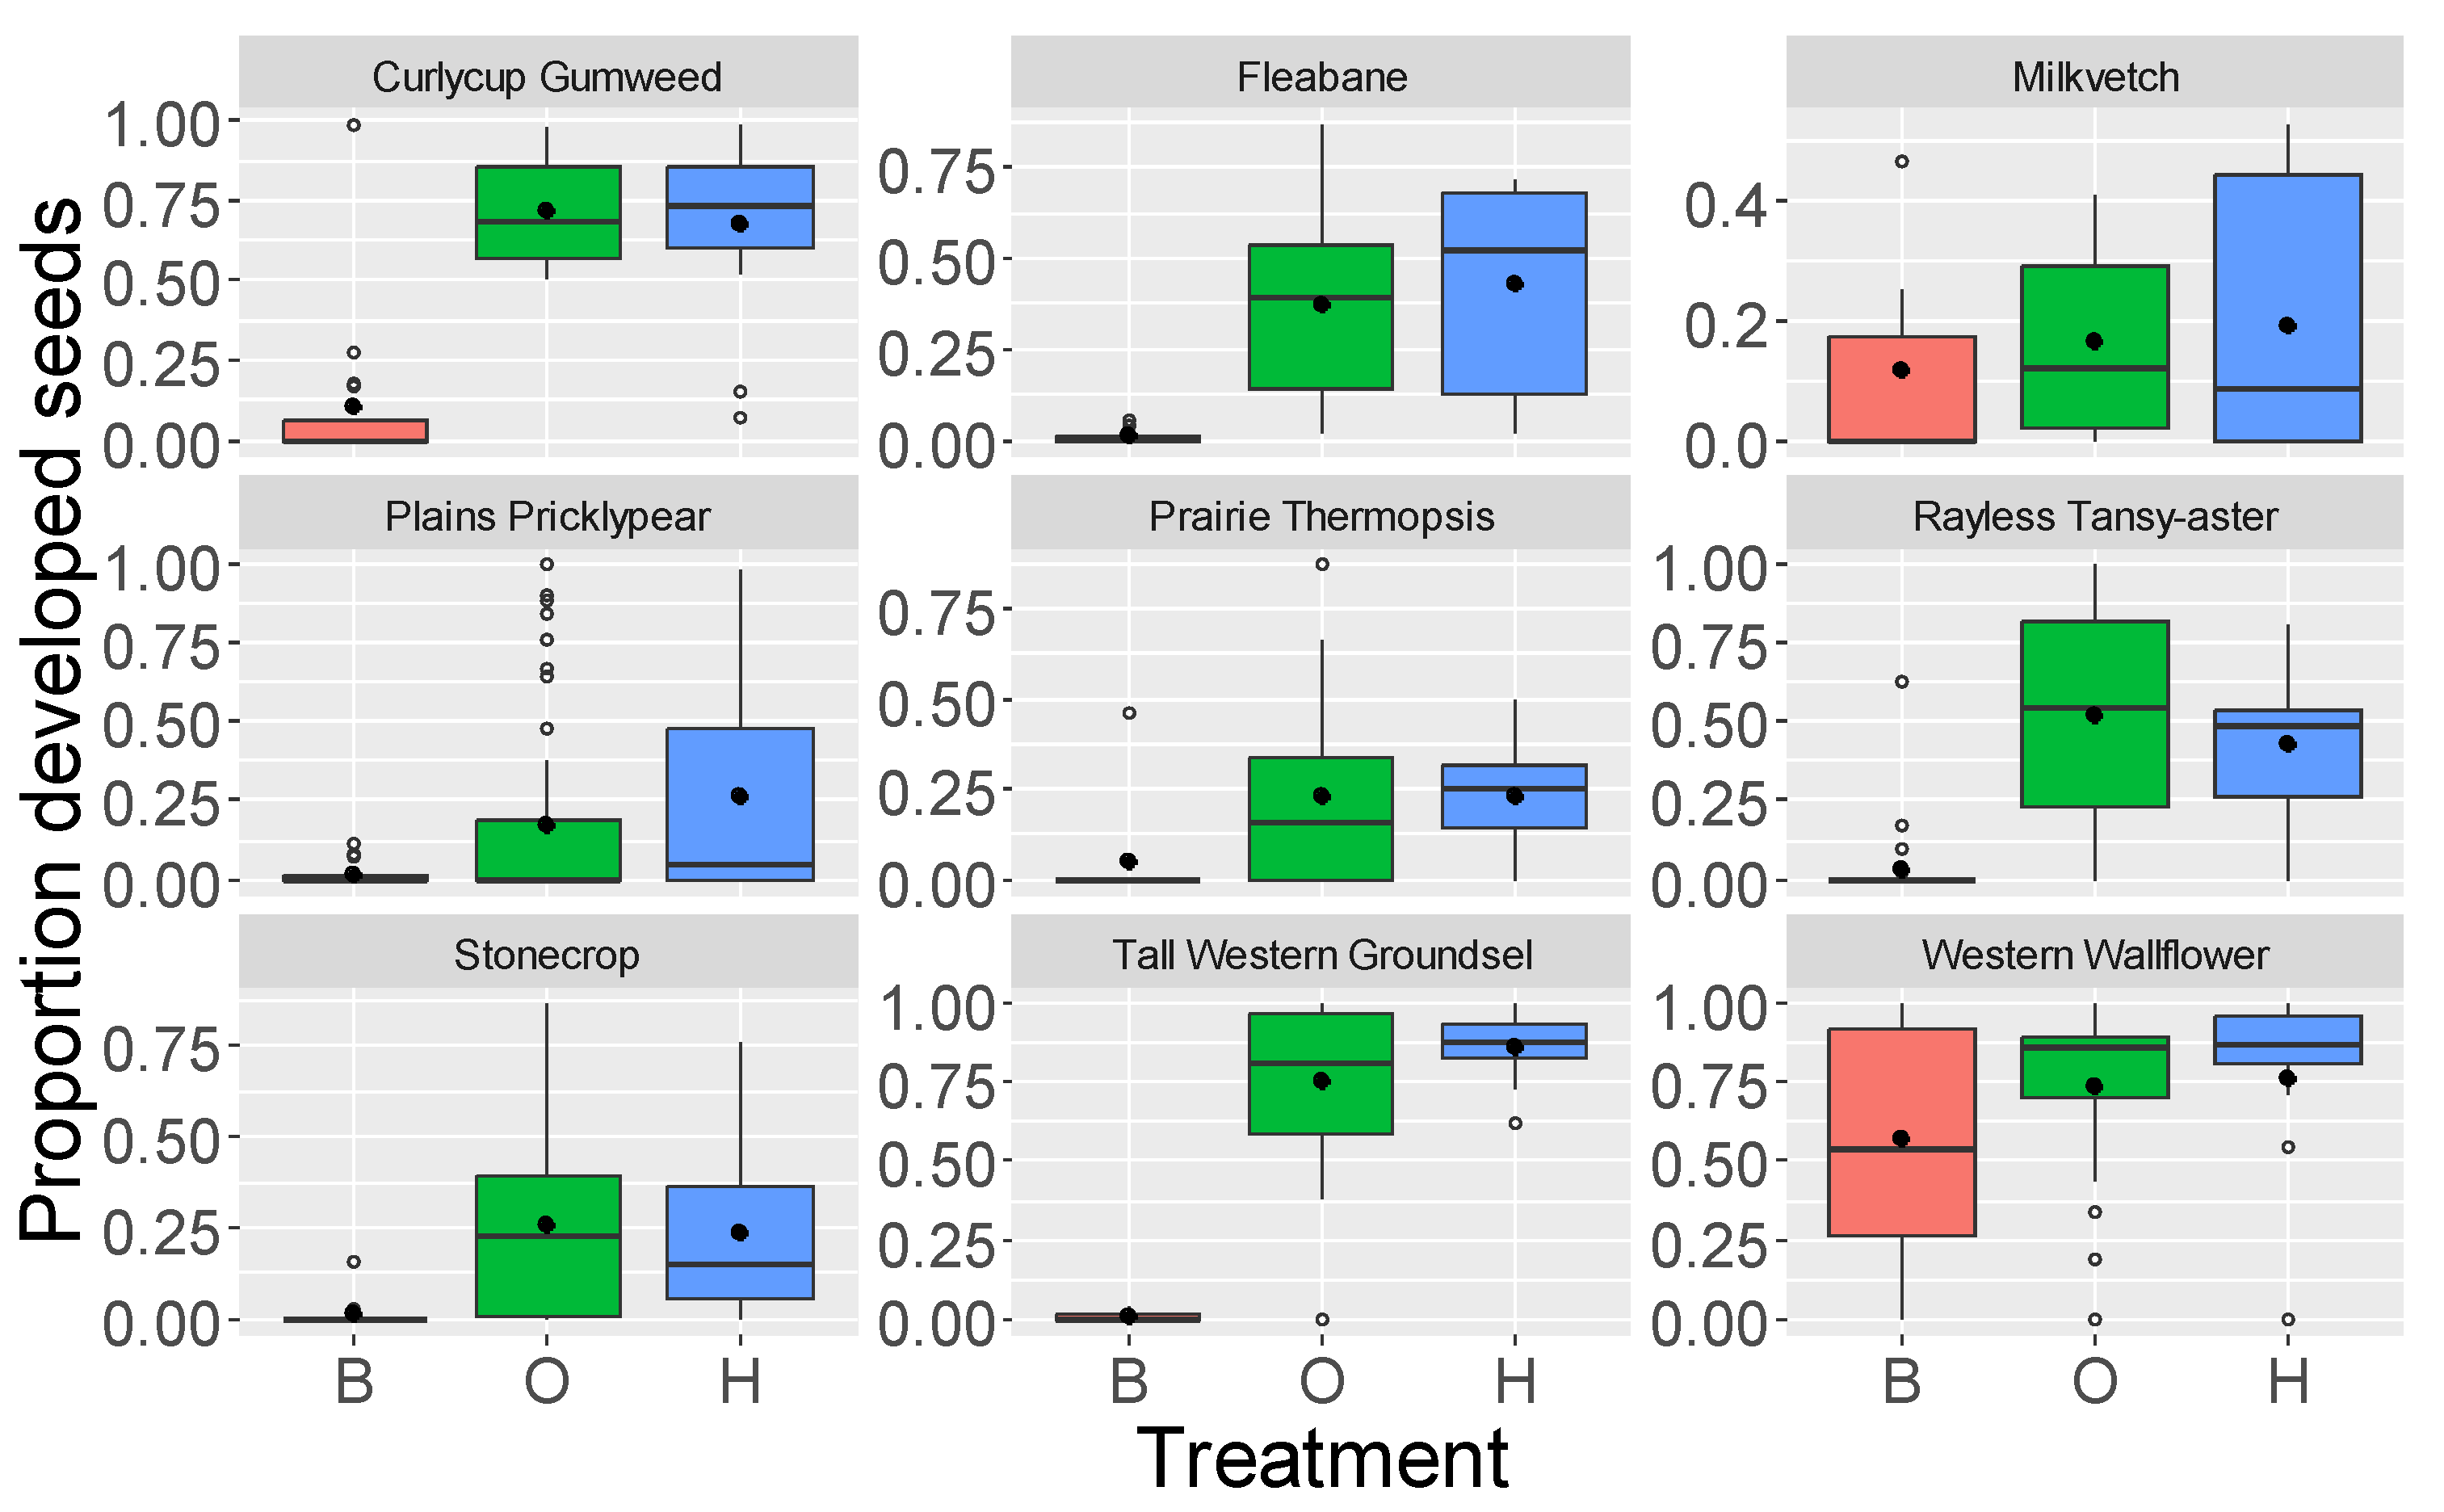
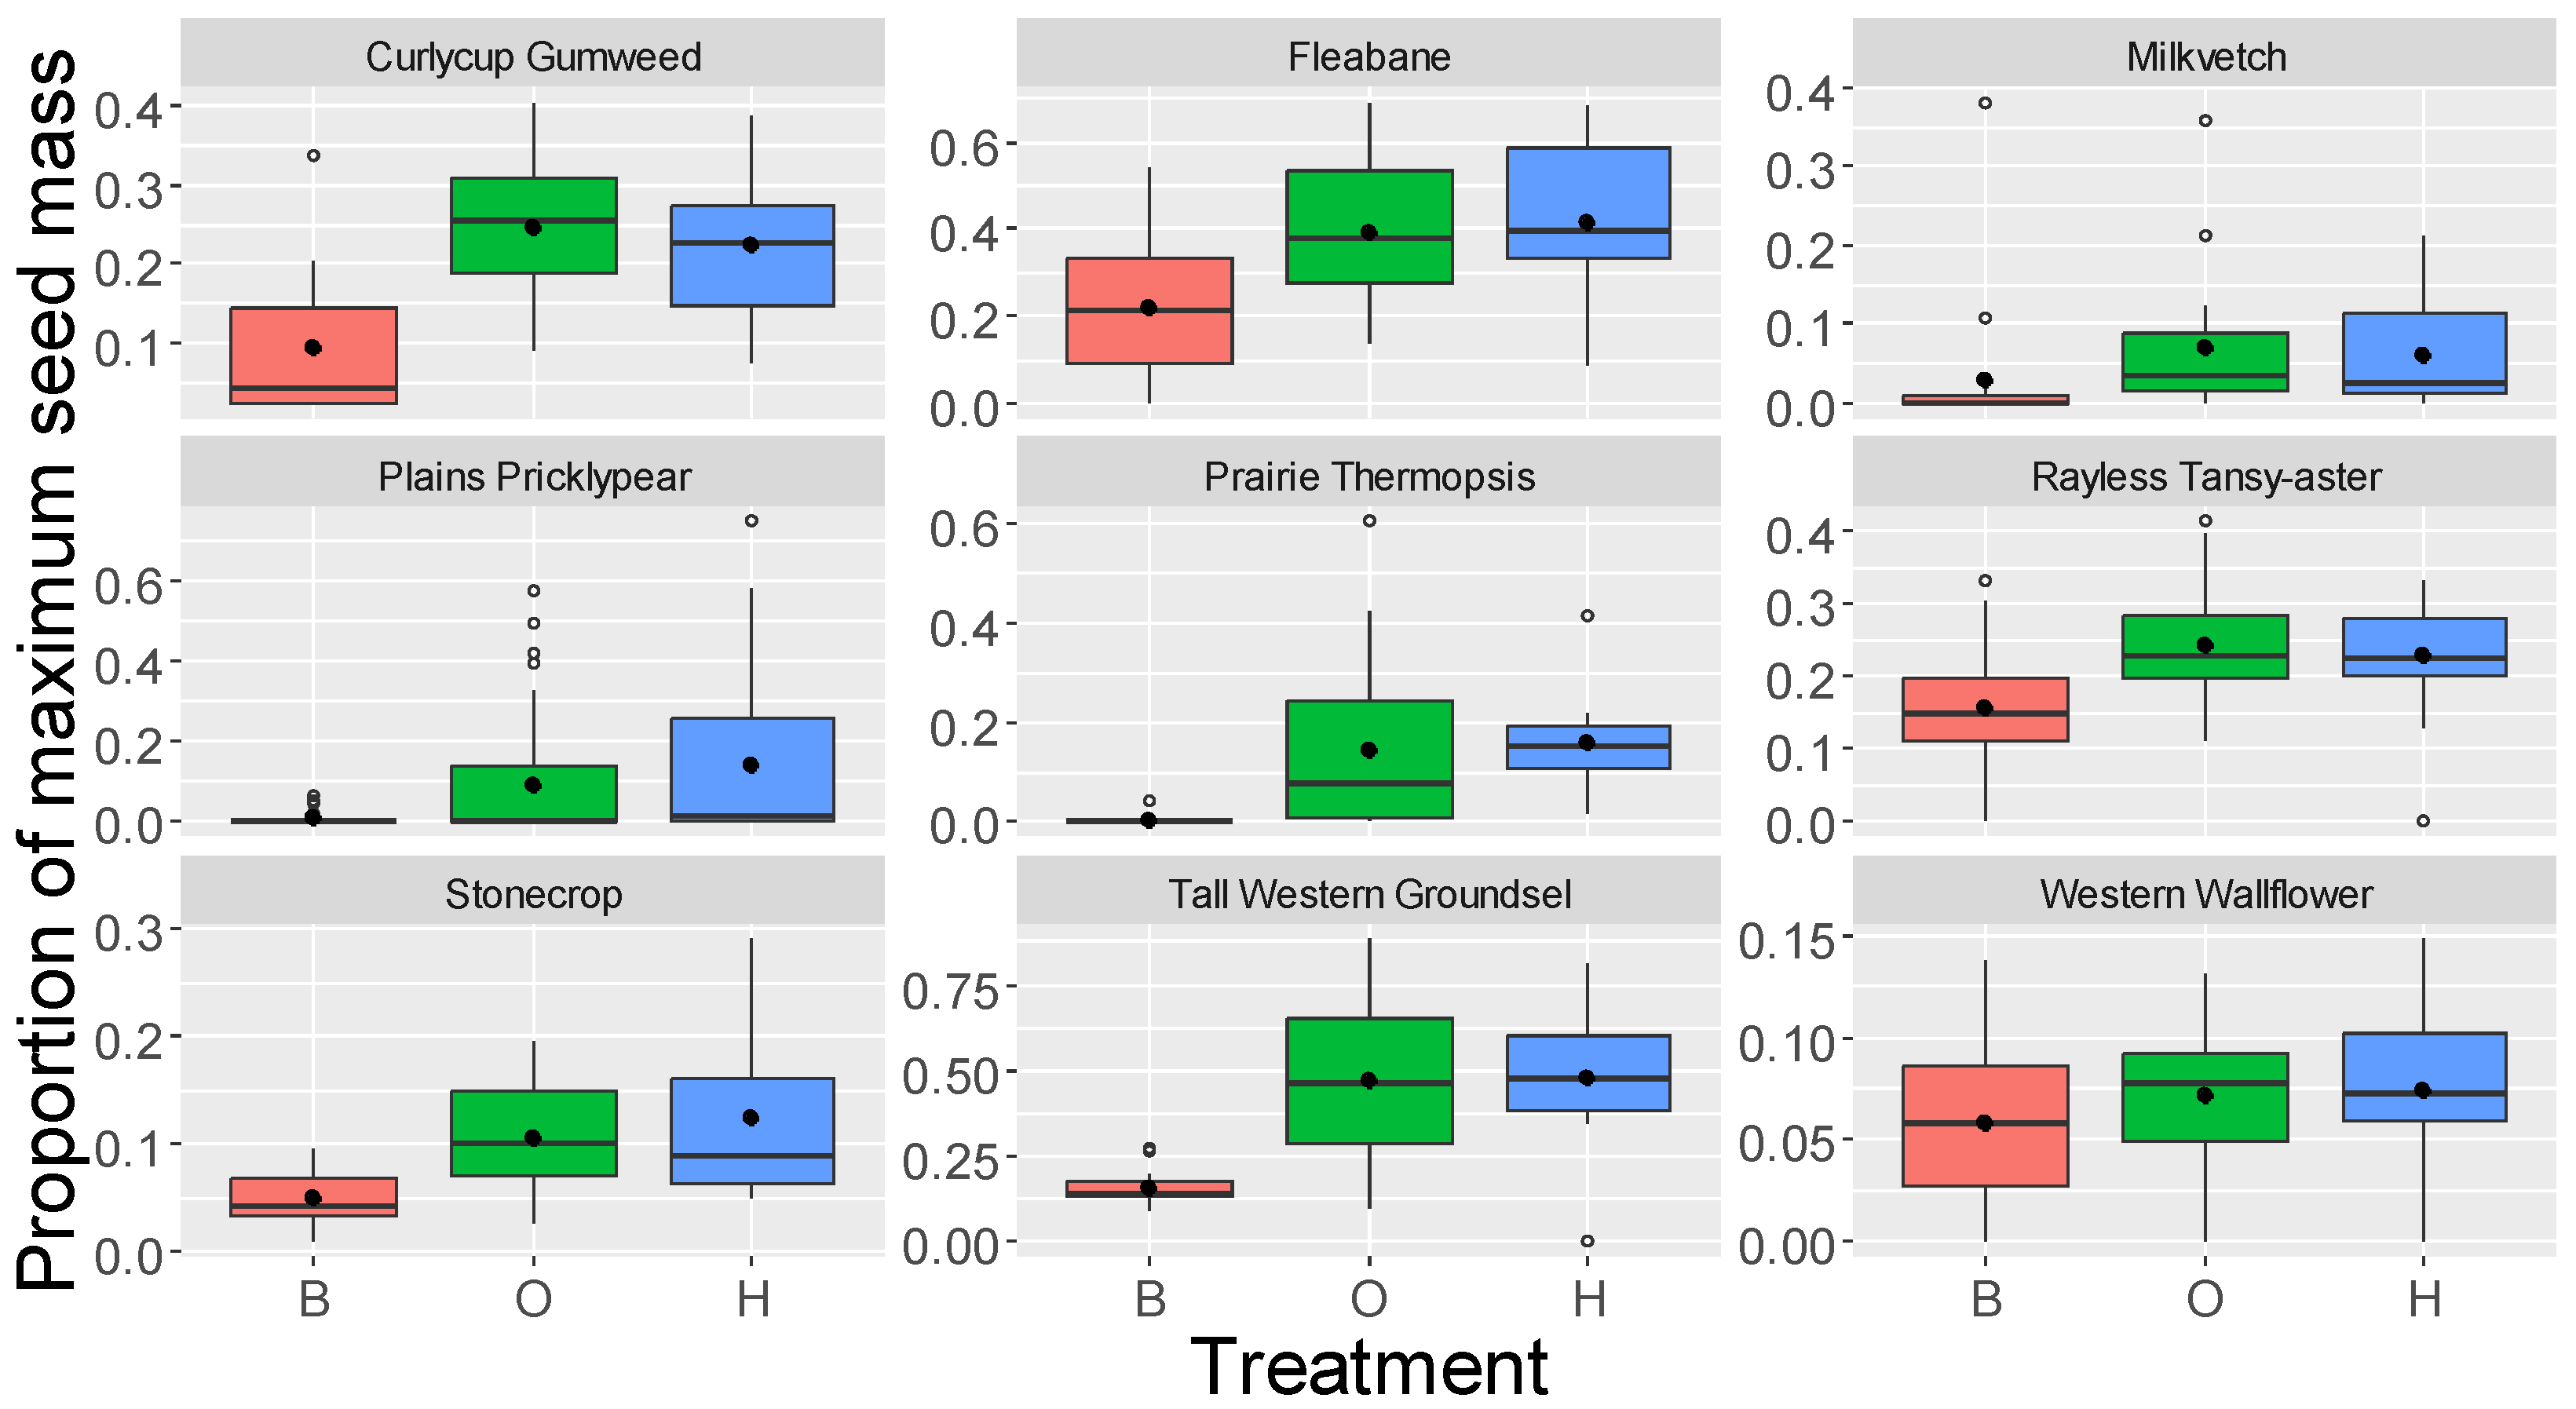
3.1. Seed Set of Flowering Plants

We measured the numbers and masses of seeds produced in 577 treatments across nine common native plant species. The numbers of seed sets varied among the plants, with Milkvetch producing 2 seeds, and Western Wallflower producing 96 seeds on average (Supplemental Table S1 and Supplemental Figure S1). Only 7% of the seeds appeared to be developed in the bagged treatment (Table 2; Figure 3), compared to 45% in the open- and hand-pollinated treatments across all nine plant species. The bagged treatment produced fewer seeds than the open- and hand-pollinated treatments for all plants except Milkvetch, where 16% of the seeds were developed on average among all three treatments (Table 2). The proportions of developed seeds did not differ between the open- and hand-pollinated treatments, indicating that none of the plants were pollen-limited (Table 2). The proportion of developed seeds did not decrease along the infrasound gradient among the treatments (t = −1.1, p = 0.29; Figure 4a and Table 2). When only including the bagged treatment, the proportions of developed seeds did not decrease with distance to turbines (t = −0.33, p = 0.74; Figure 4c), suggesting that vibrational frequencies do not alter the proportions of developed seeds.
The proportion of maximum seed mass was lowest (9%) in the bagged treatment and two times higher in the open- and hand-pollinated treatments (18%) among the plant species (Figure 5; Supplemental Table S1 and Supplemental Figure S2). Milkvetch and Western Wallflower self-pollinated, as shown by the lack of difference among the treatments, although both species produced very light seeds (5% and 7% of the maximum seed mass, respectively; Table 2). None of the plants were limited by pollen (the open- vs. hand-pollinated treatments did not differ; Table 2). The proportion of maximum seed mass was variable with distance from active turbines when all treatment were considered (Figure 4b; t = −1.4, p = 0.15), but the proportion of maximum seed mass decreased with distance from turbines when only the bagged treatment was included (t = −2.3, p = 0.02; Figure 4d).

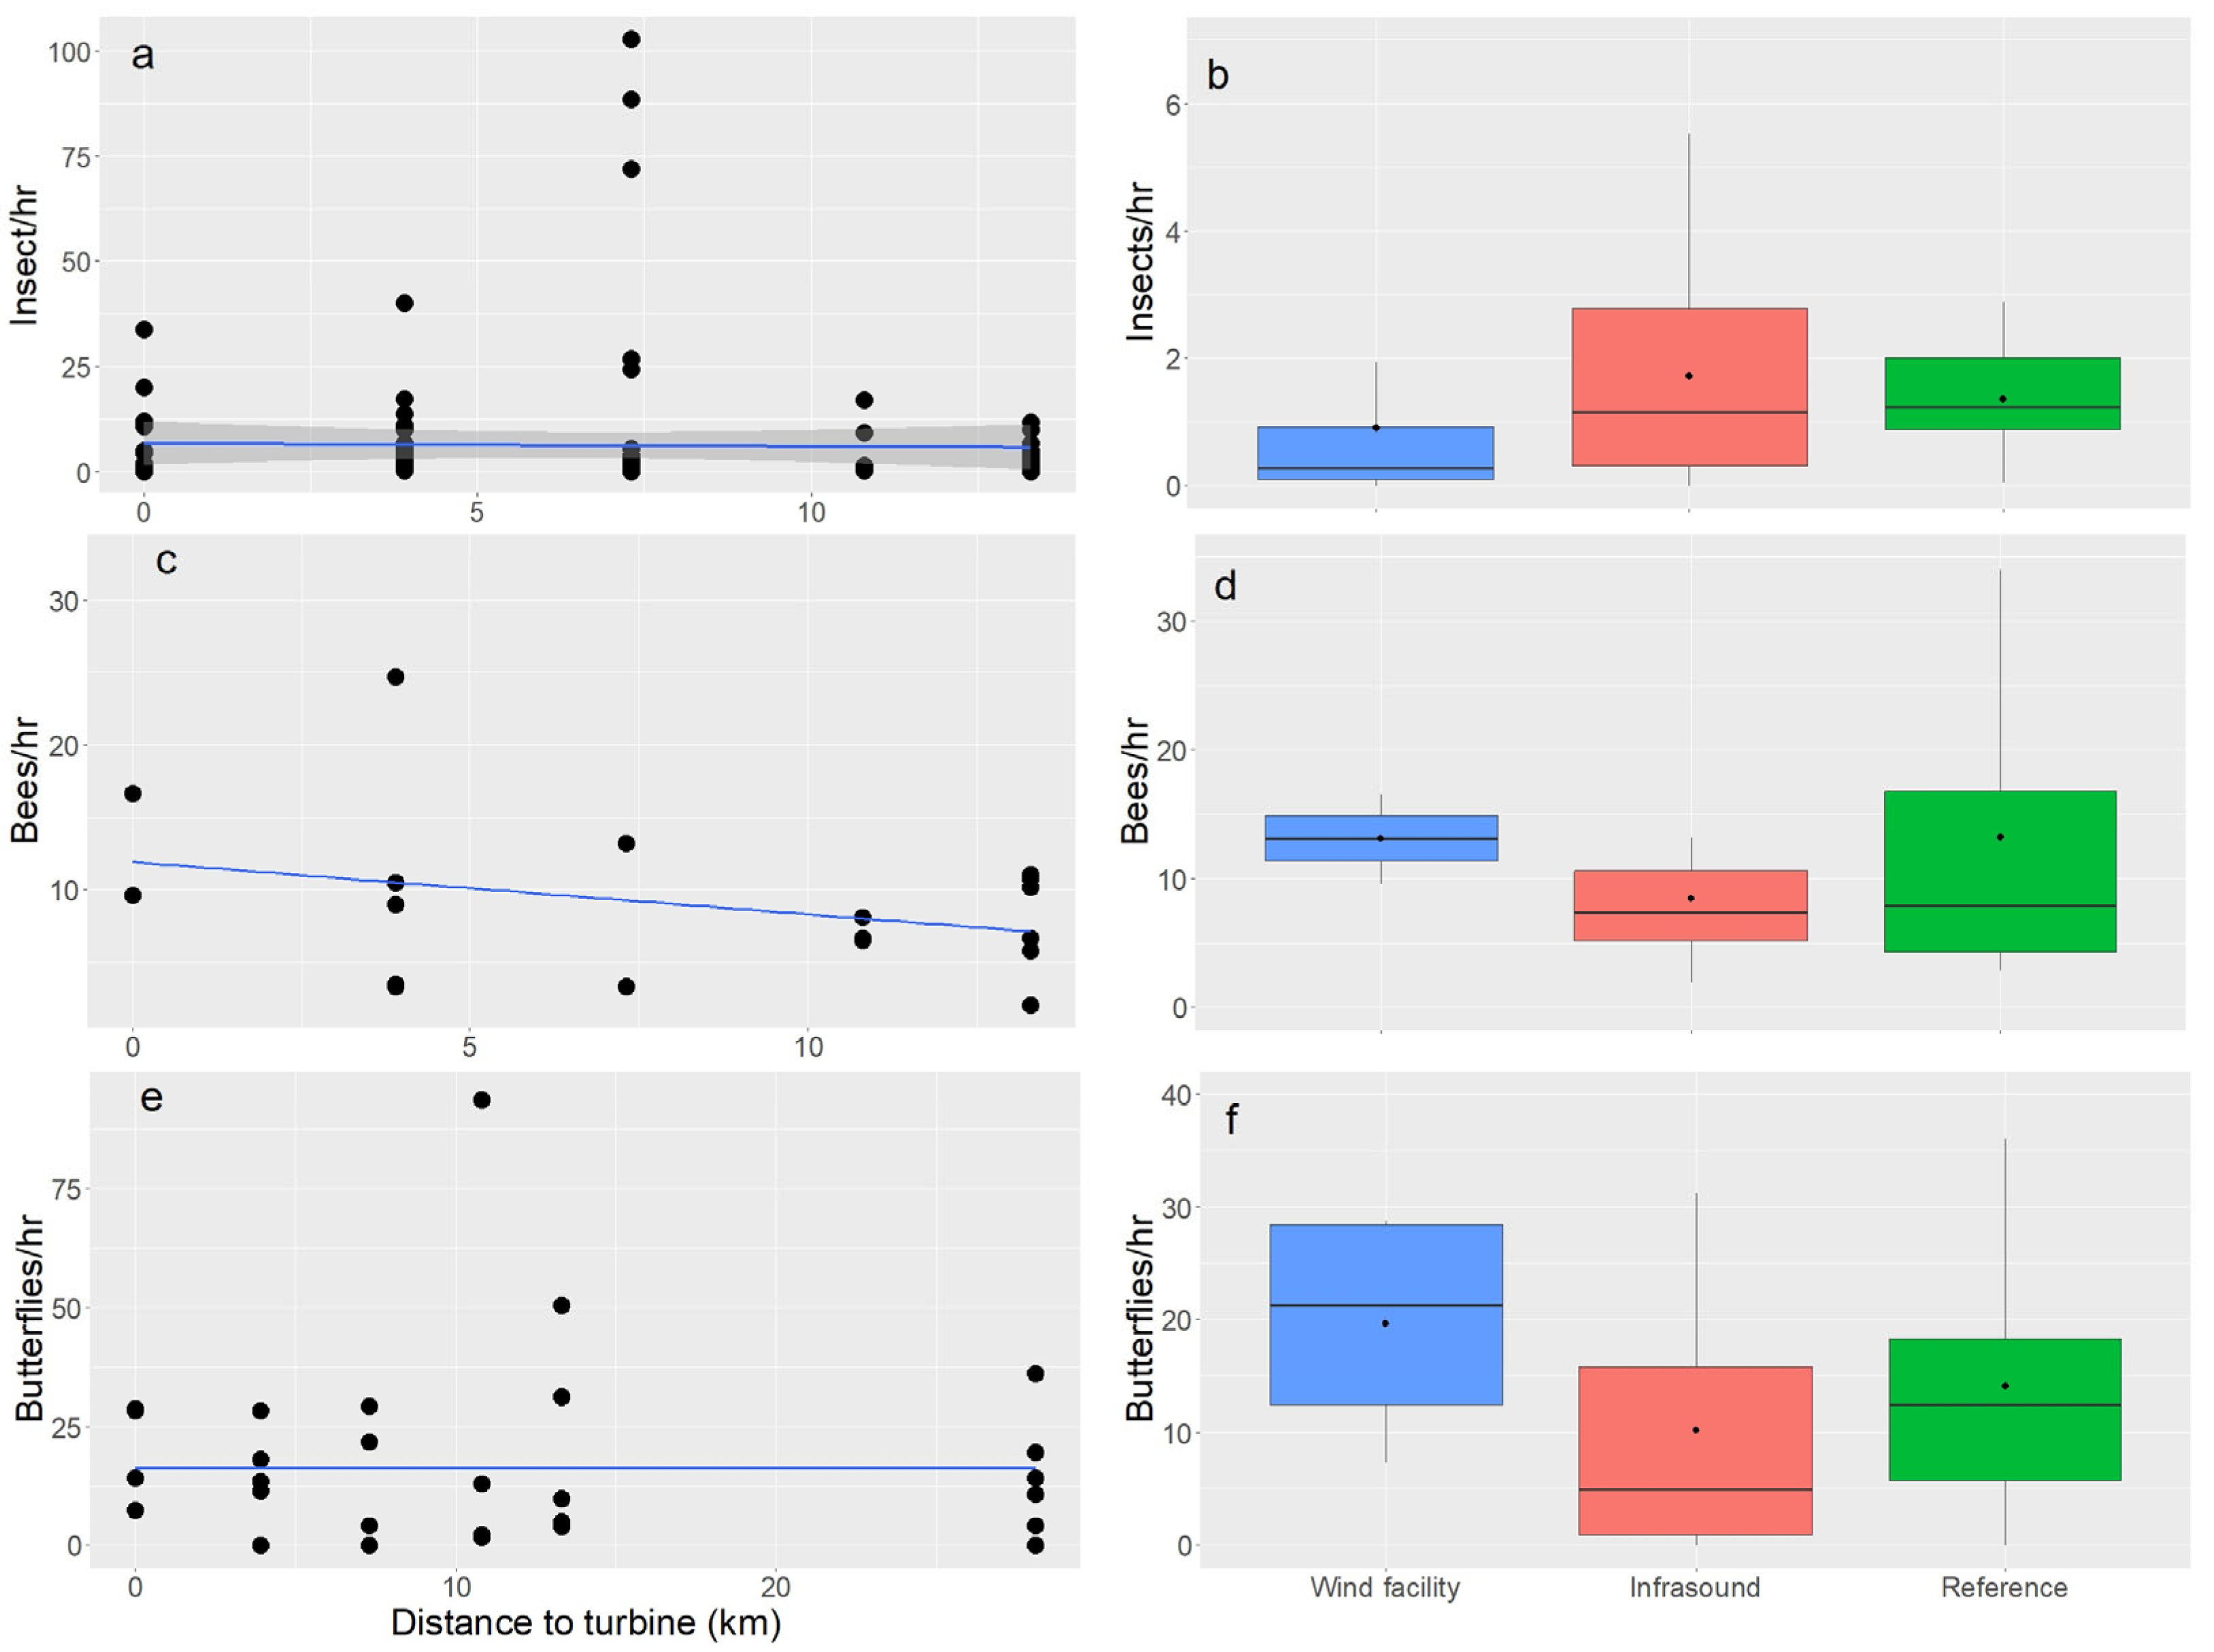
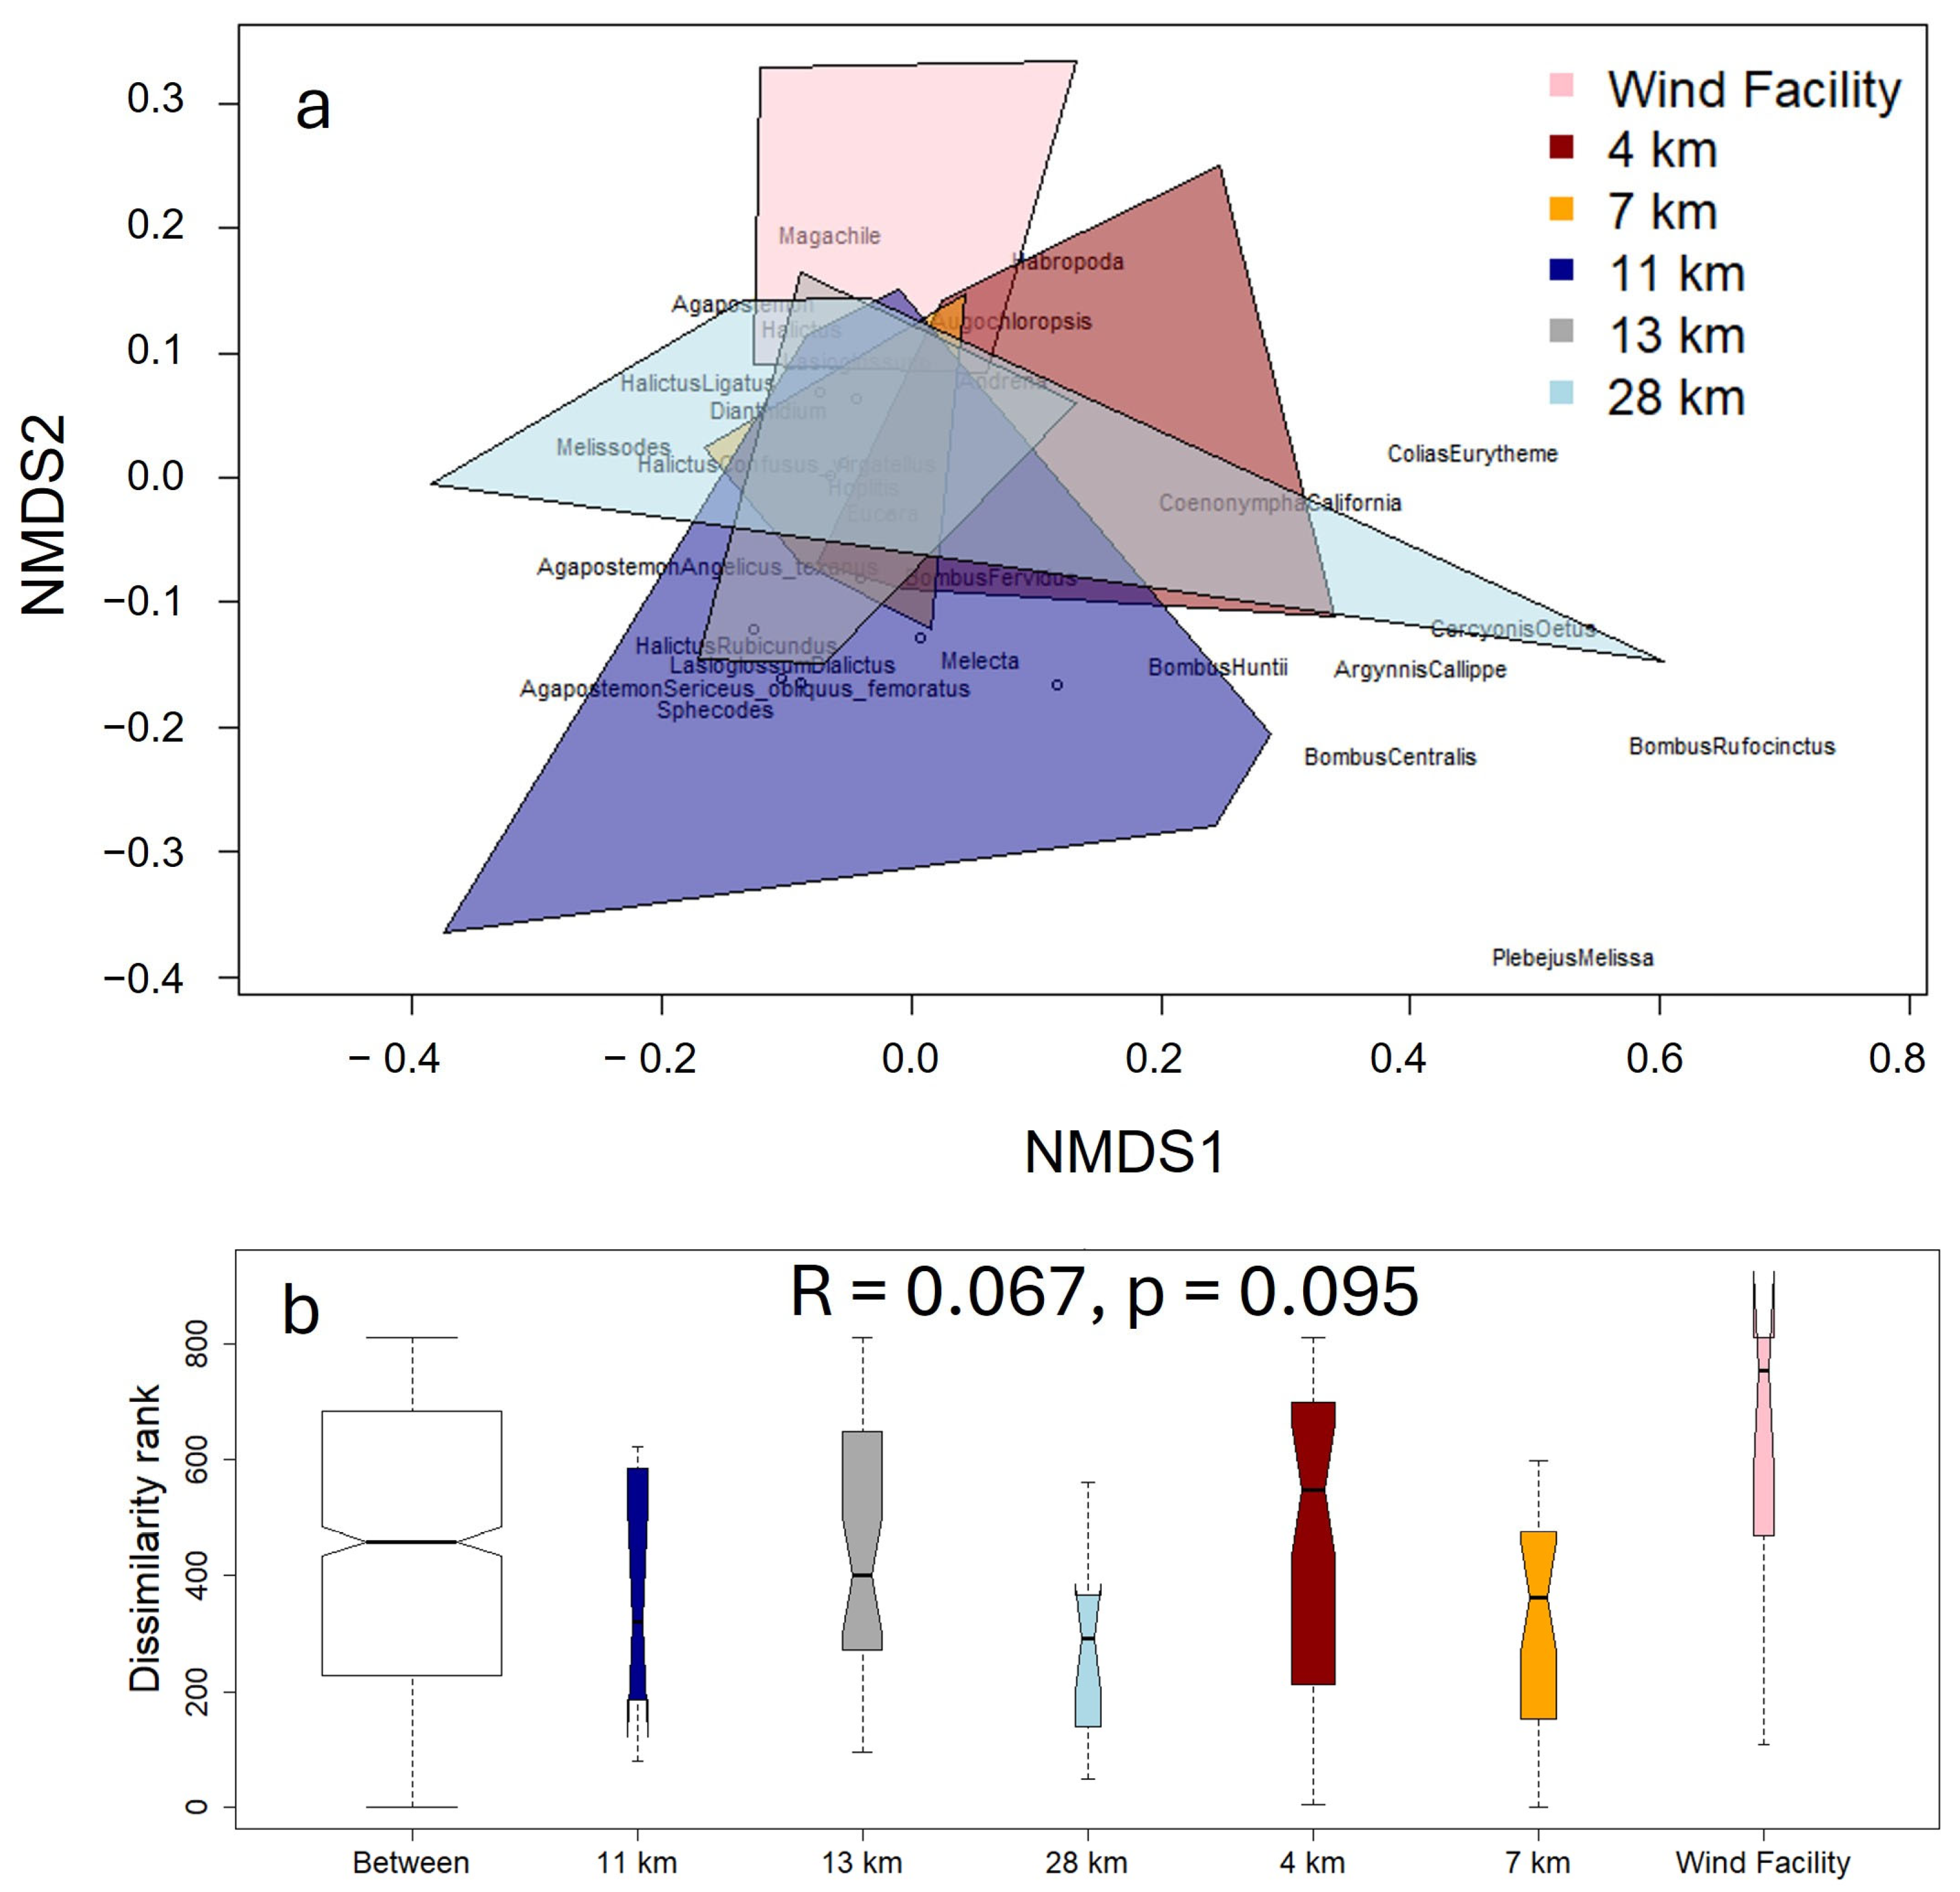
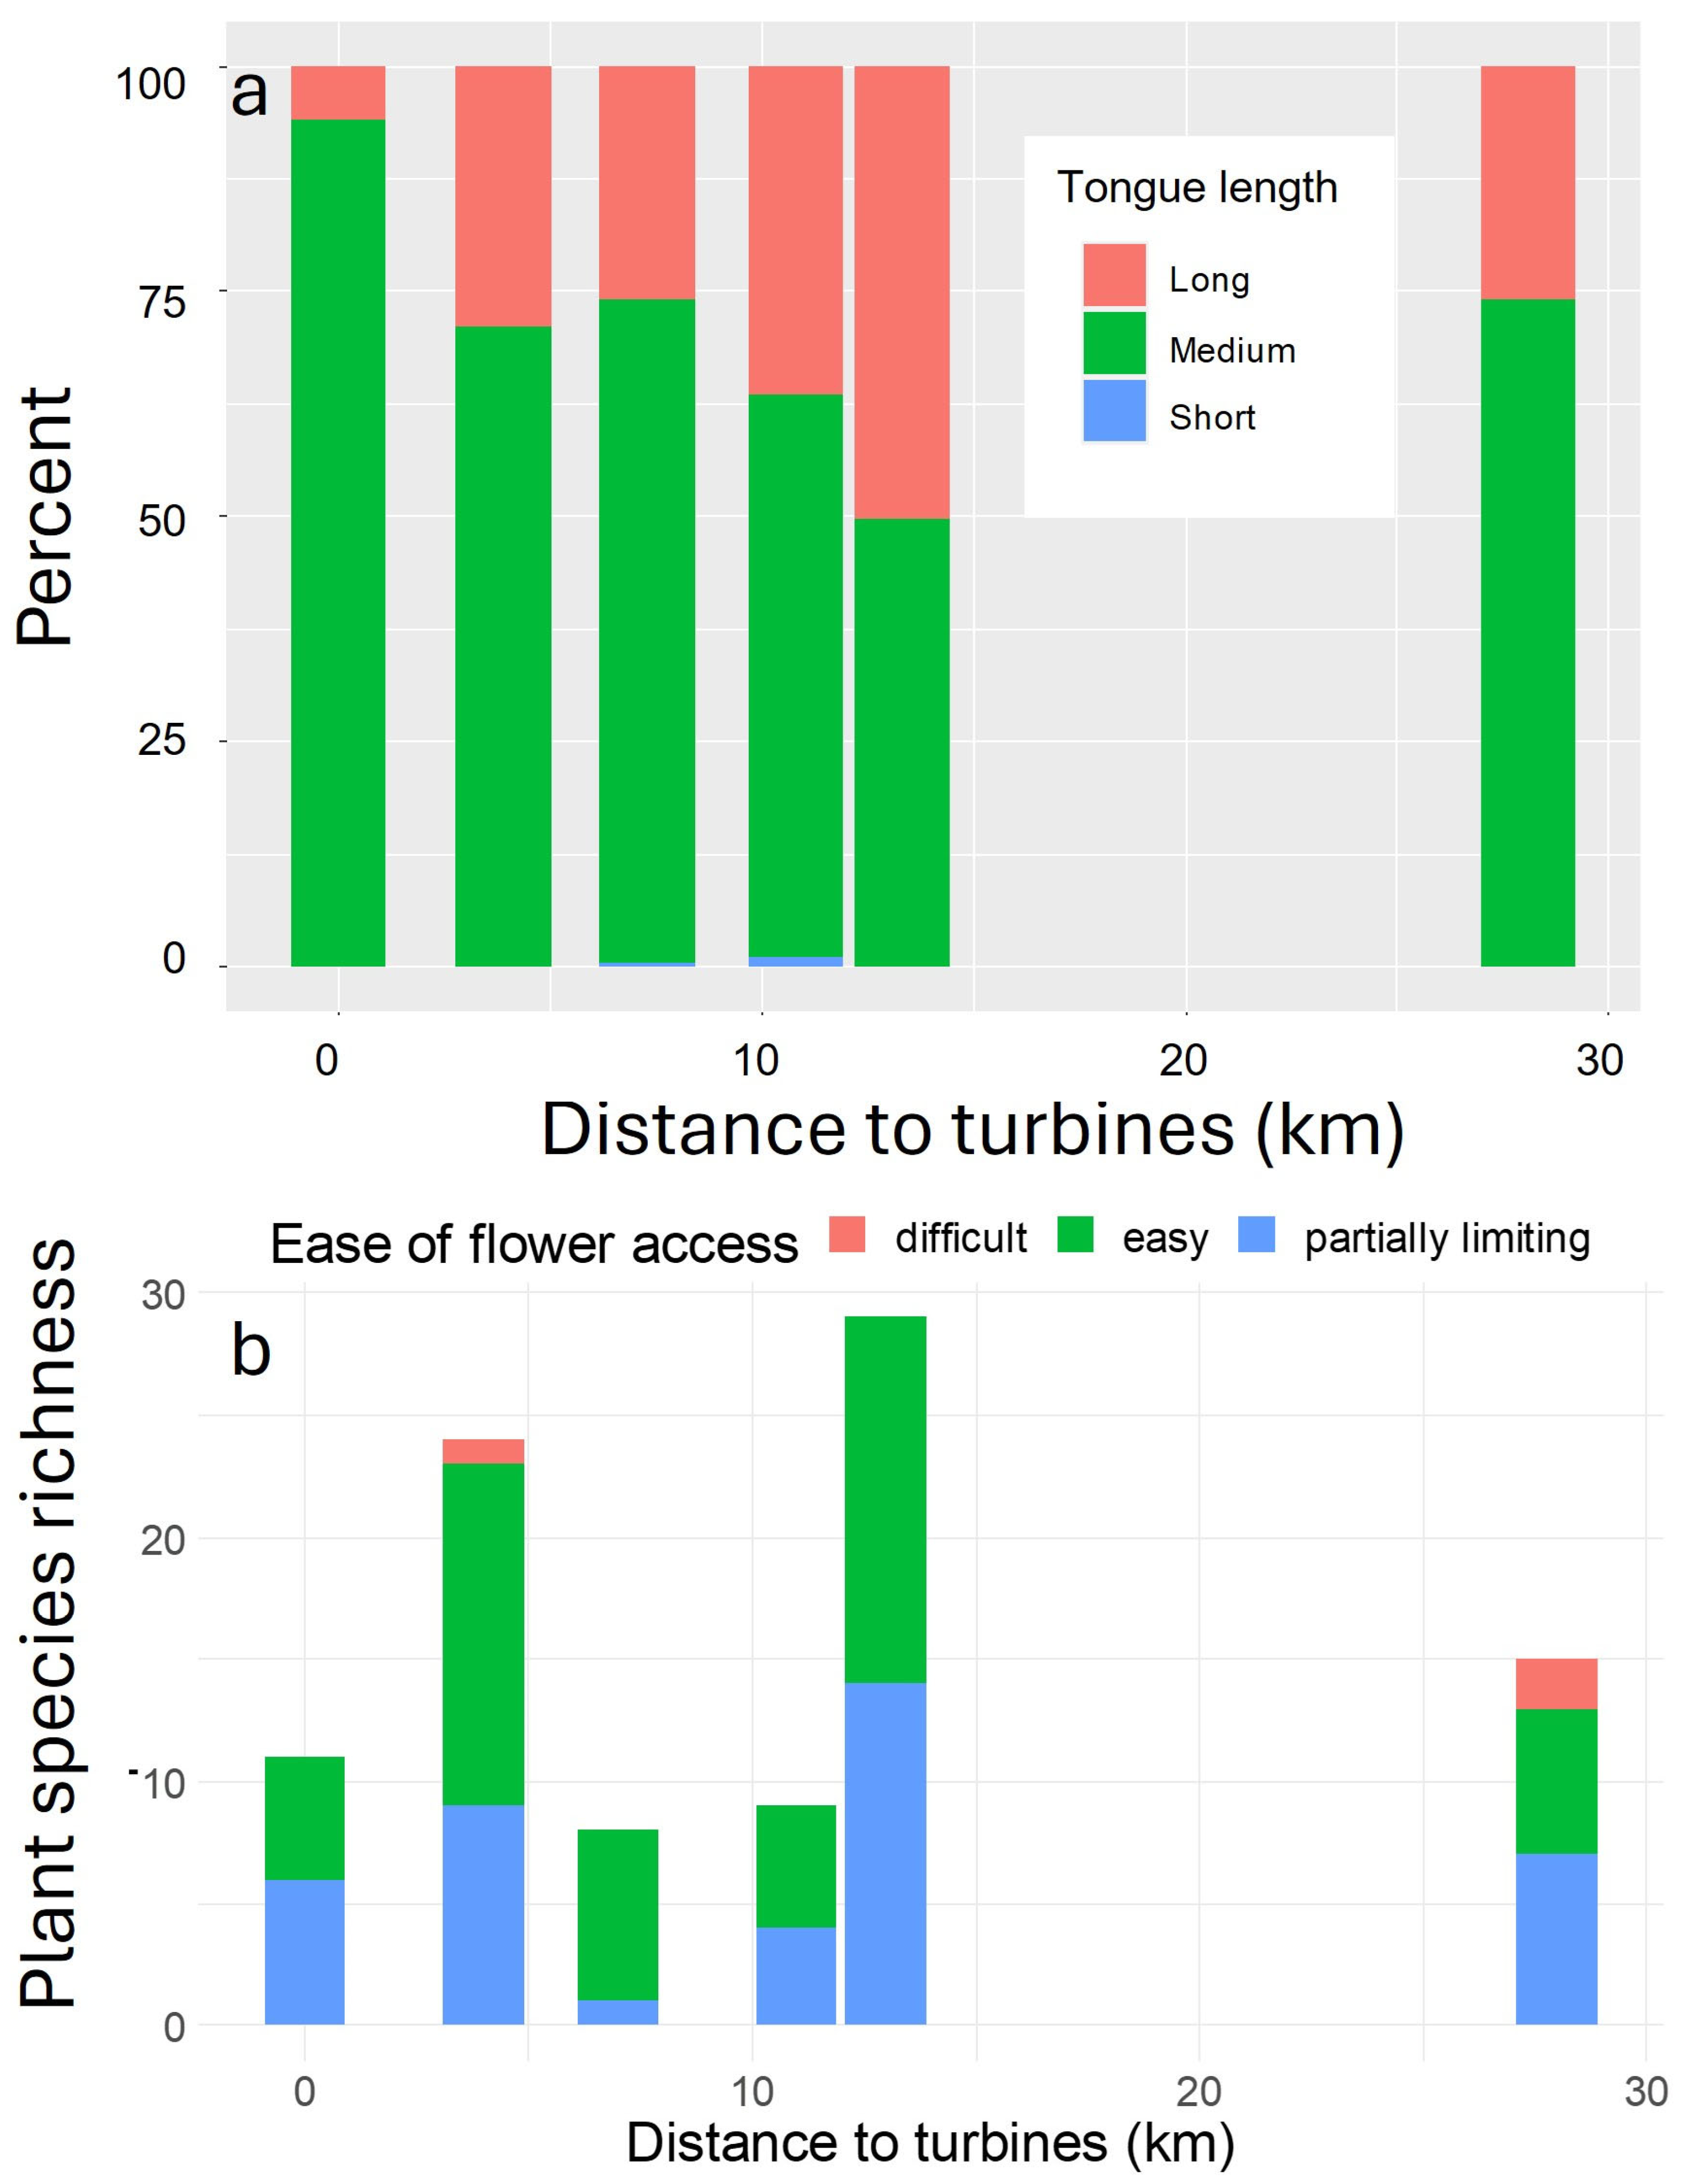
3.2. Abundances and Assemblages of Pollinators

We collected >3000 insects using target netting and vane traps during the 2-year period, of which 99% were bees. We collected 12 species of butterflies and 31 genera of bees, including eight species of bumble bee (Table A1). Agapostemon bees were the most abundant (48%), followed by Lasioglossum (12%), Osmia (9%), Eucera (8%), Anthophora (4%), Melissodes (3%), Ceratina (1%), Andrena (1%), and Megachile (1%). We captured the most insects at 7 km (35%) and the fewest at 13 km (10%) and 11 km (8%) from turbines.
The insect catch rate in the vane traps varied between 0 and 102 insects/h and changed with distance to turbines (t = −4.9, p < 0.0001; excluding the reference site; Figure 6a). We captured fewer insects at the wind facility than at the non-developed sites 4–13 km from the wind facility (z = 2.2–4.7, p < 0.03; emmeans, p < 0.0001; Figure 6b) and the reference site (emmeans, p = 0.065). We captured fewer insects in the vane traps at sites (z = 4.2, p < 0.0001) and times when more flowers were blooming (z = 10.8, p < 0.0001; Supplementary Figure S3a). More insects were captured in the vane traps at higher wind speeds (z = 3.2 p = 0.001; Supplementary Figure S3b) and higher temperatures (z = 6.9, p < 0.0001; Supplementary Figure S3c).
On average, we observed 9.7 bees per hour via target netting, but this number varied with distance to turbines (z = −4.6, p < 0.0001; excluding reference site; Figure 6c). We performed 1215 h of bee target netting. We observed the most bees within the wind facility and fewer bees at sites between 4 and 13 km from the turbines (Figure 6d; z = 32–84, p < 0.0001, p < 0.0001; emmeans, p < 0.0001). We observed more bees along the transects with a higher plant density (z = −3.2, p = 0.001) and when more plant species were blooming (z = −2.9, p = 0.004; Supplementary Figure S3d). The mean temperature (z = −1.6, p = 0.09) explained less variance in bee abundance, but we observed more bees at lower wind speeds (z = −4.9, p < 0.0001).
We walked 58 km and 1525 h to complete the butterfly transects. On average, we observed 16 butterflies per hour during the transects, which did not vary by distance to the turbines (z = −1.0, p = 0.32; excluding the reference site; Figure 6e). The abundance of butterflies was highest at the wind facility compared to the sites 4–13 km from the turbines and the reference site (z = 32–84, p < 0.0001; emmeans; p > 0.9), and the highest median value was at the wind facility (Figure 6f). Hairstreaks and Blues (22%) were the most abundant species, followed by Sulphurs (18%), Skippers (9%), Fritillaries (8%), Brushfoots (6%), and Whites (5%). We observed more butterflies along the transects when more plant species were blooming (z = 0.9 < 0.0001), but bloom density did not explain butterfly abundance (z = −0.21, p = 0.98). We observed more butterflies at warmer air temperatures (z = 0.68, p < 0.0001) and lower wind speeds (z = −4.6, p < 0.0001; Supplementary Figure S3e).
The assemblage of pollinators largely overlapped among the sites according to NMDS, with the wind facility overlapping little with the other sites (Figure 7). Sites lacking operating turbines overlapped to a large degree, with some interesting exceptions. The site farthest from the turbines occupied a broad space along the first axis. The site located 11 km from the turbines occupied the largest space and had the highest grazing intensity. The site nearest the turbines, at 4 km, also occupied a broad space, and the habitats at this site were the most diverse, varying between prairie and hills. Analysis of similarity (R = 0.07, p = 0.095) showed marginal differences among the sites, with the wind facility having the highest dissimilarity rank, and the farthest site having the lowest (Figure 7). Agapostemon were abundant at the wind facility, while Bombus and Eucera were not collected there but were captured at more distant sites (Table A1).
Bees were dominated by taxa with medium-length tongues, which were primarily Agapostemon in our study (Figure 8a). The wind facility had the highest proportion of bees with medium tongue lengths (94%), implying that some difficult-to-access flowers may be pollen-limited there. The richness of insect-pollinated flowers varied among the sites between 8 and 29 species (Figure 8b). Nectar was easily accessible or partially limiting in flowers at most sites. Very few flowers with difficult-to-access nectar were available, which was in contrast to the larger proportion of bees with longer tongues.

4. Discussion

Research on interactions between animals and wind facilities has focused on vertebrate wildlife, and far less is known about interactions among turbines, insects, and plants. A previous study showed that some flying insects were attracted to turbine mimics [7], and we have shown that bees and butterflies were more abundant within a wind facility and that their abundance decreased with distance from turbines. Large numbers of insects are estimated to collide with turbine blades [17], reducing the power produced by up to 50% [4], and exemplifying the need to reduce insect attraction to these facilities. Globally, the loss of insects may influence multiple trophic levels by disturbing ecosystem services such as pollination, decomposition, and nutrient cycling [10]. Plant communities are influenced by turbines [48,49,50], but effects vary by location [51]. Our results show that native plants produced lighter seeds farther from turbines, suggesting that the vibrations from turbines may alter self-pollination dynamics in some plant species.
Our study is the first to indicate that insects were more abundant within a wind facility compared to adjacent, undeveloped locations. Insects are attracted to the white vertical bases of turbines potentially because of their high contrast, reflectivity, shape, and the fact that white is a common flower color [5,7]. Insects may be attracted to other characteristics of turbines, such as the heat produced by the rotors, the location of turbines on the landscape, and their lighting during periods of low visibility [5]. Our data indicate that pollinators are attracted to turbines, as we observed higher abundances of bees and butterflies along transects conducted at the wind facility, and the fewest insects in the vane traps set there. Fewer bees are captured in vane traps when flowers are abundant because pollinators are attracted to flowers, and a vane trap is merely one attractive option in an area with many options [52]. We think the same phenomena occurred here, except the bees were attracted to the white wind turbine bases instead of the vane traps [7]. This hypothesis is further supported by our data; the wind facility had a lower density of blooming flowers. Vane traps set in areas with few blooming flowers should result in more bees captured; however, this was not the case in our study. When we did catch bees in our vane traps, the highest diversity of bees were found in traps placed at the bases of turbines rather than those placed upwind or downwind [5].
We measured higher rates of self-pollination in plants nearest the turbines, which may be due to several factors that are unique to wind facilities, such as turbulence, moderated temperatures, wake effects, pollinator attraction to turbine bases, or infrasound. High rates of self-pollination by Plains Pricklypear were also observed within a wind facility compared to upwind and downwind sites in southeast Wyoming, USA [23]. Wake effects can increase precipitation and moderate temperatures downwind of operating turbines [53,54,55]. We observed higher rates of self-pollination within the wind farm compared to downwind, which suggests that wake effects likely do not cause altered seed set. Warmer temperatures sometimes increase seed mass, which can affect seed dispersal, longevity, and growth [56], but precipitation did not alter seed set [57]. The observed differences may be explained by pollinator attraction to the turbine bases, resulting in less pollen transferred at the wind facility. Fewer pollinators transferring pollen would result in a lower proportion of viable seeds and self-pollination at the ambient rate, which we did not observe. Audible soundwaves from turbines may affect seed set, but this area is a knowledge gap. While in vitro treatment of plants with electromagnetic fields (EMFs) has yielded increased seed weight in buckwheat [58], turbines produce relatively low EMF levels that rapidly diminish to background levels within 4 m of the turbine bases [59,60]. Infrasound produces vibrations that have the potential to increase selfing by transferring pollen within a flower. The degree to which self-pollination occurs likely varies with flower morphology, as we did not observe a difference in Western Wallflowers measured at the same sites as Plains Pricklypear. Western Wallflower has more visible yellow flowers that are raised ≤0.4 m above the ground and bloom at the beginning of summer; these flowers were primarily produced through self-pollination. In contrast, Plains Pricklypear produces medium yellow flowers that bloom near the ground in mid-summer (Figure 1d). We are not aware of any studies that have investigated which plant characteristics make them more susceptible to vibrations produced by turbines. Vibrations from wind facilities may benefit plants that reproduce primarily through selfing, those that attenuate or transmit vibrational frequency, or other characteristics, but much more data are needed on how turbines may alter plant communities over time.
Our results suggest that operating wind facilities may introduce a mismatch between pollinator tongue length and flower shape. The interactions between pollinator tongue length and flower shape generate complexity in plant–pollinator networks. Tongue length is more limiting for short-tongued bees than long-tongued bees, because long-tongued bees can forage from flowers with either long or short corollas, while short-tongued bees cannot drink from deep corollas [61]. When tongue and corolla morphology match in an ecosystem, foraging and pollination are usually more efficient [62]. Tongue length, emergence timing, and foraging behavior may shape bee assemblages at wind facilities. For example, Goulson et al. [63] found that long-tongued, late-emerging bumble bees declined more than short-tongued, early-emerging species in the United Kingdom, possibly because of reduced availability of a specialized food source, such as plants in the Fabaceae family. Miller-Struttman et al. [64] found that the mean tongue length of B. sylvicola in the Rocky Mountains decreased by 24% in ~4 decades, potentially due to diminishing floral resources. Wind turbines alter environmental conditions, such as surface temperature, precipitation, and soil moisture [65,66], which likely alter the interactions between plants and their pollinators. Self-pollination due to infrasound could decrease genetic diversity in plant communities [67], increase rates of plant inbreeding, and negatively impact overall fitness [68,69]. Changes in plant and insect abundance or diversity near wind facilities could cause further cascading effects to flora and fauna.
Excessive heat and drought conditions may help explain some of our seed-set results, as these phenomena affect flower development and reproduction in plants. For example, Himalayan Balsam (Impatiens glandulifera) responded to dry conditions by reducing the number of flowers produced and the duration of flowering [70]. Dry conditions also accelerated the phenology of crops [71]. Purple Chinese Houses (Collinsia heterophylla) had smaller flowers, less pollen, and low pollen viability in heat-stressed conditions [72]. We did not assess flower development or pollen in our study, so the degree to which drought and heat stress may have altered these variables is unknown; however, we hypothesize that water and temperature stress may have altered seed set. Our study occurred during unusually hot conditions compared to the average, which may have influenced the perennial species. Plants tend to self-pollinate more frequently during drought compared to cross-pollination [72,73]. Two species in our study, Milkvetch and Western Wallflower, showed no difference in seed development among the treatments. The proportions of cross-pollination and seed development in these species may have been inhibited due to drought stress, as was measured for Rapeseed (Brassica napus) during a drought [74]. Unfortunately, we were not able to measure seed set for our plant species during a wetter year for comparison. Continued studies during varying climate situations would provide more data to interpret the low seed set of these species. Future climate predictions suggest less water availability in North America [75], which may have crucial implications for plants and pollinators [76].
In our study, we observed that seed set generally decreased with distance from turbines within the bagged treatment. We hypothesized that this was due to increased rates of self-pollination induced by infrasound vibrations originating from the turbines. Plants respond to sound frequencies in myriad ways, including growing toward certain frequencies [77], producing chemical defenses [78], and providing nectar [33]. Plants rely on vibrations and sounds to trigger the release of pollen [32]. Infrasound produced by wind turbines can be detected ≤20 km from turbines on windy days [26], but higher frequencies within the human hearing range dissipate quickly and are only heard within a wind facility. Our study areas were typically windy (≤7 m/s), and we chose our reference site because it was located >20 km from the nearest turbine, making this site minimally affected by turbine infrasound. The reference site was also distanced from other sources of infrasound, such as railroad tracks, bridges, and major roadways. We observed fewer seeds produced in the bagged treatment as the distance from turbines increased, suggesting that infrasound varied over our 28 km gradient.

5. Conclusions

Wind energy is rapidly growing, and we are only beginning to understand the interactions among turbines, insects, and plants, but we know that building wind facilities can reduce the richness and biomass of plants and animals [64,79,80]. Insect attraction to turbines has been hypothesized [5,6,7,8,9], and we have provided the first evidence that bees and butterflies were more abundant within a wind facility compared to more distant, non-agricultural sites. Our transects and trapping were performed at ground level, but insects can swarm around turbines at hub height [12]. The dominant taxa likely differ by height above ground, but much more work is needed to understand the extent and composition of insect mortality at blade height [10,81,82]. More insects near turbines may attract insectivorous birds (e.g., passerines), increasing the likelihood of these animals being struck by a rotating blade. A higher abundance of pollinators near turbines could have ramifications for crops and native plants depending on the location of the wind facility. Plants closer to turbines may experience enhanced self-pollination from infrasound, and we showed that this was true for several native species. Higher rates of self-pollination may be desirable for some crops; however, those grown for seed may have lower proportions of viable seeds. Overall, plants near turbines may produce more seeds, but the seeds will lack genetic diversity, resulting in a reduced ability to overcome adverse conditions, such as a changing climate [83]. Plants near wind facilities in natural areas may not be ideal to collect seed for restoration, re-planting, or conservation. Furthermore, a trend toward increased self-pollination can further degrade plant–pollinator interactions [84]. More studies are needed to understand the extent to which crops grown near turbines differ from those more distant. Differences likely exist due to variation in plant morphology, the ability to attenuate vibrations, and the landscape. Many unknowns exist, including how infrasound is transmitted in different conditions (frozen soil, wet soil, and dry soil), how wind turbine capacity affects the produced vibrations, and how infrasound affects overwintering bees. We hope our study will spark interest in investigating the interactions among plants, turbines, and insects at different altitudes and horizontal distances, as large knowledge gaps remain. We hope our results spur engineers to develop structures that buffer infrasound produced by turbines and consider painting turbines a less attractive color [7]. Understanding how wind turbines affect plants and insects will allow us to make informed decisions when siting on natural landscapes and agricultural croplands.

Supplementary Materials

A supporting file can be downloaded at https://www.mdpi.com/article/10.3390/wind5020015/s1: Supplementary Table S1 and Supplementary Figures S1–S3.

Author Contributions

Conceptualization, L.M.T.; methodology, L.M.T. and M.W.; validation, L.M.T. and M.W.; formal analysis, L.M.T., M.W., and A.M.S.; investigation, M.W., A.M.S., J.H., and B.P.T.; resources, L.M.T., M.W., and A.M.S.; data curation, L.M.T., M.W., A.M.S., J.H., and B.P.T.; writing—original draft preparation, L.M.T., M.W., A.M.S., and J.H.; writing—review and editing, L.M.T. and M.W.; visualization, L.M.T. and A.M.S.; supervision, L.M.T. and M.W.; project administration, L.M.T.; funding acquisition, L.M.T. All authors have read and agreed to the published version of the manuscript.

Funding

This research was funded by the US Bureau of Land Management, grant number L21AC10149-00.

Institutional Review Board Statement

Not applicable.

Data Availability Statement

We have provided the data as appendices and supplementary information. For more information, please contact the Wyoming Natural Diversity Database (https://www.uwyo.edu/wyndd/).

Acknowledgments

Katrina Cook assisted with the fieldwork. We thank PacificCorp for allowing us to conduct our research at an active wind facility. We thank a landowner for allowing us to access one of the sites. The Bureau of Land Management Rawlins Field office funded the study. We appreciate the time and comments from four anonymous reviewers and editors that improved the manuscript. We thank Jesse Barber for stimulating conversations that introduced us to the concept of infrasound produced by turbines.

Conflicts of Interest

The authors declare no conflicts of interest.

Abbreviations

The following abbreviations are used in this manuscript:
MWMegawatt
GLMGeneralized linear model
GLMERGeneralized linear mixed-effects model
ANOSIMAnalysis of similarities
NMDSNon-metric multidimensional scaling

Appendix A

Table A1. The number of collected bee and butterfly taxa from each site during 2022 and 2023 at a wind facility and at locations between 4 and 28 km away from turbines. Bees were identified to the genus level except for a few groups where species keys were available. Butterflies were identified to the species level.
Wind Facility4 km7 km11 km13 km28 km
Bees
Agapostemon25626345211662294
 angelicus/texanus14166137 45177
 coloradinus 1
 sericeus/obliquus/femoratus10142244 97
 virescens 1
Andrena3211171413
Anthidium 10 42
Anthophora9133082940
Ashmeadiella 1
Atoposmia 2
Augochloropsis 5
Bombus 331111217
 californicus 1
 centralis 1 1
 fervidus 21 31
 huntii 248148
 insularis 1
 nevadensis 4 37
 pensylvanicus 1 1
 rufocinctus 1 1
Calliopsis 1
Ceratina 13141 5
Coelioxys 1
Colletes 3211
Diadasia 4121
Dianthidium 110
Dioxys 1
Eucera126128254425
Habropoda 11 2
Halictus 11261 2
 confusus/virgatellus 12
 farinosus 1
 ligatus 1 1
 parallelus 1
 rubicundus 5 1
 tripartitus 47
Hoplitis 135 22
Lasioglossum1975145175950
Lithurgopsis apicalis1
Magechile4413245
Melecta 2 71
Melissodes3152413422
Melitoma 1
Osmia252677314063
Perdita 3 2
Sphecodes 11
Stelis 1
Svastra 1
Triepeolus 1
Butterflies
Argynnis callippe 11
Argynnis zerene 1
Cercyonis oetus11 13
Coenonympha california 21
Colias alexandra 1
Colias eurytheme 21
Hesperia colorado 1 1
Icaricia icarioides 2
Papilio zelicaon 1
Plebejus melissa 3
Pontia protodice 1
Tharsalea rubidus 1

References

  1. Schuster, E.; Bulling, L.; Köppel, J. Consolidating the state of knowledge: A synoptical review of wind energy’s wildlife effects. Environ. Manag. 2015, 56, 300–331. [Google Scholar] [CrossRef]
  2. Elzay, S.; Tronstad, L.; Dillon, M.E. Terrestrial invertebrates. In Wildlife and Wind Farms: Conflicts and Solutions; Perrow, M., Ed.; Pelagic Publishing: Exeter, UK, 2017; Volume 1: Onshore: Potential effects, pp. 63–77. [Google Scholar]
  3. Silva, M.; Pasos, I. Vegetation. In Wildlife and Wind Farms, Conflicts and Solutions; Perrow, M., Ed.; Pelagic Publishing: Exeter, UK, 2017; Volume 1: Onshore: Potential effects, pp. 40–62. [Google Scholar]
  4. Corten, G.P.; Veldkamp, H.F. Aerodynamics—Insects can halve wind-turbine power. Nature 2001, 412, 41–42. [Google Scholar] [CrossRef]
  5. Weschler, M.; Tronstad, L. Wind energy and insects: Reviewing the state of knowledge and identifying potential interactions. PeerJ 2024, 12, e18153. [Google Scholar] [CrossRef]
  6. Long, C.V.; Flint, J.A.; Lepper, P.A. Insect attraction to wind turbines: Does colour play a role? Eur. J. Wildl. Res. 2011, 57, 323–331. [Google Scholar] [CrossRef]
  7. Crawford, M.; Dority, D.; Dillon, M.E.; Tronstad, L.M. Insects are attracted to white wind turbine bases: Evidence from turbine mimics. West. North Am. Nat. 2023, 83, 232–242. [Google Scholar] [CrossRef]
  8. Foo, C.; Bennett, V.; Hale, A.; Korstian, J.; Schildt, A.; Williams, D. Increasing evidence that bats actively forage at wind turbines. PeerJ 2017, 11, e3985. [Google Scholar] [CrossRef]
  9. Rydell, J.; Bach, L.; Dubourg-Savage, M.-J.; Green, M.; Rodrigues, L.; Hedenstrom, A. Mortality of bats at wind turbines links to nocturnal insect migration? Eur. J. Wildl. Res. 2010, 56, 823–827. [Google Scholar] [CrossRef]
  10. Voigt, C.C. Insect fatalities at wind turbines as biodiversity sinks. Conserv. Sci. Pract. 2021, 3, e366. [Google Scholar] [CrossRef]
  11. Dudek, K.; Dudek, M.; Tryjanowski, P. Wind turbines as overwintering sites attractive to an invasive lady beetle, Harmonia axyridis Pallas (Coleoptera: Coccinellidae). Coleopt. Bull. 2015, 69, 665–669. [Google Scholar] [CrossRef]
  12. Jansson, S.; Malmqvist, E.; Brydegaard, M.; Åkesson, S.; Rydell, J. A Scheimpflug lidar used to observe insect swarming at a wind turbine. Ecol. Indic. 2020, 117, 106578. [Google Scholar] [CrossRef]
  13. Sanchez-Bayo, F.; Wyckhuys, K.A.G. Worldwide decline of the entomofauna: A review of its drivers. Biol. Conserv. 2019, 232, 8–27. [Google Scholar] [CrossRef]
  14. Matias, D.M.S.; Leventon, J.; Rau, A.-L.; Borgemeister, C.; von Wehrden, H. A review of ecosystem service benefits from wild bees across social contexts. Ambio 2017, 46, 456–467. [Google Scholar] [CrossRef] [PubMed]
  15. Capinera, J. Insects and Wildlife: Arthropods and Their Relationships with Wild Vertebrate Animals; Wiley: Hoboken, NJ, USA, 2010; p. 500. [Google Scholar]
  16. Losey, J.E.; Vaughan, M. The economic value of ecological services provided by insects. Bioscience 2006, 56, 311–323. [Google Scholar] [CrossRef]
  17. Trieb, F. Interference of Flying Insects and Wind Parks; Deutsches Zentrum fur Luft- und Raumfahrt: Stuttgart, Germany, 2018; p. 30. [Google Scholar]
  18. Aigner, P.A. Ecological and genetic effects on demographic processes: Pollination, clonality and seed production in Dithyrea maritima. Biol. Conserv. 2004, 116, 27–34. [Google Scholar] [CrossRef]
  19. Dufresne, F.; Stift, M.; Vergilino, R.; Mable, B.K. Recent progress and challenges in population genetics of polyploid organisms: An overview of current state-of-the-art molecular and statistical tools. Mol. Ecol. 2014, 23, 40–69. [Google Scholar] [CrossRef]
  20. Marchetti, C.; Locatelli, D.P.; Noordwijk, A.J.V.; Baldaccini, N.E. The effects of prey size on diet differentiation of seven passerine species at two spring stopover sites. Ibis 1998, 140, 25–34. [Google Scholar] [CrossRef]
  21. Nyffeler, M.; Şekercioğlu, Ç.H.; Whelan, C.J. Insectivorous birds consume an estimated 400–500 million tons of prey annually. Sci. Nat. 2018, 105, 47. [Google Scholar] [CrossRef] [PubMed]
  22. Erickson, W.P.; Wolfe, M.M.; Bay, K.J.; Johnson, D.H.; Gehring, J.L. A comprehensive analysis of small-passerine fatalities from collision with turbines at wind energy facilities. PLoS ONE 2014, 9, e107491. [Google Scholar] [CrossRef]
  23. Tronstad, L.M. Unpublished data. 2025. [Google Scholar]
  24. Meunier, M. Wind Farm—Long term noise and vibration measurements. Proc. Meet. Acoust. 2013, 19, 040075. [Google Scholar] [CrossRef]
  25. Zajamsek, B.; Hansen, K.L.; Doolan, C.J.; Hansen, C.H. Characterisation of wind farm infrasound and low-frequency noise. J. Sound Vib. 2016, 370, 176–190. [Google Scholar] [CrossRef]
  26. Keith, S.E.; Daigle, G.A.; Stinson, M.R. Wind turbine low frequency and infrasound propagation and sound pressure level calculations at dwellings. J. Acoust. Soc. Am. 2018, 144, 981–996. [Google Scholar] [CrossRef] [PubMed]
  27. Agnew, R.C.N.; Smith, V.J.; Fowkes, R.C. Wind turbines cause chronic stress in badgers (Meles meles) in Great Britain. J. Wildl. Dis. 2016, 52, 459–467. [Google Scholar] [CrossRef] [PubMed]
  28. Velilla, E.; Collinson, E.; Bellato, L.; Berg, M.P.; Halfwerk, W. Vibrational noise from wind energy-turbines negatively impacts earthworm abundance. Oikos 2021, 130, 844–849. [Google Scholar] [CrossRef]
  29. Arroyo-Correa, B.; Beattie, C.; Vallejo-Marín, M. Bee and floral traits affect the characteristics of the vibrations experienced by flowers during buzz pollination. J. Exp. Biol. 2019, 222, jeb198176. [Google Scholar] [CrossRef]
  30. Phillips, M.E.; Chio, G.; Hall, C.L.; ter Hofstede, H.M.; Howard, D.R. Seismic noise influences brood size dynamics in a subterranean insect with biparental care. Anim. Behav. 2020, 161, 15–22. [Google Scholar] [CrossRef]
  31. Fründ, J.; Zieger, S.L.; Tscharntke, T. Response diversity of wild bees to overwintering temperatures. Oecologia 2013, 173, 1639–1648. [Google Scholar] [CrossRef]
  32. De Luca, P.A.; Vallejo-Marín, M. What’s the ‘buzz’about? The ecology and evolutionary significance of buzz-pollination. Curr. Opin. Plant Biol. 2013, 16, 429–435. [Google Scholar] [CrossRef] [PubMed]
  33. Veits, M.; Khait, I.; Obolski, U.; Zinger, E.; Boonman, A.; Goldshtein, A.; Saban, K.; Seltzer, R.; Ben-Dor, U.; Estlein, P.; et al. Flowers respond to pollinator sound within minutes by increasing nectar sugar concentration. Ecol. Lett. 2019, 22, 1483–1492. [Google Scholar] [CrossRef]
  34. Takle, E.S. Climate. In Wildlife and Wind Farms: Conflicts and Solutions; Perrow, M., Ed.; Pelagic Publishing: Exeter, UK, 2017; Volume 1: Onshore: Potential effects, pp. 63–77. [Google Scholar]
  35. Garrity, C.; Diffendorfer, J. US Wind Turbine Database Viewer. Available online: https://www.usgs.gov/tools/us-wind-turbine-database-uswtdb-viewer (accessed on 5 January 2022).
  36. National Oceanic and Atmospheric Administration. US Climate Data. Available online: https://www.usclimatedata.com/ (accessed on 15 December 2023).
  37. Curtis, J. Wyoming Climate Atlas. Available online: https://www.wrds.uwyo.edu/sco/wyoclimate.html (accessed on 15 December 2023).
  38. National Drought Mitigation Center; US Department of Agriculture; National Oceanic and Atmospheric Administration. Available online: https://droughtmonitor.unl.edu/Maps/MapArchive.aspx (accessed on 15 December 2023).
  39. Crawford, M.S.; Handley, J.; Tronstad, L.M. An insect-pollinated species in a wind-pollinated genus: Case study of the endemic plant, Laramie chickensage Artemisia simplex. Nord. J. Bot. 2022, 2022, e03708. [Google Scholar] [CrossRef]
  40. Handley, J.C.; Tronstad, L.M. Pollinators limit seed production in an early blooming rare plant: Evidence of a mismatch between plant phenology and pollinator emergence. Nord. J. Bot. 2023, 2023, e03877. [Google Scholar] [CrossRef]
  41. Lenth, R. Emmeans: Estimated Mearginal Means, Aka Least-Squares Means, R package version 1.7.2. Comprehensive R Archive Network. R Foundation for Statistical Computing: Vienna, Austria, 2022.
  42. Michener, C.D.; McGinley, R.J.; Danforth, B.N. The Bee Genera of North and Central America (Hymenoptera: Apoidea); Smithsonian Institution Press: Washington, DC, USA, 1994; p. 209. [Google Scholar]
  43. Williams, P.H.; Thorp, R.W.; Richardson, L.L.; Colla, S.R. Bumble Bees of North America; Princeton University Press: Princeton, NJ, USA, 2014; p. 208. [Google Scholar]
  44. Brock, J.; Kaufman, K. Kaufman’s Field Guide to Butterflies of North America; Houghton Mifflin Publishing Company: New York, NY, USA, 2003; p. 392. [Google Scholar]
  45. Cariveau, D.P.; Nayak, G.K.; Bartomeus, I.; Zientek, J.; Ascher, J.S.; Gibbs, J.; Winfree, R. The allometry of bee proboscis length and its uses in ecology. PloS ONE 2016, 11, e0151482. [Google Scholar] [CrossRef] [PubMed]
  46. R Core Team. R: A Language for Environment and Statistical Computing; R Core Team: Vienna, Austria, 2025. [Google Scholar]
  47. Oksanen, J.; Blanchet, F.G.; Kindt, R.; Legendre, P.; Minchin, P.R.; O’Hara, R.B.; Simpson, G.L.; Solymos, P.; Henry, M.; Stevens, H.; et al. Vegan: Community Ecology Package; 2013. Available online: https://cran.r-project.org/web/packages/vegan/vegan.pdf (accessed on 15 July 2023).
  48. Pătru-Stupariu, I.; Calotă, A.-M.; Santonja, M.; Anastasiu, P.; Stoicescu, I.; Biriş, I.A.; Stupariu, M.-S.; Buttler, A. Do wind turbines impact plant community properties in mountain region? Biologia 2019, 74, 1613–1619. [Google Scholar] [CrossRef]
  49. Keehn, J.E.; Feldman, C.R. Disturbance affects biotic community composition at desert wind farms. Wildl. Res. 2018, 45, 383–396. [Google Scholar] [CrossRef]
  50. Urziceanu, M.; Anastasiu, P.; Rozylowicz, L.; Sesan, T.E. Local-scale impact of wind energy farms on rare, endemic, and threatened plant species. PeerJ 2021, 9, e11390. [Google Scholar] [CrossRef]
  51. Xu, K.; He, L.; Hu, H.; Liu, S.; Du, Y.; Wang, Z.; Li, Y.; Li, L.; Khan, A.; Wang, G. Positive ecological effects of wind farms on vegetation in China’s Gobi desert. Sci. Rep. 2019, 9, 6341. [Google Scholar] [CrossRef] [PubMed]
  52. Kuhlman, M.; Burrows, S.; Mummey, D.; Ramsey, P. Relative bee abundance varies by collection method and flowering richness: Implications for understanding patterns in bee community data. Ecol. Solut. Evid. 2021, 2, 11. [Google Scholar] [CrossRef]
  53. Baidya Roy, S.; Traiteur, J.J. Impacts of wind farms on surface air temperatures. Proc. Natl. Acad. Sci. USA 2010, 107, 17899–17904. [Google Scholar] [CrossRef] [PubMed]
  54. Rajewski, D.A.; Takle, E.S.; Lundquist, J.K.; Oncley, S.; Prueger, J.H.; Horst, T.W.; Rhodes, M.E.; Pfeiffer, R.; Hatfield, J.L.; Spoth, K.K. Crop wind energy experiment (CWEX): Observations of surface-layer, boundary layer, and mesoscale interactions with a wind farm. Bull. Am. Meteorol. Soc. 2013, 94, 655–672. [Google Scholar] [CrossRef]
  55. Fiedler, B.H.; Bukovsky, M.S. The effect of a giant wind farm on precipitation in a regional climate model. Environ. Res. Lett. 2011, 6, 045101. [Google Scholar] [CrossRef]
  56. Walck, J.L.; Hidayati, S.N.; Dixon, K.W.; Thompson, K.; Poschlod, P. Climate change and plant regeneration from seed. Glob. Change Biol. 2011, 17, 2145–2161. [Google Scholar] [CrossRef]
  57. Drebenstedt, I.; Hart, L.; Poll, C.; Marhan, S.; Kandeler, E.; Böttcher, C.; Meiners, T.; Hartung, J.; Högy, P. Do soil warming and changes in precipitation patterns affect seed yield and seed quality of field-grown winter oilseed rape? Agronomy 2020, 10, 520. [Google Scholar] [CrossRef]
  58. Ivankov, A.; Naučienė, Z.; Degutytė-Fomins, L.; Žūkienė, R.; Januškaitienė, I.; Malakauskienė, A.; Jakštas, V.; Ivanauskas, L.; Romanovskaja, D.; Šlepetienė, A. Changes in agricultural performance of common buckwheat induced by seed treatment with cold plasma and electromagnetic field. Appl. Sci. 2021, 11, 4391. [Google Scholar] [CrossRef]
  59. Alexias, A.; Kiouvrekis, Y.; Tyrakis, C.; Alkhorayef, M.; Sulieman, A.; Tsougos, I.; Theodorou, K.; Kappas, C. Extremely low frequency electromagnetic field exposure measurement in the vicinity of wind turbines. Radiat. Prot. Dosim. 2020, 189, 395–400. [Google Scholar] [CrossRef] [PubMed]
  60. McCallum, L.C.; Whitfield Aslund, M.L.; Knopper, L.D.; Ferguson, G.M.; Ollson, C.A. Measuring electromagnetic fields (EMF) around wind turbines in Canada: Is there a human health concern? Environ. Health 2014, 13, 9. [Google Scholar] [CrossRef] [PubMed]
  61. Ranta, E.; Lundberg, H. Resource partitioning in bumblebees: The significance of differences in proboscis length. Oikos 1980, 35, 298–302. [Google Scholar] [CrossRef]
  62. Barrow, D.; Pickard, R. Size-related selection of food plants by bumblebees. Ecol. Entomol. 1984, 9, 369–373. [Google Scholar] [CrossRef]
  63. Goulson, D.; Hanley, M.E.; Darvill, B.; Ellis, J.; Knight, M.E. Causes of rarity in bumblebees. Biol. Conserv. 2005, 122, 9. [Google Scholar] [CrossRef]
  64. Miller-Struttmann, N.E.; Geib, J.C.; Franklin, J.D.; Kevan, P.G.; Holdo, R.M.; Ebert-May, D.; Lynn, A.M.; Kettenbach, J.A.; Hedrick, E.; Galen, C. Functional mismatch in a bumble bee pollination mutualism under climate change. Science 2015, 349, 1541–1544. [Google Scholar] [CrossRef]
  65. Tang, B.; Wu, D.; Zhao, X.; Zhou, T.; Zhao, W.; Wei, H. The Observed Impacts of Wind Farms on Local Vegetation Growth in Northern China. Remote Sens. 2017, 9, 332. [Google Scholar] [CrossRef]
  66. Qin, Y.; Li, Y.; Xu, R.; Chengcheng, H.; Armstrong, A.; Bach, E.; Wang, Y.; Fu, B. Impacts of 319 wind farms on surface temperature and vegetation in the United States. Environ. Res. Lett. 2022, 17, 024026. [Google Scholar] [CrossRef]
  67. Morales, C.L.; Traveset, A. Interspecific Pollen Transfer: Magnitude, Prevalence and Consequences for Plant Fitness. Crit. Rev. Plant Sci. 2008, 27, 221–238. [Google Scholar] [CrossRef]
  68. Bijlsma; Bundgaard; Putten, V. Environmental dependence of inbreeding depression and purging in Drosophila melanogaster. J. Evol. Biol. 1999, 12, 1125–1137. [Google Scholar] [CrossRef]
  69. Keller, L.; Waller, D. Keller LF, Waller DM. 2002. Inbreeding effects in wild populations. Trends Ecol. Evol. 2002, 17, 230–241. [Google Scholar] [CrossRef]
  70. Descamps, C.; Boubnan, N.; Jacquemart, A.-L.; Quinet, M. Growing and flowering in a changing climate: Effects of higher temperatures and drought stress on the bee-pollinated species Impatiens glandulifera royle. Plants 2021, 10, 988. [Google Scholar] [CrossRef]
  71. Passioura, J.B. Drought and drought tolerance. Plant Growth Regul. 1996, 20, 79–83. [Google Scholar] [CrossRef]
  72. Arathi, H.; Smith, T. Drought and temperature stresses impact pollen production and autonomous selfing in a California wildflower, Collinsia heterophylla. Ecol. Evol. 2023, 13, e10324. [Google Scholar] [CrossRef]
  73. Liu, K.-W.; Liu, Z.-J.; Huang, L.; Li, L.-Q.; Chen, L.-J.; Tang, G.-D. Self-fertilization strategy in an orchid. Nature 2006, 441, 945–946. [Google Scholar] [CrossRef]
  74. Young, L.W.; Wilen, R.W.; Bonham-Smith, P.C. High temperature stress of Brassica napus during flowering reduces micro-and megagametophyte fertility, induces fruit abortion, and disrupts seed production. J. Exp. Bot. 2004, 55, 485–495. [Google Scholar] [CrossRef]
  75. Cook, B.I.; Seager, R.; Williams, A.P.; Puma, M.J.; McDermid, S.; Kelley, M.; Nazarenko, L. Climate change amplification of natural drought variability: The historic mid-twentieth-century North American drought in a warmer world. J. Clim. 2019, 32, 5417–5436. [Google Scholar] [CrossRef]
  76. Stoddard, F.L. Climate change can affect crop pollination in unexpected ways. J. Exp. Bot. 2017, 68, 1819–1821. [Google Scholar] [CrossRef]
  77. Gagliano, M. Green symphonies: A call for studies on acoustic communication in plants. Behav. Ecol. 2013, 24, 789–796. [Google Scholar] [CrossRef] [PubMed]
  78. Appel, H.M.; Cocroft, R.B. Plants respond to leaf vibrations caused by insect herbivore chewing. Oecologia 2014, 175, 1257–1266. [Google Scholar] [CrossRef] [PubMed]
  79. Topić, J.; Stančić, Z. Extinction of fen and bog plants and their habitats in Croatia. Biodivers. Conserv. 2006, 15, 3371–3381. [Google Scholar] [CrossRef]
  80. Walker, K.J.; Preston, C.D. Ecological predictors of extinction risk in the flora of lowland England, UK. Biodivers. Conserv. 2006, 15, 1913–1942. [Google Scholar] [CrossRef]
  81. de Jong, J.; Millon, L.; Håstad, O.; Victorsson, J. Activity pattern and correlation between bat and insect abundance at wind turbines in South Sweden. Animals 2021, 11, 3269. [Google Scholar] [CrossRef]
  82. Chapman, J.; Reynolds, D.; Smith, A. Migratory and foraging movements in beneficial insects: A review of radar monitoring and tracking methods. Int. J. Pest Manag. 2004, 50, 225–232. [Google Scholar] [CrossRef]
  83. Cheptou, P.-O. Does the evolution of self-fertilization rescue populations or increase the risk of extinction? Ann. Bot. 2018, 123, 337–345. [Google Scholar] [CrossRef]
  84. Acoca-Pidolle, S.; Gauthier, P.; Devresse, L.; Deverge Merdrignac, A.; Pons, V.; Cheptou, P.O. Ongoing convergent evolution of a selfing syndrome threatens plant-pollinator interactions. New Phytol. 2023, 242, 717–726. [Google Scholar] [CrossRef]
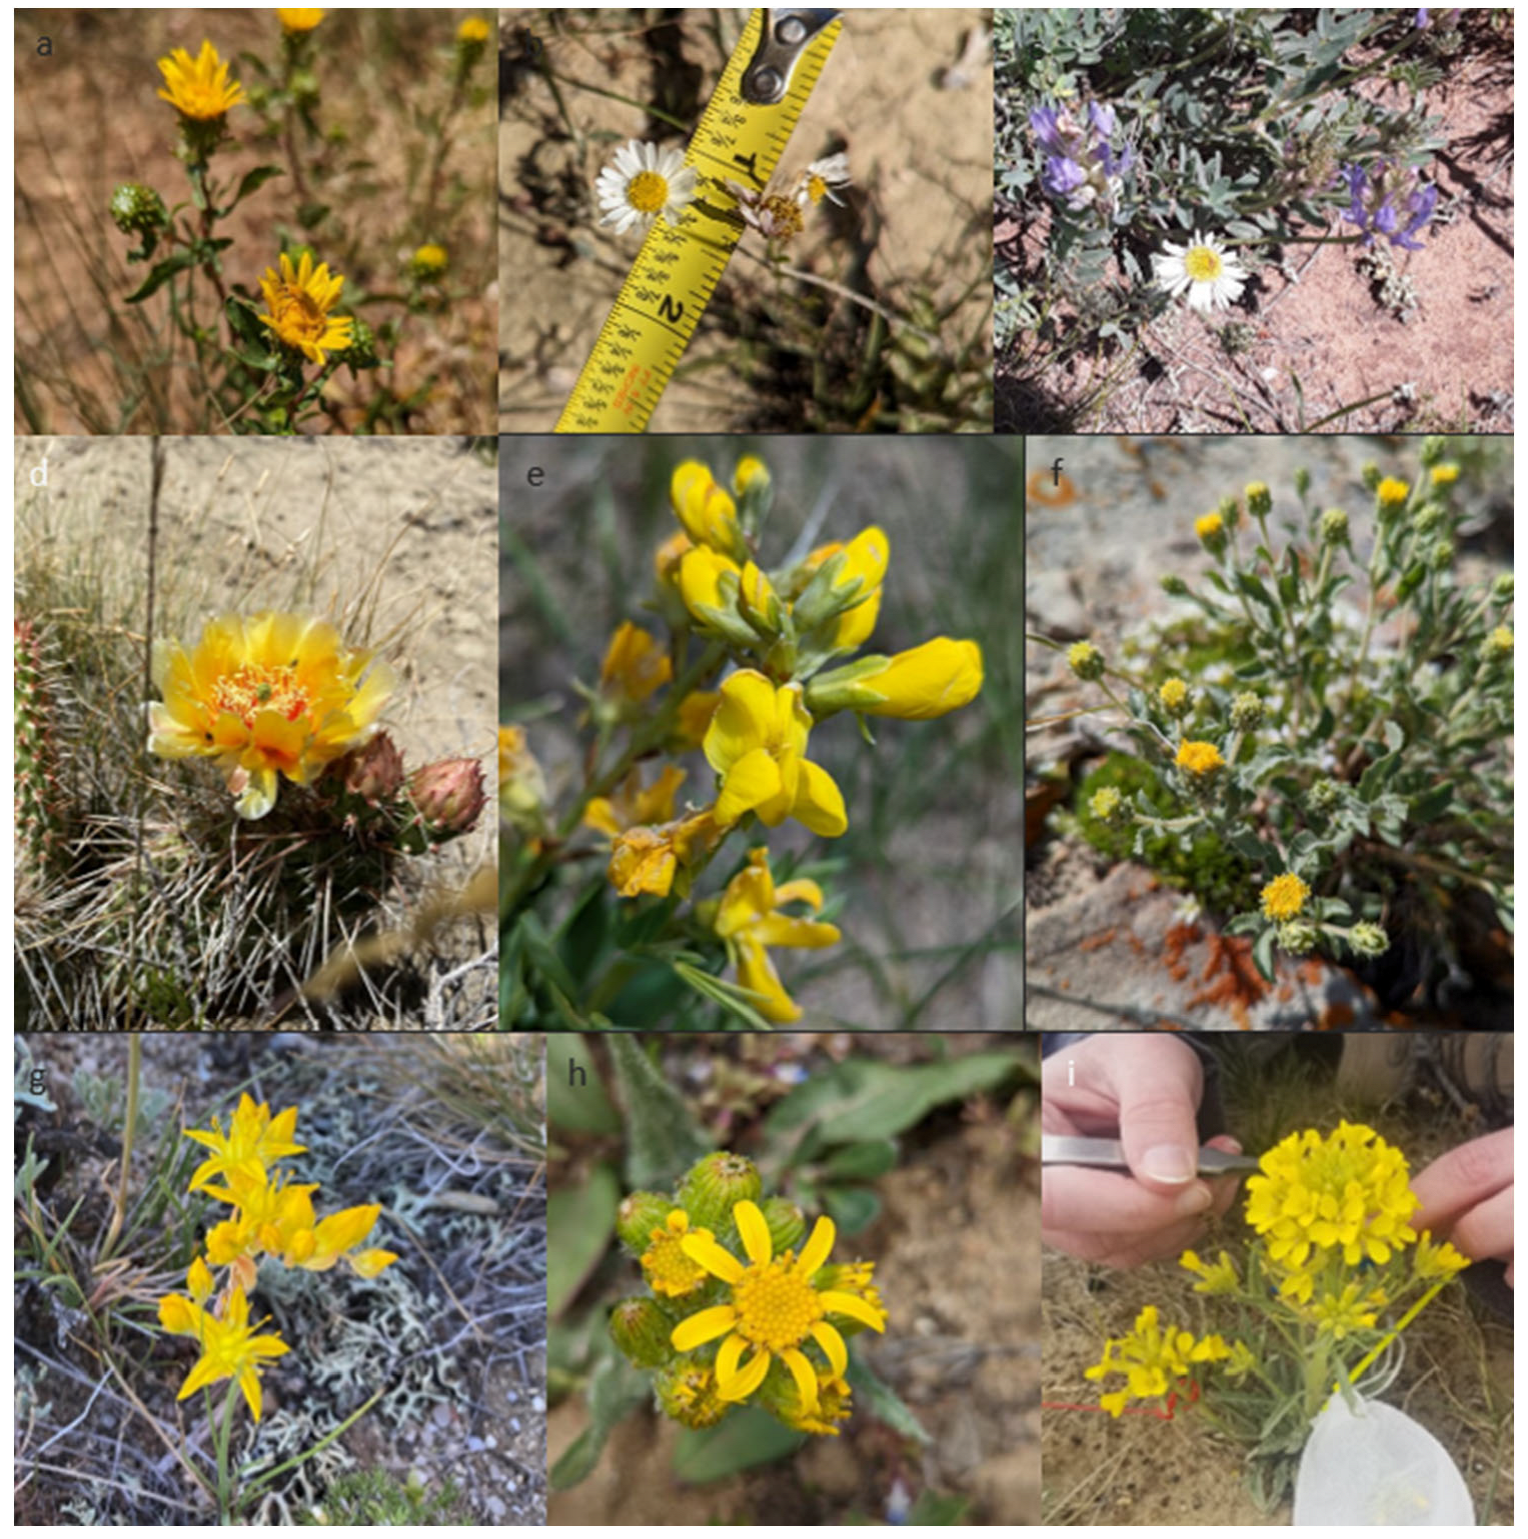
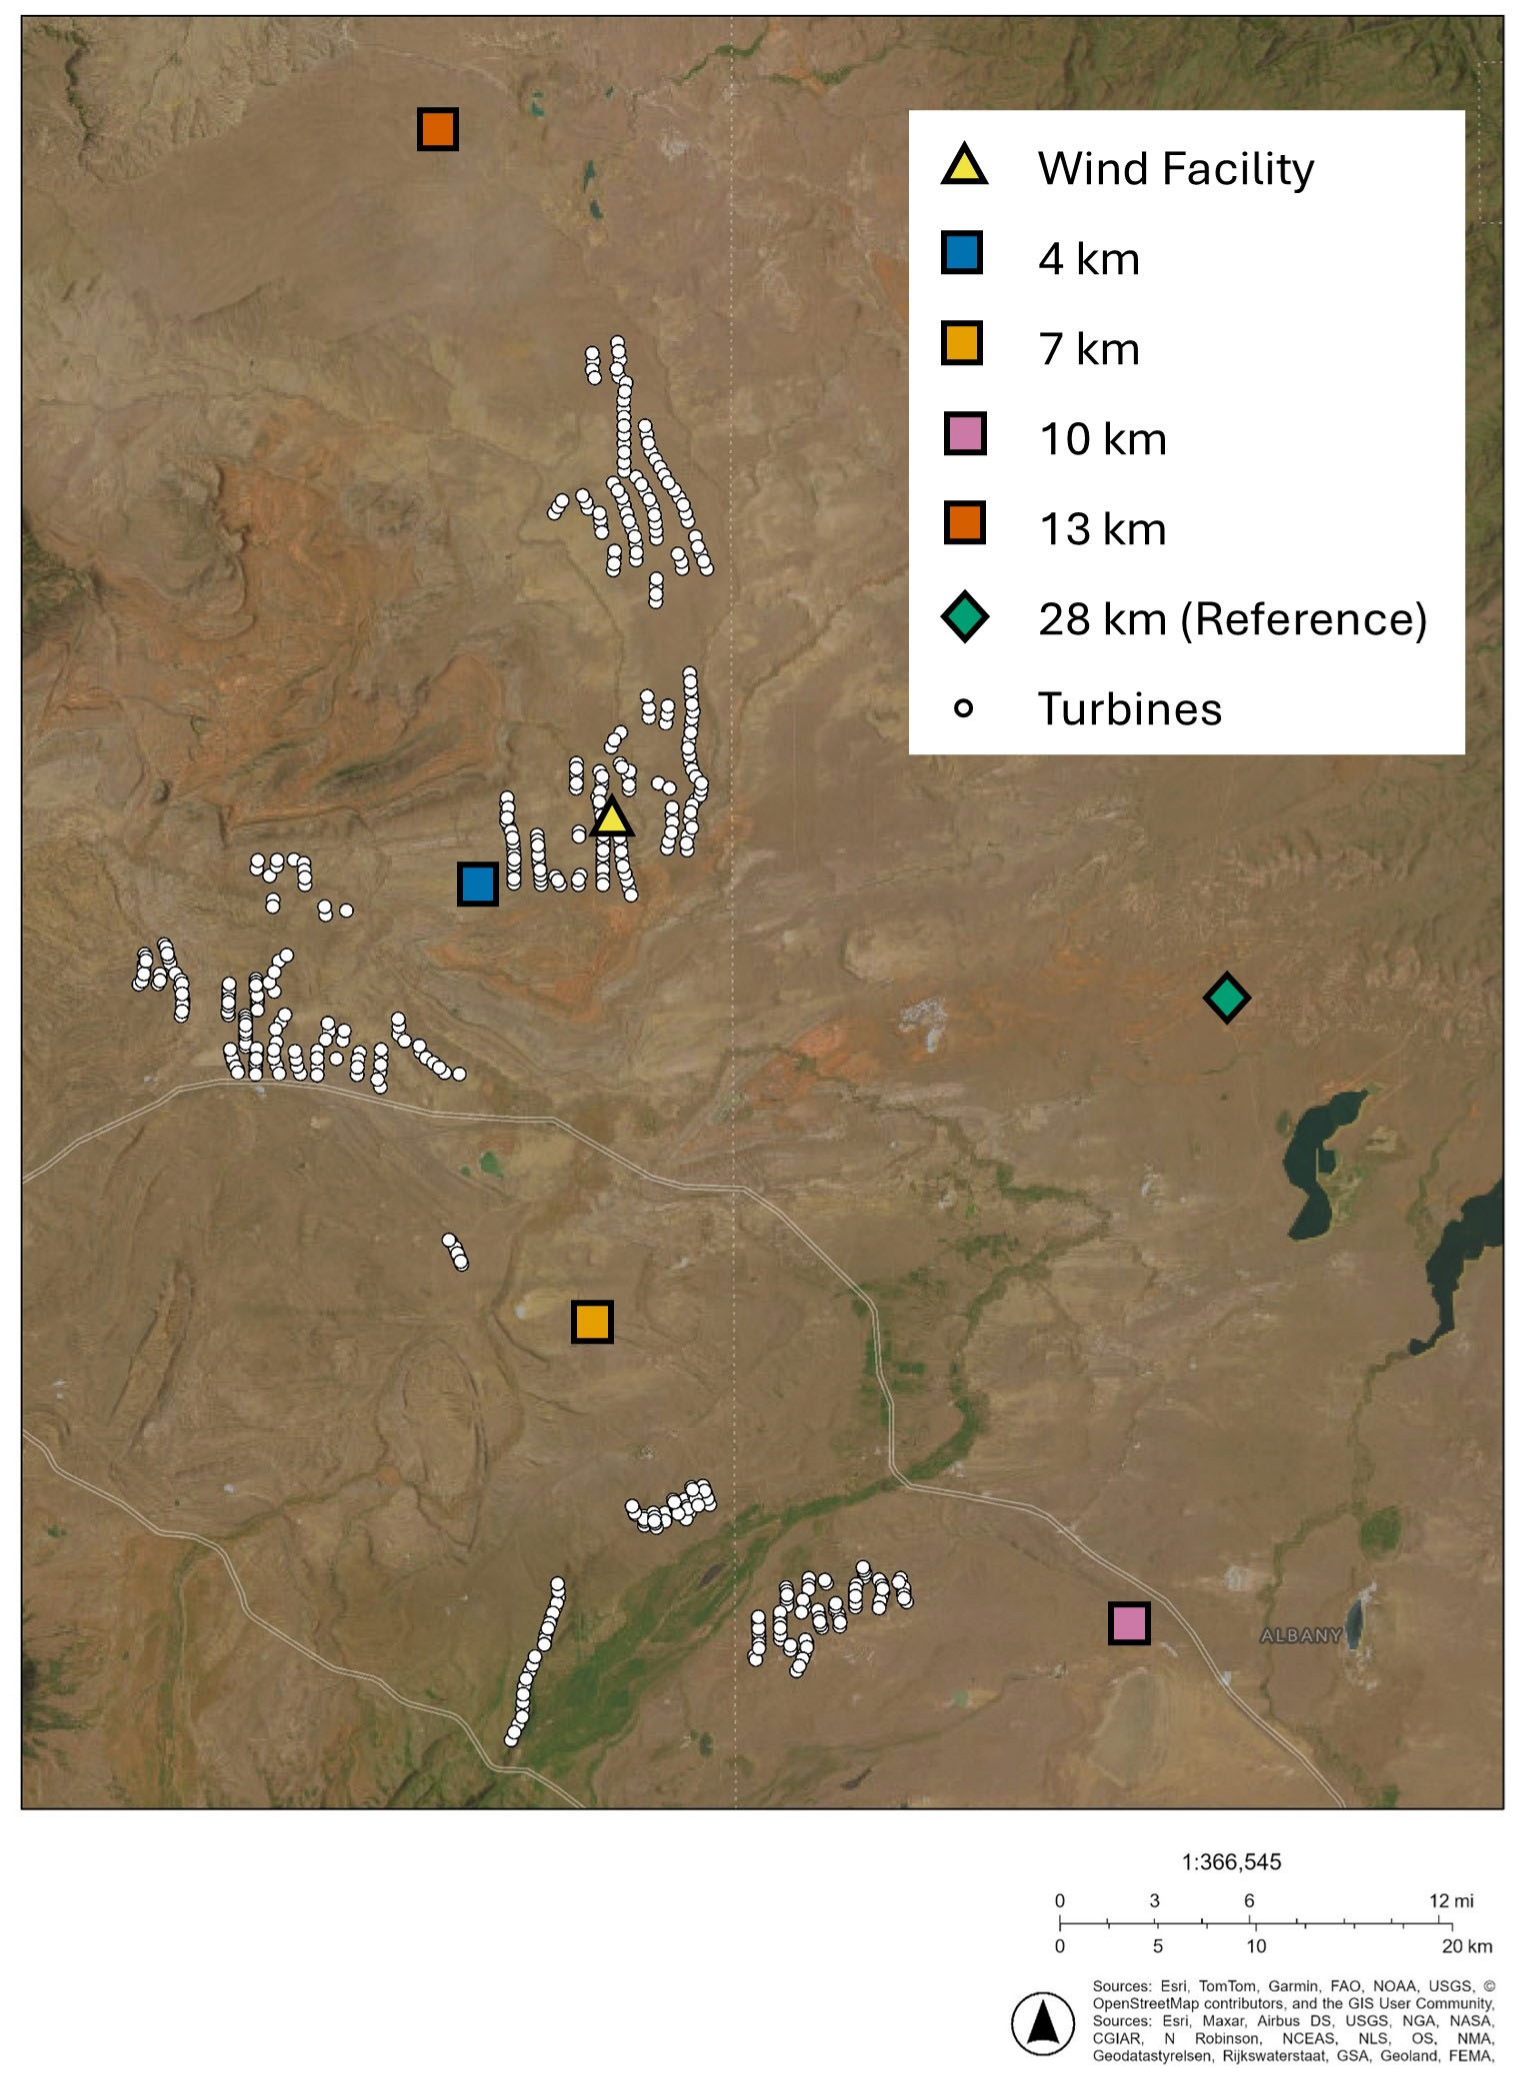
Figure 1. Photos of (a) Curlycup Gumweed, (b) Fleabane, (c) Milkvetch (violet flower), (d) Plains Pricklypear, (e) Prairie Thermopsis, (f) Rayless Tansy-aster, (g) Stonecrop, (h) Tall Western Groundsel, and (i) Western Wallflower. See Table 1 for scientific names.
Wind 05 00015 g001
Figure 2. Locations of six sampling sites in southeastern Wyoming, U.S. The distances in the legend indicate how far each site was from the closest operating turbine. Turbine location data were provided by the US Wind Turbine Database. The basemap was accessed on 8 June 2025. Basemap source: Esri. The data for the basemap were provided by Esri, TomTom, Garmin, SafeGraph, FAO, METI/NASA, USGS, Bureau of Land Management, EPA, NPS, and USFWS.
Wind 05 00015 g002
Figure 3. The proportion of developed seeds was lowest in the bagged treatment (B), where pollinators could not access flowers, suggesting that a low proportion of seeds could be produced through self-pollination. None of the plants were pollen-limited, as evidenced by the lack of difference between the open (O; pollinated by local insects) and hand-pollinated treatments (H; excess pollen added). The bold line is the median, the black circle is the mean, the lower and upper limits of the box are the 25th and 75th percentiles, the whiskers are the minimum and maximum values, excluding outliers, and the open circles are outlier values. See Table 2 for statistical differences.
Wind 05 00015 g003
Figure 4. The proportion of developed seeds (a,c) and the proportion of maximum seed mass ((b,d) mean seed mass/maximum seed mass for a species) generally decreased with distance from an active wind facility. The data for all seed-set treatments (bagged, open-, and hand-pollinated) are shown in (a,b), and the results from the bagged treatment are shown in (c,d). Points represent the value for each treatment by plant and each color of line connect a plant species measured at two sites. The error around the lines represents 95% confidence intervals.
Wind 05 00015 g004
Figure 5. The proportion of maximum seed mass (mean seed mass/maximum seed mass) was lowest in the bagged treatment (B), where pollinators could not access flowers, suggesting that a low proportion of seeds could be produced through self-pollination. None of the plants were pollen-limited, as evidenced by the lack of difference between the open- (O; pollinated by local insects) and hand-pollinated treatments (H; excess pollen added). The bold line is the median, the black circle is the mean, the lower and upper limits of the box are the 25th and 75th percentiles, the whiskers are the minimum and maximum values, excluding outliers, and the open circles are outlier values.
Wind 05 00015 g005
Figure 6. (a,b) The abundance of insects captured in vane traps, (c,d) the bees along the target-netting transects, and (e,f) the butterflies along the walking transects. (a) Insect and (c) bee abundances decreased with distance from turbines, excluding the reference site at 28 km, but butterfly abundance did not differ. (b) Insect abundance in the vane traps was lowest within the wind facility, but (d) bee and (f) butterfly abundances were highest within the wind farm compared to the sites that 4–13 km away that had decreasing infrasound. The reference site was 28 km from the nearest turbine and likely had minimal infrasound. Each point (a,c,e) represent a sampling date and the line is the slope of the linear regression. The points in boxplots are the mean, the bold line is the median, the lower and upper edges of the box are the 25th and 75th percentiles, and whiskers represent the minimum and maximum values excluding outliers.
Wind 05 00015 g006
Figure 7. Non-metric multidimensional scaling analysis indicated that there was overlap in the pollinator assemblages at different distances from the turbines, and the wind facility itself had a rather unique assemblage (a). Analysis of similarity showed that the wind facility had the highest dissimilarity rank, and the site farthest away had the lowest rank (b). The bold line is the median, the lower and upper limits of the box are the 25th and 75th percentiles, and the whiskers are the minimum and maximum values, excluding outliers.
Wind 05 00015 g007
Figure 8. The proportions of bees with short, medium, and long tongue lengths at varying distances from the operating turbines (a). The richness of insect-pollinated flowers varied among the sites, as did the accessibility of nectar (b).
Wind 05 00015 g008
Table 1. The distances to the nearest turbine, the site names, and the common and scientific names of the plants for which seed set was measured at each site.
Distance to Nearest TurbineScientific NameCommon Name
Wind facilityOpuntia polycantha
Erysimum capitatum
Plains Pricklypear
Western Wallflower
4 kmXanthisma grindeloides
Thermopsis rhombifolia
Rayless Tansy-aster
Prairie Thermopsis
7 kmOpuntia polycantha
Erysimum capitatum
Plains Pricklypear
Western Wallflower
11 kmXanthisma grindeloides
Senecio integerrimus
Rayless Tansy-aster
Tall Western Groundsel
13 kmErigeron
Sedum
Fleabane
Stonecrop
28 kmGrindelia squarrosa
Erigeron
Astragalus
Curlycup gumweed
Fleabane
Milkvetch
Table 2. We measured the seed set for nine plant species at six locations. Seed set was measured at one location for most species, except for four species that were measured at two locations. We estimated the differences in the proportion of developed seeds and the proportion of maximum seed mass in the bagged (B; self-pollinated), open- (O; pollinated by local insects), and hand-pollinated treatment (H; excess pollen applied by hand). Differences among the treatments were calculated using the emmeans package. We estimated the differences between the sites for the plants measured at two sites.
PlantsTreatmentSite
z-ValueB vs. HB vs. OH vs. Oz-Valuep-Value
Proportion of developed seeds
Curlycup Gumweed8.2–8.7<0.0001<0.00010.84
Fleabane6.9–8.2<0.0001<0.00010.771.90.07
Milkvetch0.75–0.950.610.740.96
Plains Pricklypear3.6–5.1<0.0001<0.00010.162.40.015
Prairie Thermopsis3.0–3.30.0070.0030.96
Rayless Tansy-aster7.7–11.0<0.0001<0.00010.420.630.53
Stonecrop3.3–3.50.0020.0020.99
Tall Western Groundsel14.8–15.8<0.0001<0.00010.20
Western Wallflower3.1–3.30.0030.0050.932.20.03
Proportion of maximum seed mass
Curlycup Gumweed5.5–6.2<0.0001<0.00010.76
Fleabane4.4–5.1<0.0001<0.00010.800.930.36
Milkvetch1.0–1.80.520.180.86
Plains Pricklypear1.0–2.10.080.560.430.830.41
Prairie Thermopsis4.2–4.30.00010.00010.94
Rayless Tansy-aster3.1–5.80.0004<0.00010.503.50.003
Stonecrop2.5–3.20.0040.030.68
Tall Western Groundsel4.2–4.80.00070.00020.98
Western Wallflower1.9–2.20.080.130.941.10.26
Disclaimer/Publisher’s Note: The statements, opinions and data contained in all publications are solely those of the individual author(s) and contributor(s) and not of MDPI and/or the editor(s). MDPI and/or the editor(s) disclaim responsibility for any injury to people or property resulting from any ideas, methods, instructions or products referred to in the content.

