Review

The Potential of Utility-Scale Hybrid Wind–Solar PV Power Plant Deployment: From the Data to the Results

by
Luis Arribas
1,*,
Javier Domínguez
1,
Michael Borsato
2,
Ana M. Martín
1,
Jorge Navarro
1,
Elena García Bustamante
1,
Luis F. Zarzalejo
1 and
Ignacio Cruz
1
1
Energy Department, Centro de Investigaciones Energéticas, 28040 Madrid, Spain
2
Department of Industrial Engineering, Padua University, 35128 Padua, Italy
*
Author to whom correspondence should be addressed.
Submission received: 28 March 2025 / Revised: 9 June 2025 / Accepted: 17 June 2025 / Published: 7 July 2025
(This article belongs to the Topic Solar and Wind Power and Energy Forecasting, 2nd Edition)

Abstract

The deployment of utility-scale hybrid wind–solar PV power plants is gaining global attention due to their enhanced performance in power systems with high renewable energy penetration. To assess their potential, accurate estimations must be derived from the available data, addressing key challenges such as (1) the spatial and temporal resolution requirements, particularly for renewable resource characterization; (2) energy balances aligned with various business models; (3) regulatory constraints (environmental, technical, etc.); and (4) the cost dependencies of the different components and system characteristics. When conducting such analyses at the regional or national scale, a trade-off must be achieved to balance accuracy with computational efficiency. This study reviews existing experiences in hybrid plant deployment, with a focus on Spain, identifying the lack of national-scale product cost models for HPPs as the main gap and establishing a replicable methodology for hybrid plant mapping. A simplified example is shown using this methodology for a country-level analysis.

1. Introduction

The development of renewable energy generation in Europe is clearly outlined [1]: “The revised Renewable Energy Directive (RED) sets a binding target for renewable energy of 42.5% of the EU’s gross final energy consumption, with the aspiration to reach 45% by 2030. This requires doubling the EU’s renewable energy share by 2030 in the energy mix compared to the 2022 level of 23%, and a sharp increase of the share of renewable energy sources (RESs) in the electricity mix. As a result, between 2020 and 2030, the installed wind and solar power generation capacity is also projected to double, to 510 GW and 592 GW, respectively.”
At the European level, in response to the energy market disruption caused by the Russia–Ukraine War, the European Commission launched the REPowerEU Plan. Under this initiative, Spain updated its recovery and resilience plan (RRP), funded by the NextGenerationEU program, to include new measures aimed at energy savings and supply diversification [2].
Within Spain’s RRP, Component 17 specifically focuses on infrastructure improvements, including the enhancement of the R&D&I capacities for hybrid renewable technologies. A key objective of this project is to identify Spain’s national hybridization potential [3].
This research is being conducted within this framework, with the primary goal of developing a map that identifies the potential for utility-scale hybridization in Spain. The mapping process consists of three stages: the first involved analyzing the necessary data and available data sources, as described in [4]. The second stage, covered in this paper, focuses on reviewing the calculations needed to derive meaningful results from the identified data. The final stage will involve the creation of a map of the definitive hybridization potential and will be addressed in future work.
Since this paper describes the second stage of the mapping process, its motivation aligns with that of the first stage, as detailed in [4]. However, the significance of this research has grown beyond its initial project-based interest. The increasing focus on suitable areas for renewable energy deployment in Europe has led to the introduction of a new concept: particularly suitable areas, known as ‘renewables acceleration areas’ (RAAs) [5]. These areas balance economic feasibility with societal and environmental considerations while complying with other legislative frameworks. The hybridization of renewable projects and the multi-functional use of land and sea—such as combining electricity production with other activities—are considered effective strategies for reducing land use conflicts, mitigating grid-related constraints, and increasing public acceptance.
The revised EU directives emphasize the importance of comprehensive mapping and spatial planning for renewable energy projects, introducing new obligations for member states:
  • Article 15b mandates that member states translate their national contributions toward the revised EU renewable energy targets into spatially defined areas required for renewable projects. This mapping must be completed by 21 May 2025, using digital tools such as Geographic Information System (GIS) technology [1].
  • Article 15c requires member states to designate specific areas as RAAs, building upon the initial mapping under Article 15b. At least one renewable energy technology must be prioritized in each country [1].
  • Member states must incorporate the latest available data and align their planning with evolving scientific knowledge, technological advancements, environmental concerns, and local community needs [6].
This research aligns with these directives, further reinforcing its relevance and increasing the significance of its outcome.
The review of the current research in this field will primarily focus on activities in Spain, given their direct relevance to this study. However, significant international initiatives will also be briefly examined. The focus will be placed on suitability and economic feasibility mapping for hybrid power plants (HPPs), rather than just on their solar and wind potential. The aim of this review is that any research group working on mapping HPPs may benefit from this knowledge when facing the same steps in the elaboration of the map. The value and novelty of this work stem from the fact that the information included in this review is what we would have liked to have in our mapping of HPPs.
Before delving into the specifics of these activities, it is useful to outline the different levels of potential exploitation for HPPs. Understanding these levels will facilitate the classification of existing studies. The potential of a renewable energy resource at a given site or area can be assessed at four levels [7,8]:
(a)
Resource potential: For solar PV generation, the irradiance and other relevant parameters such as temperature; for wind generation, the wind speed and other relevant environment parameters such as obstacles and roughness.
(b)
Technical potential: This considers the available suitable surface area, system performance, and sustainability criteria where applicable.
(c)
Economic potential: Accounts for technology costs and avoided supply costs.
(d)
Market potential: Evaluates deployment feasibility in the context of competition with other energy sources, regulatory policies, permitting processes, incentives, and socio-cultural factors.
These four levels represent a progressive refinement of the analysis, with market potential assessments encompassing economic potential, which in turn includes technical potential, which itself builds upon resource potential.
The following sections provide an overview of the renewable hybridization activities in Spain (Section 2) and internationally (Section 3). Section 4 presents an update on the available data sources and reviews various tools for HPP design. Finally, Section 5 highlights a simplified application for mapping the hybridization potential in Spain, incorporating suitability and profitability analyses for selected areas.

2. Activities in Spain

For the description of the activities in Spain, the categories used in energy system planning analyses, as described in [4], will be followed. These four categories were proposed by the International Renewable Energy Agency (IRENA): generation expansion planning (Long-Term Energy Scenarios, LTESs); geo-spatial planning; dispatch planning (production cost models); and technical network studies (subdivided into static and dynamic grid models) [9].

2.1. Long-Term Energy Scenarios (LTESs)

In electricity planning, a distinction is made between binding planning, which refers to the development of transmission networks, and indicative planning, which establishes possible demand evolution scenarios and the target generation capacity in terms of electricity generation and supply [10]. Indicative planning is fully reflected in the National Energy and Climate Plans (NECPs) of EU member states. NECPs define the CO2 targets, policies, and actions of EU countries as their contributions to the EU’s climate and energy objectives, often with little (if any) coordination between them during their definition [11]. These plans are examples of LTES analyses.
Some pioneering studies have been conducted for Spain [12], but it was not until the development of the Spanish 2019 NECP that several studies emerged in parallel. These studies shared common characteristics, such as forecasting the technology mix for the 2030 and 2050 horizons; falling under the LTES category; assessing technical potential; and being scenario-based, with the results depending on the specific model used.
Despite their relatively simple calculations, these studies yield different results due to varying assumptions and parameter values. For example, Table 1 compares the projected wind and solar PV generation capacities for 2030 from different analyses using the national spatial resolution and a multi-year time resolution.
Another common characteristic of all of these studies is the so-called “single-node hypothesis, which neglects the relevance of spatial resolution by assuming infinite capacity of the transmission network.” [11].
Although these energy system planning tools can be used for the preliminary design of the HPPs, they have some major limitations. For example, the operational aspects, physical and electrical infrastructure design, and interactions between the technologies are not usually included [21]. However, some attempts [22,23,24] have been made within this LTES category to work with higher temporal (hour-level) and spatial resolutions. In particular, some works [11,25] have advanced towards the allocation of wind and solar PV capacities in Spain, based on the PyPSA tool (one of the most popular Python-based, v2.7, open-source toolboxes for the simulation and optimization of modern power systems [26]), which considers the physical and electrical infrastructure design and interactions between the technologies at a regional level, searching for the trade-off between generation and decarbonization. They open the door in the direction of transforming the LTES category into more detailed analyses, as the availability of high-resolution data and computational resources becomes higher.

2.2. Geo-Spatial Planning

A GIS and associated modeling approaches offer the potential to spatially outline areas that are suitable for the deployment of renewable energy plants, using a wide range of physical, technical, legal, economic, and social criteria, including those related to energy demand and infrastructure availability. Spatial decision support systems also offer the opportunity to compare various scenarios and criteria weightings [27].
Previous studies in the literature have employed GIS-based approaches for both the evaluation of suitable locations for PV, wind, and hybrid systems [28,29,30,31] and for solar and wind resource evaluations [32,33]. In particular, GIS data can be employed as the inputs to different multi-criteria decision-making (MCDM) approaches. GIS applications enable georeferenced data storage, management, and visualization, along with calculations and analysis using data from different sources, such as databases, spatial data infrastructures with open data, and national or international institutions. Therefore, combinations of GIS and MCDM approaches result in valuable methods for the assessment of suitable locations for hybrid plants.
In Spain, several multi-criteria GIS-based approaches to integrating solar PV, wind, and biomass have been proposed. One case is the province of Málaga, an area with a high energy demand for residential and tourist use, where these types of generation plants both individually and in combination have also been analyzed. Additionally, they included a cluster evaluation of the distribution of land availability for this type of installation in all municipalities of the province [34]. For the province of Jaén, its integration with existing local power plants and the electric grid was considered. They combined the environmental, technical, and geographical factors with economic and social acceptability attributes [35].
In this levelized cost of energy (LCOE) calculation approach, the Intigis model estimates the equivalent cost of electrification to compare various energy systems. The application incorporates both renewable and conventional technologies, as well as the possibility of hybridizing them. It focuses on isolated systems and rural electrification, providing a comparative analysis of microgrid implementation versus home system installations. The model has been applied extensively in Latin America, Africa, and Europe, evolving to emphasize load clustering and the use of open-source software in its current development [36].
The main efforts within the geo-spatial planning category have been made in two disciplines in relation to HPP deployment in Spain: the complementarity of resources and environmental zoning.
-
Complementarity between wind and solar resources has been identified as one of the main issues for the deployment of HPPs. Even though some studies have been made of off-shore applications [37], most initiatives are related to the peninsular territory in Spain. Of all of them, two open-source applications are outlined here:
CLIMAX [38]: This uses a monthly series of the wind and solar (photovoltaic) power potential (or capacity factors). The data were retrieved from the ERA5 reanalysis with a spatial resolution of 0.25° (~30 km) [39].
SOWISP [40]: “the SOlar and Wind Installed Spanish Power (SOWISP) database. SOWISP provides the actual installed capacity of wind and photovoltaic solar energy in each Spanish town, with a monthly resolution, and covering the period of 2015–2020. In addition, a Python package (available on GitHub) was developed for managing this database”. Two applications have been derived from the SOWISP tool:
RetroDB, an enhanced database of Spain’s wind energy resources, which provides high-spatial- and -temporal-resolution estimates of both wind speed and wind energy CFs, spanning several decades [41].
SHIRENDA_PV, an enhanced open-access database of Spain’s solar PV energy resources. This database consists of the hourly values for the solar PV capacity factors for the Spanish NUTS 3 regions covering the period of 1990–2020 [42]
-
Environmental zoning for the implementation of renewable energies [43]. The Ministry for Ecological Transition and the Demographic Challenge has developed a tool for identifying the areas of the national territory that present the greatest environmental conditioning factors for the implementation of these projects through a territorial model that groups the main environmental factors, resulting in zoning of the environmental sensitivity of the territory. The environmental zoning tool for renewable energies consists of two layers of information (one for wind energy and the other for solar PV energy) that show the value of the environmental sensitivity index existing at each point on the map and the environmental indicators associated with that point.

2.3. Product Cost Models

These models are commonly used for the analysis and design of individual HPPs, but it is not so common to find them for mapping of the potential of these installations in wider areas, with only a few studies exploring the techno-economic potential of retrofitting existing wind power plants into PV–wind HPPs [44]. The reason for this is twofold: firstly, the common unavailability of the necessary data to perform such an analysis and, secondly, the computational requirements when covering national or even regional areas.
No activity has been identified in this category in Spain for HPPs. So, this gap is identified as the main target of the proposed map for evaluating the potential of HPPs in Spain, including the point of view of the interests of the promoter of the plant. The latest auctions with no interested promoters, even in the field of off-shore wind farms in Denmark [45], show that planning must take into account not only the environmental and physical viability of the plants but also the interest of developers and financers, which is related to renewable resources and existing infrastructure but also to the market and the functioning and stability of the regulations.
In Section 4, a review will be made of the existing product cost models for HPPs.

2.4. Technical Network Studies

As mentioned previously, a distinction is made in electricity planning between binding planning and indicative planning. Indicative planning was described in Section 2.1, whereas binding planning is carried out by the Transmission System Operator (TSO), Red Eléctrica de España (REE) in the case of Spain [46]. The aim of binding planning is to design transmission networks to fulfill the desired requirements expressed in [10]. Therefore, it is out of the scope of the initiative proposed in this paper. However, there is one particular task in this binding planning that is of great interest to this review, due to its similarity to the approach of the proposed initiative: the estimation of the location of new renewable generation defined in the NCEP, establishing hypothetical locations for future renewable generation facilities—mainly wind and solar PV generation facilities. Traditionally, connection requests were used to make this estimation, but the volume of both the access requests and proposals for the connection of renewable generation greatly exceeds the goal in the 2026 horizon in Spain. Therefore, a methodology has been developed for this estimation.
This methodology is inspired by the guiding principles of maximization of renewable production, evacuation of renewables based on resources, compatibility with resource-based renewables, compatibility with environmental constraints, maximizing the use of the existing grid, and compliance with the principles of efficiency and economic sustainability.
The established methodology consists of the following four steps:
-
Analysis and ascertainment of the geographical distribution of the resource. For solar resources, historical series of the actual production of solar PV generators currently in service have been used. For wind resources, the data came from IDAE’s wind atlas. However, this atlas is no longer available, and the website for the atlas redirects either to the New European Wind Atlas (NEWA) [47] (and the derived platform for Iberia [48]) or to the Global Wind Atlas (GWA) [49], which are within the sources covered in [4]. In both cases, the annual number of equivalent hours of production has been chosen for use an indicator that is independent of the size of the installation and standardized.
-
Analysis and ascertainment of the geographical distribution of the ease/difficulty of carrying out the processing, considering the absence of environmental restrictions and conditioning factors for the implementation of solar PV or wind power plants. This step is based on the study [50], which is conceived as a tool to help in the decision-making process for the location of this energy infrastructure.
-
Analysis and ascertainment of the geographic distribution of the probability of success of the construction of solar PV or wind power plants based on the resource distribution, production efficiency, and ease of processing. A synthetic indicator has been developed by combining previous indicators of the production capacity (resource and efficiency) and the ease of environmental processing (zoning map), which is an indicator of the probability of success when located in a given area.
-
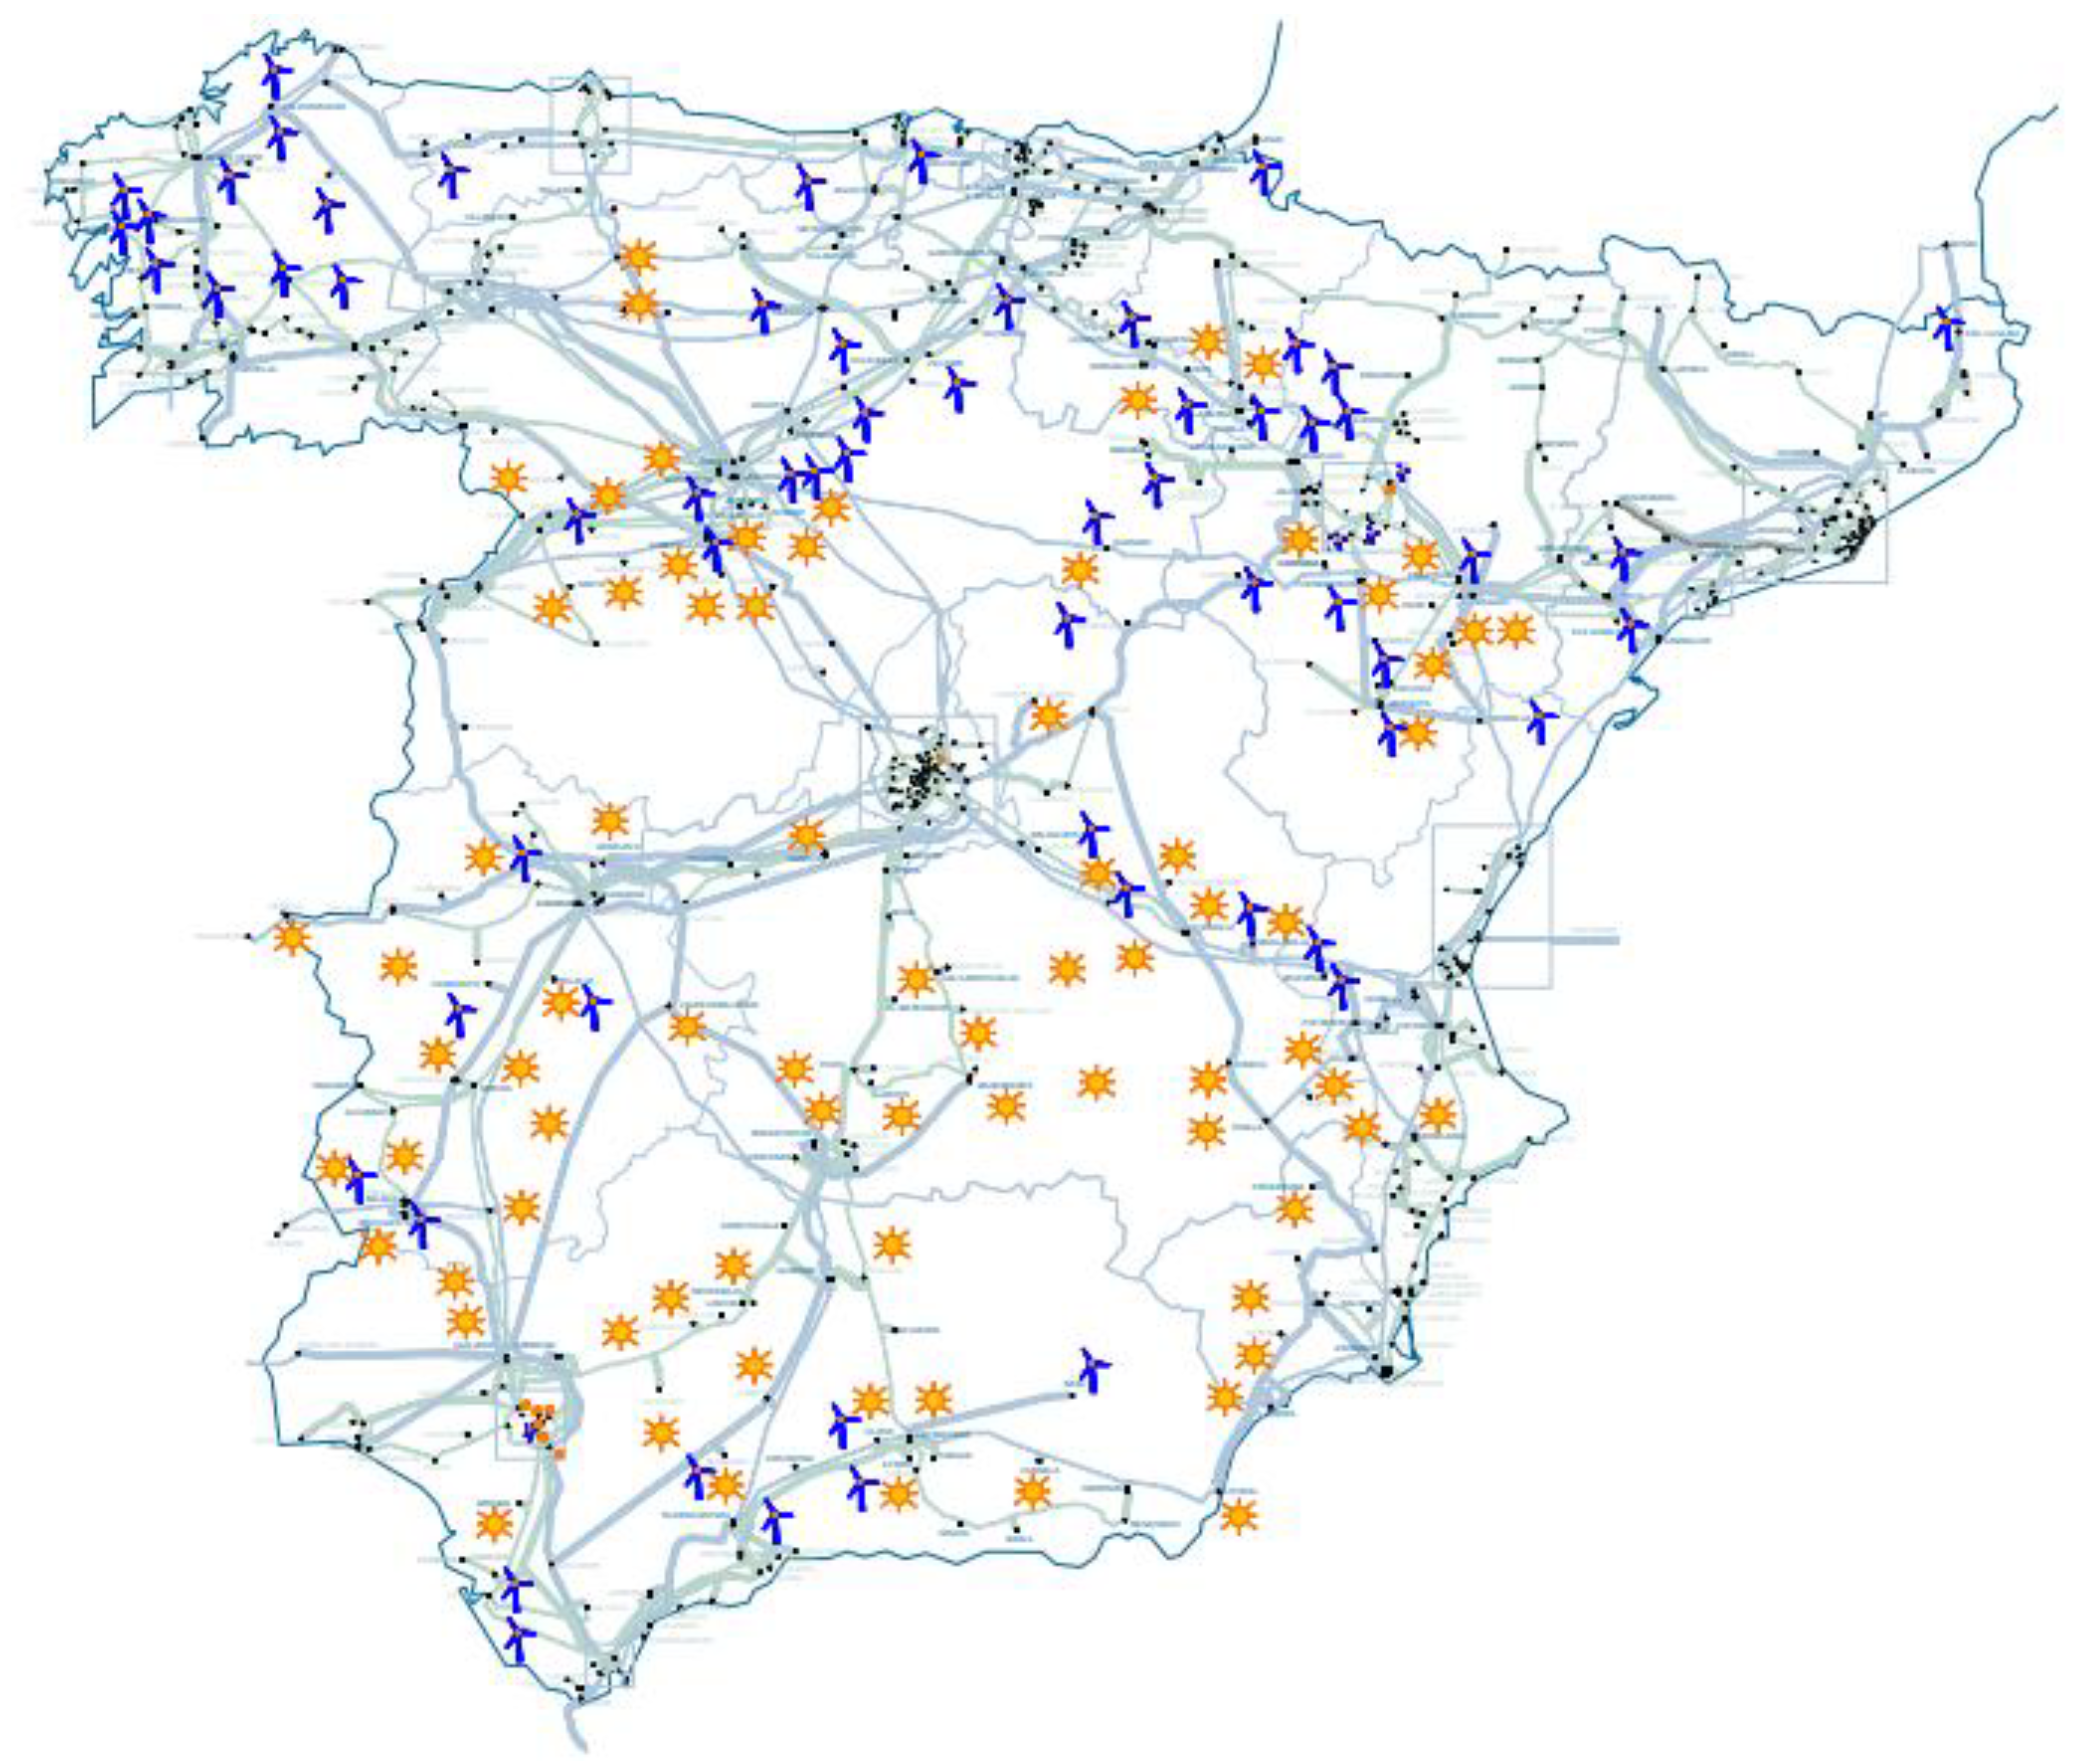
Allocation by node of the new renewable capacity in the 2026 study scenario: estimation of the best requested locations (requests for access to the transmission grid, both those granted and those denied and proposed within the planning process) based on the probability of success and weighted by the weight of the intentions of the promoters in each autonomous community. Figure 1 shows the graphical result of the overall process.
The technology and aim of the study by the TSO (estimation of the location of wind and solar PV generation) are different from the technology and aim of this paper (establishing the potential of HPPs). However, it has been described in more detail as it is considered to have many points in common with this paper’s scope, such as the four steps of the methodology. Hence, the indicator in the third step will differ in both approaches (in the REE study, the indicator was strongly based on the ease of connecting to the grid, whereas in the proposed study, the financial viability of the investment is the chosen criterion), but the methodology will be very similar.

2.5. Conclusions on the Activities in Spain

A review of the activities related to the mapping of HPPs in Spain has been given following the four categories: LTESs, geo-spatial planning, product cost models, and technical network studies. In general, the review shows that there is important activity concerning the mapping of HPPs in Spain. In particular, LTES models are particularly numerous, although none of them address the mapping of HPPs directly. Some GIS tools have been identified that are directly involved in HPP mapping, but no product cost model has been found for use at the national or even the regional level. Finally, the Spanish TSO is engaged in an interesting task: estimation of the location of new renewable generation defined in the NCEP. This is not the same approach as that in this review, but it has some attractive similarities. A summary of the main characteristics of these activities can be found in Table 2, which also includes the characteristics desired for the proposed map. The proposed map aims to contribute to filling the gap in the product cost category detected in this review, somehow covering the estimation of the four types of potential for HPPs, with an hourly temporal resolution and a 1 km2 spatial resolution.

3. Other Activities (Outside Spain)

As mentioned earlier, this review aims to develop a map evaluating the potential of hybrid power plants (HPPs) in Spain. Consequently, the primary focus has been on the activities within Spain. However, significant research efforts in this field have also been undertaken in other countries. This section provides a brief overview of some noteworthy initiatives outside Spain, focusing on those that cover the product cost category for HPPs, which was detected in the previous section as the most outstanding gap.

3.1. IEA Wind Task 50 [51]

The general purpose of the proposed IEA Wind Task is to coordinate international research and development in the field of hybrid wind power plants. The elaboration of maps for the potential evaluation of HPPs is not directly included in any of the activities of this task. However, some of the work packages (WPs) are indirectly related, such as WP1, collection of the research results, the state-of-the-art, and expert consensus; WP2, design of a suite of reference hybrid plants; and WP3, overview of the design and operation technology/algorithms. Within WP3, benchmarking of the two main open-source offerings that will be introduced in Section 4.2.2 is proposed. As will be mentioned later, this might be an important result of this mapping exercise.
There are nine participant countries (Belgium, Canada, Denmark, Germany, Ireland, Netherlands, Norway, Sweden, and the US) and five observer countries (Australia, France, India, Spain, and the UK).

3.2. Activities in the USA

The effort to develop HPPs in the US is one of the most ambitious and best-documented in the world, both in terms of deployment and research. In terms of deployment, wind–solar–storage hybrid power plants represent a significant and growing share of the newly proposed projects in the United States [52]. A description of the status of operating and proposed HPPs is presented in [53]: 80 new hybrid power plants with a 7.9 GW operational generating capacity and an 11.6 GWh operational storage capacity in 2023 (66 of them were solar-plus-storage).
In terms of research, an informal task force on hybrid energy systems was established in 2020, with the ultimate goal of identifying R&D activities that multiple offices can collaborate on to increase their impact. The opportunities identified are categorized into three research areas: markets, policy, and regulation; valuation; and technology development [54]. These research areas are directly related to the elaboration of a potential map for HPPs. A deeper analysis focused on hybrid power plants using only renewable generation can be found in [55]. It established the starting point for the improvement of the design and optimization, control, and operation of these systems.
In this sense, although there are different research centers and labs involved, the Berkeley lab is a reference in providing data on HPP deployment, and NREL is the most active center for HPP research. A brief description of NREL’s activities is shown, as some of them will be referred to later.

3.2.1. NREL—Hybrid Energy System Research

NREL is active in different areas regarding HPPs. Due to its close relationship with this paper, its development of software tools and identification of the best locations for HPPs will be addressed briefly.
NREL is developing robust open-source modeling tools capable of simulating and optimizing a range of hybrid energy systems. The Hybrid Optimization and Performance Platform (HOPP) v3.3.0 is a software tool (part of the NREL suite of system engineering tools) that enables detailed analysis and optimization of hybrid power plants down to the component level, and it is described in Section 4.2.2. HOPP leverages other NREL-developed tools [56] such as ReOpt, which finds the combination of technologies and dispatch strategy that minimizes the lifecycle costs of energy for the site; the System Advisor Model, SAM, for detailed performance and financial modeling, will be described in Section 4.2.2; the Wind-Plant Integrated System Design and Engineering Model (WISDEM®), which couples flow models with other system performance and cost models to enable design optimization; and the Regional Energy Deployment System model architecture (ReEDS), which models the evolution and operation of generation, transmission, and end-use demand technologies [57].
Regarding the identification of the best locations for hybrid plant development, “NREL has created high-resolution wind and solar maps using a national database called the WIND Toolkit for wind integration and forecasting, as well as National Solar Radiation Database data. This data enables a full understanding of the complementarity of resources, a crucial piece in determining the optimal deployment of hybrid plants” [8].

3.2.2. Resource Characterization, Forecasting, and Maps

In chronological order, these are some of the main initiatives concerning map elaboration:
-
RE potential: This consisted of estimation of the economic potential of several renewable resources available for electricity generation in the US [58]. Though it was not HPP-specific, it had some interesting characteristics, such as high-resolution temporal data (hourly); relatively high-resolution spatial data (100,000 sites for wind and 710,000 sites for solar PV); and the use of an economic indicator (LCOE) for site classification.
-
The North American Renewable Integration Study (NARIS) was the first detailed power system integration study for the entire North American continent [59]. So, it was grid-planning-oriented. A viewer was developed within this study [60].
-
A complementarity analysis, involving the first HPP-oriented map: this was only the first step and addressed what future work would require: (1) consistent resource data, (2) more detailed local analysis, and (3) the consideration of resilience-specific complementarity metrics [52].
-
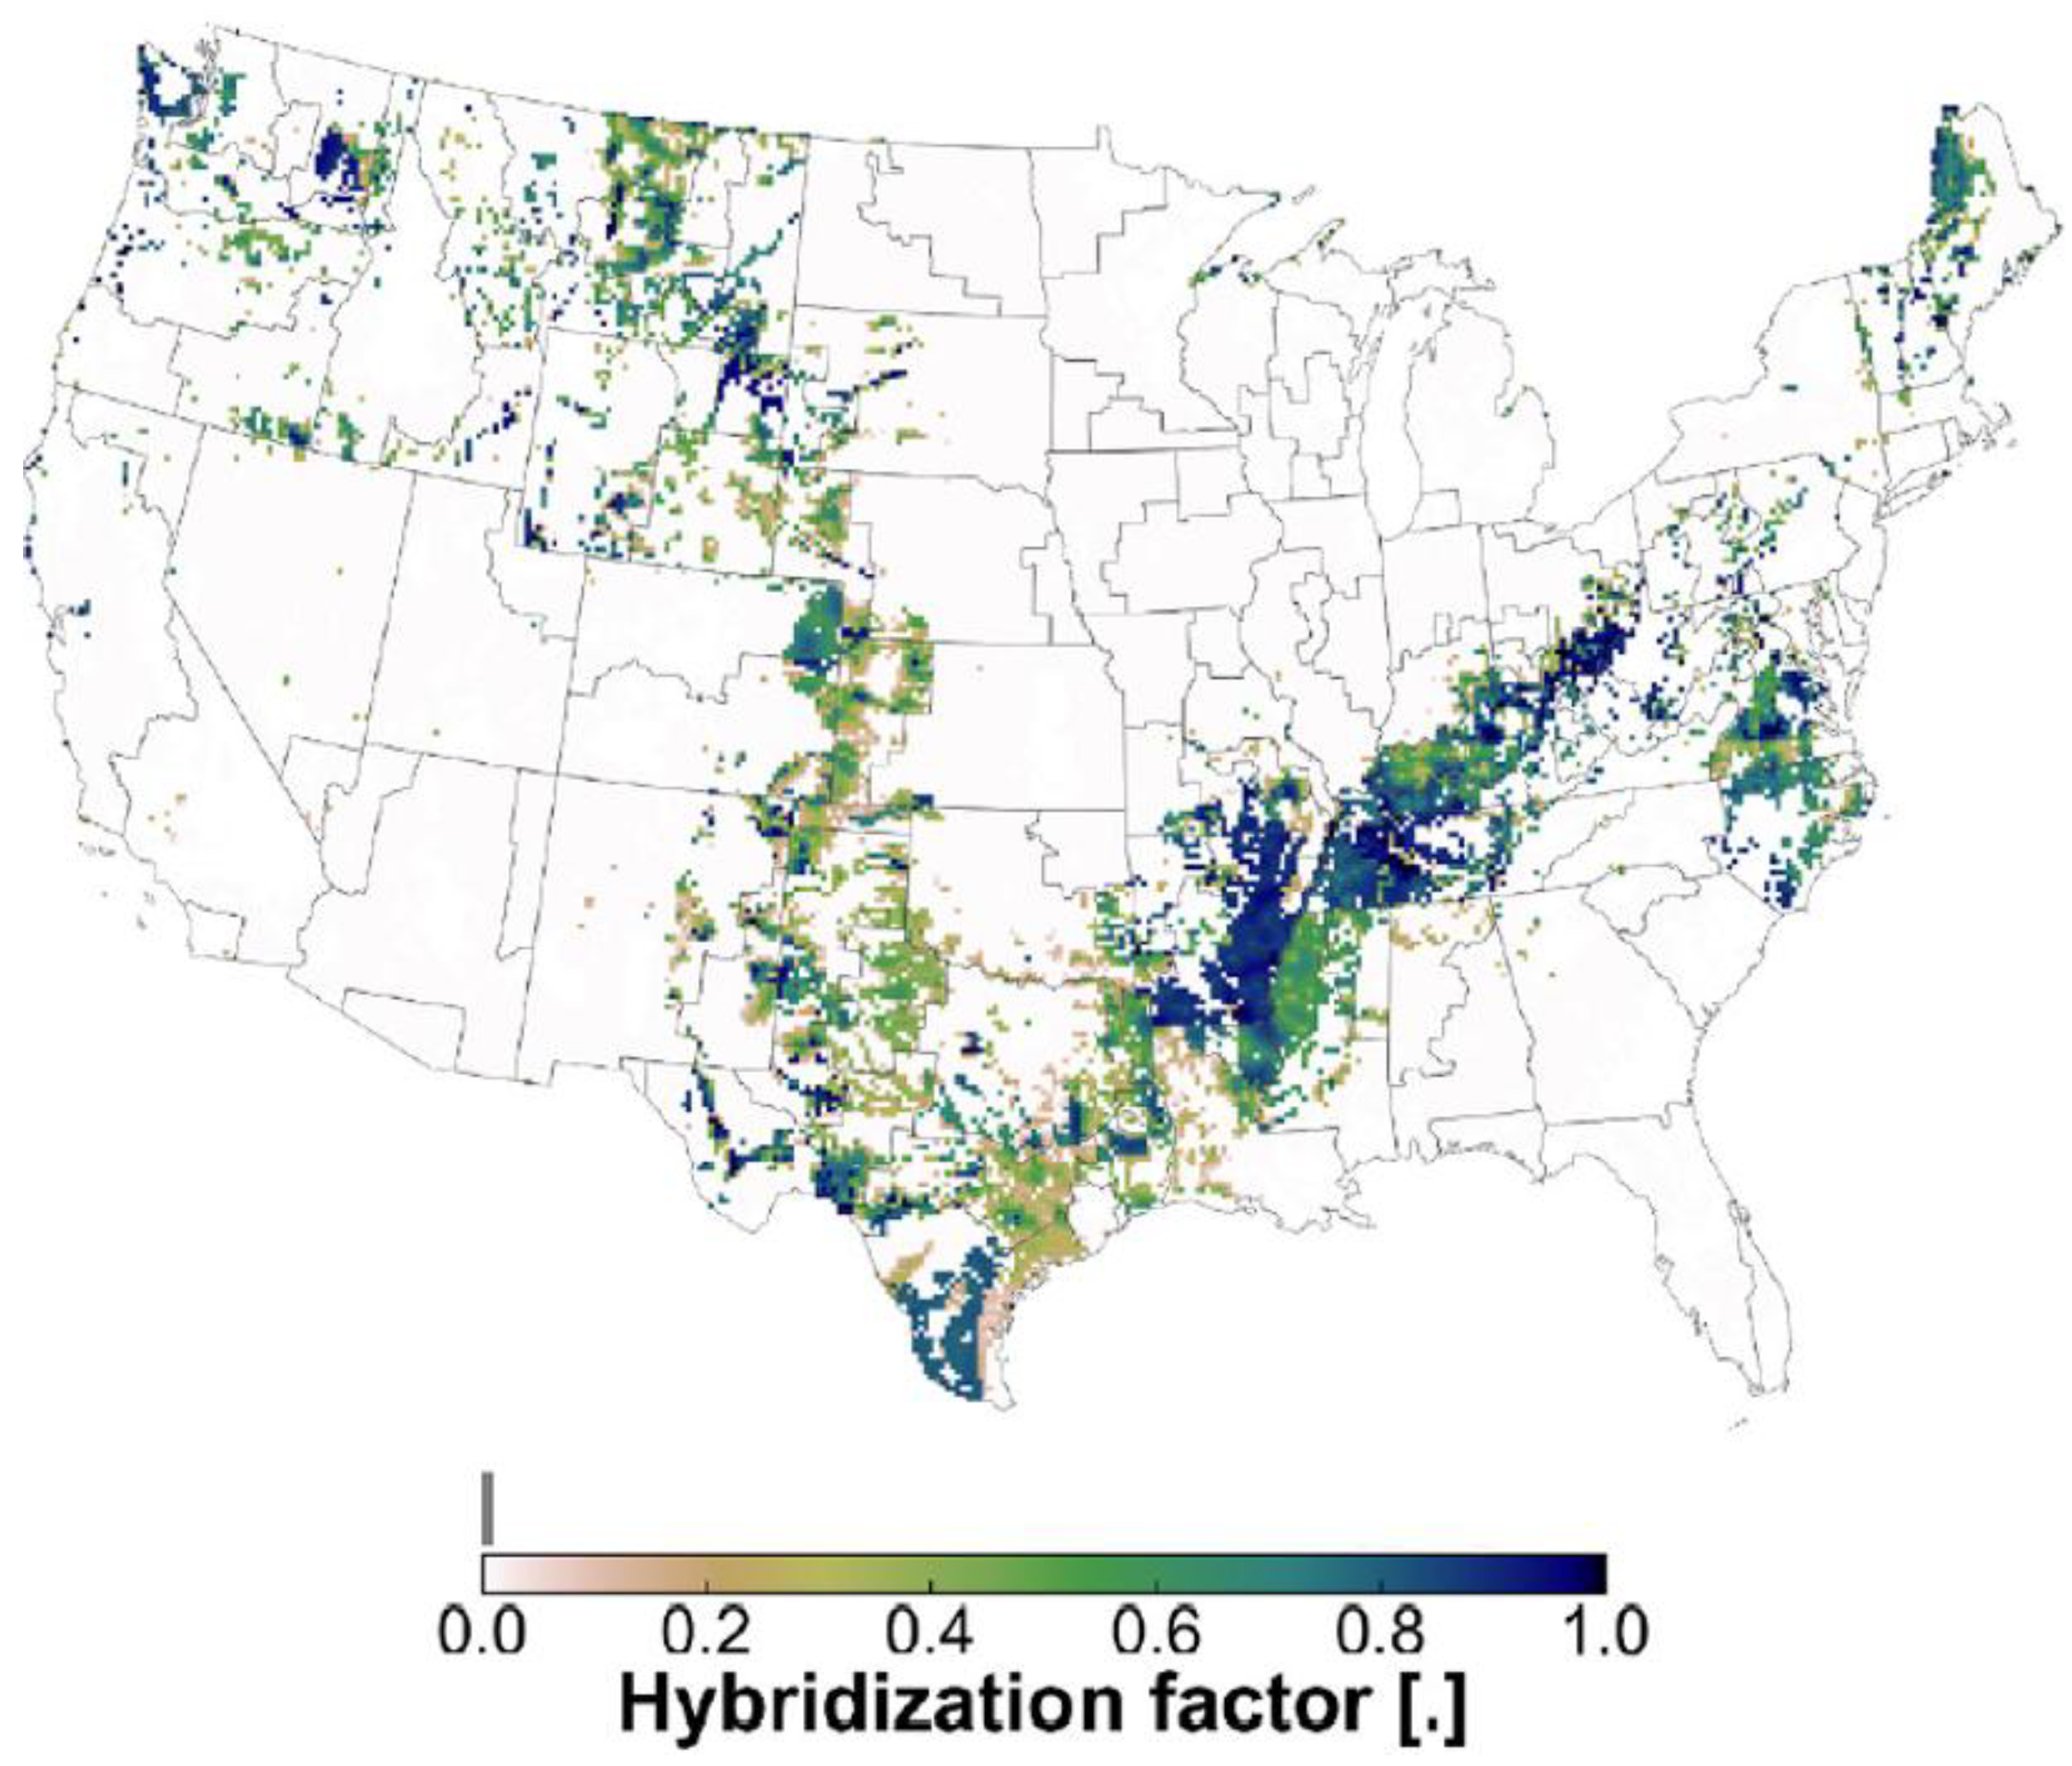
A high-resolution, national-scale capacity expansion model [61] for exploring electricity–system-cost-minimizing deployments of PV–wind hybrid systems across the U.S. in scenarios that would achieve a zero-carbon electricity mix by 2040. It introduces a hybridization factor that varies piecewise-linearly between 1 when the wind and solar capacities are equal and 0 when either the wind or solar capacity is zero. The ReEDS tool is used. Taking into account the influence of the point of interconnection (POI) in the design of HPPs, “the cost-optimal solution includes 290 GW of POI capacity with a hybridization factor > 0.5 (i.e., with a site PV/wind capacity ratio between 1:3 and 3:1)”. Figure 2 shows the hybridization factor by site across the US.

3.3. Activities in Denmark

Similarly to what was described in the US, the activity on HPPs in Denmark has led to the constitution of the Danish Hybrid Wind Power Plant Forum. It is formed of most of the major Danish stakeholders in the field of HPPs (Technical University of Denmark, DTU, is the main responsible party, with the universities of Aalborg, Aarhus, and Syddansk as partners), comprising mainly wind, solar, and storage technologies [62].
In particular, research at DTU on HPPs has a long history [63], as a legacy from previous research on hybrid systems. This research on HPPs has produced different outcomes, mainly in the form of MSc and PhD theses, project (such as HYBRIDize) participation in HPP working groups (such as the abovementioned Danish Forum and IEA Task 50), HPP facilities, and the National Energy System Transition Facilities (NEST) [64].
About the development of tools, two of them are particularly interesting for the development of HPPS:
  • HyDesign: This will be described later in Section 4.2.2.
  • Correlations in renewable energy sources (CorRES): An overview can be found in [65]. CorRES is a time series simulation tool for variable renewable energy, used for power and energy system studies and also in plant-level analyses. Some of the main features of CorRES are shown in Table 3.

3.4. Activities in Australia

The following remarkable activities have been identified concerning the potential of HPPs in Australia:
  • Within the analysis called “Prospective hydrogen production regions of Australia” [66], Scenario 1 analyzes the renewable wind, solar, and hydropower resource potential without infrastructure constraints. A map [67] was produced, showing where the highest potential wind and solar power coexists or where renewable resources could be firmed by hydropower.
  • One of the 100% Renewable Energy Group’s outputs is the Australian Solar PV and Wind Heat Maps [68]. These are heat maps showing the indicative cost of electricity (in AUD/MWh) for each pixel (1 km × 1 km for solar and 250 m × 250 m for wind), comprising the cost of energy from a solar/wind farm plus an associated power line connecting the solar/wind farm to the existing and planned high-voltage transmission network. Though it is not a HPP map, its approach is very similar to the HPP approach in some related aspects.
  • The Australian National University has produced the FIRM energy planning model. It is an open-source model and has been applied in different places, like wind-constrained sunbelt countries [69], Malaysia [70], and Japan [71]. The value of FIRM compared to that of other capacity expansion/long-term energy planning models is [72] that
    -
    All new generation is expected to come from solar and wind within the model. In 2023, 84% of the new capacity around the world was solar and wind, while 2% was from all other renewables.
    -
    The energy balance is sustained over large time horizons (10–40 years), making sure that the long-duration energy storage for infrequent calm, cloudy weeks is properly modeled. These are the biggest drivers of the energy storage capacity and associated costs.

3.5. Activities in India

The Government of India issued the National Wind-Solar Hybrid Policy [73] to regulate and coordinate the deployment of these systems. The National Institute of Wind Energy (NIWE) of India has developed the Hybrid (Wind-Solar) Map Portal [74]. The Wind-Solar Hybrid Map has been prepared by combining the wind potential map and the solar atlas prepared by the National Institute of Wind Energy (NIWE), Chennai. Both maps are combined in terms of the %CUF at a 500 m spatial resolution. The combined %CUF is defined as the ratio of the actual energy supplied from a hybrid plant over the year to the maximum possible energy that can be supplied against the declared project evacuation capacity in a year. To estimate the hybrid suitability, the %CUF values of both maps are initially normalized to 0–50% and added together to the maximum value of 100%. The regions with wind %CUF values of more than 35% and solar %CUF values of more than 20% are considered the most suitable sites for hybrid energy, with a suitability factor of 100%.
A comprehensive review of the mapping activities in India performed at Stanford University, along with another onshore wind energy atlas accounting for altitude and land use restrictions and co-located solar, can be found in [75]. The analysis performed by NREL through the Greening the Grid initiative explores the technical and economic feasibility of integrating 175 GW of wind and solar capacity into India’s electricity grid by 2022 after screening for suitable sites at a 500 m resolution [76].

3.6. Activities in Saudi Arabia

Reference [77] proposes a spatiotemporal decision-making model for solar, wind, and hybrid systems and uses Saudi Arabia as a case study. This study includes potential analyses of solar, wind, and hybrid systems. Regarding hybrid systems, the key finding is that HPPs covering 27.7% of the country show high potential, especially in central and eastern regions, but curtailment in some areas reduces the efficiency.
Nevertheless, this reference is also a complete and comprehensive analysis concerning the goal of this publication: the mapping of the potential of HPPs. Firstly, this study performs a literature review, identifying the main research gaps. From these identified gaps, it introduces a novel spatiotemporal decision-making model (STDMM), proposing the following methodology for this purpose:
  • The technical and economic potential for HPPs is calculated using ERA5 reanalysis spatiotemporal weather data and technology-specific parameters.
  • Suitability map: From the results of phase 1, other topographical, social, logistical, and regulatory perspective criteria (up to 20) are added through a 1 km2 raster analysis based on a multi-layered hybrid GIS–Bayesian BWM model. For the selection of the optimal weights for the selected criteria, a group of experts from different energy-related fields was consulted via a questionnaire analysis.
  • Maps that highlight the optimal locations for hybrid systems are elaborated by analyzing the complementarity of these resources and the benefits of co-located PV and wind installations.
  • The proposed sites are evaluated and validated by comparing them with existing power plants, along with a comparative analysis with other related studies from the literature.
Finally, this work also includes a comprehensive review of the existing activities in this area, and it will be crucial for the following conclusion section.

3.7. Conclusions on the Activities Outside Spain

Even though the USA and Denmark may be considered the leaders of HPP research at the international level, as stated before, reference [77] has been identified as the base reference for the mapping of HPPs, as it offers a valuable comprehensive review of the existing activities on mapping the potential of RESs. This study may be considered exhaustive, having identified more than 100 references (it should be taken into account that not all of them refer to HPPs, as they also include only solar-PV-only and wind-only power plants). The main findings of this review suitable for HPPs are summarized as follows: the integration of a GIS and multi-criteria decision-making (MCDM) (e.g., the Analytic Hierarchy Process, AHP) for site selection and evaluation; the predominance of data normalization techniques such as reclassification and sensitivity analyses via weight variation; and the importance of considering both the geographical and cost-based feasibility alongside the spatiotemporal characteristics in mapping approaches.
Finally, the main recommendations for the mapping of HPPs identified in the reference work mentioned [77] are summarized as follows: considering not only geographical but also cost-based feasibility and considering the spatiotemporal characteristics. These insights align closely with the objectives of this paper, reinforcing the necessity of a comprehensive methodology for HPP potential evaluation.
However, this review of the international activities has included some outstanding initiatives on HPP mapping that were not included in the base reference in order to complement and update it. As a summary, this review of the main activities in acquiring the necessary results for the mapping of HPPs at the regional or national level has shown that there are different methods and tools available and, according to the particular aim of the study, different methodologies can be used (including different calculations, spatial and temporal resolutions, etc.). The aims of the studies range from an analysis of the resource complementarity to planning for power independence.

4. From the Data to the Results

The elaboration of the mapping of RESs starts with the data covering the resources, cost, prices, and so forth; the elaboration of criteria for the selection and suitability evaluations; and calculations for the techno-economic performance evaluations for each area. This section reviews the options for this process, starting with an update on the data sources and following with an overview of the existing tools for generating the desired results.

4.1. From the Data: An Update on the Data Sources

In the first paper in this series [4], a data analysis was carried out in terms of variables and parameters, sources of information, and spatial and temporal resolution. Since its publication, new data sources have emerged that can enhance and complement this information. For example, updated resource data is now available [78]. Additionally, new EU regulations [5] aim to help member states identify Renewable Energy Acceleration Areas (REAAs) for the rapid deployment of renewable energy projects. These regulations emphasize the need for digitally consolidated datasets on energy and environmental factors.
As mapping activity is foreseen to be active in the coming years, this information may evolve with new sources of information and new parameters of interest, with maybe even more accurate temporal and spatial resolutions for particular analyses [79].
Key data sources include PVGIS for solar radiation and PV system performance and the Global Wind Atlas (GWA) and the New European Wind Atlas (NEWA) for wind power generation, but the Energy and Industry Geography Lab [80] is the proposed reference. It brings together a wealth of geo-spatial information on energy, including datasets on the renewable energy potential at the NUTS2 level and industry and environmental factors. In early 2024, it included the following datasets: Natura 2000 sites, nationally designated protected areas, key biodiversity areas, important bird areas, ecologically or biologically significant marine areas (EBSAs), peatlands, industrial facilities, and wastewater treatment plants. In addition to the listed digital tools and databases, Earth observation data, for instance, from the Copernicus Programme [81], could be used.
This regulation also provides some recommendations to member states about RAAs: they should not lead to the creation of ’no-go areas’, and zones where renewable energy should not be developed (‘exclusion zones’) should be reduced to the necessary minimum [27].
In Section 4, a simplified application will be presented for Spain. The initial data for the suitability evaluation, related to the analyzed parameters, constitute a series of layers (Table 4) for both PV plants and wind plants. The available data were obtained from various geographic data portals and provided by governmental institutions. Some of them were collected and assembled in previous works conducted at CIEMAT [82,83].

4.2. To the Results: The Tools and Methods for the Design of HPPs

As stated before, the core of this paper is a review of the existing tools and methods available for the calculation of the results on the design of HPPs. This is the topic covered in this section. The existing research on the power output modeling related to utility-scale HPPs is presented in [88], which includes a comprehensive overview and identifies the knowledge gaps. An analysis of the optimal sizing for HPP technologies is addressed in [89], identifying some challenges, like the complexity of sizing and the obstacle of optimizing the collection system cable layout, and some opportunities, like novel approaches to modeling wind and solar time series considering high-frequency fluctuations and the impact of climate changes.
The approach in this section will be different, as it will be focused on commonly available tools, either because they are commercially available or because they are open-source. So, proprietary tools for the design of HPPs, such as those from CIRCE [90] and Tekniker [91] or GE’s FLEXIQ [92], and research tools that are not publicly available will not be addressed in this review. The review does not pretend to be exhaustive but is rather indicative regarding the existing commercial and open-source tools.

4.2.1. The Existing Commercial Tools

HPPs may be considered an evolution of hybrid systems, in which at least the size and the business model may be different but they maintain some common characteristics, such as the complementarity of the resources or the optimization and sizing algorithms for design and control. Therefore, although HPPs are a relatively new technical solution, hybrid systems have existed for decades, and so there are some commercial tools for their design on the market. Some of these existing commercial tools include a new toolbox or a new version for the design of HPPs. Some of the most important ones are HOMER Pro and iHOGA. HOMER Pro and iHOGA are well-known for the electrification of stand-alone systems [93].
windPro is a reference for the design and simulation of wind farms and recently included a module for the design of HPPs.
A brief description of their approaches to the design of HPPs is presented in the following subsections.
  • From HOMER Pro to HOMER Front
“HOMER Pro (Hybrid Optimization Model for Multiple Energy Resources) by UL is a simulation tool meant to design viable microgrids. It can optimize the design of microgrids by simulating various combinations coupled with sensitivity analysis.” [21].
HOMER® Front software by UL Solutions performs techno-economic analyses of HPPs, providing a web-based platform. It is specially focused on the integration of energy storage systems into existing power plants, providing calculations of the project value, mitigating potential risks, and optimizing multiple areas, such as the energy markets, business models, and battery capacity (including the degradation, augmentation, and replacement strategies), to determine the internal rate of return (IRR) [94]. A description of HOMER Front can be found in [95].
  • From iHOGA to MHOGA
iHOGA/MHOGA are two versions of the Hybrid Optimization by Genetic Algorithms (HOGA) software, developed in C++ by researchers at the University of Zaragoza (Spain) for the simulation and optimization of electric power generation systems based on renewable energies. iHOGA is for systems from a few hundreds of watts up to 5 MW of power, whereas MHOGA is for MW-level power systems, without any limit [96], and it was developed in collaboration with the company Sisener Ingenieros. A description of the MHOGA version can be found in [97].
  • windPRO
windPRO is a software suite for the design and planning of wind farm projects. windPRO covers everything from wind data analysis, calculation of the energy yields, quantification of the uncertainties, and assessments of site suitability to calculation and visualization of the environmental impact. windPRO can also be used for a detailed post-construction analysis of the production data, all available in separate modules as needed. The HYBRID module is available in version windPRO 4.0, and it allows for an analysis of HPPs. A description of the HYBRID module can be found in [98].
  • A comparison of the commercial tools
A comparison of these three commercial tools is shown in Table 5.

4.2.2. Open-Source Tools

These tools have appeared in the academic and research environment, and their orientation is double: they may serve as a tool for the design of one single HPP, like those in Section 3.1, but they are open-source and can be integrated into a co-simulation tool for the elaboration of maps and public knowledge to hone the technical decisions made by policymakers. A brief description of their approaches to the design of HPPs is presented in the following subsections.
  • The System Advisor Model (SAM) [99]
Using time series weather data; system specification features, including the physical layout; and inputs for the system losses, SAM can predict the electricity production and costs over time, as well as the income from different revenue streams (energy, capacity, incentives), and use them to perform a detailed financial analysis of the system’s performance for various high-level objectives, including the LCOE, NPV, payback periods, and more [100].
SAM evaluates the feasibility and potential of renewable energy projects and identifies potential opportunities for improvement. It allows users to enter detailed information about the site, the technology, and the financial parameters and then generates performance and economic predictions based on that data. However, it was not able to model hybrid systems until version 2023.12.17 r1 SSC 290, where this new capability was added. Another important characteristic of SAM is PySAM [101], a Python package that can be used in Python code to make calls to the SAM compute modules.
The available hybrid system configurations are solar PV generation, wind generation, battery storage, and fuel cells [102]. SAM’s hybrid system models combine two or more power generation subsystems with battery storage. SAM estimates the annual energy production for a given system configuration using reduced-order models, databases for the component performance, and the loss factors at multiple points along the simulation [103].
  • The Hybrid Optimization and Performance Platform (HOPP) [104]
The Hybrid Optimization and Performance Platform (HOPP) is an open-source software tool developed by NREL for the detailed analysis and optimization of HPPs, which is integrated with other open-source tools such as SAM. HOPP can assess and optimize projects that contain combinations of wind (onshore and offshore), solar, storage, geothermal, and hydro power [105]. It takes into account physical design constraints, such as shadow flicker effects and irregular boundaries, when optimizing the layout of wind and solar power plants.
HyDesign is a state-of-the-art optimization tool developed at DTU [107]. It provides the optimal hybrid plant sizing based on user-specified financial metrics, such as the net present value over capital costs (NPV/CAPEX) or the LCOE. The design variables for optimization include the wind turbine design (blade tip to ground clearance, specific power, rated power), wind plant design (number of wind turbines, wind power density), solar plant design (AC power, surface tilt angle, surface azimuth angle, DC/AC ratio), and battery sizing (power rating, energy storage duration).
  • A comparison of the open-source tools
A comparison of these three open-source tools is shown in Table 6.

5. A Simplified Example of an Application

Some outcomes have already arisen from this review, and a simplified example was created to show the kind of results that the envisioned mapping of HPPs might bring. The aim of this example is to share a proposal to identify indications of suitable locations for HPPs with high profitability. The main outcomes that are included in this exercise are the methodology structure (a suitability map followed by a viability map) and the 1 km2 spatial resolution. Simplification primarily concerns the temporal resolution of the data and the calculations, and this means that the results are not accurate but only indicative. The results provide a representative overview in terms of shape and granularity, though future work will be required to enhance the accuracy, which will be achieved by adopting some of the open-source tools described in Section 4.2.2.
A general scheme of the methodology is represented below (Figure 3). It is inspired by the methodologies presented in Section 2.4 and Section 3.6. The process consists of three main steps, which will be described in the following sections:
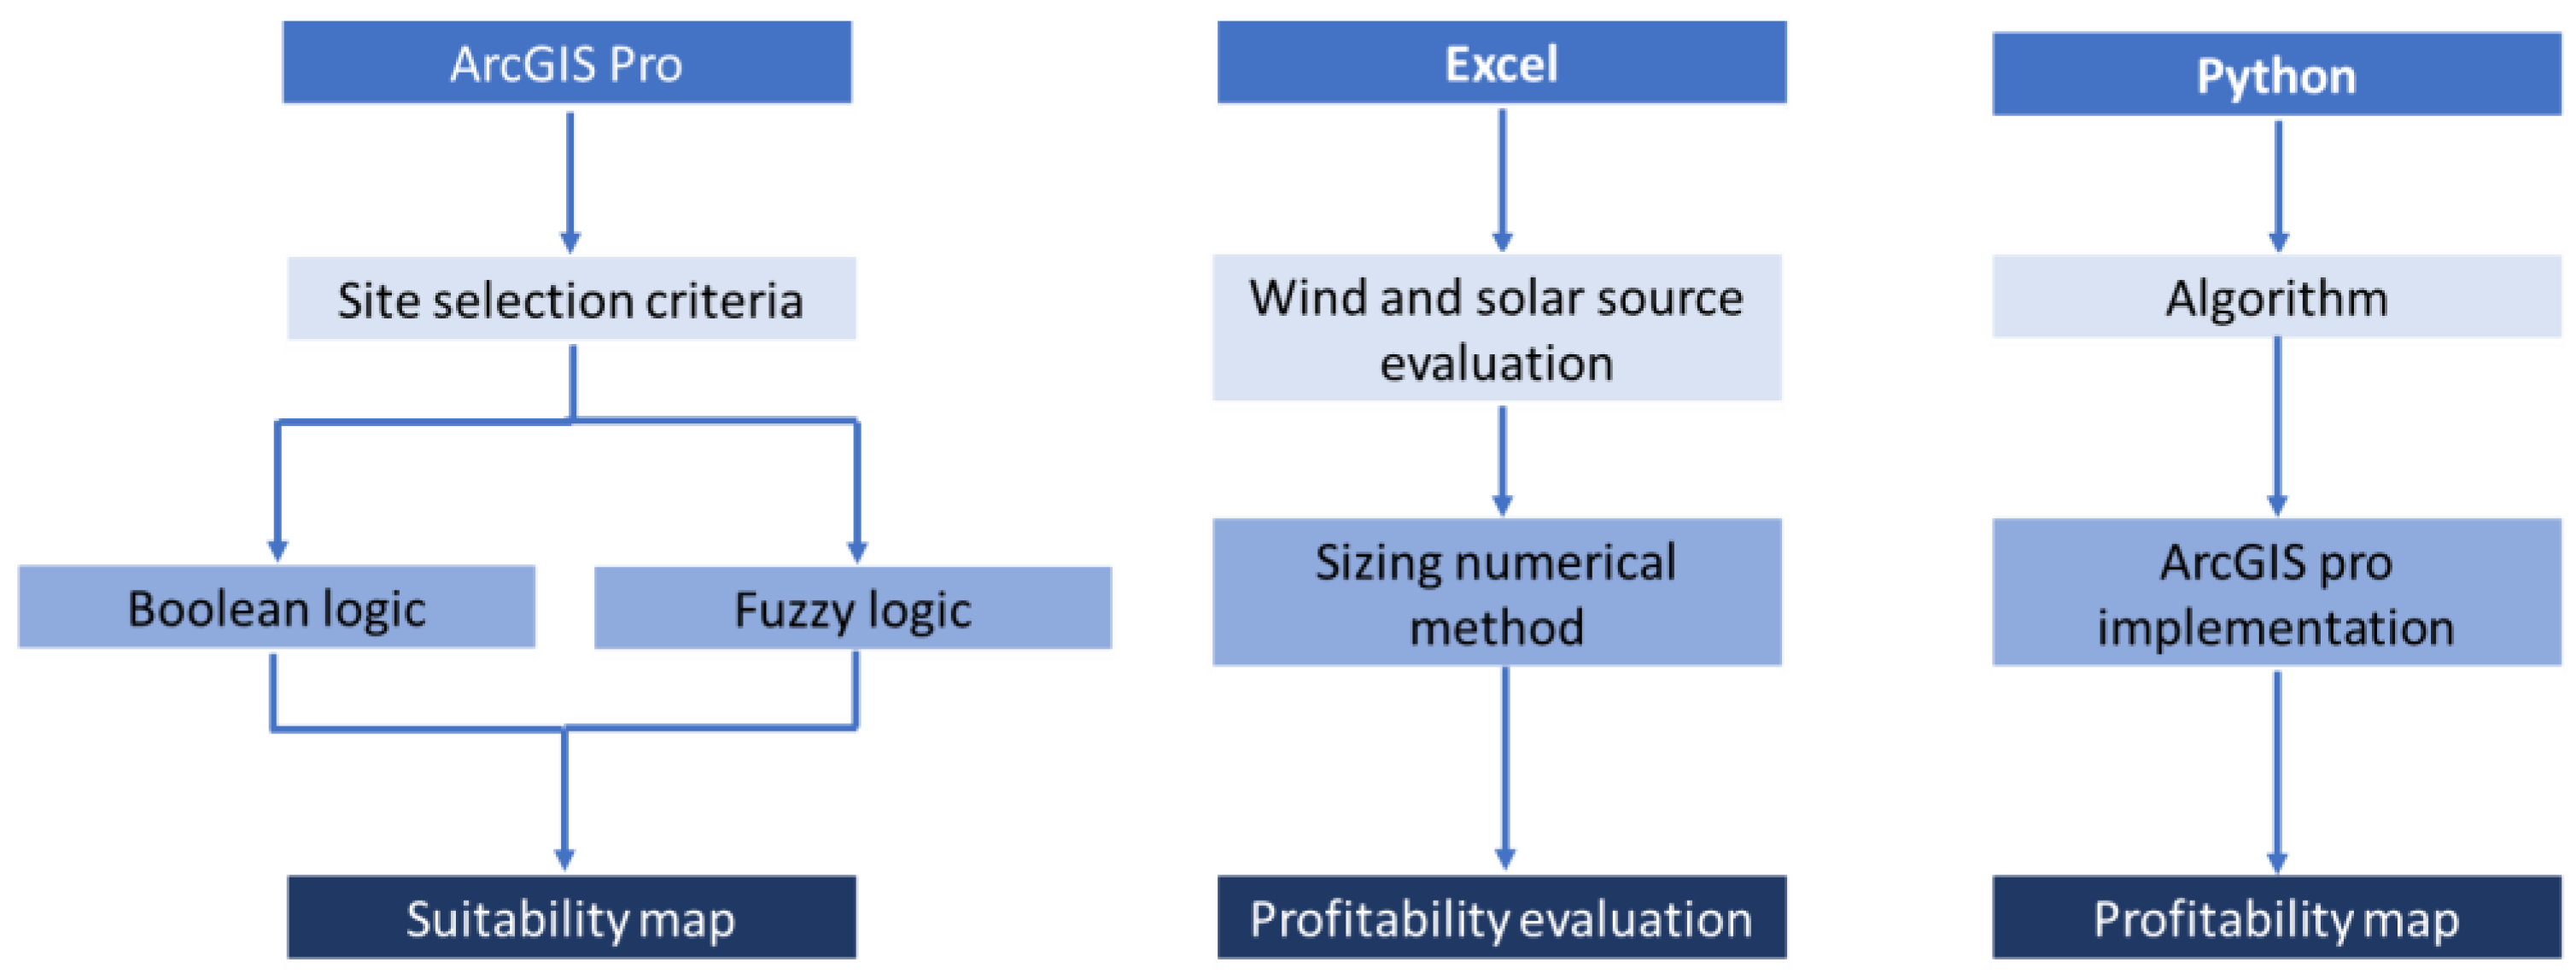
  • Suitability map creation for hybrid systems using ArcGIS Pro software;
  • The optimal sizing and profitability model for HPPs;
  • Profitability map generation for Spain, implementing the model in ArcGIS.

5.1. Suitability Map Creation

As a first step, a preliminary suitability map for HPPs in Spain is built by integrating GIS-based and MCDM processes. The initial layers for the suitability evaluation, related to the analyzed parameters, are presented in Table 4.
To build the map, the software ArcGIS Pro and its geographic analysis and processing tools are used. As the MCDM method for the evaluation of the suitability, a combination of Boolean logic and fuzzy logic is considered. The Boolean logic for the exclusion layers allows each cell of the raster to be associated a number equal to 0 or 1, according to the previously defined criterion. Value 0 represents cells that are unavailable for the installation of renewable energy systems, while a value of 1 represents available ones [108]. Equally, the fuzzy logic for the ponderation layers each cell to be associated a number between 0 and 1, according to a defined “fuzzy membership”. These enable us to set the suitability of the cells according to each parameter. In this case, the memberships employed are “linear increasing” and “linear decreasing”. The first type assigns 0 to the lowest value on the scale and 1 to the highest one, and the values increase as the parameter value increases. For the second type, zero is assigned to the highest value on the scale and one to the lowest one, while all of the others decrease as the parameter values increase.
The exclusion and ponderation layers are combined to generate two suitability maps, one for PV systems and another one for wind systems, which are finally overlaid to create a unique suitability map for HPPs. Subsequently, all of the exclusion layers are multiplied to obtain a final exclusion cover, and the ponderation layers are fuzzily superposed with the gamma parameter set to 0.9 since this has been demonstrated to be recommended for this type of operation [29]. Each parameter for the construction of the suitability map is associated either with the Boolean logic or with the fuzzy logic through the criteria listed in Table 7. The choice of the ranges for the Boolean variables and of the fuzzy memberships for the weighted variables are the results of the research work carried out in [43,82,108,109].
Using ArcGIS Pro’s tools, the suitability index map for HPPs is represented in Figure 4, ranging from a “0” value (not suitable) to a maximum value of “1” (completely suitable). Once the overlay process is completed, the resulting map is represented with a raster resolution of 1000 m × 1000 m and a Geographic Coordinate System of WGS 1984.
The territory selected for the analysis of the profitability corresponds to all suitable areas obtained where the suitability index is higher than 0.5, in the absence of a more precise criterion for selecting the area for analysis. This value is chosen arbitrarily to make sure that the points chosen for the profitability analysis have a higher chance of being characterized by high profitability. The validity of the selection of this threshold will be checked against the results of the profitability analysis, both in terms of the area and in terms of the results.
Considering the number of pixels that form the final raster layer, the percentage of the suitable area is calculated, and it is equal to 24% of the total considered area.

5.2. The Model for Sizing

The model for the evaluation of the optimal size of an HPP and the evaluation of its profitability consists of (a) an evaluation of solar and wind resources; (b) a numerical method for the evaluation of the optimal size of the wind and solar PV power plant composing the hybrid system; and (c) an evaluation of the profitability of the hypothetical plant.

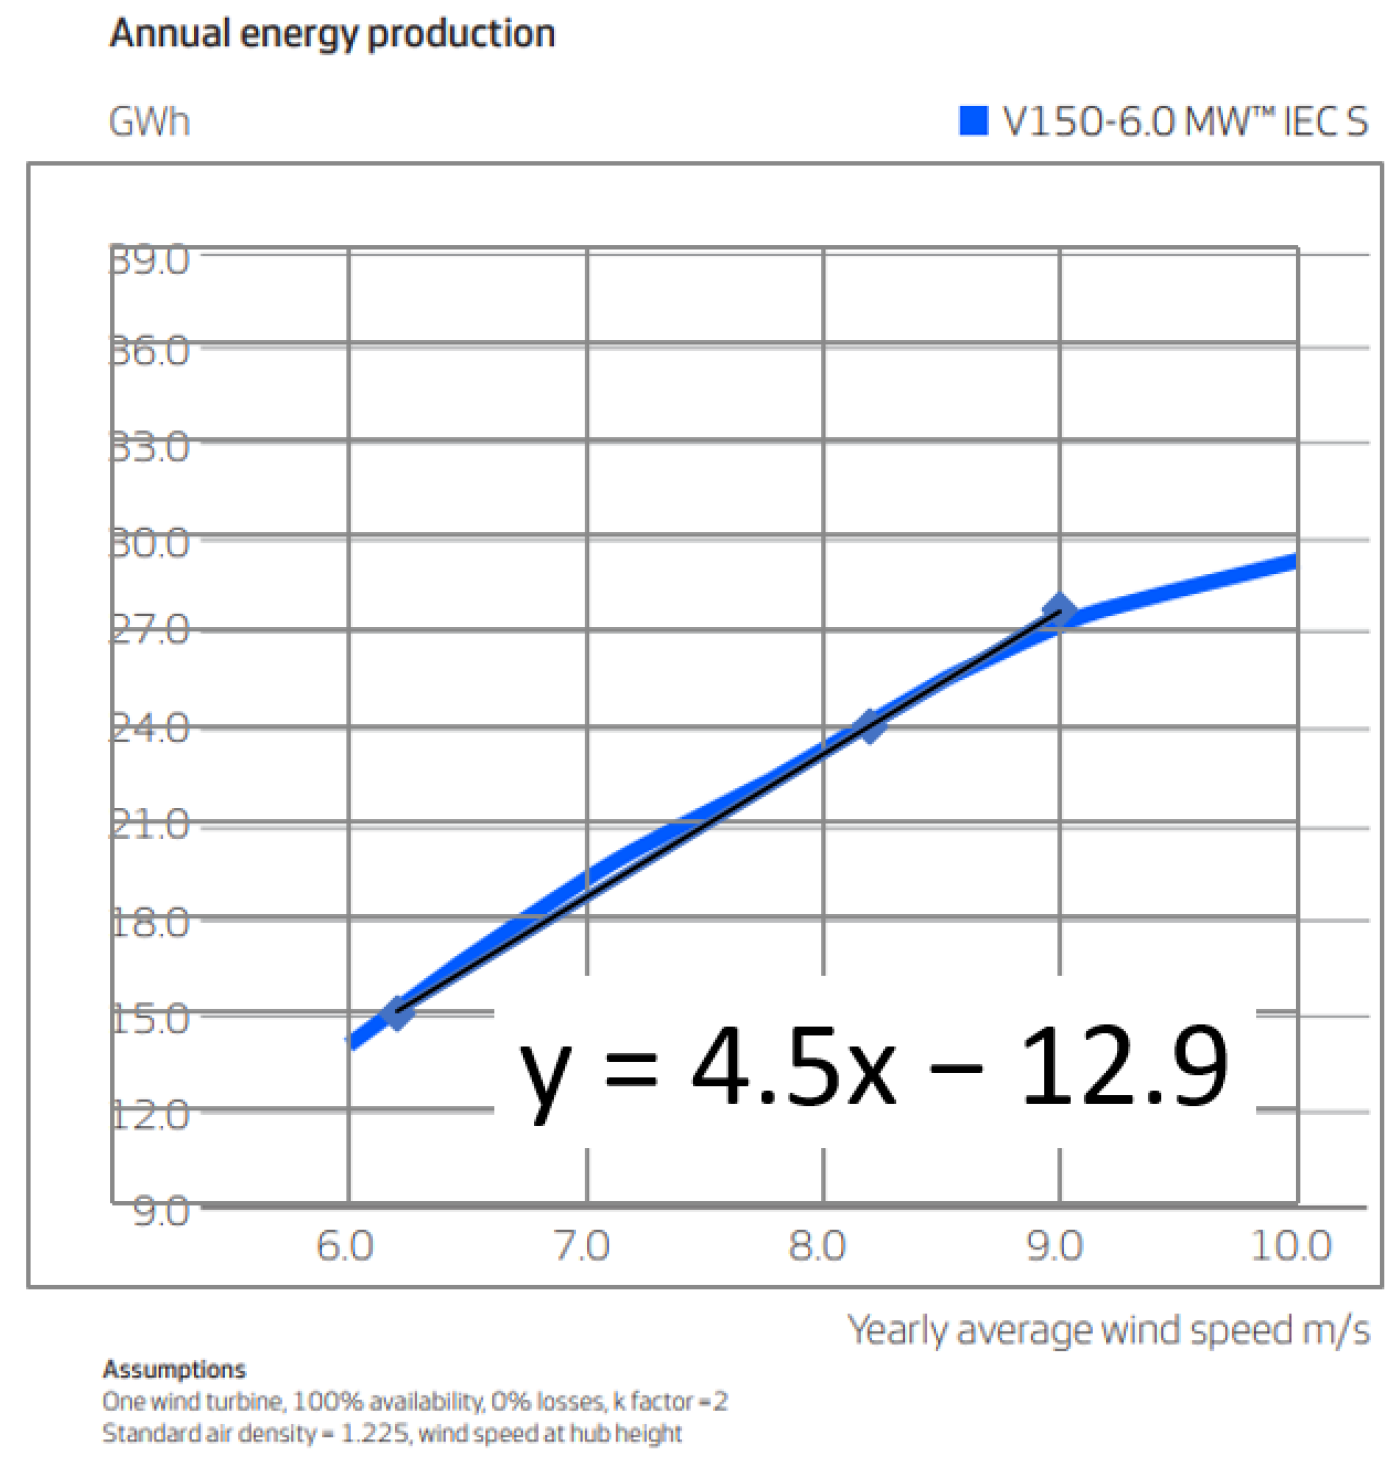
5.2.1. Evaluation of the Solar and Wind Energy Production

This simplified example of an application is based on the monthly average values for solar irradiation and wind speed. The initial data consists of twelve raster layers representing the monthly average global daily irradiation on a horizontal plane, expressed in kWh/day, and twelve raster layers representing the monthly average daily wind speed, measured at 100 m, expressed in m/s. From these data, the energy available for each source is evaluated.
First, regarding the solar resources, the monthly available energy per day (EPV,m, in MWh/day) is calculated as the linear proportion between the Performance Ratio (PR; a value of 0.8 is assumed [110]), the power of the PV power plant (PPV, in MW), and the monthly Peak Sun Hours (PSHm, expressed in h/day), considering the optimal capture each month.
EPV,m = PPV·PR·PSHm
Subsequently, to calculate the available wind energy, as demonstrated in [111], the monthly profile of the produced wind energy per day (EW,m, in MWh/day) can be expressed through the linear relationship between the monthly average wind speed at the hub height (WS,m, in m/s) and the power of the wind farm (PW, in MW). So, the linearized relationship between the average wind speed and the energy produced was obtained empirically from the brochure [112] for a particular wind turbine model (VESTAS V150—6.0 MW), as depicted in Figure 5.
The empirically obtained relationship (y = 4.5x − 12.9) provides a linear approximation of the annual energy production (“y”), in GWh/year, of a 6 MW VESTAS V150 wind turbine, taking the yearly average wind speed (“x”), in m/s. This linear relationship was normalized so that it could be used for any wind power value (PW, in MW) to obtain the average daily wind production (EW,m, in MWh/day) for each month, evaluated for the monthly average wind speed at the hub height (WS,m, in m/s) according to the following equation.
EW,m = PW·(2.05·WS,m − 5.89)

5.2.2. Evaluation of the Optimal Size

To evaluate the optimal size of the wind and PV systems composing the hybrid plant, a purely numerical method is employed. This method follows these stages:
  • Determine the search space for wind and solar PV sizes: In order to make the calculations simple, a discrete search space is defined, with a limited number of combinations. The values in the search space are defined as follows:
    The upper limit for each technology is defined by the maximum installable power per unit area, in MW/km2:
    Wind: A range of values between 6.2 MW/km2 and 46.9 MW/km2 can be considered [113]; an average value of 20 MW/km2 is assumed.
    Solar PV: In this case, the range spans from 35.1 MW/km2 to 117.9 MW/km2 [114]; the selected value was 50 MW/km2.
    The lower limit is set to zero. However, only HPPs are considered as winning options; i.e., if the winning combination were PV- or wind-only, it would not appear on the map.
    The unit size of generation: A value of 5 MW was chosen both for wind and solar PV generation.
    So, the search space will be all (55) combinations of the values 0, 5, 10, 15, and 20 MW for wind and the values 0, 5, …, 45, and 50 MW for PV.
  • Establish operational restrictions: These will depend on the particular regulations that apply, but some general restrictions have been defined.
    The evacuation capacity per unit area: Considering that the grid capacity is usually one of the main limitations when installing new HPPs, a theoretical value of 10 MW/km2 was chosen for the evacuation capacity in this example, the same for every unit area, allowing for an analysis of overplanting. However, the actual existing capacity for each area will be included for a more accurate analysis in future work.
    The maximum energy delivered per unit area: This would be 240 MWh/day per square kilometer considering a 100% capacity factor for the assumed 10 MW evacuation capacity. Larger productions will be curtailed. This is the only curtailment that was considered in this example.
    The minimum energy delivered per unit area: Considering a margin of flexibility for the energy contracted in the PPA, it is assumed that the HPP needs to deliver a minimum value, which was chosen as 90% of the maximum energy delivered per unit area. No combinations that produce an amount of energy smaller than this minimum are considered.
  • Define the business model: A simplified model was selected for this example application, based on a PPA characterized by a PPA price: even though PPA prices have decreased in recent months [115], an optimistic value of 75 EUR/MWh was selected for the results shown. However, this is one of the parameters suggested for a sensibility analysis in our future work.
  • For each of the 55 combinations in the search space, defined by the subindex i for the wind size and j for PV size,
    The average monthly energy production is calculated (Em,i,j). The monthly energy production is curtailed to the maximum established in the operational restrictions if it is higher.
    The annual energy production is computed (Ea,i,j) as the summation of the monthly averages: it should be higher than the minimum established in the operational restrictions. If not, the combination is not considered.
    The total generating net present cost (NPCT,i,j) is calculated for each combination using the values in Table 8.
    The system’s levelized cost of energy (LCOES, in EUR/MWh) for each combination is derived as the relationship between the calculated NPCT,i,j and the total energy produced (n· Ea,i,j) during the lifetime (n) of each combination. It is important to remember at this point the difference between the LCOE of each generating technology and the LCOE of the system, as it has been defined. The LCOES considers only the energy that is actually used (excluding the curtailed one), whereas in the LCOE for each generating technology, all of the energy generated is usually computed. In HPPs, this is an important issue.
  • The combination with the minimum cost is found, and the size of the two components will correspond to the optimal one for a hybrid combination. For this winning combination, the internal rate of return (IRR) is calculated.
The results show that the most common combination of capacities is composed of a wind farm of 15 MW and a PV plant of 30 MW.

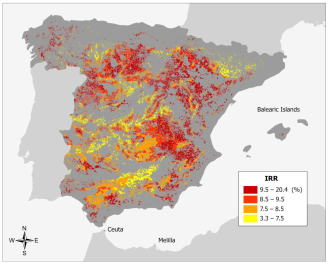
5.3. Profitability Map Creation

The model discussed in the previous section is implemented in ArcGIS Pro through an algorithm written using Python, including the calculation of the internal rate of return (IRR) as the index selected to represent the profitability of the investment. This enables iteration of the calculations of the model for each cell and consequently for each of the sites that was declared as suitable for the installation of an HPP in the preliminary suitability analysis. As a result, the map in Figure 6 is obtained to represent the IRR.
The sites with the highest IRR values are in the northern regions, in particular in Galicia, Aragón, Navarra, Castile, and León. In the center and south of Spain, a relevant number of profitable areas can be found in Castile–La Mancha and Andalucía.
Sites that fulfil the design constraints represent 99.4% of the suitable sites. Suitable areas with an IRR higher than 7% are 89.9% of the total suitable area and 21.9% of the total considered area. The maximum IRR value is 20.4%, while the minimum is 3.3%.

6. Discussion

This study reviews activities related to the mapping of HPPs. The results of this review are discussed, and the main conclusions are taken for future work on an actual map, establishing future research directions.
The activities in Spain have been categorized into four areas: LTES models, geo-spatial planning, product cost models, and technical network studies. The review reveals significant activities in HPP mapping, particularly with LTES models, though none have directly addressed HPP mapping. Several geo-spatial tools have been identified for HPP mapping, but no product cost models have been developed for national or regional use. Additionally, the Spanish TSO is actively engaged in estimating the locations of new renewable generation as defined in the NCEP. Although each activity has its own interest, the outcome of the discussion at this point is to address the identified gap (there being no existing product cost model in Spain) by developing a product cost model for HPP mapping in Spain.
The review of the international activities highlights the availability of diverse methods and tools, with the methodologies tailored to specific study objectives. These range from analyzing resource complementarity to planning for energy independence. The key findings include
  • The widespread use of GIS tools integrated with MCDM techniques, particularly the AHP, for site selection and suitability evaluations;
  • The predominant use of reclassification for data normalization and sensitivity analyses through weight adjustments.
The main outcomes of the discussion on these findings are to adopt them in future work, both for suitability evaluation and data normalization.
Finally, this review of the existing tools shows that there are both commercial and open-source tools available nowadays for the design of HPPs. Whereas the commercial tools are usually more friendly, open-source tools have appeared in the academic and research environment and can be integrated into co-simulation tools for the elaboration of maps and public knowledge to hone the technical decisions made by policymakers. So, the outcome of the discussion at this point is to work with open-source tools in the future and use commercial tools for validation purposes. Some common features of all of these tools will be adopted in future work: a Python programming framework; an hourly (or sub-hourly) period; the use of weather databases (derived from ERA5 in our case); relatively simple component models; and different options for the business models. But the decision on which tool will finally be used is not yet confirmed. Future work such as that developed for IEA Task 50 comparing these tools will help with the choice.

6.1. A Simplified Example and Findings

A simplified example was proposed to show the kind of results that the envisioned mapping of HPPs might bring. Simplification arises from the calculations, and this means that the results are not accurate but only indicative. However, the methodology derived from this review and some of the abovementioned outcomes of the discussion are included.
The aim of this example is to indicate (they cannot be considered definitive) suitable locations for wind–solar hybrid systems with high profitability. The process involved
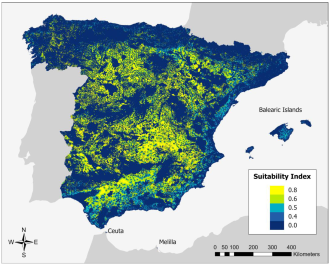
  • Suitability mapping: A map of suitable sites for HPPs in Spain was generated using Boolean and fuzzy logic, considering climatic, ecological, and economic factors;
  • The optimal sizing and profitability model: A simplified model was developed to evaluate the optimal size and profitability of hybrid plants;
  • Profitability mapping: The model was implemented to produce a profitability map for each site in Spain.

6.2. Limitations and Future Work

The review of the suitability and profitability maps indicates the need for a more in-depth analysis to improve the precision of the results. Key areas for future work include
  • Incorporating economic factors into the CAPEX and OPEX evaluation to study the influence of different components;
  • Including a sensitivity analysis of the PPA prices, discount rates, and component costs and considering multiple business models or factors in terms of depreciation, financing structures, and policy incentives;
  • Including storage systems, as storage is a key component in hybrid systems, especially for grid stability, peak shaving, and energy arbitrage;
  • Using hourly averages for the energy production to improve the accuracy of the optimal sizing, dispatch modeling, and curtailment estimations;
  • Incorporating georeferenced data on the evacuation capacity;
  • Investigating alternative metrics for highlighting the advantages of HPPs better, including integrating land use conflicts, protected areas, and community feedback.
These refinements will enhance the accuracy and applicability of the model, providing a more robust tool for HPP mapping and decision-making in Spain.

Author Contributions

Conceptualization: L.A. and J.D.; methodology: L.A. and J.D.; writing—original draft: L.A., M.B., A.M.M., J.D., E.G.B., L.F.Z. and J.N.; writing—review and editing: all; project administration: J.D.; funding acquisition: I.C. All authors have read and agreed to the published version of the manuscript.

Funding

This research was funded by MEDIDA C17.I2G: CIEMAT. Nuevas tecnologías renovables híbridas, Ministerio de Ciencia e Innovación, Componente 17 “Reforma Institucional y Fortalecimiento de las Capacidades del Sistema Nacional de Ciencia e Innovación” funded by the European Union—NextGenerationEU.

Institutional Review Board Statement

Not applicable.

Informed Consent Statement

Not applicable.

Data Availability Statement

Links to the publicly archived datasets analyzed during this study can mainly be found in Section 4.1.

Acknowledgments

The authors acknowledge the Erasmus Plus traineeship scholarship that funded Michael Borsato’s traineeship at CIEMAT.

Conflicts of Interest

The authors declare no conflicts of interest.

References

  1. Directorate-General for Energy (2024): Guidance on Designating Renewables Acceleration Areas (SWD) Guidance on Designating Renewables Acceleration Areas—European Commission. Available online: https://energy.ec.europa.eu/publications/guidance-designating-renewables-acceleration-areas_en (accessed on 19 March 2025).
  2. Spain’s Recovery and Resilience Plan. Available online: https://commission.europa.eu/business-economy-euro/economic-recovery/recovery-and-resilience-facility/country-pages/spains-recovery-and-resilience-plan_en (accessed on 4 March 2025).
  3. Plan de Recuperación, Transformación y Resiliencia. COMPONENTE 17. Reforma Institucional y Fortalecimiento de las Capacidades del Sistema Nacional de Ciencia, Tecnología e Innnovación. Presidencia de Gobierno. 2023. Available online: https://planderecuperacion.gob.es/sites/default/files/2023-10/0310203_adenda_plan_de_recuperacion_componente17.pdf (accessed on 4 March 2025). (In Spanish).
  4. Arribas, L.; Lechón, Y.; Perula, A.; Domínguez, J.; Ferres, M.; Navarro, J.; Zarzalejo, L.F.; García Barquero, C.; Cruz, I. Review of Data and Data Sources for the Assessment of the Potential of Utility-Scale Hybrid Wind–Solar PV Power Plants Deployment, under a Microgrid Scope. Energies 2021, 14, 7434. [Google Scholar] [CrossRef]
  5. Commission Recommendation (EU) 2024/1343 of 13 May 2024 on Speeding Up Permit-Granting Procedures for Renewable Energy and Related Infrastructure Projects. Available online: https://eur-lex.europa.eu/legal-content/EN/TXT/PDF/?uri=OJ:L_202401343 (accessed on 4 February 2025).
  6. EEB’s Response to the European Commission’s Call for Evidence: Renewable Energy—Guidance on Designating Renewables Acceleration Areas. 23 February 2024. Available online: https://eeb.org/wp-content/uploads/2024/02/EEB-response-to-EC-call-for-evidence-on-RAA-designation_20240223.pdf (accessed on 27 March 2025).
  7. Bódis, K.; Kougias, I.; Jäger-Waldau, A.; Taylor, N.; Szabó, S. A high-resolution geospatial assessment of the rooftop solar photovoltaic potential in the European Union. Renew. Sustain. Energy Rev. 2019, 114, 109309. [Google Scholar] [CrossRef]
  8. Available online: https://www.nrel.gov/wind/hybrid-energy-systems-research.html (accessed on 19 March 2025).
  9. IRENA. Planning for the Renewable Future: Long-Term Modelling and Tools to Expand Variable Renewable Power in Emerging Economies; International Renewable Energy Agency: Abu Dhabi, United Arab Emirates, 2017. [Google Scholar]
  10. Resolución de 8 de Abril de 2022, de la Secretaría de Estado de Energía, por la que se publica el Acuerdo del Consejo de Ministros de 22 de Marzo de 2022, Por el Que se Aprueba la Planificación de la Red de Transporte de Energía Eléctrica Horizonte 2026. Available online: https://www.boe.es/diario_boe/txt.php?id=BOE-A-2022-6434 (accessed on 27 March 2025).
  11. Gallego-Castillo, C.; Victoria, M. PyPSA-Spain: An extension of PyPSA-Eur to model the Spanish energy system. Energy Strategy Rev. 2024, 60, 101764. [Google Scholar] [CrossRef]
  12. Bravo, J.D.; Casals, X.G.; Pascua, I.P. GIS approach to the definition of capacity and generation ceilings of renewable energy technologies. Energy Policy 2007, 35, 4879–4892. [Google Scholar] [CrossRef]
  13. Capros, P.; De Vita, A.; Tasios, N.; Papadopoulos, D.; Siskos, P.; Apostolaki, E.; Zampara, M.; Paroussos, L.; Fragiadakis, K.; Kouvartakis, N.; et al. EU Energy, Transport and GHG Emissions. Trends to 2050. Reference Scenario 2013; Publications Office of the European Union: Luxembourg, 2014; Available online: https://data.europa.eu/doi/10.2833/17897 (accessed on 19 March 2025).
  14. AEE, Elementos Necesarios Para la Transición Energética. Propuestas Para el Sector Eléctrico. 2017. (In Spanish). Available online: https://www.aeeolica.org/uploads/Elementos_necesarios_para_la_Transicin_Energtica_FINAL.pdf (accessed on 1 February 2025).
  15. CEPSA, CEPSA Energy Outlook 2030, 2017 Edition. Available online: https://www.moeveglobal.com/stfls/corporativo/FICHEROS/Cepsa-Energy-Outlook-2030.pdf (accessed on 1 February 2025).
  16. Greenpeace. Estudio técnico de Viabilidad de Escenarios de Generación Eléctrica en el Medio Plazo en España. 2018. Available online: https://es.greenpeace.org/es/wp-content/uploads/sites/3/2018/03/Generacion-Electrica_baja_5-03-2018.pdf (accessed on 1 February 2025). (In Spanish).
  17. Linares, P.; Declercq, D.; Labandeira, X.; Romero, J.C.; Chaves, J.P.; Ramos, A. Escenarios para el sector energético en España 2030–2050. In Technical Report, Economics for Energy; Instituto de Investigación Tecnológica: Madrid, Spain, 2017; Available online: https://www.iit.comillas.edu/documentacion/informetecnico/IIT-17-189I/Escenarios%20para%20el%20sector%20energ%C3%A9tico%20en%20Espa%C3%B1a%202030-2050.pdf (accessed on 1 February 2025). (In Spanish)
  18. Deloitte, Una Transición Inteligente Hacia un Modelo Energético Sostenible Para España en 2050: La Eficiencia Energética y la Electrificación. 2018. (In Spanish). Available online: https://www.deloitte.com/content/dam/assets-zone2/es/es/docs/services/consulting/2023/Deloitte-ES-MonitorDeloitte-Modelo-energetico-Espana-2050.pdf (accessed on 1 February 2025).
  19. Comisión de Expertos de Transición Energética. Análisis y Propuestas Para la Descarbonización. Ministerio de Energía, Turismo y Agenda Digital. 2018. (In Spanish). Available online: http://www6.mityc.es/aplicaciones/transicionenergetica/informe_cexpertos_20180402_veditado.pdf (accessed on 1 February 2025).
  20. MITERD Plan Nacional Integrado de Energía y Clima 2021–2030. Ministerio para la Transición Ecológica y el Reto Demográfico. 2024. (In Spanish). Available online: https://www.miteco.gob.es/content/dam/miteco/es/energia/files-1/pniec-2023-2030/PNIEC_2024_240924.pdf (accessed on 1 February 2025).
  21. Das, K.; Murcia Leon, J.P.; Habbou, H.; Assaad, C.; Pérez-Rúa, J.-A.; Zhu, R.; Sørensen, P.E. HyDesign: A Tool For Design and Operation of Renewable Hybrid Renewable Plants. In Proceedings of the 21st Wind & Solar Integration Workshop, The Hague, The Netherlands, 12–14 October 2022. [Google Scholar] [CrossRef]
  22. Victoria, M.; Gallego-Castillo, C. Hourly-resolution analysis of electricity decarbonization in Spain (2017–2030). Appl. Energy 2019, 233–234, 674–690. [Google Scholar] [CrossRef]
  23. Gallego-Castillo, C.; Victoria, M. Improving Energy Transition Analysis Tool through Hydropower Statistical Modelling. Energies 2020, 14, 98. [Google Scholar] [CrossRef]
  24. Bonilla, J.; Blanco, J.; Zarza, E.; Alarcón-Padilla, D.C. Feasibility and practical limits of full decarbonization of the electricity market with renewable energy: Application to the Spanish power sector. Energy 2021, 239, 122437. [Google Scholar] [CrossRef]
  25. Santos-Alamillos, F.; Pozo-Vázquez, D.; Sánchez-Hernández, G.; Jiménez-Garrote, A.; López-Cuesta, M.; DeFelipe-García, S.; Ruiz-Arias, J.A.; Tovar-Pescador, J. Analysis of the optimal allocation of wind and solar PV capacities in a decarbonized power system in Spain using PyPSA. In Proceedings of the EGU General Assembly 2024, Vienna, Austria, 14–19 April 2024. [Google Scholar] [CrossRef]
  26. Basnet, S.; Deschinkel, K.; Le Moyne, L.; Péra, M.C. A review on recent standalone and grid integrated hybrid renewable energy systems: System optimization and energy management strategies. Renew. Energy Focus 2023, 46, 103–125. [Google Scholar] [CrossRef]
  27. Guidance on Designating Renewables Acceleration Areas Accompanying the Document Commission Recommendation on Speeding up Permit-Granting Procedures for Renewable Energy and Related Infrastructure Projects {C(2024) 2660 final}—{SWD(2024) 124 final}. Available online: https://energy.ec.europa.eu/publications/guidance-designating-renewables-acceleration-areas_en (accessed on 27 March 2025).
  28. Ali, S.; Taweekun, J.; Techato, K.; Waewsak, J.; Gyawali, S. GIS based site suitability assessment for wind and solar farms in Songkhla, Thailand. Renew. Energy 2019, 132, 1360–1372. [Google Scholar] [CrossRef]
  29. Sekeroglu, A.; Erol, D. Site selection modeling of hybrid renewable energy facilities using suitability index in spatial planning. Renew. Energy 2023, 219, 119458. [Google Scholar] [CrossRef]
  30. Subagyo; Yanuar, J.P.M.; Bambang, P.N.; Saleh, A.; Akhmad, F.W. The Suitable Location for a Hybrid Renewable Energy Wind-Solar Power Plant: A Review by Bibliometric. In IOP Conference Series: Earth and Environmental Science; IOP Publishing: Bristol, UK, 2023; Volume 1266, p. 012090. [Google Scholar] [CrossRef]
  31. Rekik, S.; El Alimi, S. Optimal wind-solar site selection using a GIS-AHP based approach: A case of Tunisia. Energy Convers. Manag. X 2023, 18, 100355. [Google Scholar] [CrossRef]
  32. Oh, M.; Kim, C.K.; Kim, B.; Kim, H.-G. A novel model to estimate regional differences in time-series solar and wind forecast predictability across small regions: A case study in South Korea. Energy 2024, 291, 130284. [Google Scholar] [CrossRef]
  33. Wu, H.; West, S.R. Co-optimisation of wind and solar energy and intermittency for renewable generator site selection. Heliyon 2024, 10, e26891. [Google Scholar] [CrossRef] [PubMed]
  34. Díaz-Cuevas, P.; Domínguez-Bravo, J.; Prieto-Campos, A. Integrating MCDM and GIS for renewable energy spatial models: Assessing the individual and combined potential for wind, solar and biomass energy in Southern Spain. Clean Technol. Environ. Policy 2019, 21, 1855–1869. [Google Scholar] [CrossRef]
  35. Osorio-Aravena, J.C.; Rodríguez-Segura, F.J.; Frolova, M.; Terrados-Cepeda, J.; Muñoz-Cerón, E. How much solar PV, wind and biomass energy could be implemented in short-term? A multi-criteria GIS-based approach applied to the province of Jaén, Spain. J. Clean. Prod. 2022, 366, 132920. [Google Scholar] [CrossRef]
  36. Torres-Pérez, M.; Peña Abreu, M.; Domínguez, J. Improvements to the IntiGIS Model Related to the Clustering of Consumers for Rural Electrification. In International Workshop on Artificial Intelligence and Pattern Recognition; Springer Nature: Berlin/Heidelberg, Germany, 2024; Volume 14335, pp. 260–272. [Google Scholar] [CrossRef]
  37. Vázquez, R.; Cabos, W.; Nieto-Borge, J.C.; Gutiérrez, C. Complementarity of offshore energy resources on the Spanish coasts: Wind, wave, and photovoltaic energy. Renew. Energy 2024, 224, 120213. [Google Scholar] [CrossRef]
  38. Available online: http://climax.inf.um.es/ (accessed on 19 March 2025).
  39. Jerez, S.; Barriopedro, D.; García-López, A.; Lorente-Plazas, R.; Somoza, A.M.; Turco, M.; Carrillo, J.; Trigo, R.M. An action-oriented approach to make the most of the wind and solar power complementarity. Earth’s Future 2023, 11, e2022EF003332. [Google Scholar] [CrossRef]
  40. Jiménez-Garrote, A.; Sánchez-Hernández, G.; López-Cuesta, M.; Pozo-Vázquez, D. SOWISP—A retrospective high spatial and temporal resolution database of the installed wind and solar PV power in Spain. Sol. Energy 2023, 256, 44–54. [Google Scholar] [CrossRef]
  41. Jiménez-Garrote, A.; Santos-Alamillos, F.J.; Sánchez-Hernández, G.; López-Cuesta, M.; Ruiz-Arias, J.A.; Pozo-Vázquez, D. Evaluation of a Database of the Spanish Wind Energy Resources Derived from a Regional Reanalysis. Energies 2024, 17, 1523. [Google Scholar] [CrossRef]
  42. Sánchez-Hernández, G.; Jiménez-Garrote, A.; López-Cuesta, M.; Galván, I.M.; Aler, R.; Pozo-Vázquez, D. A novel method for modeling renewable power production using ERA5: Spanish solar PV energy. Renew. Energy 2024, 240, 122120. [Google Scholar] [CrossRef]
  43. Ministerio Para la Transición Ecológica y el Reto Demográfico (MITECO). Zonificación Ambiental Para Energías Renovables: Eólica y Fotovoltaica. Available online: https://www.miteco.gob.es/es/calidad-y-evaluacion-ambiental/temas/evaluacion-ambiental/zonificacion_ambiental_energias_renovables.html (accessed on 19 March 2025).
  44. Klyve, Ø.S.; Olkkonen, V.; Nygård, M.M.; Lingfors, D.; Marstein, E.S.; Lindberg, O. Retrofitting wind power plants into hybrid PV–wind power plants: Impact of resource related characteristics on techno-economic feasibility. Appl. Energy 2024, 379, 124895. [Google Scholar] [CrossRef]
  45. Available online: https://windeurope.org/newsroom/press-releases/no-offshore-bids-in-denmark-disappointing-but-sadly-not-surprising/ (accessed on 19 March 2025).
  46. Plan de Desarrollo de la Red de Transporte de Energía Eléctrica Período 2021-2026. Available online: https://www6.serviciosmin.gob.es/Aplicaciones/Planificacion/PLAN_DESARROLLO_RdT_H2026_COMPLETO.pdf (accessed on 19 March 2025).
  47. Available online: https://map.neweuropeanwindatlas.eu/ (accessed on 19 March 2025).
  48. Available online: https://www.mapaeolicoiberico.com/ (accessed on 19 March 2025).
  49. Available online: https://globalwindatlas.info/ (accessed on 19 March 2025).
  50. Available online: https://sig.mapama.gob.es/geoportal/ (accessed on 19 March 2025).
  51. Available online: https://iea-wind.org/task50/ (accessed on 19 March 2025).
  52. Clark, C.E.; Barker, A.; King, J.; Reilly, J. Wind and Solar Hybrid Power Plants for Energy Resilience; National Renewable Energy Laboratory: Golden, CO, USA, 2022; NREL/TP-5R00-80415. Available online: https://www.nrel.gov/docs/fy22osti/80415.pdf (accessed on 19 March 2025).
  53. Gorman, W.; Rand, J.; Manderlink, N.; Cheyette, A.; Bolinger, M.; Seel, J.; Jeong, J.; Wiser, R. Hybrid Power Plants; Lawrence Berkeley National Laboratory: Berkeley, CA, USA, 2024; Available online: https://www.utilitydive.com/news/hybrid-power-plants-account-for-majority-of-proposed-us-solar-storage-capacity-LBNL/728582/#:~:text=Dive%20Brief%3A,a%20higher%20price (accessed on 19 March 2025).
  54. U.S. Department of Energy (DOE). Hybrid Energy Systems: Opportunities for Coordinated Research; National Renewable Energy Laboratory: Golden, CO, USA, 2021; DOE/GO-102021-5447. Available online: https://www.nrel.gov/docs/fy21osti/77503.pdf (accessed on 19 March 2025).
  55. Dykes, K.; King, J.; DiOrio, N.; King, R.; Gevorgian, V.; Corbus, D.; Blair, N.; Anderson, K.; Stark, G.; Turchi, C.; et al. Opportunities for Research and Development of Hybrid Power Plants; National Renewable Energy Laboratory: Golden, CO, USA, 2020; NREL/TP-5000-75026. Available online: https://www.nrel.gov/docs/fy20osti/75026.pdf (accessed on 27 March 2025).
  56. Available online: https://www.nrel.gov/wind/data-tools.html (accessed on 19 March 2025).
  57. Brown, M.; Cole, W.; Eurek, K.; Becker, J.; Bielen, D.; Chernyakhovskiy, I.; Cohen, S.; Frazier, A.; Gagnon, P.; Gates, N.; et al. Regional Energy Deployment System (ReEDS) Model Documentation; Version 2019; National Renewable Energy Laboratory: Golden, CO, USA, 2020; NREL/TP-6A20-74111. Available online: https://www.nrel.gov/docs/fy20osti/74111.pdf (accessed on 19 March 2025).
  58. Brown, A.; Beiter, P.; Heimiller, D.; Davidson, C.; Denholm, P.; Melius, J.; Lopez, A.; Hettinger, D.; Mulcahy, D.; Porro, G. Estimating Renewable Energy Economic Potential in the United States: Methodology and Initial Results; National Renewable Energy Laboratory: Golden, CO, USA, 2016. Available online: https://www.nrel.gov/docs/fy15osti/64503.pdf (accessed on 19 March 2025).
  59. Brinkman, G. Dominique Bain Grant Buster Caroline Draxl Paritosh Das Jonathan Ho Eduardo Ibanez et. In The North American Renewable Integration Study: A U.S. Perspective; National Renewable Energy Laboratory: Golden, CO, USA, 2021; NREL/TP-6A20-79224. Available online: https://www.nrel.gov/docs/fy21osti/79224.pdf (accessed on 19 March 2025).
  60. Available online: https://www.nrel.gov/analysis/naris.html (accessed on 19 March 2025).
  61. Brown, P.R.; Williams, T.; Brown, M.L.; Murphy, C. System-cost-minimizing deployment of PV-wind hybrids in low-carbon U.S. power systems. Appl. Energy 2024, 365, 123151. [Google Scholar] [CrossRef]
  62. Available online: https://hybrid-vindenergi.dtu.dk/about (accessed on 19 March 2025).
  63. Available online: https://iea-wind.org/wp-content/uploads/2022/01/Hybrid-wind-power-plants-research-at-DTU-Wind.pdf (accessed on 19 March 2025).
  64. Available online: https://orbit.dtu.dk/en/projects/optimized-design-and-operation-of-hybrid-power-plant (accessed on 19 March 2025).
  65. Koivisto, M. Correlations in Renewable Energy Sources (CorRES) A Time Series Simulation Tool for Variable Renewable Energy. DTU, 2022. Available online: https://corres.windenergy.dtu.dk/static/pdf/corres_about.pdf (accessed on 19 March 2025).
  66. Feitz, A.J.; Tenthorey, E.; Coghlan, R. Prospective Hydrogen Production Regions of Australia; Record 2019/15. Geoscience: Canberra, Australia, 2019. Available online: https://d28rz98at9flks.cloudfront.net/130930/Rec2019_015.pdf (accessed on 19 March 2025).
  67. Available online: https://d28rz98at9flks.cloudfront.net/130930/130930_Hydrogen_Production_Prospectivity_Scenario_1_map.pdf (accessed on 19 March 2025).
  68. Available online: https://re100.eng.anu.edu.au/heatmaps/ (accessed on 19 March 2025).
  69. Weber, T.; Blakers, A.; Firnando Silalahi, D.; Catchpole, K.; Nadolny, A. Grids dominated by solar and pumped hydro in wind-constrained sunbelt countries. Energy Convers Manag. 2024, 308, 118354. [Google Scholar] [CrossRef]
  70. Available online: https://github.com/TimWeberRE100/FIRM_Malaysia_Complex (accessed on 27 March 2025).
  71. Cheng, C.; Blakers, A.; Stocks, M.; Lu, B. 100% renewable energy in Japan. Energy Convers Manag. 2022, 255, 115299. [Google Scholar] [CrossRef]
  72. Timothy, W. (Research Officer at the Australian National University, Canberra, Australia). Personal communication, 19 May 2024.
  73. Ministry of New & Renewable Energy, India. National Wind-Solar Hybrid Policy. Available online: https://cdnbbsr.s3waas.gov.in/s3716e1b8c6cd17b771da77391355749f3/uploads/2022/12/2022122036.pdf (accessed on 19 March 2025).
  74. Available online: https://maps.niwe.res.in/resource_map/map/hybrid/ (accessed on 19 March 2025).
  75. von Krauland, A.-K.; Jacobson, M.Z. India onshore wind energy atlas accounting for altitude and land use restrictions and co-located solar. Cell Rep. Sustain. 2024, 1, 100083. [Google Scholar] [CrossRef]
  76. USAID; Ministry of Power. GREENINGTHEGRID: Pathways to Integrate 175 Gigawatts of Renewable Energy into India’s Electric Grid Vol, I.I. In Reg. Study. Available online: https://www.nrel.gov/docs/fy18osti/68744.pdf (accessed on 19 March 2025).
  77. Elkadeem, M.R.; Younes, A.; Jurasz, J.; AlZahrani, A.S.; Abido, M.A. A spatio-temporal decision-making model for solar, wind, and hybrid systems—A case study of Saudi Arabia. Appl. Energy 2025, 383, 125277. [Google Scholar] [CrossRef]
  78. Rey, A.S.-D.; Gil-García, I.C.; García-Cascales, M.S.; Molina-García, Á. Online Wind-Atlas Databases and GIS Tool Integration for Wind Resource Assessment: A Spanish Case Study. Energies 2022, 15, 852. [Google Scholar] [CrossRef]
  79. Guidance on Article 20a on Sector Integration of Renewable Electricity of Directive (EU) 2018/2001 on the Promotion of Energy from Renewable Sources, as Amended by Directive (EU) 2023/2413. Available online: https://energy.ec.europa.eu/document/download/efcd200c-b9ae-4a9c-98ab-73b2fd281fcc_en?filename=C_2024_5041_1_EN_ACT_part1_v10.pdf (accessed on 19 March 2025).
  80. Available online: https://energy-industry-geolab.jrc.ec.europa.eu/ (accessed on 27 March 2025).
  81. Available online: https://www.copernicus.eu/es (accessed on 27 March 2025).
  82. Ferres González, M.J. Elaboración del Mapa de Hibridación de Energía Eólica y Solar en España. Master’s Thesis, Universidad Complutense de Madrid, Madrid, Spain, 2021. Available online: https://hdl.handle.net/20.500.14352/5158 (accessed on 19 March 2025).
  83. Borsato, M. Assessment of Utility-scale Hybrid Systems, based on Wind and PV Plants, and Mapping of Potential Installation Sites in Spain. Master’s Thesis, Unuversita’ Degli Studi di Padova, Padua, Italy, 2024. Available online: https://hdl.handle.net/20.500.12608/66029 (accessed on 19 March 2025).
  84. Centro de Investigaciones Científicas y Medioambientales (CIEMAT). ADRASE—Acceso a Datos de Radiación Solar de España; Centro de Investigaciones Científicas y Medioambientales: Madrid, Spain, 2012. [Google Scholar]
  85. Available online: https://www.idee.es/csw-inspire-idee/srv/spa/catalog.search?#/metadata/spaignMDT200-2 (accessed on 27 March 2025).
  86. Available online: https://www.ign.es/web/resources/docs/IGNCnig/actividades/OBS/Programa_Marco_Copernicus_User_Uptake/9_Corine_Land_Cover.pdf (accessed on 27 March 2025).
  87. Available online: https://www.ign.es/resources/docs/IGNCnig/BTN/ESPBTN.pdf (accessed on 27 March 2025).
  88. Lindberg, O.; Arnqvist, J.; Munkhammar, J.; Lingfors, D. Review on power-production modeling of hybrid wind PVpower parks. J. Renew. Sustain. Energy 2021, 13, 042702. [Google Scholar] [CrossRef]
  89. Das, K.; Hansen, A.D.; Leon, J.P.M.; Zhu, R.; Gupta, M.; Pérez-Rúa, J.; Long, Q.; Pombo, D.V.; Barlas, A.; Gocmen, T.; et al. Research Challenges and Opportunities of Utility-Scale Hybrid Power Plants. WIREs Energy Environ. 2025, 14, e70001. [Google Scholar] [CrossRef]
  90. Available online: https://www.fcirce.es/en/services/hybridisation-renewable-generation-and-storage (accessed on 19 March 2025).
  91. Available online: https://issuu.com/tekniker/docs/ficha_besssizingtool_en (accessed on 19 March 2025).
  92. Available online: https://www.gevernova.com/power-conversion/solar-storage/flexiq (accessed on 19 March 2025).
  93. IEA Task 18 Off-Grid and Edge-of-Grid Photovoltaic Systems. Evaluation of Software Tools for Standalone Microgrid Design and Optimization. Available online: https://iea-pvps.org/wp-content/uploads/2024/03/IEA-PVPS-TASK-18-Report-Software-Tools-.pdf (accessed on 19 March 2025).
  94. Available online: https://www.ul.com/software/ultrus/homer-hybrid-energy-optimization (accessed on 19 March 2025).
  95. HOMER Front Web Manual. Available online: https://homerenergy.com/products/front/docs/1.0/index.html (accessed on 19 March 2025).
  96. Available online: https://ihoga.unizar.es/en/ (accessed on 19 March 2025).
  97. Available online: https://ihoga.unizar.es/Desc/MHOGAbroch.pdf (accessed on 19 March 2025).
  98. Available online: https://help.emd.dk/knowledgebase/content/windPRO3.6/c15-UK_WindPRO3.6-HYBRID.pdf (accessed on 19 March 2025).
  99. Available online: https://sam.nrel.gov/ (accessed on 27 March 2025).
  100. Blair, N.J.; DiOrio, N.A.; Freeman, J.M.; Gilman, P.; Janzou, S.; Neises, T.W.; Wagner, M.J. System Advisor Model (SAM) General Description; version 2017.9.5; National Renewable Energy Laboratory: Golden, CO, USA, 2018; NREL/ TP-6A20-70414. Available online: https://www.nrel.gov/docs/fy18osti/70414.pdf.Blair (accessed on 19 March 2025).
  101. Available online: https://sam.nrel.gov/software-development-kit-sdk/pysam.html (accessed on 19 March 2025).
  102. Available online: https://samrepo.nrelcloud.org/help/hybrid_systems.html (accessed on 19 March 2025).
  103. Ripp, C.; Guittet, D.; King, J.; Barker, A. A simplified, efficient approach to hybrid wind and solar plant site optimization. Wind. Energ. Sci. 2022, 7, 697–713. [Google Scholar] [CrossRef]
  104. Tripp Charles, E.; Guittet, D.; Aaron, B.; Jennifer, K.; Bill, H. Hybrid Optimization Performance Platform (HOPP) Computer Software; USDOE Office of Energy Efficiency and Renewable Energy (EERE), Renewable Power Office. Wind Energy Technologies Office: Washington, DC, USA. Available online: https://github.com/NREL/HOPP (accessed on 27 March 2025).
  105. Kotarbinski, M.; McDowell, B.; Katz, J.; Starke, G.; Riccobono, N. A 2023 Perspective: What Is the Value of Hybridization? National Renewable Energy Laboratory : Golden, CO, USA, 2024; NREL/TP-5000-87824. Available online: https://www.nrel.gov/docs/fy24osti/87824.pdf (accessed on 19 March 2025).
  106. Available online: https://topfarm.pages.windenergy.dtu.dk/hydesign/ (accessed on 19 March 2025).
  107. Habbou, H.; Leon, J.P.M.; Das, K. Profitability of hybrid power plants in European markets. In WindEurope Annual Event 2023; Nejad, A.R., Ed.; IOP Publishing: Bristol, UK, 2023; Volume 2507, p. 012009. [Google Scholar] [CrossRef]
  108. Aghaloo, K.; Ali, T.; Chiu, Y.R.; Sharifi, A. Optimal site selection for the solar-wind hybrid renewable energy systems in Bangladesh using an integrated GIS-based BWM-fuzzy logic method. Energy Conv. Manag. 2023, 283, 116899. [Google Scholar] [CrossRef]
  109. Tarife, R.; Nakanishi, Y.; Zhou, Y.; Estoperez, N.; Tahud, A. Integrated GIS and Fuzzy-AHP Framework for Suitability Analysis of Hybrid Renewable Energy Systems: A Case in Southern Philippines. Sustainability 2023, 15, 2372. [Google Scholar] [CrossRef]
  110. Khalid, A.M. Performance ratio—Crucial parameter for grid connected PV plants. Renew. Sustain. Energy Rev. 2016, 65, 1139–1158. [Google Scholar] [CrossRef]
  111. García-Bustamante, E.; González-Rouco, J.F.; Jiménez, P.A.; Navarro, J.; Montávez, J.P. A comparison of methodologies for monthly wind energy estimation. Wind. Energ. 2009, 12, 640–659. [Google Scholar] [CrossRef]
  112. Vestas Wind Systems, EnVentus Platform Brochure, Vestas. 2025. Available online: https://www.vestas.com/content/dam/vestas-com/global/en/brochures/onshore/EnVentus_Platform_Brochure.pdf.coredownload.inline.pdf (accessed on 19 March 2025).
  113. Enevoldsen, P.; Jacobson, M.Z. Data investigation of installed and output power densities of onshore and offshore wind turbines worldwide. Energy Sustain. Dev. 2021, 60, 40–51. [Google Scholar] [CrossRef]
  114. International Renewable Energy Agency (IRENA). Renewable Technology Innovation Indicators: Mapping Progress in Costs, Patents and Standards; International Renewable Energy Agency (IRENA): Abu Dhabi, United Arab Emirates, 2022; Available online: https://www.irena.org/-/media/Files/IRENA/Agency/Publication/2022/Mar/IRENA_Tech_Innovation_Indicators_2022_.pdf (accessed on 19 March 2025).
  115. Pexapark European PPA Market Outlook 2024. Available online: https://pexapark.com/european-ppa-market/ (accessed on 19 March 2025).
  116. Internation Energy Agency (IEA). Electricity Market Report 2023; Internation Energy Agency (IEA): Paris, France, 2023; Available online: https://iea.blob.core.windows.net/assets/255e9cba-da84-4681-8c1f-458ca1a3d9ca/ElectricityMarketReport2023.pdf (accessed on 19 March 2025).
  117. National Renewable Energy Laboratory. 2021 Cost of Wind Energy Review; NREL: Golden, Colorado, 2022. Available online: https://www.nrel.gov/docs/fy23osti/84774.pdf (accessed on 19 March 2025).
  118. National Renewable Energy Laboratory. U.S. Solar Photovoltaic System and Energy Storage Cost Benchmarks, with Minimum Sustainable Price Analysis: Q1 2022; NREL: Golden, Colorado, 2022. Available online: https://www.nrel.gov/docs/fy23osti/87303.pdf (accessed on 19 March 2025).
Figure 1. The nodal distribution of new wind (18,000 MW, blue wind turbines) and solar PV (19,000 MW, yellow suns) generation in the REE study scenario [46].
Wind 05 00016 g001
Figure 2. The hybridization factor by site across the US for the site-cost-/LCOE-minimizing model [61].
Wind 05 00016 g002
Figure 3. A general scheme of the methodology used for the simplified example [83].
Wind 05 00016 g003
Figure 4. Hybrid suitability index (elaboration from [83]).
Wind 05 00016 g004
Figure 5. The empirical linear relationship between the yearly average wind speed and annual energy production for a V150 6 MW wind turbine (elaboration from [112]).
Wind 05 00016 g005
Figure 6. The IRR with an evacuation capacity of 10 MW and a PPA price of 75 EUR/MWh (elaboration from [83]).
Wind 05 00016 g006
Table 1. A summary of some LTES analyses in Spain.
Characteristic/ModelPRIMESAEECEPSAGreenpeaceITTDeloitteExperts CommissionNECP
Wind installed power in 2030 (GW)30404726.6% 13484 23162
Solar PV installed power in 2030 (GW)25252912.35% 1164076
References[13,14][14][15][16][17][18][19][20]
PRIMES: Price-Induced Market Equilibrium System Model; AEE: Spanish Wind Association; CEPSA: Spanish Oil Company; ITT: Institute for Research in Technology (U.P. Comillas). 1 For a “low-demand and medium-renewable” scenario. This refers to the percentage of the total demanded energy generated by the technology. 2 For the “high-electric-efficiency” scenario. It includes hydraulic, wind, solar PV, and solar thermal renewable generation.
Table 2. A summary of the activities in Spain.
ActivityCategoriesPotentialTemp. Resol.Spatial Resol.Refs.
LTESGeoProduct CostNetworkResTechEconMarket
Table 1××××××YearlyCountry (NUTS1)See Table 1
PyPSA-Spain×××HourlyUp to 100 nodes, NUTS3[11]
CLIMAX××××××Monthly30 km[38,39]
SOWISP×××××MonthlyNUTS3[40]
RetroDB ×××××Hourly5 km/NUTS3[41]
SHIRENDA_PV×××××HourlyNUTS3[42]
MITECO×××××Hourly25 m[43]
REE (TSO)×HourlyNode[46]
Proposed map×Hourly1 kmThis work
Table 3. A summary of the CorRES tool’s main characteristics.
CharacteristicWindSolar
Weather reanalysis dataERA 5ERA 5
Spatial resolution10 × 10 km210 × 10 km2
For a higher spatial resolutionGlobal Wind AtlasERA5-Land
Temporal resolutionHourlyHourly
For a higher temporal resolutionStochastic simulation-
Conversion into power generationPower curve + PyWakePV-Lib
Forecast errorFlexible forecast horizonsBeta version
Table 4. Geographic and thematic layers used for the suitability map presented in Section 5.
Data LayersType of FileSourceResolution or Scale
Monthly average daily solar irradiation (kWh/m2)RasterSolar radiation data from Spain—ADRASE (CIEMAT) [84] 5000 m × 5000 m
Monthly average wind speed (m/s)RasterSimulation with a weather research and forecasting model (CIEMAT)1000 m × 1000 m
Digital Terrain Model (DTM)RasterDigital Terrain Model—MDT200 2nd coverage (IGN) [85]200 m × 200 m
Land coverVector (polygons)CORINE Land Cover 2018 (IGN) [86]1:100,000
Urban and rural residential areasVector (polygons)Settlement and construction data for National Topographic Base BTN100 (IGN) ([87])1:100,000
AirportsVector (polygons) Data provided by AENA (Aeropuertos Españoles y Navegación Aérea)-
Road transport networkVector (lines)Transport data of National Topographic Base BTN100 (IGN)1:100,000
CoastlineVector (lines)Geographic reference information—coastline (IGN)1:100,000
Electrical gridVector (lines)Energy and conduction data for National Topographic Base BTN100 (IGN)1:100,000
Electric power plantVector (polygons)Energy and conduction data for National Topographic Base BTN100 (IGN)1:100,000
Electrical substationVector (points)Energy and conduction data for National Topographic Base BTN100 (IGN)1:100,000
Environmental sensibility for PV and windRasterEnvironmental zoning for renewable energies: wind and photovoltaic (MITECO) [43]25 m × 25 m
Table 5. Comparison of commercial tools.
ToolFeasibility StudyPhysical LayoutOptimization
HOMER® Front
MHOGA
windPRO✓ (wind)
Table 6. Comparison of open-source tools.
Model/ToolSAM/PySAMHOPPHyDesign
Developer NREL NRELDTU
WeatherSolar: NSRDB
Wind: wind toolkit
SAMERA5, GWA
Wind Power PlantSAM’s wind power model (includes wake)FLORISSurrogate model (includes wake)
PV Power PlantPVWATTSPVWATTSGeneric 1 MW plant
EMS✓ (battery)
FinancialPPA, single owner, merchantSAMPV: simple model
Wind: WISDEM
Battery: simple model
Grid, BOS, land
Optimization
Programming frameworkSSC/PythonPythonPython—OpenMDAO
Reference[101]/[103][105][107]
Table 7. The analyzed criteria for the PV–wind hybrid suitability map.
ParametersGIS Processing
(ED = Euclidean Distance)
BooleanFuzzy Membership Function
Annual average daily solar irradiation (kWh/m2)Calculated using Map Algebra as an average from the monthly global daily irradiation data-Linear increasing
Annual average wind speed (m/s)Calculated using Map Algebra as an average from the monthly wind speed data-Linear increasing
Ground elevation (m)Reclassified elevation data from MDT200Exclusion > 1500 m-
Ground inclination (degree)Generated slope from MDT200Exclusion > 15°Linear decreasing (inclination ≤ 15°)
Land coverReclassified CORINE Land Cover classes [82,83] --
Distance from urban and rural residential areas (m)The ED from residential area polygons-Linear increasing
Distance from rivers and surface water (m)-Exclusion results of
MITECO
-
Distance from airports (m)The ED from airport polygonsExclusion > 7000 m-
Distance from the road network (m)The ED from road lines-Linear decreasing
Distance from the coastline (m)The ED from the coastline-Linear increasing
Distance from the electrical grid (m)The ED from the electrical grid lines-Linear decreasing
Distance from electric power plants (m)The ED from power plant polygons-Linear decreasing
Distance from electrical substations (m)The ED from electrical substation points-Linear decreasing
Environmental sensibility for PV and wind-Exclusion results of the MITECO analystWeighted result of the MITECO analyst
Table 8. The values of the parameters for the model case simulation.
ParameterUnitWind Solar PVReferences
Discount rate%7%7%[116]
Unitary CapEXM€/MW1.40 0.92[117]
Unitary OpEXM€/MW-year0.0370.015[118]
Disclaimer/Publisher’s Note: The statements, opinions and data contained in all publications are solely those of the individual author(s) and contributor(s) and not of MDPI and/or the editor(s). MDPI and/or the editor(s) disclaim responsibility for any injury to people or property resulting from any ideas, methods, instructions or products referred to in the content.

