Article

System-Level Offshore Wind Energy and Hydrogen Generation Availability and Operations and Maintenance Costs

Department of Electrical and Electronic Engineering, University of Strathclyde, 204 George Street, Glasgow G1 1XW, UK
*
Author to whom correspondence should be addressed.
Wind 2024, 4(2), 135-154; https://doi.org/10.3390/wind4020007
Submission received: 29 January 2024 / Revised: 9 April 2024 / Accepted: 13 May 2024 / Published: 21 May 2024

Abstract

:
With the current trends of wind energy already playing a major part in the Scottish energy supply, the capacity of wind farms is predicted to grow exponentially and reach further depths offshore. However, a key challenge that presents itself is the integration of large producing assets into the current UK grid. One potential solution to this is green hydrogen production, which is being heavily researched in industry, with many concepts being investigated for large-scale purposes. However, the operations and maintenance (O&M) costs and availability of green hydrogen systems need to be quantified to ensure economical and technical viability, which is sparse in the available literature. The study presented in this paper investigated the availability and O&M costs of coupled wind–hydrogen systems by attempting to quantify the failure rates, repair times, repair costs and number of technicians required for key green hydrogen components. This study also utilised an O&M model created by the University of Strathclyde, which uses Monte Carlo Markov chain simulations to produce the O&M outputs. A number of assumptions were made throughout the study in relation to the O&M model inputs, and the baseline availability for the coupled wind–hydrogen system was 85.24%. Whilst the wind turbine still contributed a major part to the downtime seen in the simulations, the combined hydrogen system also contributed a significant amount, a total of 37%, which could have been due to the technology readiness levels of some the components included in the hydrogen system.

1. Introduction

Wind energy is playing a major role in the future energy supply, in particular offshore wind, which is forecasted to increase exponentially in the upcoming decades. Wind power has already become an important actor for the Scottish electricity network, which produced a total of 27,762 GWh for the year 2022 [1]. Both onshore and offshore wind will be vital for the decarbonisation targets that the Scottish government policy details, and the route to market for these projects to supply electricity to the grid is already well established [2]. However, there is growing interest from the public and private sectors to explore the potential of large-scale hydrogen production from offshore wind; this is highlighted in the Offshore Renewable Energy Catapult (OREC) Offshore Wind and Hydrogen Report, which states that up to 240 GW of offshore wind can be deployed in the UK for the purpose of green hydrogen production [3].
There are numerous reasons why green hydrogen could complement offshore wind during the energy transition, with one reason being to deal with the variability of the wind. For the UK to achieve net zero emissions in 2050, a minimum of 75 GW of offshore wind is likely required [3]. Integrating this high level of offshore wind into the UK electricity network will be challenging due to the supply and demand nature of the grid. Therefore, by generating green hydrogen at periods of curtailment, a new energy vector can be introduced to the grid whilst removing the variability of wind [4,5]. On the other hand, green hydrogen can also be used to support the grid during periods of high demand and low renewable supply, such as cold spells in winter with low wind [6].
Whilst offshore wind and hydrogen coupled systems are being explored at potential Scotwind sites, a robust business case needs to be produced by wind farm developers in order to ensure a successful final investment decision. One of the key inputs to this business case would be O&M modelling to assess the viability and feasibility of the system from an operational perspective. When considering O&M modelling, inputs such as failure rates, repair times and repair costs are somewhat available in the current literature when considering pure-play wind energy systems. However, similar inputs are yet to be explored for coupled hydrogen systems. The aim of this study was to determine the required O&M and availability inputs for a coupled offshore wind and hydrogen system. Inputs were determined by a review of the past literature, synthesised with available data or other structured techniques. Once suitable inputs were generated, an O&M model created at the University of Strathclyde was utilised to determine the availability and O&M costs for a given wind–hydrogen coupled system.
When discussing the feasibility of offshore hydrogen, it is usually discussed from the perspective of capital costs and the stack efficiency of the electrolyser. The novelty of this study was that the feasibility of hydrogen was examined from an O&M perspective for the first time, detailing the impact on availability and overall O&M costs of a combined offshore wind and hydrogen production system. This study also attempted to quantify failure rates, repair times and repair costs for offshore hydrogen equipment, which is scarcely seen in the current literature and was also considered novel in this study. The contents of this paper are listed below:
  • Section 2 provides a brief review of existing data sources within hydrogen process safety;
  • Section 3 discusses the methodology used within this study, including the methodology for determining the reliability inputs for the modelling;
  • Section 4 presents the O&M outputs obtained from the model;
  • Section 5 discusses the results seen from the O&M model whilst providing insight into areas of future work;
  • Section 6 concludes the work with key findings.

2. Review of Existing Data Sources

Currently, there are few data sources that provide sufficient information to competently execute quantitative risk analysis. Below is a brief review of the current data sources that are available for hydrogen process safety analysis that could potentially be used for hydrogen O&M modelling:
  • H2Tools Lessons Learnt;
  • European Commission Hydrogen Incident and Safety Database;
  • National Renewable Energy Laboratory (NREL) Composite Data Products (CDPs);
  • Centre for Hydrogen Safety Failure Rate Database (CHS).
The Offshore and Onshore Reliability Data (OREDA) bank was also used in this study as a data source and is described in brief below.

2.1. H2Tools Lessons Learnt

H2Tools Lessons Learnt is a publicly available database in which anonymous users can submit safety events and near misses related to hydrogen [7]. The main purpose of this database is to distribute lessons learned from previous hydrogen incidents in an attempt to inform industry and prevent similar accidents from happening again. As of September 2023, there were 223 reports that can be filtered from contributing factors, such as design flaws or human error; consequences, such as property damage to loss of life; equipment involved, such as piping, valves, storage and electrolyser; and probable causes [8,9]. As such, the data collected on these events are mostly qualitative, in which risks are associated with a particular hazard. Whilst this may be useful for high-level qualitative risk analysis, it does not provide enough information to produce meaningful reliability data for quantitative risk analysis, and therefore, hydrogen O&M modelling.

2.2. Hydrogen Incident and Accident Database

The Hydrogen Incident and Accident Database was developed by the International Association for Hydrogen Safety and is similar to H2Tools, in which anonymous users can submit safety events and near misses related to hydrogen; the database is now maintained by the European Commission Joint Research Commission [7]. As of September 2023, the database contained 694 hydrogen incident and near miss reports, with events occurring as far back as 1937. The data entry mostly covers the details and nature of the event, the operating conditions at the time of the incident and the consequences of the incident; this is similar to H2Tool but perhaps more descriptive in nature [10]. Again, whilst the data collected on these events may be useful for high-level qualitative risk analysis, they do not provide enough information to produce meaningful reliability data that are useable for this study in the context of hydrogen O&M modelling. It should be noted that the reporting to this database is quite infrequent, with only 15 events being reported in the years 2022 and 2023.

2.3. NREL Composite Data Products

NREL collects O&M data from 44 commercial hydrogen stations operating in the USA, in which the data are aggregated across the multiple systems that make up the fuelling stations and published twice a year as a composite data product [11]. Because of the commercial nature of the hydrogen fuelling stations, some of the data produced are proprietary and not available in the public domain. However, the CDPs that NREL have produced are publicly available and are intended to guide and lead future research and innovation in hydrogen technology [7]. The fuelling stations are under a contractual obligation to report station O&M data to NREL, which is collected at regular intervals [7]. NREL collects a variety of data that ranges from fill performance to hydrogen quality, but most pertinent to this study is the failure, repair and maintenance data that the CDP produces. Whilst these data falls short of producing tangible failure rates for common hydrogen system components, it does provide data of the repair times seen within the system, which could be used for this analysis. Overall, the NREL CDPs have some useful inputs when considering the study presented in this paper, but does not provide all the inputs needed.

2.4. Centre for Hydrogen Safety Failure Rate Database

The Centre for Hydrogen Safety is currently developing a hydrogen equipment and component failure rate database that is currently in the data collection phase [7]. The main purpose of this database is to collect O&M data from private companies and formulate failure rates specific to common components used in hydrogen production to enhance quantitative risk analysis for hydrogen fuelling stations [12]. As of the present, the CHS provides a data entry form for eligible hydrogen fuel station operators that they can submit; the form contains data entry fields such as equipment type, downtime, loss mass and failure mode [7]. However, at its current stage, the database is a long way from being usable, but once it is operational, it will provide a significant step forward in hydrogen quantitative data collection, and therefore, hydrogen O&M modelling.

2.5. OREDA

Due to the sparse nature of the hydrogen reliability literature at present, it is extremely difficult to obtain or calculate failure rates and availability figures based on the past literature. Therefore, an alternative method was used to estimate the failure rates for hydrogen system components that cannot be found in literature. OREDA is a project organisation with between 7 and 11 oil and gas companies that have been operational for 35 years [13]. The main purpose of OREDA is to provide a comprehensive data bank of reliability data collected on topside and subsea equipment used in offshore operations; it is extremely useful for reliability data used in quantitative risk analysis. More specifically, it can provide failure rates for common offshore components, like compressors, pumps and valves; this can be used to synthesise failure rates for hydrogen systems by modelling them as a series of these components. The fifth edition of the OREDA data bank was published in 2015 and was used for this study.
Another data source that was used for this study was the guidelines for process equipment reliability data handbook, which provides failure rates for common components used in process and chemical systems [14]. Whilst similar to the OREDA bank in purpose, it should be noted that only one edition of this handbook was published in 1989, rendering it extremely outdated. Therefore, this handbook was used as a secondary source to the OREDA bank, along with Perry’s Chemical Engineer Handbook, which can also provide useful equipment reliability data [15].

3. Methodology

The methodology consisted of five key tasks considered within this study:
  • A plant map of a representative coupled wind–hydrogen system was created based on the literature;
  • O&M modelling inputs for the components described in the above task were determined;
  • Where O&M modelling inputs were not available in the past literature, OREDA was used to synthesise the inputs or other structured techniques similar to the methodology used in [16] were utilised;
  • Generated inputs in the O&M model developed by the University of Strathclyde were used to determine the baseline availability and O&M costs for the given coupled wind–hydrogen system;
  • A sensitivity analysis was conducted for the inputs with the highest uncertainty.

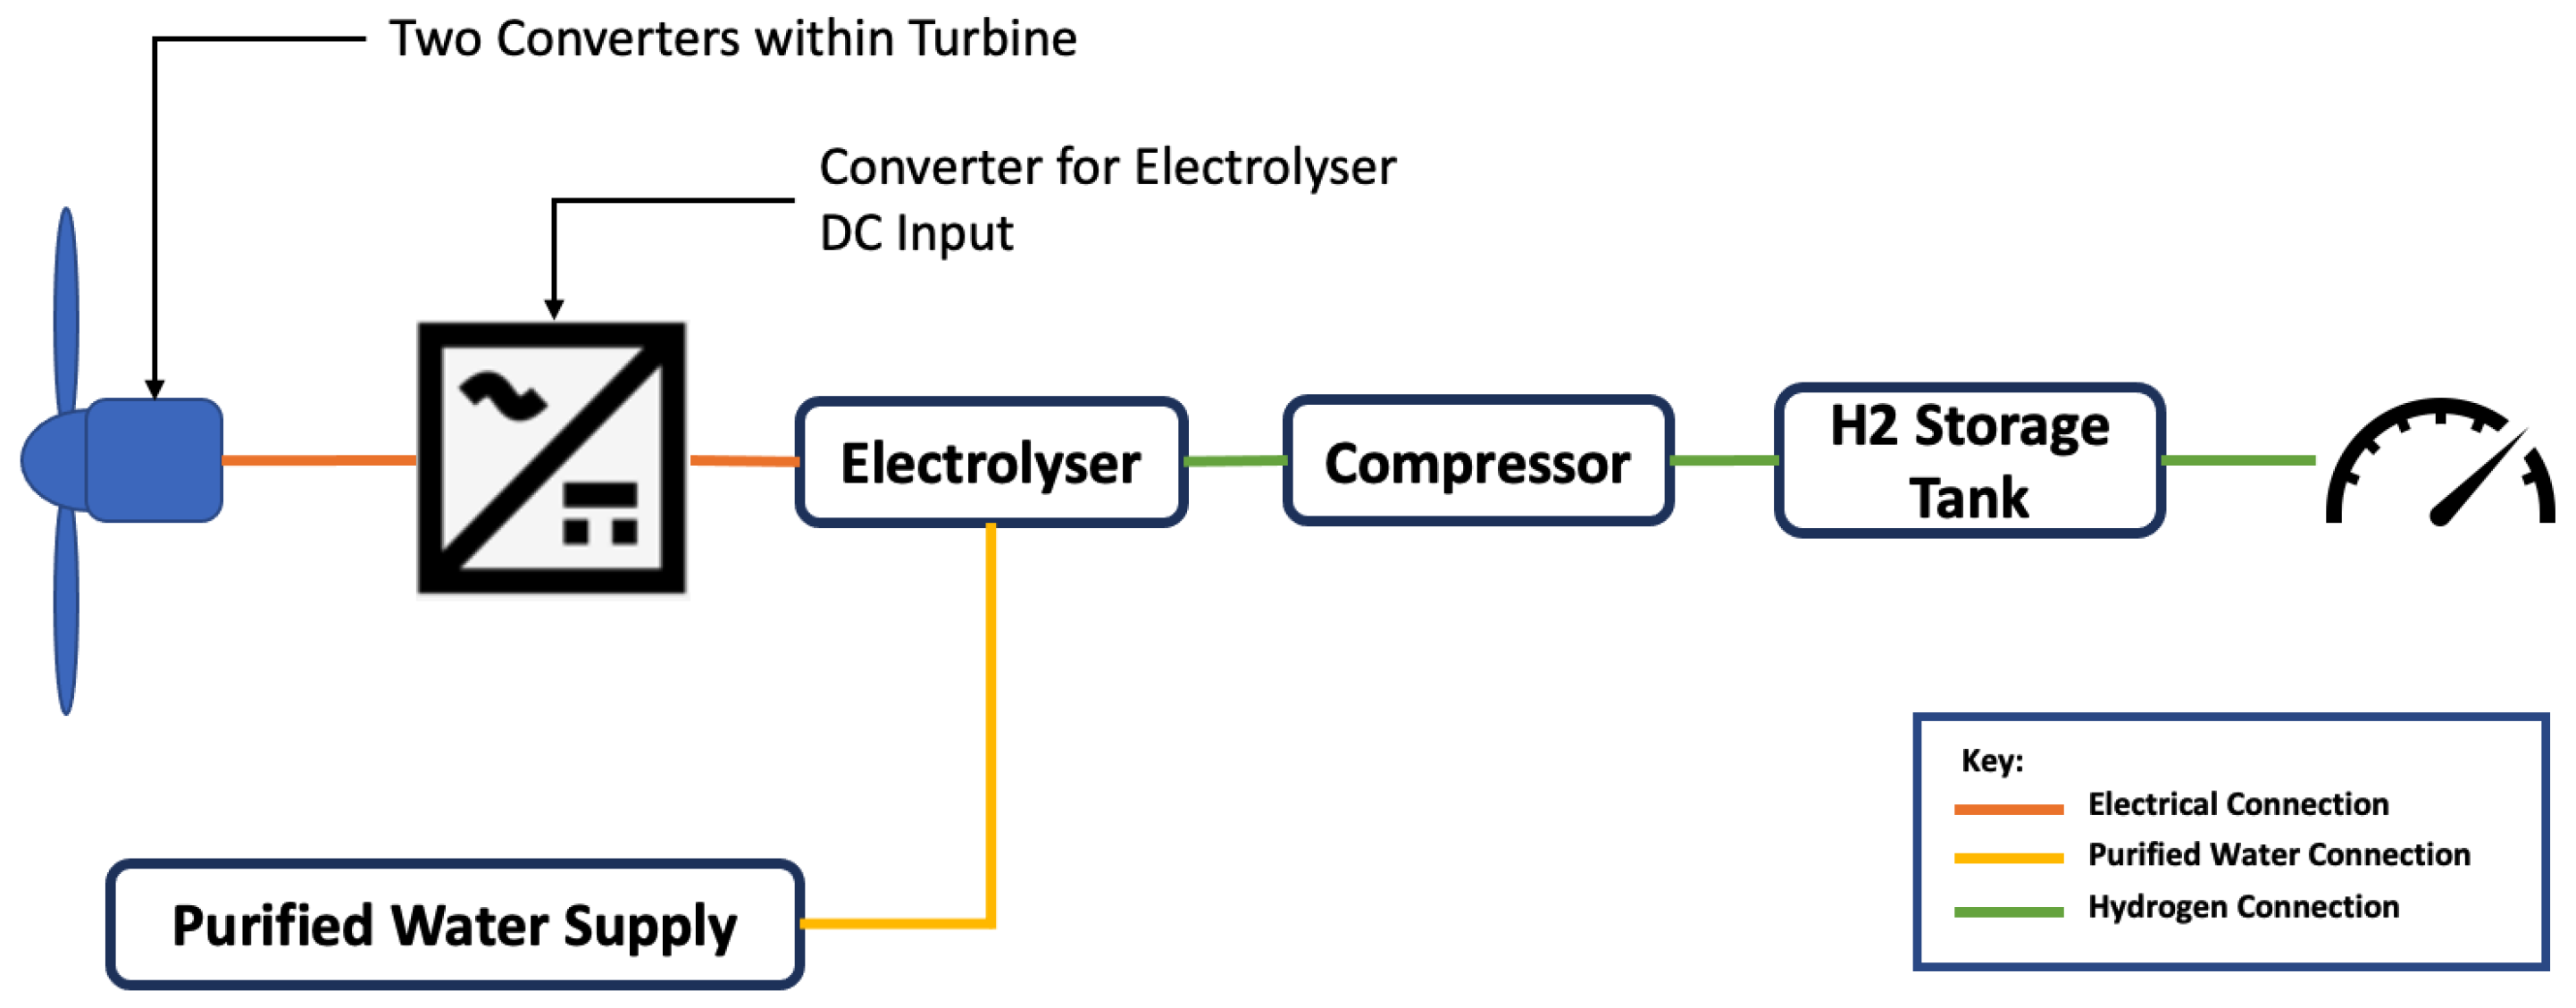
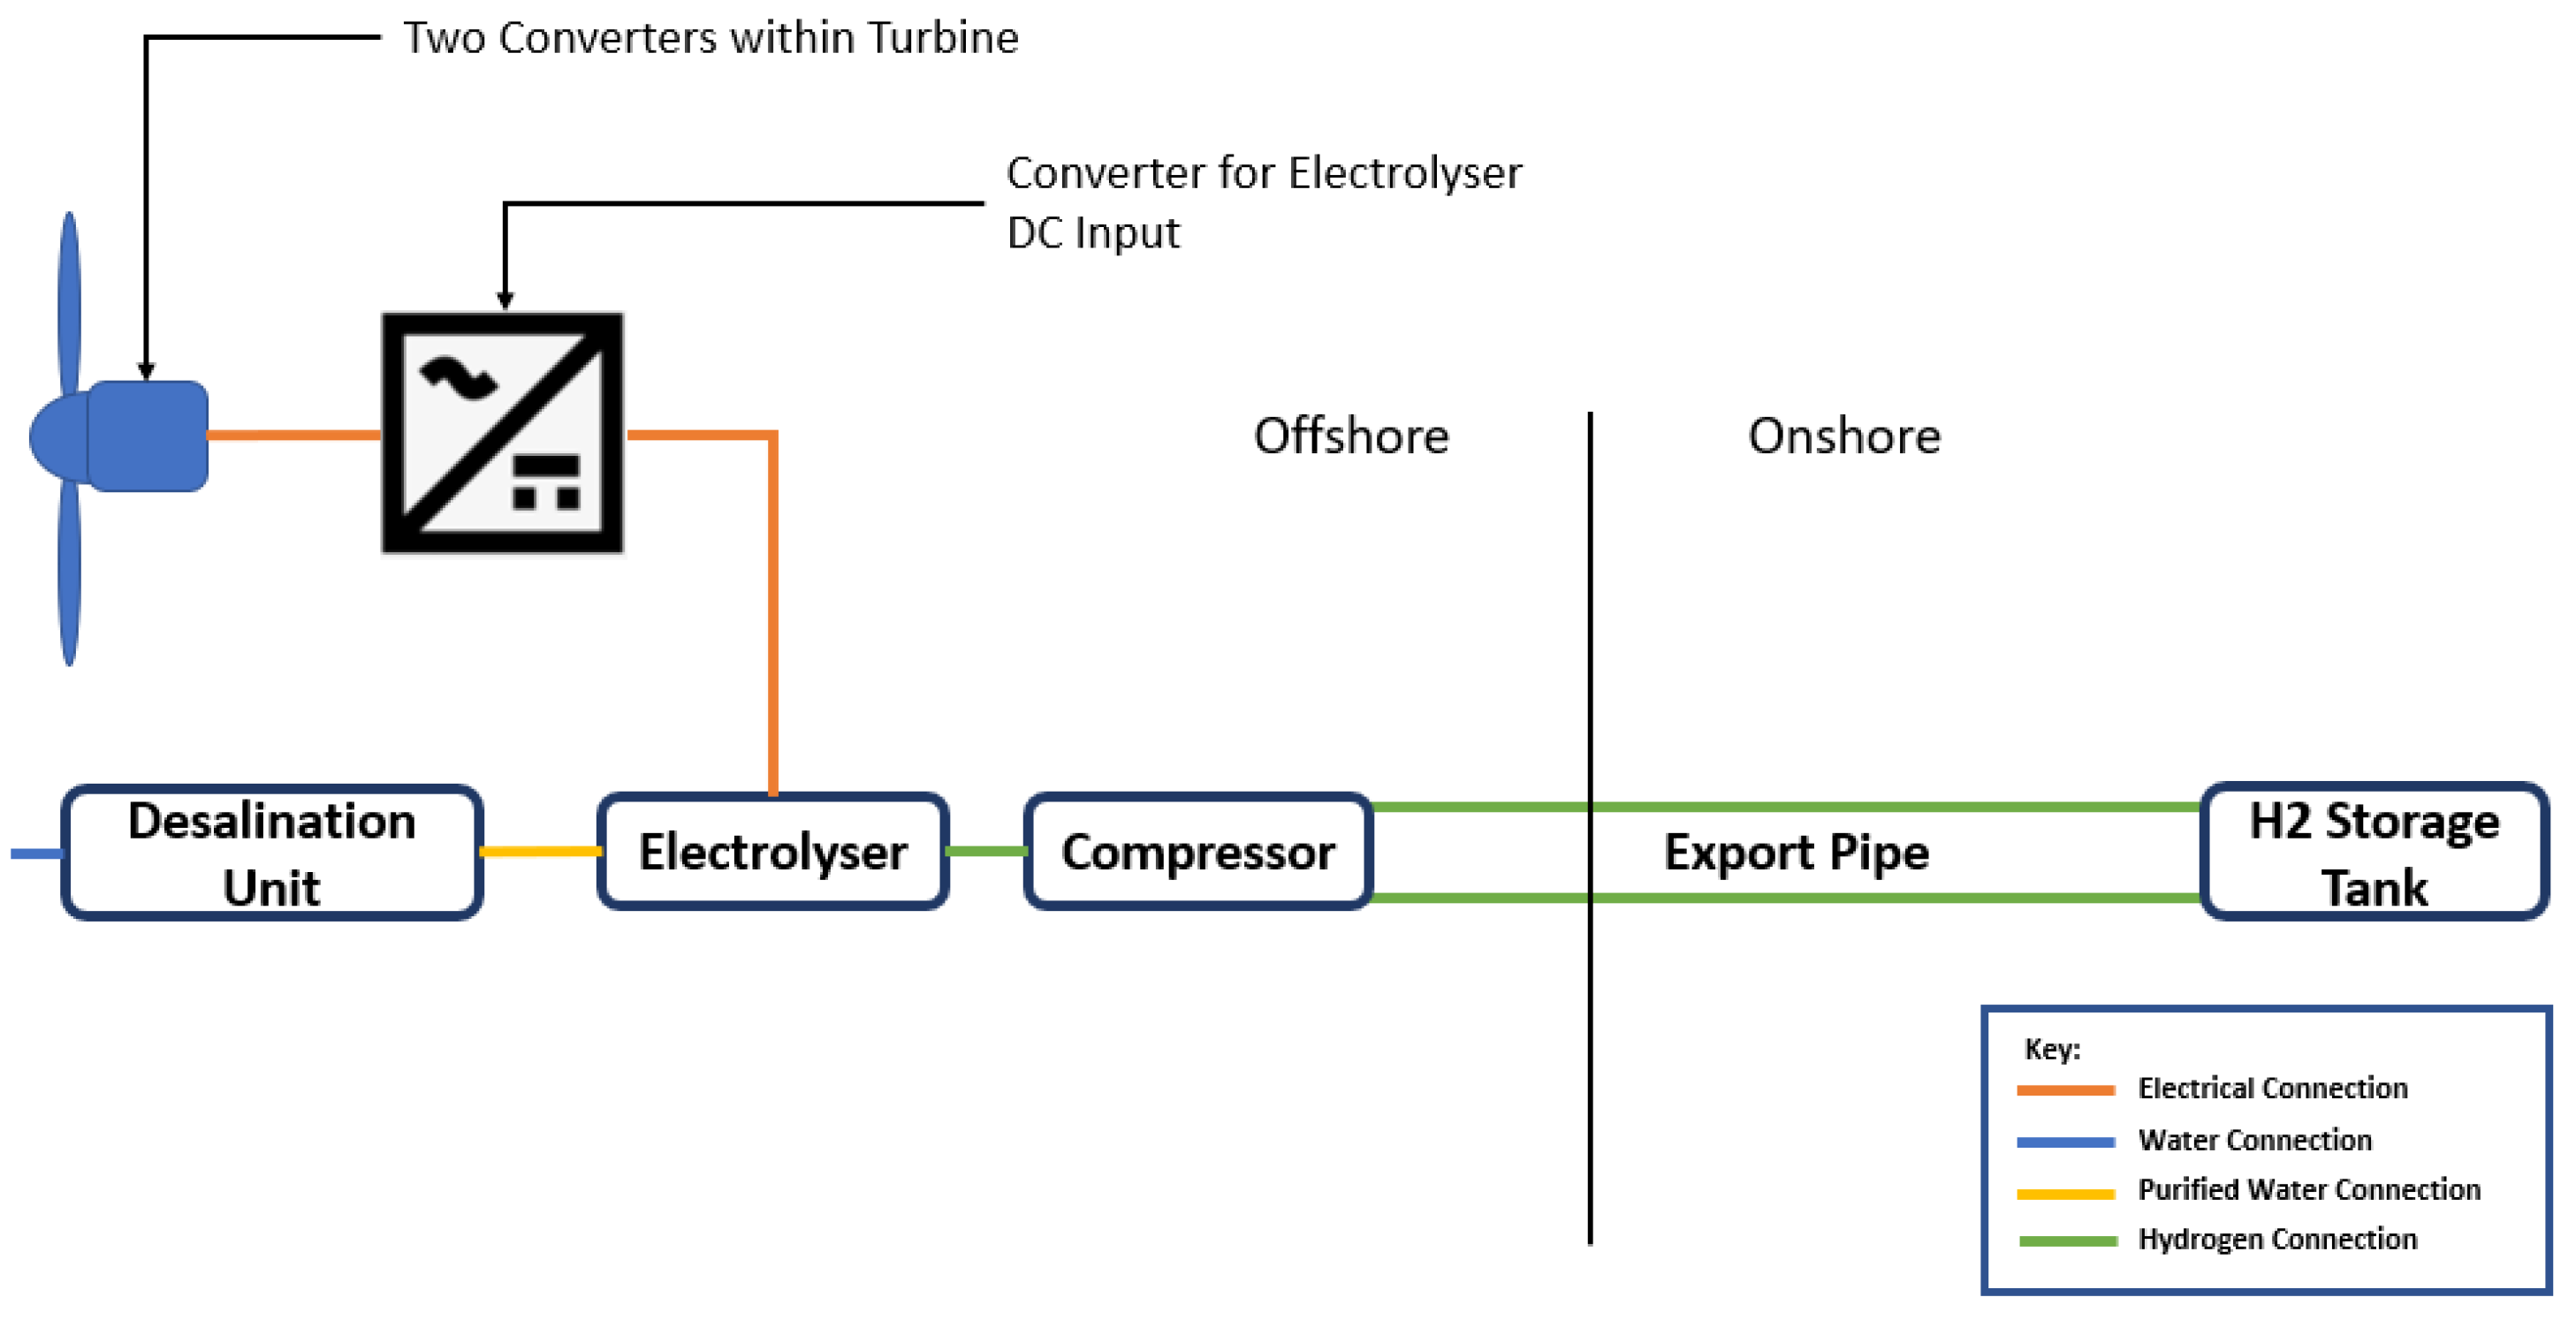
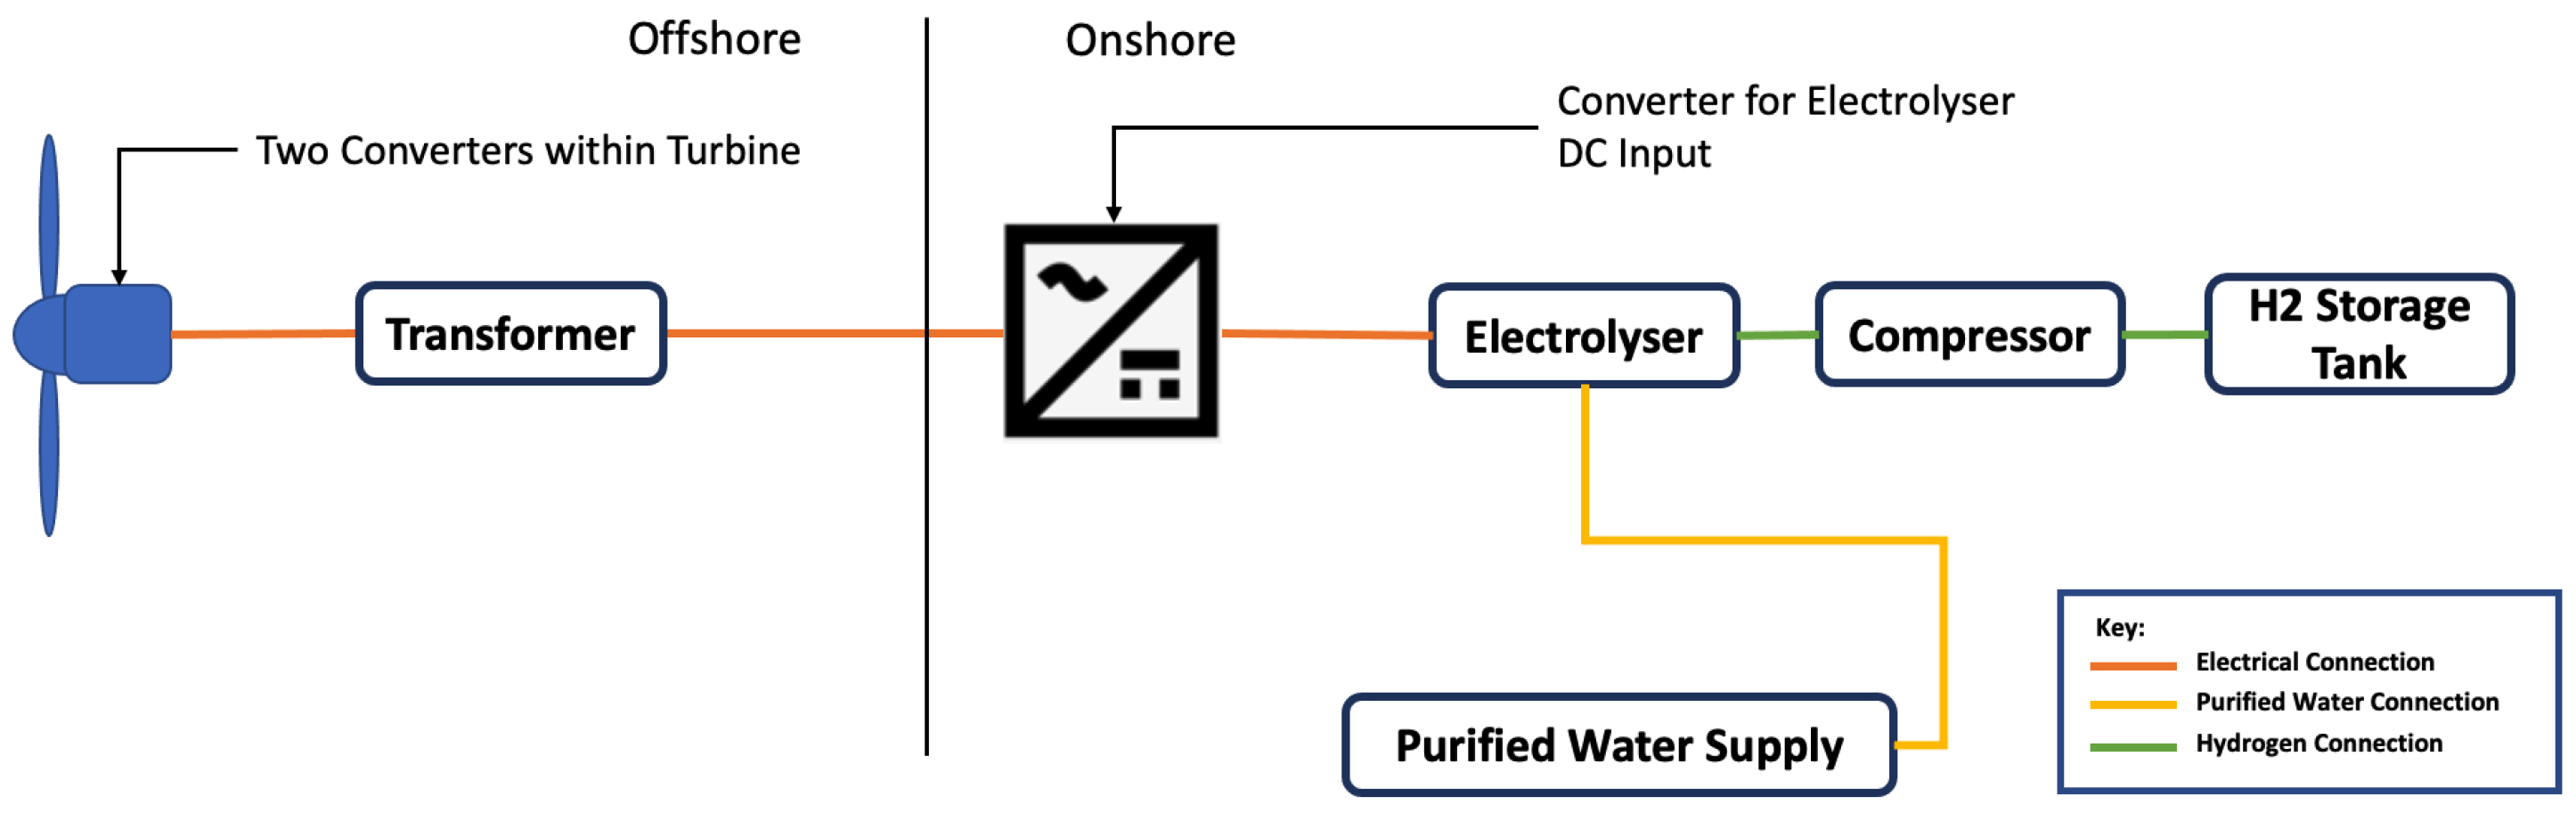
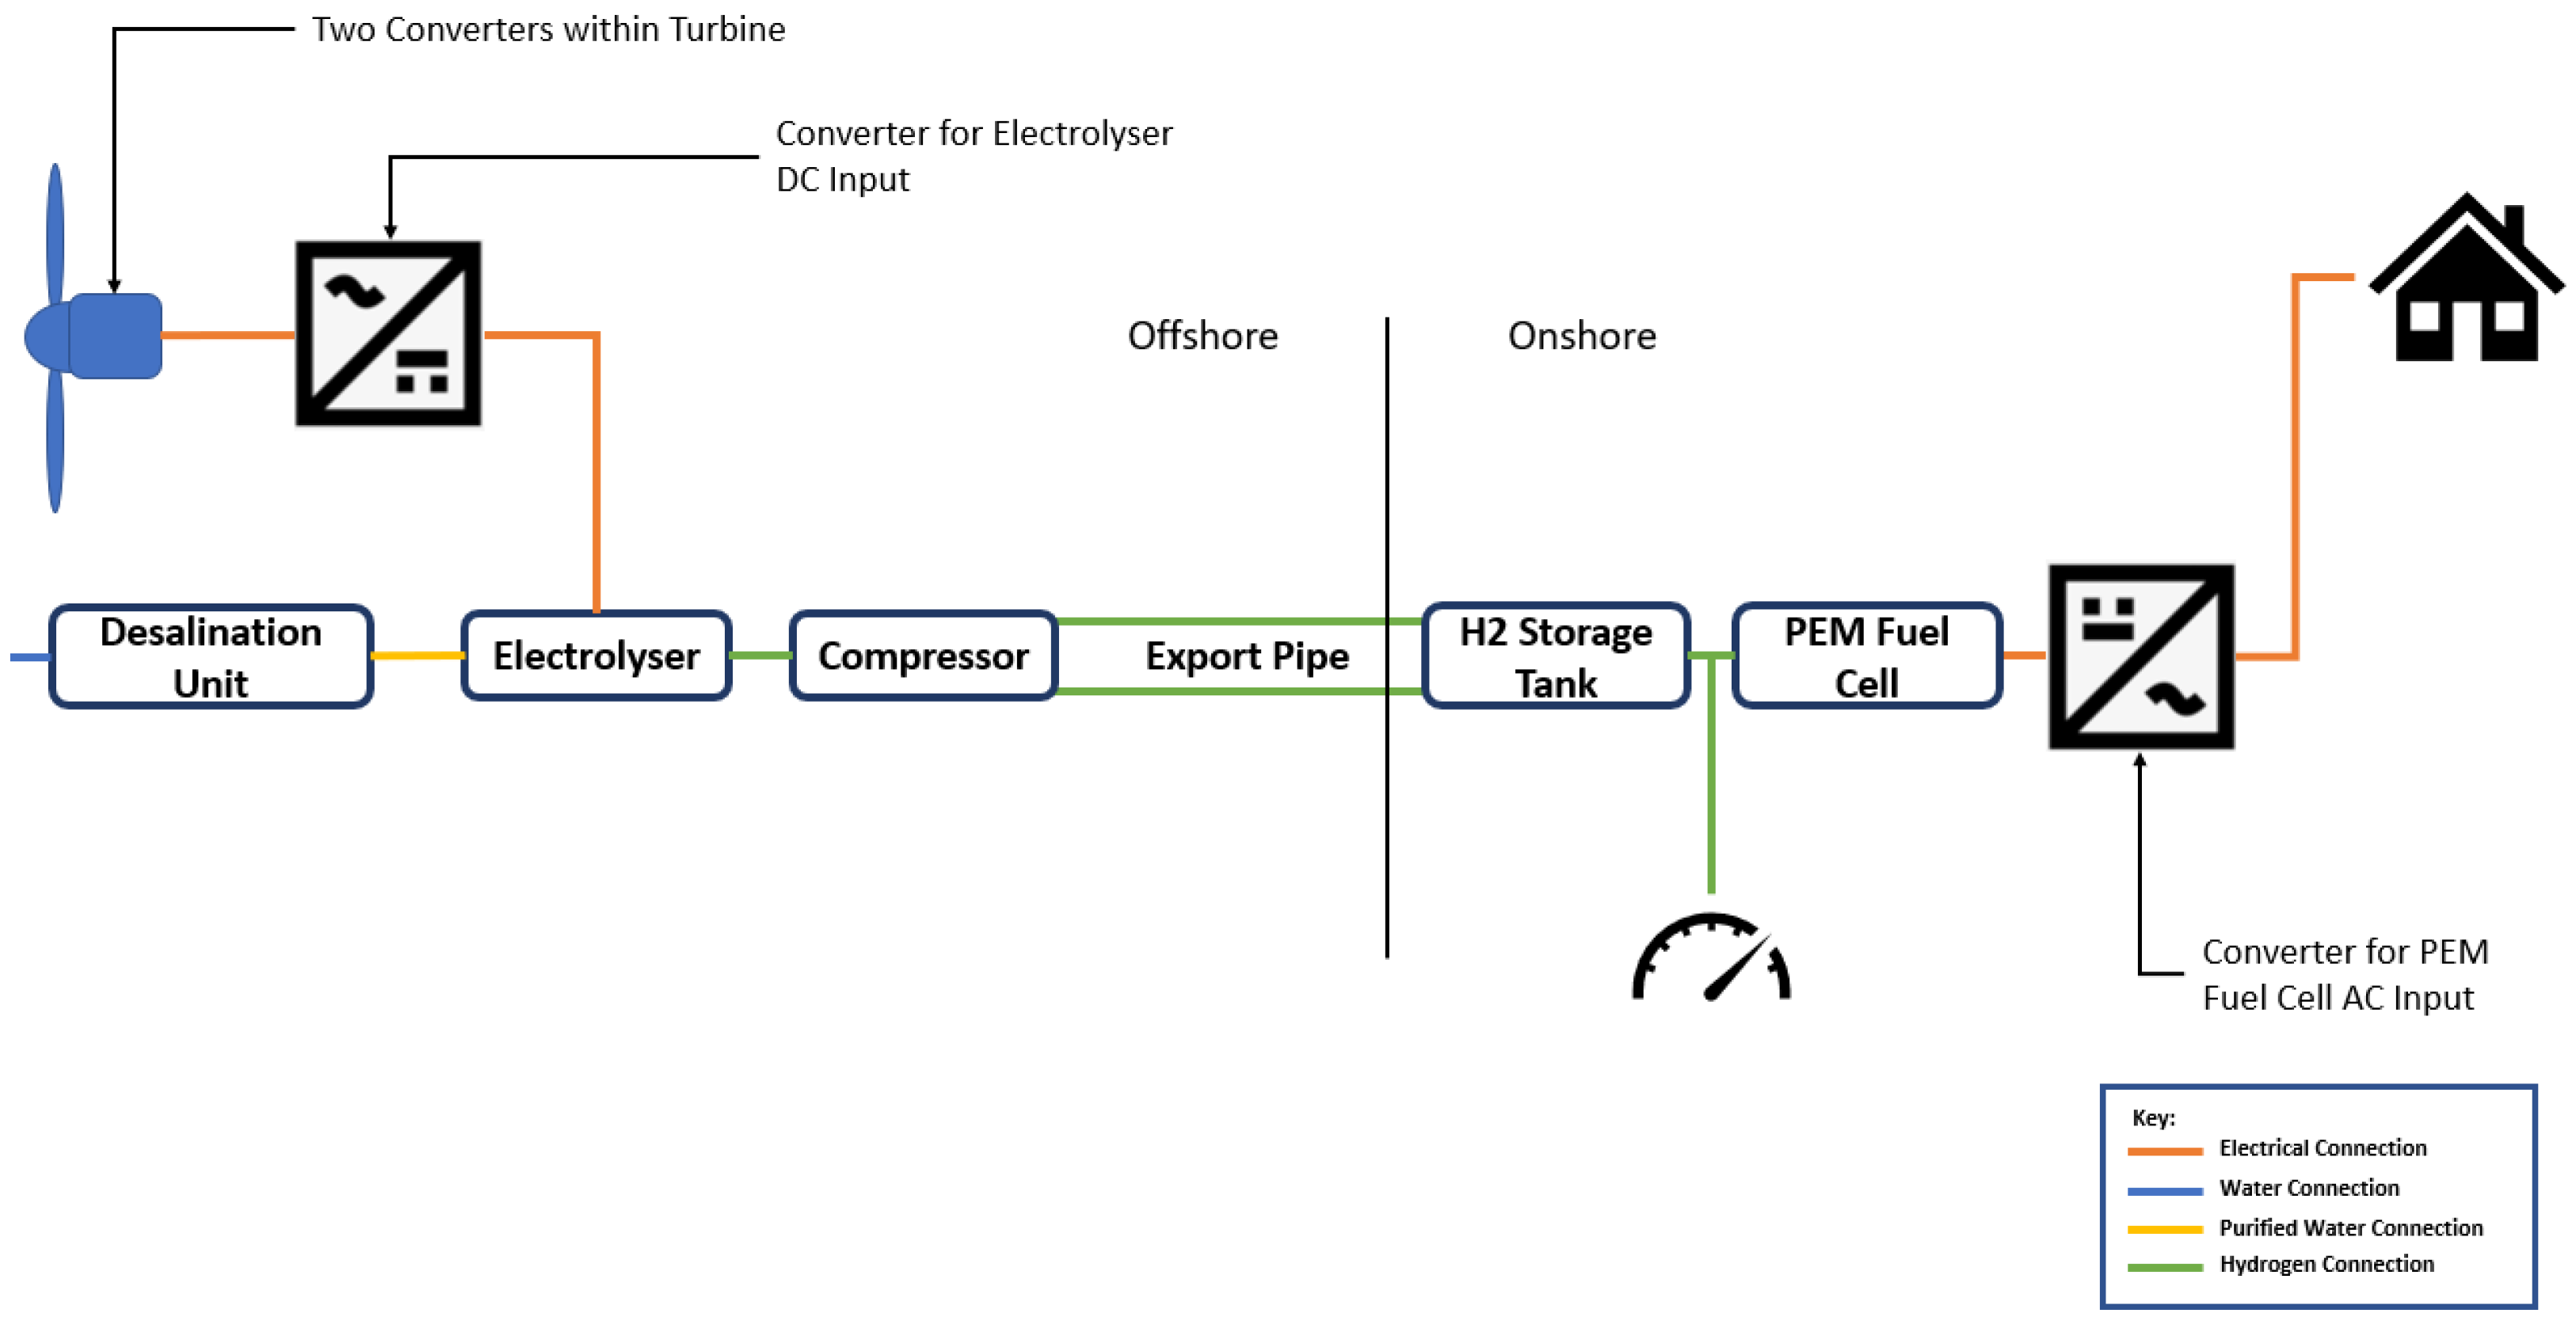
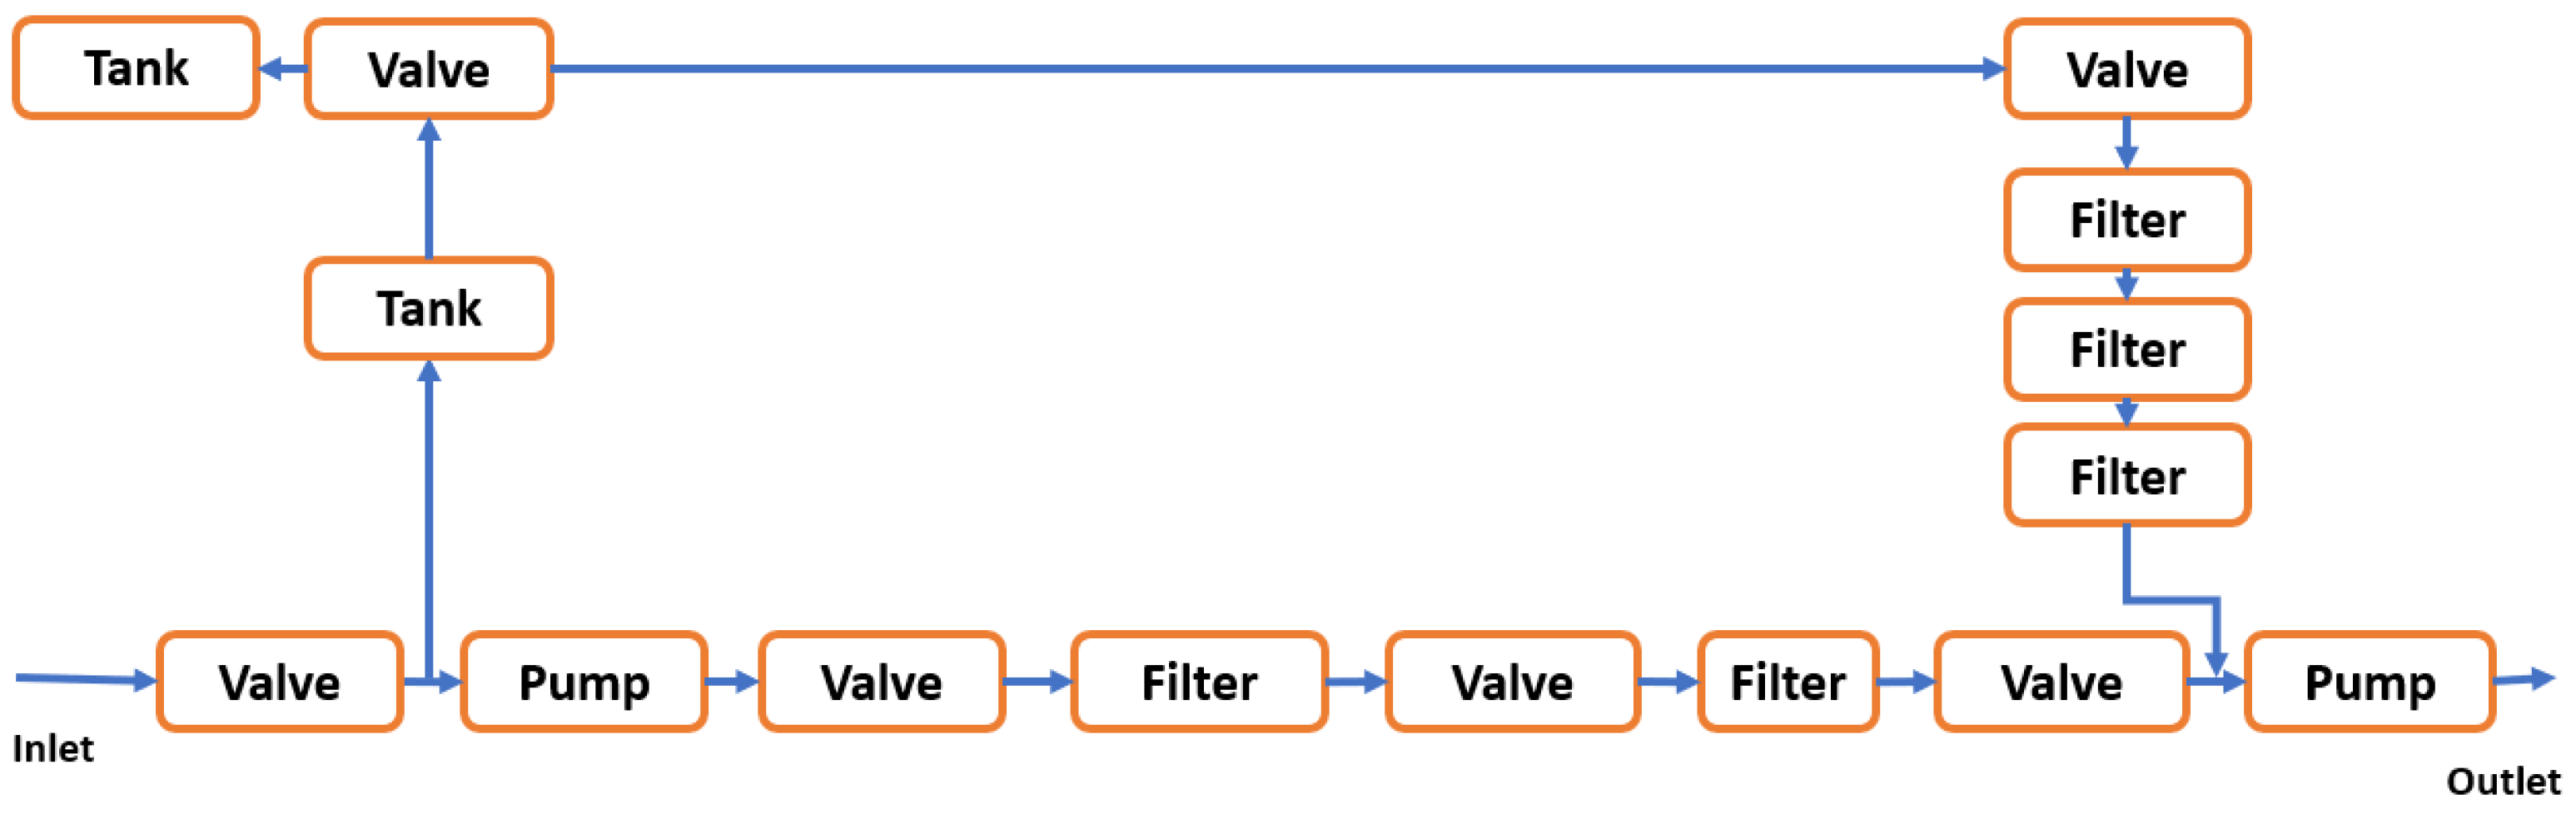
3.1. Hydrogen Plant Map

To conduct the O&M modelling for a given wind–hydrogen system, a plant map needed to be created to define what system components were considered within this study. To do this, various commercial projects were analysed to determine the system at the component level. More specifically, the following projects were considered whilst being complemented by the case studies presented in [17,18,19]:
  • Siemens Gamesa Brande;
  • ERM Dolphyn;
  • Ørsted Gigastack.
Siemens Gamesa Brande has been in operation since 2021, where it produces green hydrogen directly from an onshore wind farm to power taxis that operate within Copenhagen [20]. Whilst the size of the Brande hydrogen project is modest and is purely based onshore, it provides an example and starting point of what components create a wind–hydrogen system.
For a full description of the Brande project, the reader is referred to [20]. As can be seen in Figure 1, the Brande hydrogen systems can be described in terms of three main components: an electrolyser, compressor and storage tank. It should be noted that currently, this setup uses an alkaline electrolyser, in which two electrodes operate in an alkaline electrolyte solution to split the hydrogen from its oxygen counterpart. However, the white paper produced by Siemens Gamesa states that proton exchange membrane (PEM) electrolysers are the preferred method for producing offshore hydrogen, where the two electrodes are separated by a gas-tight polymer membrane that allows positively charged H ions to pass, but no electrons [20]. The reason for PEM electrolysis being the preferred method is due to the efficiency and lifespan of the technology. However, alkaline electrolysis is a relatively mature technology, which is why it is the most dominant method at present, but suffers from a relatively short lifespan due to the corrosive alkaline electrolyte solution that it operates in [21]. A storage tank is utilised to store any hydrogen produced from the alkaline electrolyser, with a compressor ensuring the hydrogen is the correct pressure for the vessel. The final component of the system is the dispenser, which provides a connection point to Brande’s commercial partner Everfuel to transfer the hydrogen from storage to the trailer; by that point, Everfuel can distribute the hydrogen to numerous fuelling stations located in Copenhagen. Clearly, a dispenser would not be a requirement for offshore hydrogen production, and therefore, it was excluded from this study.
However, arguably the most ambitious coupled offshore wind–hydrogen project currently in development is ERM Dolphyn. Once in operation, it aims to provide 4 GW of floating offshore wind via 400 10 MW turbines, which will be purely dedicated to producing hydrogen [22]. Currently, the project is in scaled-down trials, with the aim of design verification, and aims to be fully operational in the 2030s.
For a full description of the Dolphyn project, the reader is referred to [22]. The components that make up the ERM Dolphyn project are seen in Figure 2. The system utilises seawater as the water source required for PEM electrolysis. However, before this can be used, the salt and other impurities need to be removed from the H2O via a desalination unit (DSU). The DSU utilises reverse osmosis filters to purify the seawater, rendering it useful for electrolysis [23]. This concept is based on a moored floating offshore substructure, where the main components of the system will sit; however, an additional component will be the export pipeline, which will also consist of a flexible riser [23]. It is also assumed that an export compressor will be required for the pipeline subsystem to maintain the line pressure. Finally, another major project within offshore wind–hydrogen systems is Gigastack, which is a collaboration led by Ørsted. For a full description of the Gigastack project, the reader is referred to [24]. This project differs from the other two, as the hydrogen production is conducted onshore at Humber refinery, whilst the wind power required for electrolysis still remains offshore at Hornsea Two, which is the world’s largest offshore wind farm to date [24]. Phase 2 was recently completed and has taken the feasibility stage concepts through front-end engineering design for a 100 MW electrolyser system, which aims for a production date of late 2025; the project is currently at the final investment decision stage [24]. Whilst the key equipment, such as the electrolyser and storage tank, are still included within the system, the desalination unit was removed, as a freshwater supply is utilised instead. The system setup can be seen in Figure 3.
Considering the above three coupled wind–hydrogen systems, a plant map was generated to describe the components considered for this study, which can be seen in Figure 4. It should be noted that offshore hydrogen production is preferred due to the apparent cost savings and lower complexity [25,26]; therefore, offshore hydrogen production was modelled, instead of offshore wind exporting to onshore hydrogen production, as shown in the Gigastack project. A PEM fuel cell was added at the end of the system for home consumption purposes.
Overall, the system consisted of a desalination unit, electrolyser, export compressor, storage tank and PEM fuel cell.

3.2. O&M Model Inputs

For each component, the model requires the repair time, repair costs, number of technicians and failure rate; this was further discretised to include minor repairs, major repairs and major replacements. However, the literature is very sparse when it comes to coupled wind–hydrogen systems in terms of the required inputs of the model; therefore, some assumptions and other structured techniques were utilised, as described in the following sections. It should be noted that the O&M inputs for the wind turbine itself were already obtained via the previous work of O&M researchers at the University of Strathclyde [16,27,28,29]. The rating of the turbine was 3 MW and consisted of the following components:
  • Generator;
  • Gearbox;
  • Converter;
  • Rest of the turbine;
It should be noted, however, that the converter input of the model also accounted for the required converters for the hydrogen system, as well as the converters of the wind turbine. Furthermore, each turbine component was broken down into different failure classes: minor repair, major repair and major replacement. This was to done to give the model more fidelity regarding the failure behaviour of turbine components. Therefore, in an attempt to keep the fidelity high for the coupled wind–hydrogen system modelled in this study, the hydrogen components were also broken down into the three failure classes. The location of the wind farm was set to 50 km from the coastline of North-East Scotland and consisted of 100 turbines, which was done in a similar study that looked into the availability and O&M costs of different drive trains [27]. This could provide a useful comparison between offshore wind farms with and without coupled hydrogen systems. It should be noted that determining the number of technicians required to repair the hydrogen system failures was extremely difficult due to the lack of literature. However, ref. [30] states that for every MW of the wind–hydrogen system, 2 technicians should be assigned to the repairs of the system. Since the system in this study was 3 MW, this study suggests that 6 technicians are required for the maintenance of the hydrogen system; this was used as the value for the number of technicians in major replacements. Furthermore, according to the good practices documents provided by the G+ Global Offshore Wind Health Organisation, for offshore wind repair works, it was recommended that at least two technicians work together at all times, especially when working from height [31]. Based on these two values, the number of technicians required for the hydrogen system was determined for minor repairs, major repairs and major replacements via interpolation; therefore, the number of technicians input was kept the same for all hydrogen components.
It should also be noted that each component within the hydrogen system will consist of instrumentation that ensures safe operation of the system. This could be, for example, pressure and temperature gauges. Whilst this was considered for the storage tank, export compressor and desalination unit components of the system, it was not considered for the electrolyser and fuel cell due to the scarcity of data. Furthermore, it is believed that these instrumentation sub-components will likely have a negligible impact on the failure rates, and subsequently, the downtime on the components, and therefore, had a minimal impact on the results presented within this paper.

3.2.1. Electrolyser

In terms of the electrolyser, values for failure rates were obtained from the literature and extrapolation due to the sparse literature. Ref. [32] states that for a PEM electrolyser, a major replacement in terms of the stack takes place every 85,000 h, which was confirmed by [30,33]. Minor and major failure rates were then extrapolated by looking at the trends of how other failure rates of turbine components increase with the severity of failure. Historical failure data were obtained via the previous work of O&M researchers from the University of Strathclyde, which are inclusive of gearbox, generator and converter components of the turbine [34]. From the data obtained from wind turbine failures, it was found that a minor repair failure was 5.4181 times more likely to occur than a major replacement. Similarly for the major repair failure, it was found from the same dataset that a major repair failure was 2.8555 more likely to occur than a major replacement.
In terms of the repair costs, ref. [30] states that the cost of the electrolyser is expressed as £263,351.9/MW, which is also similar to refs. [35,36,37]. Scaling up to to 3 MW, as per the turbine used in this model, equated to a CAPEX cost of £790,053.57. Furthermore, ref. [37] states that the repair cost of the PEM electrolyser for a major replacement would cost approximately 32% of the CAPEX cost for a stack replacement. The costs for minor and major repairs were then determined by looking at the trends of how other repair costs of turbine components increase with the severity of failure, and the values were extrapolated from this. It was found that the minor repair cost for the electrolyser costs approximately 0.26% of the major replacement cost based on the same historical failure dataset used to extrapolate the failure rates. Similarly, for the major repair cost of the electrolyser, it was found from the same dataset that the major repair cost was 5.87% of the major replacement cost.
The NREL CDPs were then used to obtain the repair times for the electrolyser [38]. The mean time to repair the compressor for all failures was five hours and was used to quantify the time for the electrolyser major repairs. The times for minor and major replacements were then determined by looking at the trends of how other repair times of turbine components increase with the severity of failure, and the values were again extrapolated from this. It was found that the minor repair time for the electrolyser took 26.94% of the major repair time based on the same historical failure dataset used to extrapolate the failure rates. Similarly, for the major replacement time of the electrolyser, it was found from the same dataset that the major replacement time was 3.3342 greater than the major repair time. Table 1 shows the O&M inputs for the electrolyser.

3.2.2. Desalination Unit

Due to the recent nature of green hydrogen in terms of technology, there is very little in the literature regarding the desalination unit, especially when considering failure rates. Therefore, the failure rates for this component were synthesised via OREDA. The desalination unit was modelled as described in Figure 5 as a series of pumps, valves, tanks and filters, which was based on the model produced in ref. [39]. The failure rate for each sub-component was obtained by defining a failure mode as a minor repair, major repair or major replacement. For example, a filter has a failure mode of blockage with a failure rate of 0.0117384 per year [13]. Whilst this blockage is critical to the functioning of the filter, it was classed as a minor repair, as it does not take long to correct this failure when taking into account the whole system.
This system is then resolved to an average failure rate for minor repairs, major repairs and major replacement by using Equation (1):
λ = i n λ i
where lambda is the failure rate, n is the number of components in the system and i is the failure rate for a specific component. Regarding the repair times for desalination units, NREL CDPs provide repair times for key hydrogen-producing equipment inclusive of the DSU [38]. The mean time to repair the DSU for all failures is three and a half hours, with the 25th and 75th percentiles occurring at three and four hours, respectively. The mean repair time of three and a half hours was used as the major repair time.
To generate the minor repair and major replacement time, the trends of how other repair times of turbine components increase with the severity of failure were examined, and the values were extrapolated from this in a similar manner to that seen in Section 3.2.1.
In terms of the repair costs associated with the failures of a DSU, the Denmark Technical University published CAPEX cost equations for common offshore hydrogen equipment, and has a useful cost function for the DSU, which can be seen in Equation (2) [40]:
C A P E X D S U = 30.6 × 10 3 V
where V is the volumetric flow rate. The DSU is based on the reverse osmosis seawater desalinator produced by Lenntech, similar to ref. [40]. Lenntech’s basic industrialised reverse water desalination unit has a capacity of 300 m3/day of flowrate, and this was used for this study [41]. This resulted in a capital cost of £765,000. It was assumed that the repair cost of the DSU for a major replacement would cost the same as the CAPEX cost, as a full replacement would be required. The costs for minor and major repairs were then determined by looking at the trends of how other repair costs of turbine components increase with the severity of failure, and the values were extrapolated from this in a similar manner to that seen in Section 3.2.1. Table 2 shows the O&M inputs for the DSU.

3.2.3. Export Compressor

In terms of the export compressor, values for failure rates were obtained from the OREDA bank [13]. Failure modes were again matched up to what quantifies as a minor repair, major repair and major replacement. In terms of the repair costs, ref. [30] states that the cost of the compression unit is expressed as £61,733/MW. Therefore, to scale up to 3 MW, as per the turbine used in this model, this equated to a CAPEX cost of £185,199. It was also assumed that the repair cost of this compression unit for a major replacement would cost the same as the CAPEX cost. The costs for minor and major repairs were then determined by looking at the trends of how other repair costs of turbine components increase with severity of failure, and the values were extrapolated from this in a similar manner to that seen in Section 3.2.1. The NREL CDPs were again used to obtain the repair times for the export compressor [38]. The mean time to repair the compressor for all failures is five hours and was used to quantify the time for the compressor major repairs. The times for minor and major replacements were then determined by looking at the trends of how other repair times of turbine components increase with severity of failure, and the values were again extrapolated from this. Table 3 shows the O&M inputs for the export compressor.

3.2.4. Storage Tank

In terms of the storage tank, values for failure rates were obtained from the OREDA bank [13]. Failure modes were again matched up to what quantifies as a minor repair, major repair and major replacement. In terms of the repair costs, the US Department of Energy performed a cost analysis of hydrogen storage and it stated that the cost of the hydrogen storage tank is expressed as £310.23/kg [42]; this is also similar to the capital cost of the storage tank presented in [19]. A basic assumption for this study was that a storage tank of 1000 kg was implemented into the system for conservative purposes, which resulted in a CAPEX cost of £310,230. As per the compressor and DSU, this CAPEX cost was assumed to be the same as the major replacement cost. The same methodology was used to obtain the repair costs for minor repairs, major repairs and major replacements, as in the previous sections. The NREL CDPs were again used to obtain the repair times for the storage tank [38]. The mean time to repair the storage tank for all failures is ten hours and was used to quantify the time for the storage tank major repairs. The times for minor and major replacements were again determined by looking at the trends of how other repair times of turbine components increase with severity of failure, and the again extrapolated from this in a similar manner to that seen in Section 3.2.1. Table 4 shows the O&M inputs for the storage tank.

3.2.5. Fuel Cell

Ref. [43] states that PEM fuel cells and PEM electrolysers are two closely related electrochemical devices having a similar structure, consisting of an anode, a cathode and a membrane. Therefore, the assumption was that the PEM fuel cell failure rates, repair times and repair costs are similar to those of a PEM electrolyser.

3.3. O&M Modelling

The O&M model utilised for this analysis was developed by the University of Strathclyde, as detailed in [28,29]. This model is a time-based simulation tool developed in [44], and requires several O&M inputs that model the climate, component failures of the system and lifetime costs to produce a number of useful O&M outputs. Modelling the climate requires a historical weather dataset, which was obtained from the Federal Maritime and Hydrographic Agency (FINO) dataset [45]. The model then simulates the wind speed and significant wave height values over the user-defined lifetime using the FINO data provided. For each time step of the simulation, the failure rates inputted by the user dictates whether a component of the coupled wind–hydrogen system has failed. When a failure occurs within a component defined by the user, repairs are carried out, which are dependent on available resources and operational requirements (weather windows, vessels, staff requirements, repair times, etc.). Once the operational shift for the day is simulated, the condition of the components within the wind farm is recorded in terms of the availability and resources consumed; this is repeated until the user-specified lifetime is reached, in other words, when the wind farm has reached the end of its life. From this, the O&M outputs are generated, such as the contributions to downtime, contributions to O&M costs, transport costs and average lifetime availability. This model was already well established in a number of studies [27,28,29,34], which is the reasoning for choosing this model; however, in the studies in which this model was used, only turbine components were included in the analysis. To further highlight the novelty of this work, this study included hydrogen system components in the O&M model, which had not been done before in the previous literature.

3.4. Sensitivity Analysis

Within this analysis, numerous assumptions were made that could affect the uncertainty associated with the results presented. Therefore, to assess how reliant the outputs were on the inputs, a sensitivity analysis was conducted. As the majority of failure rates in this study were synthesised and had no reference to empirical data, these were included in the sensitivity analysis, as synthesised failure rates have greater uncertainty. The number of technicians remained the same for each component due to the lack of available literature; therefore, this was also included in the sensitivity analysis. Finally, the repair times were also subjected to a sensitivity analysis for completeness. Each input that was included in the sensitivity analysis was varied in a range from 50% to 150% to see the effect it had on the lifetime average availability of the wind farm.

4. Results

Using the inputs generated in the previous section of the study, the availability, downtime and O&M costs were obtained for this coupled wind–hydrogen system. A sensitivity analysis was then conducted to determine the influence the repair times and failure rates had on the availability and downtime of the system.

4.1. Baseline Model

The baseline model was simulated for 100 iterations to ensure convergence; however, convergence was achieved at around 50 iterations, with a percentage change of less than 0.04%. Therefore, for future simulations, when considering the sensitivity analysis, the number of iterations was set to 50. Ref. [27] provides the availability, operation and maintenance costs of offshore wind turbines with different drive train configurations, and is a useful study to compare the difference between a normal offshore wind turbine and a coupled wind–hydrogen system. The wind farm used in this study was 50 km offshore from the coastline, and therefore, was compared with the 50 km study conducted in reference [27]. It should be noted that in ref. [27], an average lifetime availability of 91.9% was obtained for the wind farm operating at 50 km, whereas the coupled wind–hydrogen system modelled in this study reached an availability of 85.24%. This drop in availability was expected, as there were more components with significant failure rates and repair times. Availability could be improved by increasing the number of technicians or vessel capacity during each working shift, but this was considered out of the scope of this study. Furthermore, it should be kept in mind that a significant proportion of failure rates were either synthesised or based on engineering judgement, which means there was a greater degree of uncertainty associated with these results. In terms of the contributions to downtime, ref. [27] states that the largest contributing factor within this parameter was the “Rest of Turbine—Minor Repair”, contributing 35.5% to the downtime of the wind farm. This somewhat agreed with the study presented in this paper, in which the “Rest of Turbine—Minor Repair” category was the largest contributing factor; however, this was reduced to 24.1% due to the inclusion of the hydrogen components with significant failure rates.
A breakdown of the contributions to downtime can be seen in Figure 6. The main contribution to the downtime, as seen in the coupled wind–hydrogen system modelled in this study, was the “Rest of Turbine—Minor Repair” category, which was attributed to 24.1% of the downtime. However, it can also be seen that new hydrogen components that were included in this system also contributed a significant proportion to the downtime and were caused by major replacements. For example, the “Electrolyser—Major Replacement” category was attributed to 4.7% of the downtime seen within the system; while this was lower than the “Rest of Turbine—Minor Repair” category, it was still a large percentage that contributed to the downtime via major replacements. Furthermore, it contributed more to the downtime than the “Gearbox—Major Replacement” category, which is a component that is notorious for downtime contributions and can adversely affect the availability of the turbine [27].
The reason for the large contribution of downtime due to the electrolyser may be that it is a relatively new technology. A PEM electrolyser is a new type of technology that shows promise in the future of green hydrogen systems. However, as detailed in the Net Zero Technology Centre Hydrogen Backbone Link Report [46], PEM electrolysers score low in terms of the technology readiness level (TRL) when compared with other proven technologies, such as alkaline electrolysers. This low TRL can determine the failure modes and the failure rates of the PEM electrolyser, and therefore, increase the rate at which it fails, and thereby, adversely affect the availability and contribution to downtime. However, it should be considered that when the PEM electrolyser technology becomes more frequently used with coupled wind–hydrogen systems, the failure rate will come down accordingly due to lessons learned within the industry regarding maintenance methods for PEM electrolysers. Similar conclusions could be made for the fuel cell and DSU components of the hydrogen system, in which they contributed a significant proportion to the downtime, which could be attributed to the technology readiness level of these components.
Figure 7 shows the contributions to downtime from only the hydrogen components, which accounted for 37% of the total system downtime. It should be noted that Figure 7 does not include the converters of the hydrogen system, as they were contained in the converter input, which was also inclusive of the converters of the wind turbine. The reasoning for this was that the key novelty of this study was the rest of the hydrogen system, in which the electrolyser, fuel cell, storage tank, DSU and export compressor components had not been applied to the Strathclyde O&M model before; therefore, the contribution to downtime of these components were of key interest. As it can be seen in Figure 7, the DSU contributed the most to the downtime in terms of the hydrogen components, totalling 34% when summing the minor repair, major repair and major replacement contributions. This was followed by the electrolyser and fuel cell, which both contributed 20.7%. Therefore, it can be said that components of concern when considering purely the hydrogen part of the coupled wind–hydrogen system were the DSU, electrolyser and fuel cell, which, again, could have been due to the technology readiness levels of these components.
In terms of lifetime O&M costs, it can be seen in Figure 8 that the main contribution came from the lost revenue, totalling 38%, which somewhat agreed with ref. [27], as that study showed that the lost revenue contributed to 45% of the lifetime O&M costs for an offshore wind farm located at 50 km from the coastline. However, the second-largest contribution to lifetime O&M costs were the repair costs, which totalled 33%, as seen in Figure 8, which was due to the increase in expensive components being used in the wind farm when including the hydrogen system. Finally, the third largest cost was the transport costs, which accounted for 25% of the total costs.
A more detailed breakdown of the transport costs in terms of crew transfer vessels (CTVs), fast support vessels (FSVs) and jack-up vessels can be seen in Figure 9. The largest contribution to transport costs was the jack-up vessel at 50%, which was expected, as it had the largest cost associated with the transport options and was only used for major replacements that were pertinent to the wind turbine nacelle. It should be noted that for all hydrogen component major replacements, it was decided that an FSV would suffice for replacements, as the components were based on the bottom of the turbine, eliminating the need for a jack-up vessel. Therefore, all failures in regard to the hydrogen part of the system were either conducted by a CTV or FSV. When comparing the transport costs with ref. [27], a slightly different breakdown was observed: the jack-up vessel was observed to contribute 69% of the transport costs, whilst the CTVs contributed to 31%. In this study, the jack-up vessel contributed to 50%, the FSVs contributed to 7% and the CTVs contributed to 43% of the transport costs. As hinted earlier, the usage of CTVs and FSVs increased when considering the implementation of the hydrogen system, whereas the jack-up vessel remained the same. Therefore, the frequency at which CTVs and FSVs were deployed increased, leading to a larger share of the transport costs.

4.2. Sensitivity Analysis

Due to the nature of how the inputs were obtained for this study, they had a degree of uncertainty associated with them, in particular, the failure rates, repair time and number of technicians inputs of the model. Therefore, in this subsection, the failure rates, repair times and number of technicians were subject to a sensitivity analysis to try to quantify the uncertainty surrounding these inputs. Each input was varied from 50% to 150% of the baseline to see the effect it had on the average lifetime availability. The reasoning for varying the inputs of the model in 10% increments from 50% to 150% was based on similar methodologies seen in other O&M papers that considered the uncertainty of O&M model inputs [27,47]. All O&M inputs that were subjected to the sensitivity analysis were generated from Section 3 within this study.

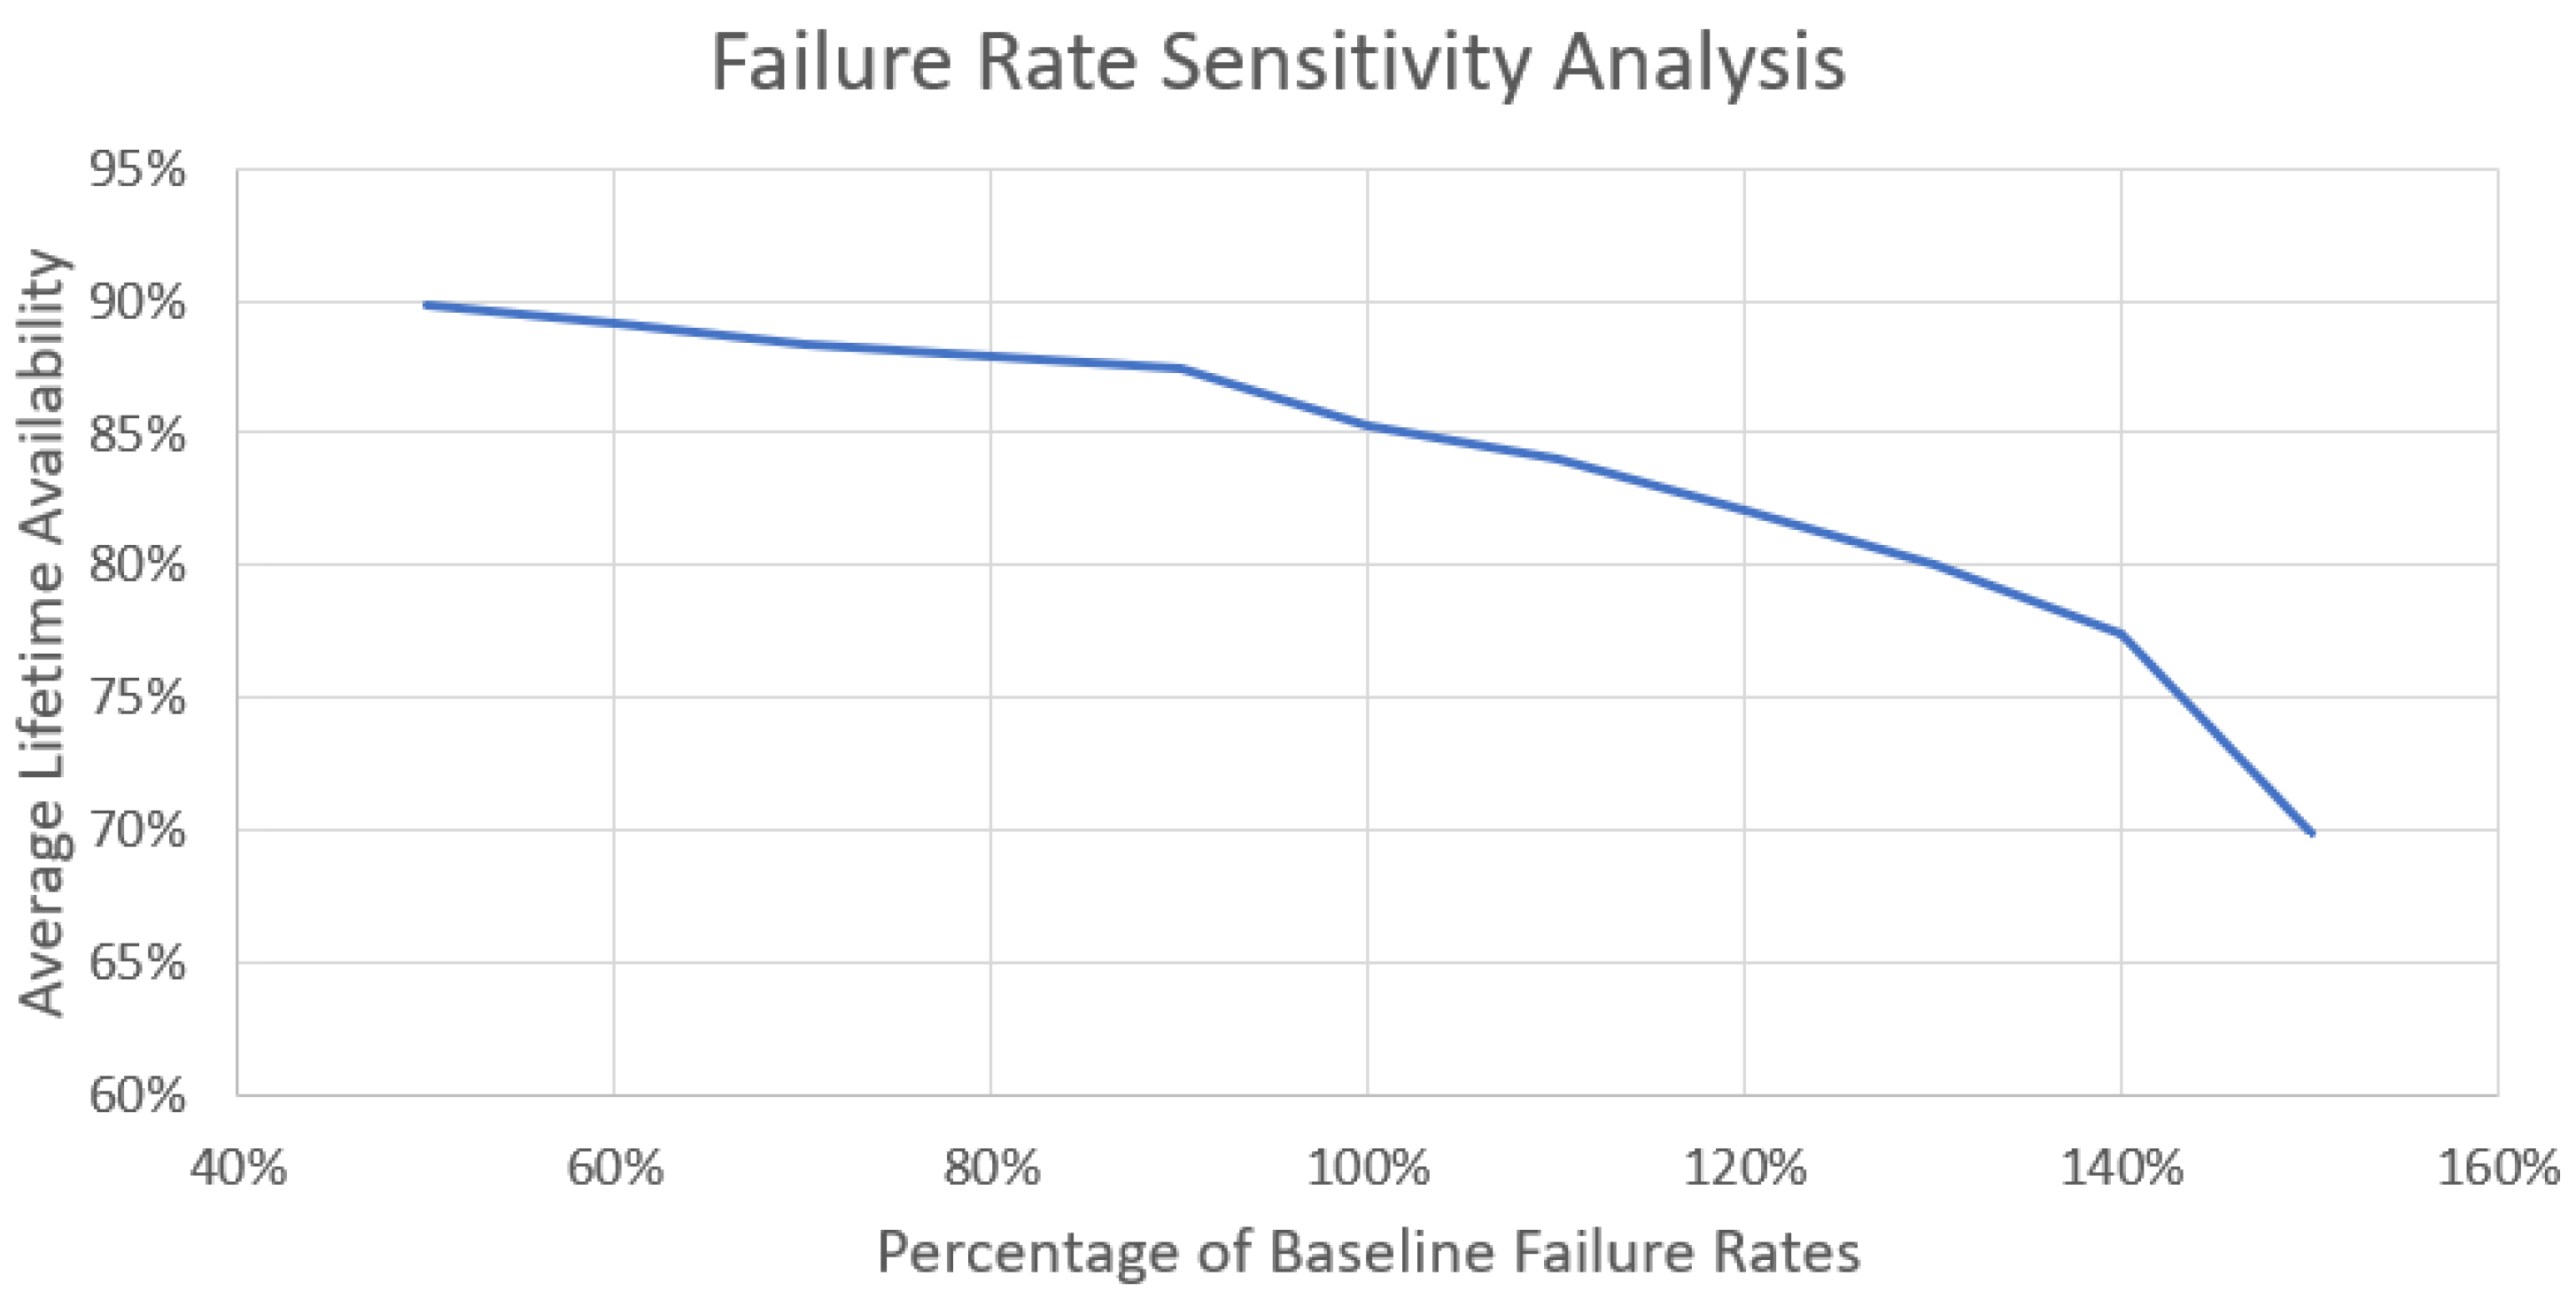
4.2.1. Failure Rates
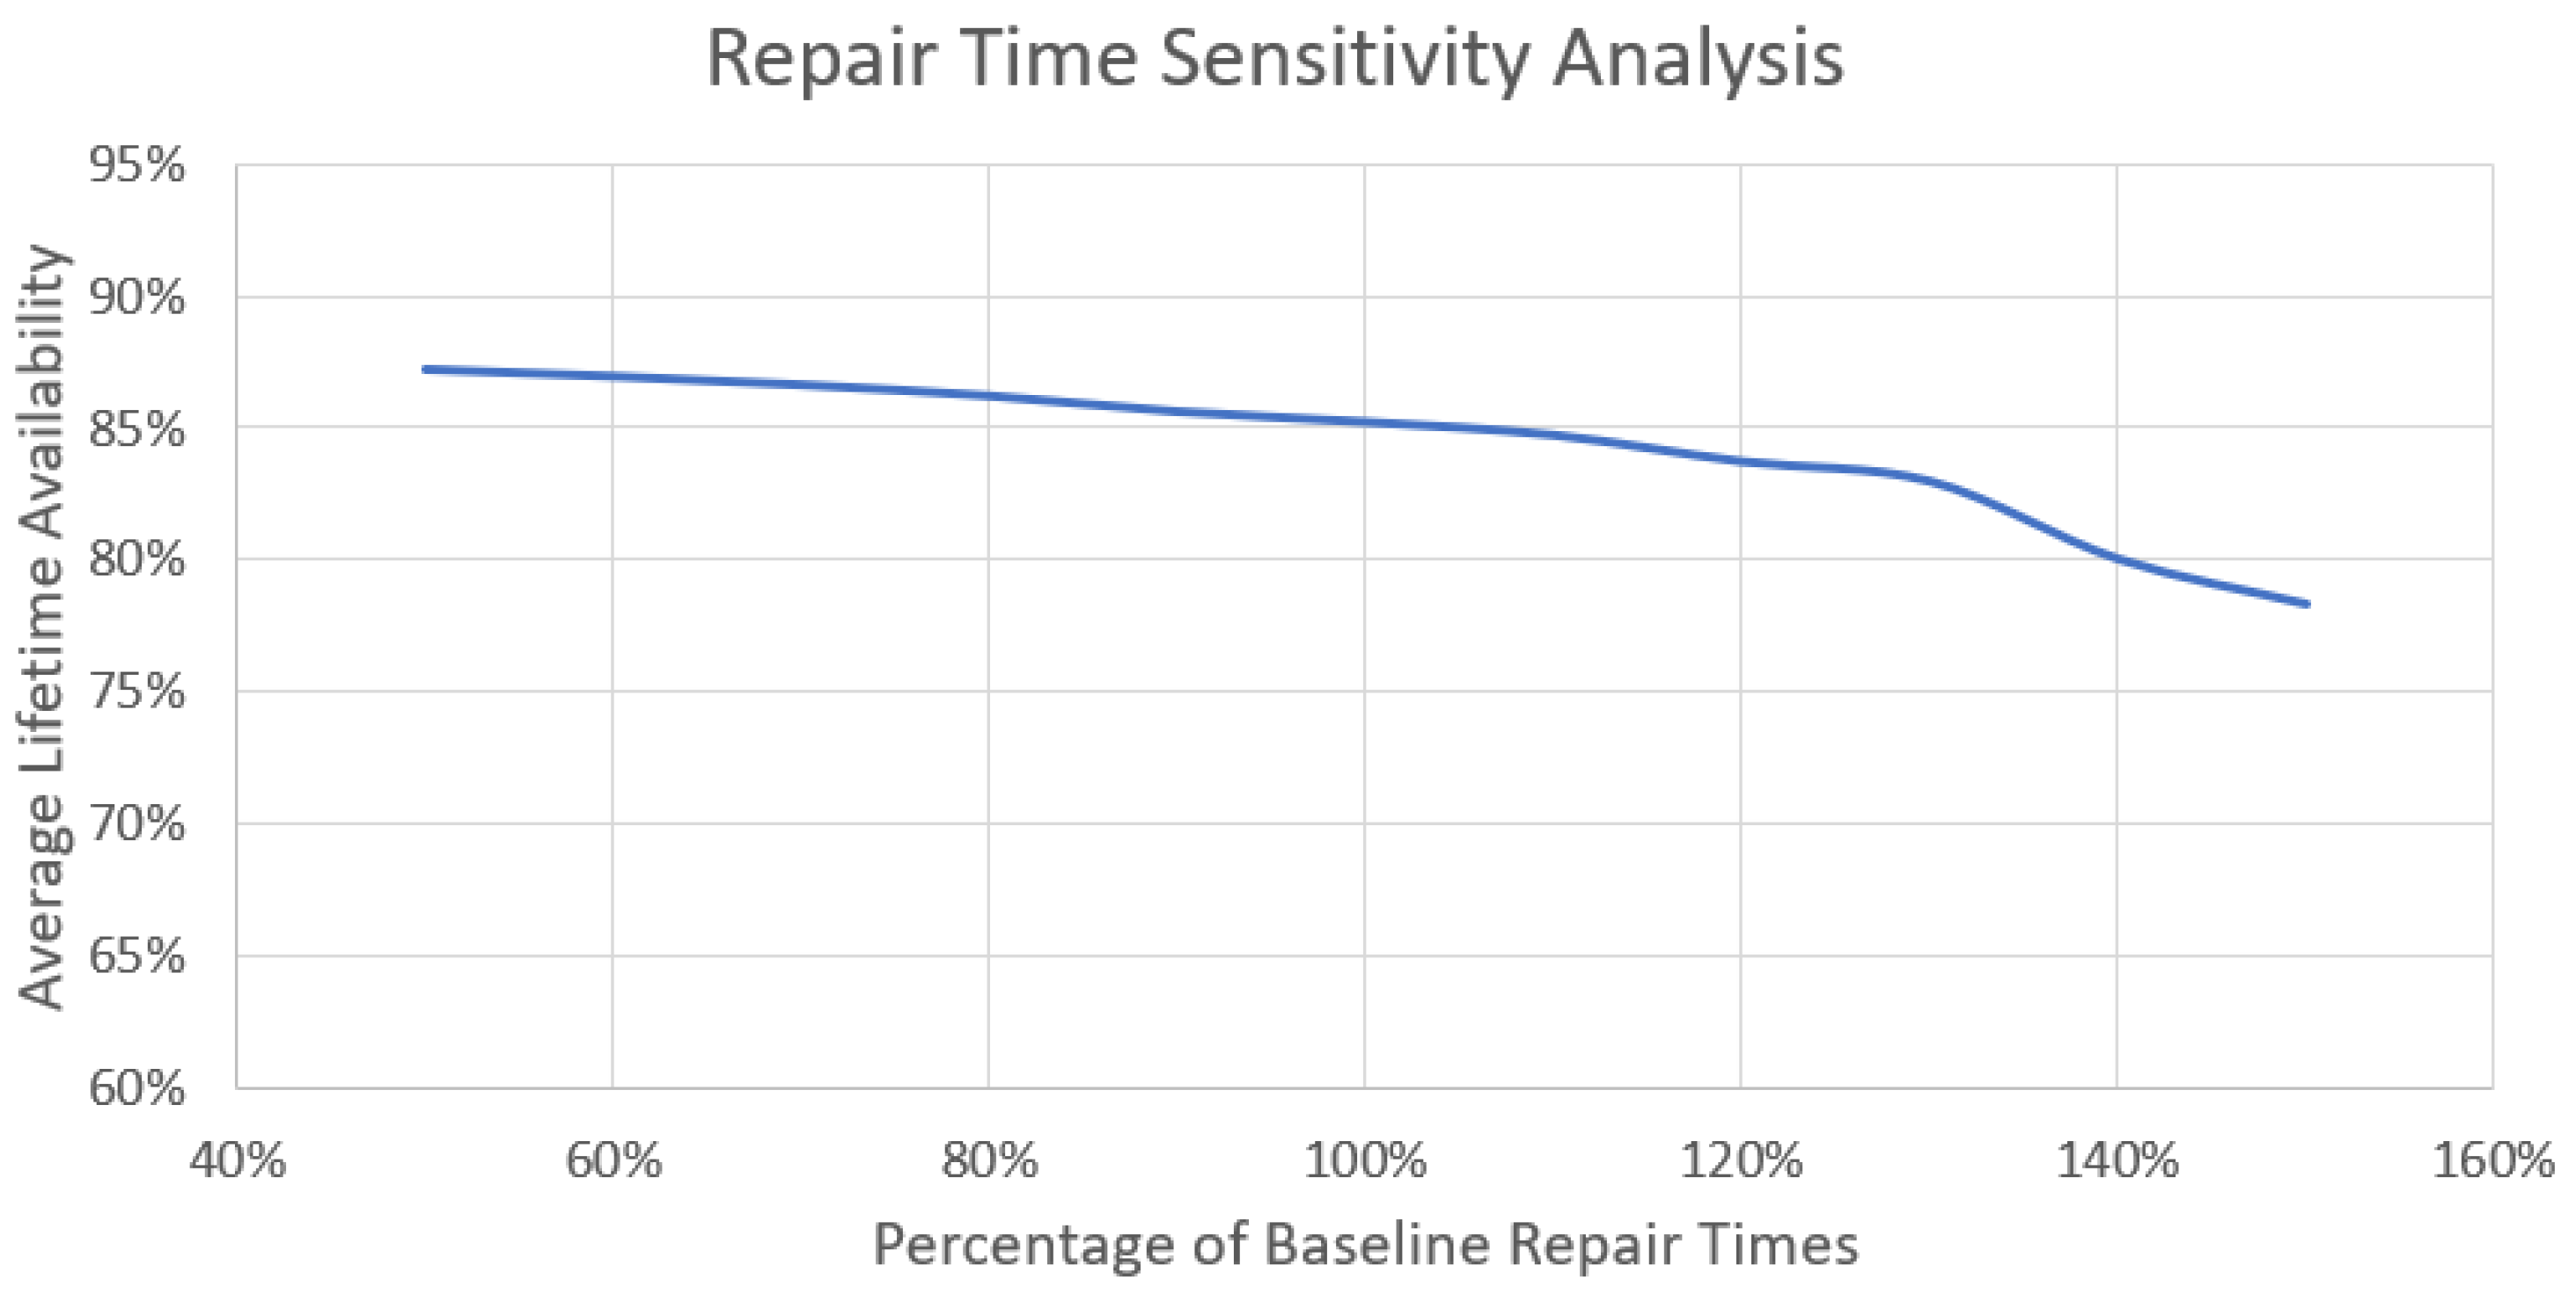
As described in Section 3.2, the majority of failure rates either came from synthesised data or engineering judgement, which could affect the uncertainty of the failure rate. This was especially true for the desalination unit, as the related data were completely from OREDA. The purpose of this sensitivity analysis was to see the effect that varying the failure rates had on the availability of the site.
As it can be seen in Figure 10, when decreasing the failure rates of the hydrogen components, the availability of the system increased, as expected, to a maximum of 89.78%. However, when increasing the failure rates, the availability of the system dropped significantly to a minimum of 69.87%. By varying the failure rates from 50% to 150%, there was a percentage change of 19.91% seen in the availability of the system, which suggests that the analysis conducted in this study was quite sensitive to the failure rate inputs.

4.2.2. Repair Times

Similar to the failure rates, the majority of repair times came from the NREL CDPs, in which the mean repair time for each piece of equipment was considered as the repair time for a major replacement, and engineering judgement was used to determine the minor repair and major replacement times based off of the NREL CDPs, which affected the uncertainty of the repair times. The purpose of this sensitivity analysis was to see the effect that varying the repair times had on the availability of the site. The results of the sensitivity analysis can be seen in Figure 11.
When decreasing the repair times of the hydrogen components, the availability of the system increased, as expected, to a maximum of 87.25%. Furthermore, by increasing the repair times, the availability of the system dropped slightly to a minimum of 78.32%. By varying the repair times from 50% to 150%, there was a percentage change of 8.93% seen in the availability of the system, which suggests that the analysis conducted in this study was more robust to the repair time inputs than the failure rates of the hydrogen system.

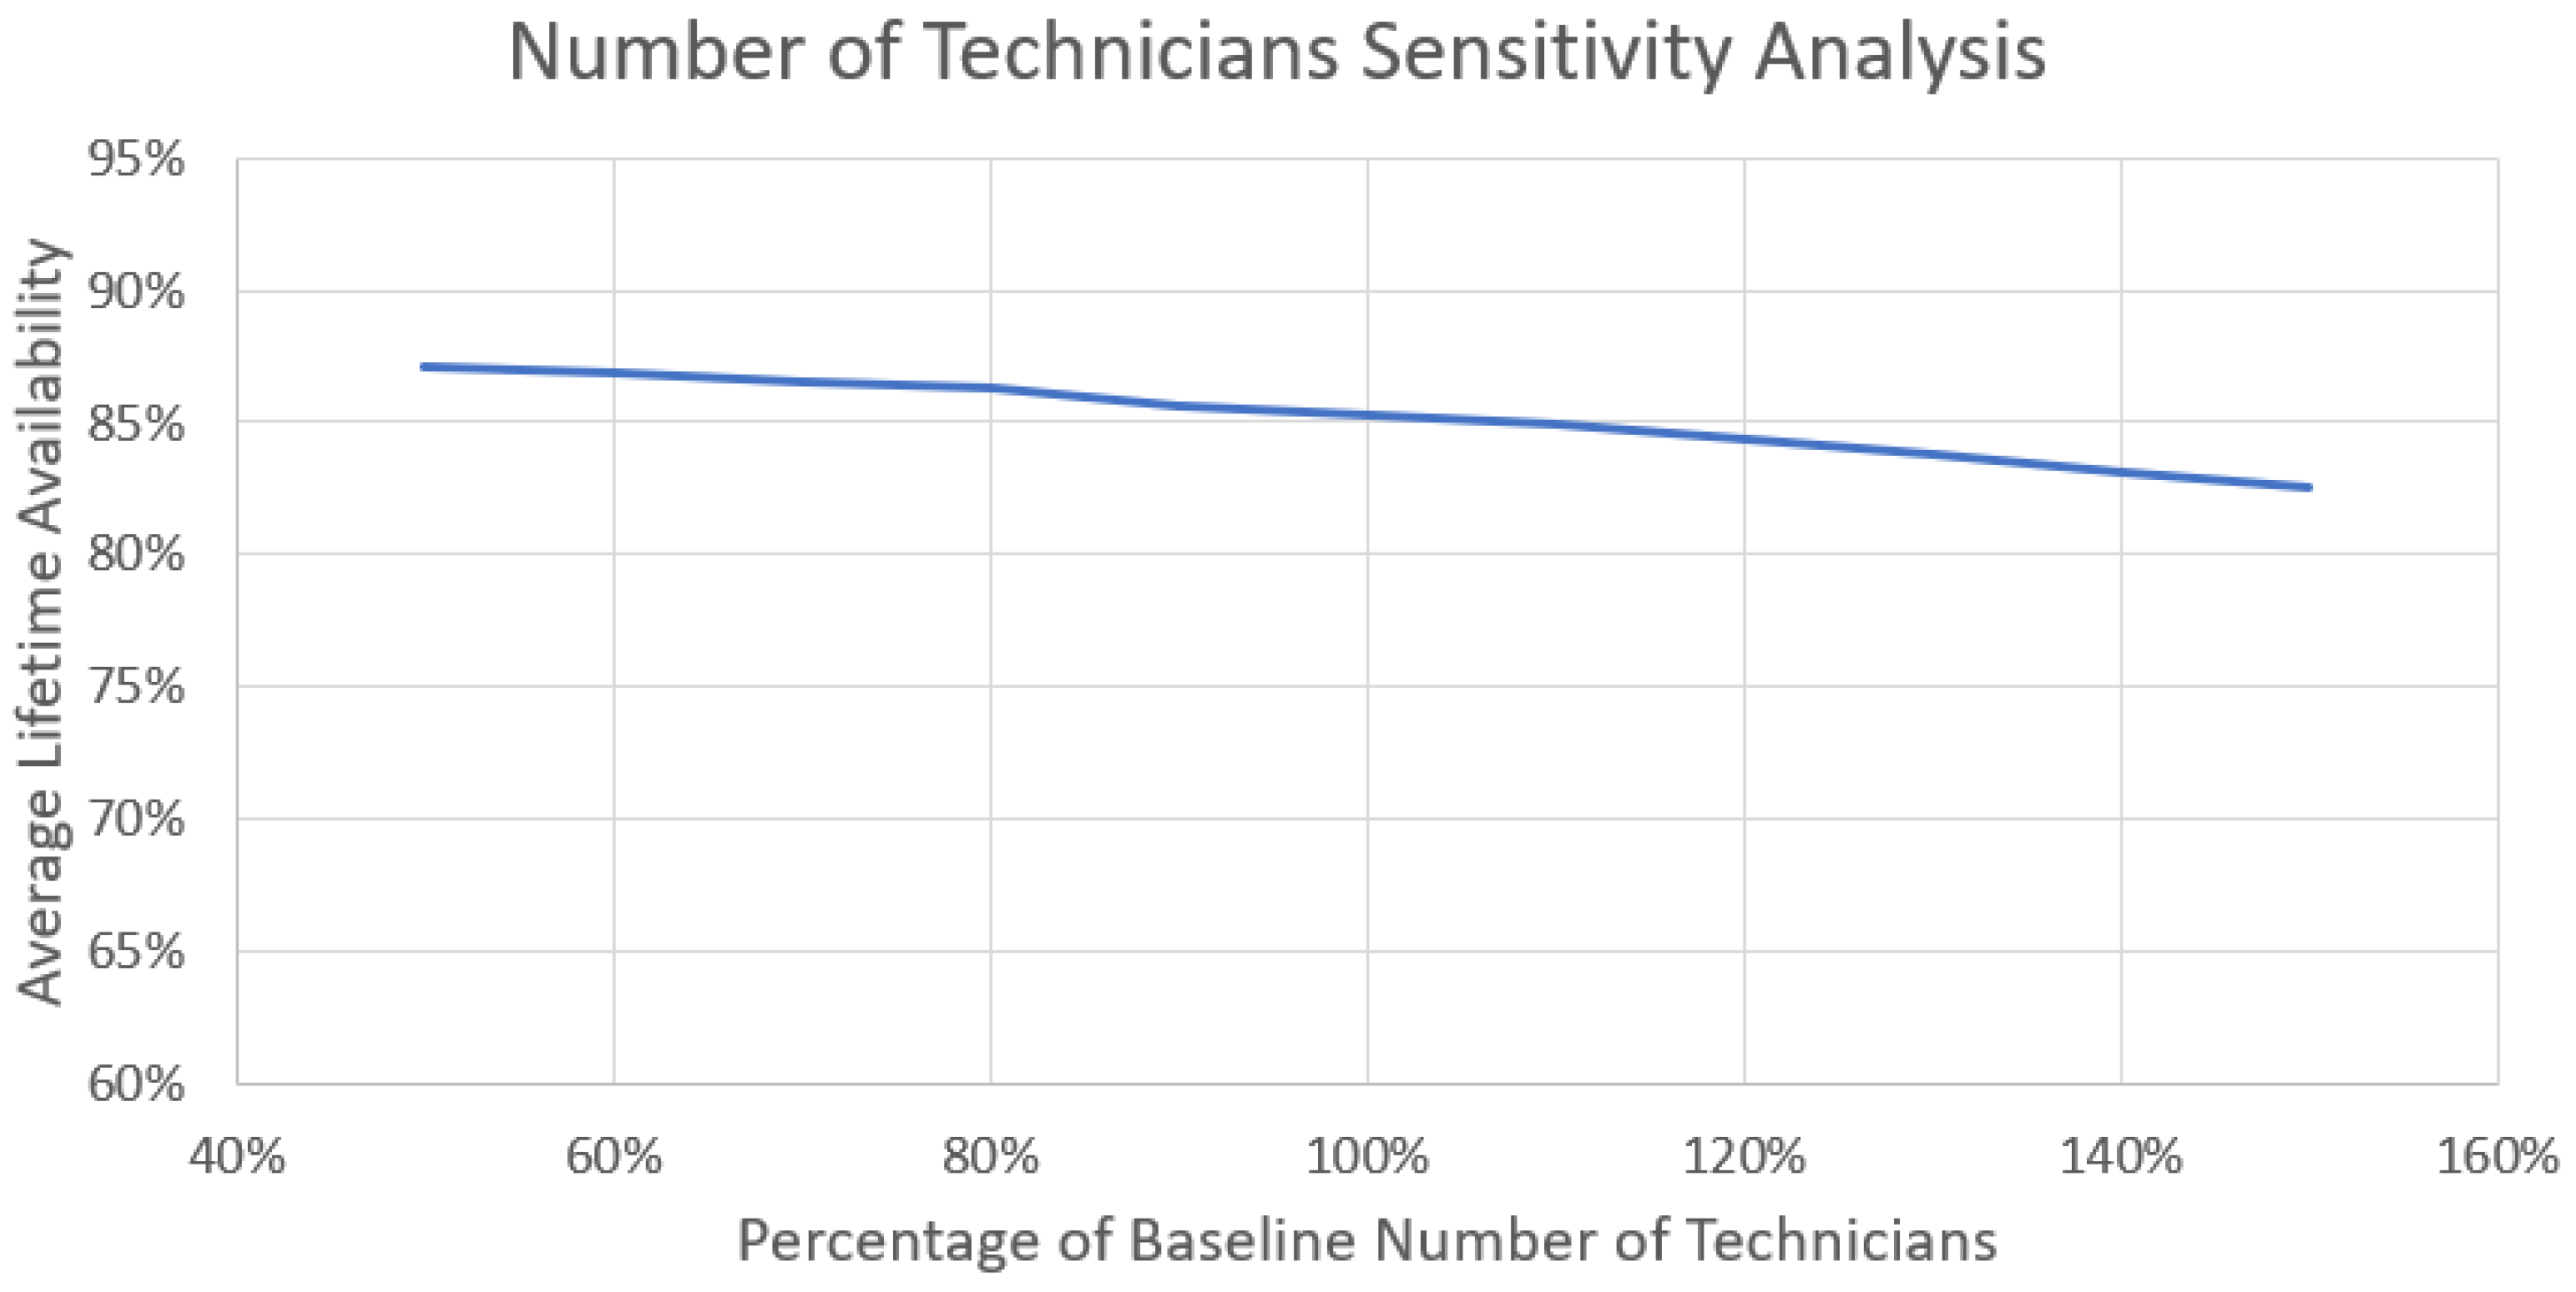
4.2.3. Number of Technicians

Finally, the number of technicians input was subjected to a sensitivity analysis, as it was assumed that the number of technicians would stay constant for each hydrogen component due to the lack of available literature. The purpose of this sensitivity analysis was to see how much the number of technicians could change before seeing a noticeable change in the availability. The results of the sensitivity analysis can be seen in Figure 12.
When decreasing the number of technicians of the hydrogen components, the availability of the system increased, as expected, to a maximum of 87.05%. Furthermore, by increasing the number of technicians, the availability of the system dropped slightly to a minimum of 82.49%. By varying the number of technicians from 50% to 150%, there was a percentage change of 4.56% seen in the availability of the system, which suggests that the analysis conducted in this study was robust to the number of technicians input.

5. Discussion

5.1. Availability

This study found that the coupled wind–hydrogen system modelled in this work had an average lifetime availability of 85.24%. When compared with a similar wind farm that was also located 50 km from the coastline, this resulted in an availability decrease of 6.66%, which was expected, as more components were introduced to the system when considering hydrogen. Possible ways to increase the availability of the coupled wind–hydrogen system could be to improve the repair times for the hydrogen components whilst also improving the mobilisation time of the FSV, which was set to 21 days after a review of ref. [29].

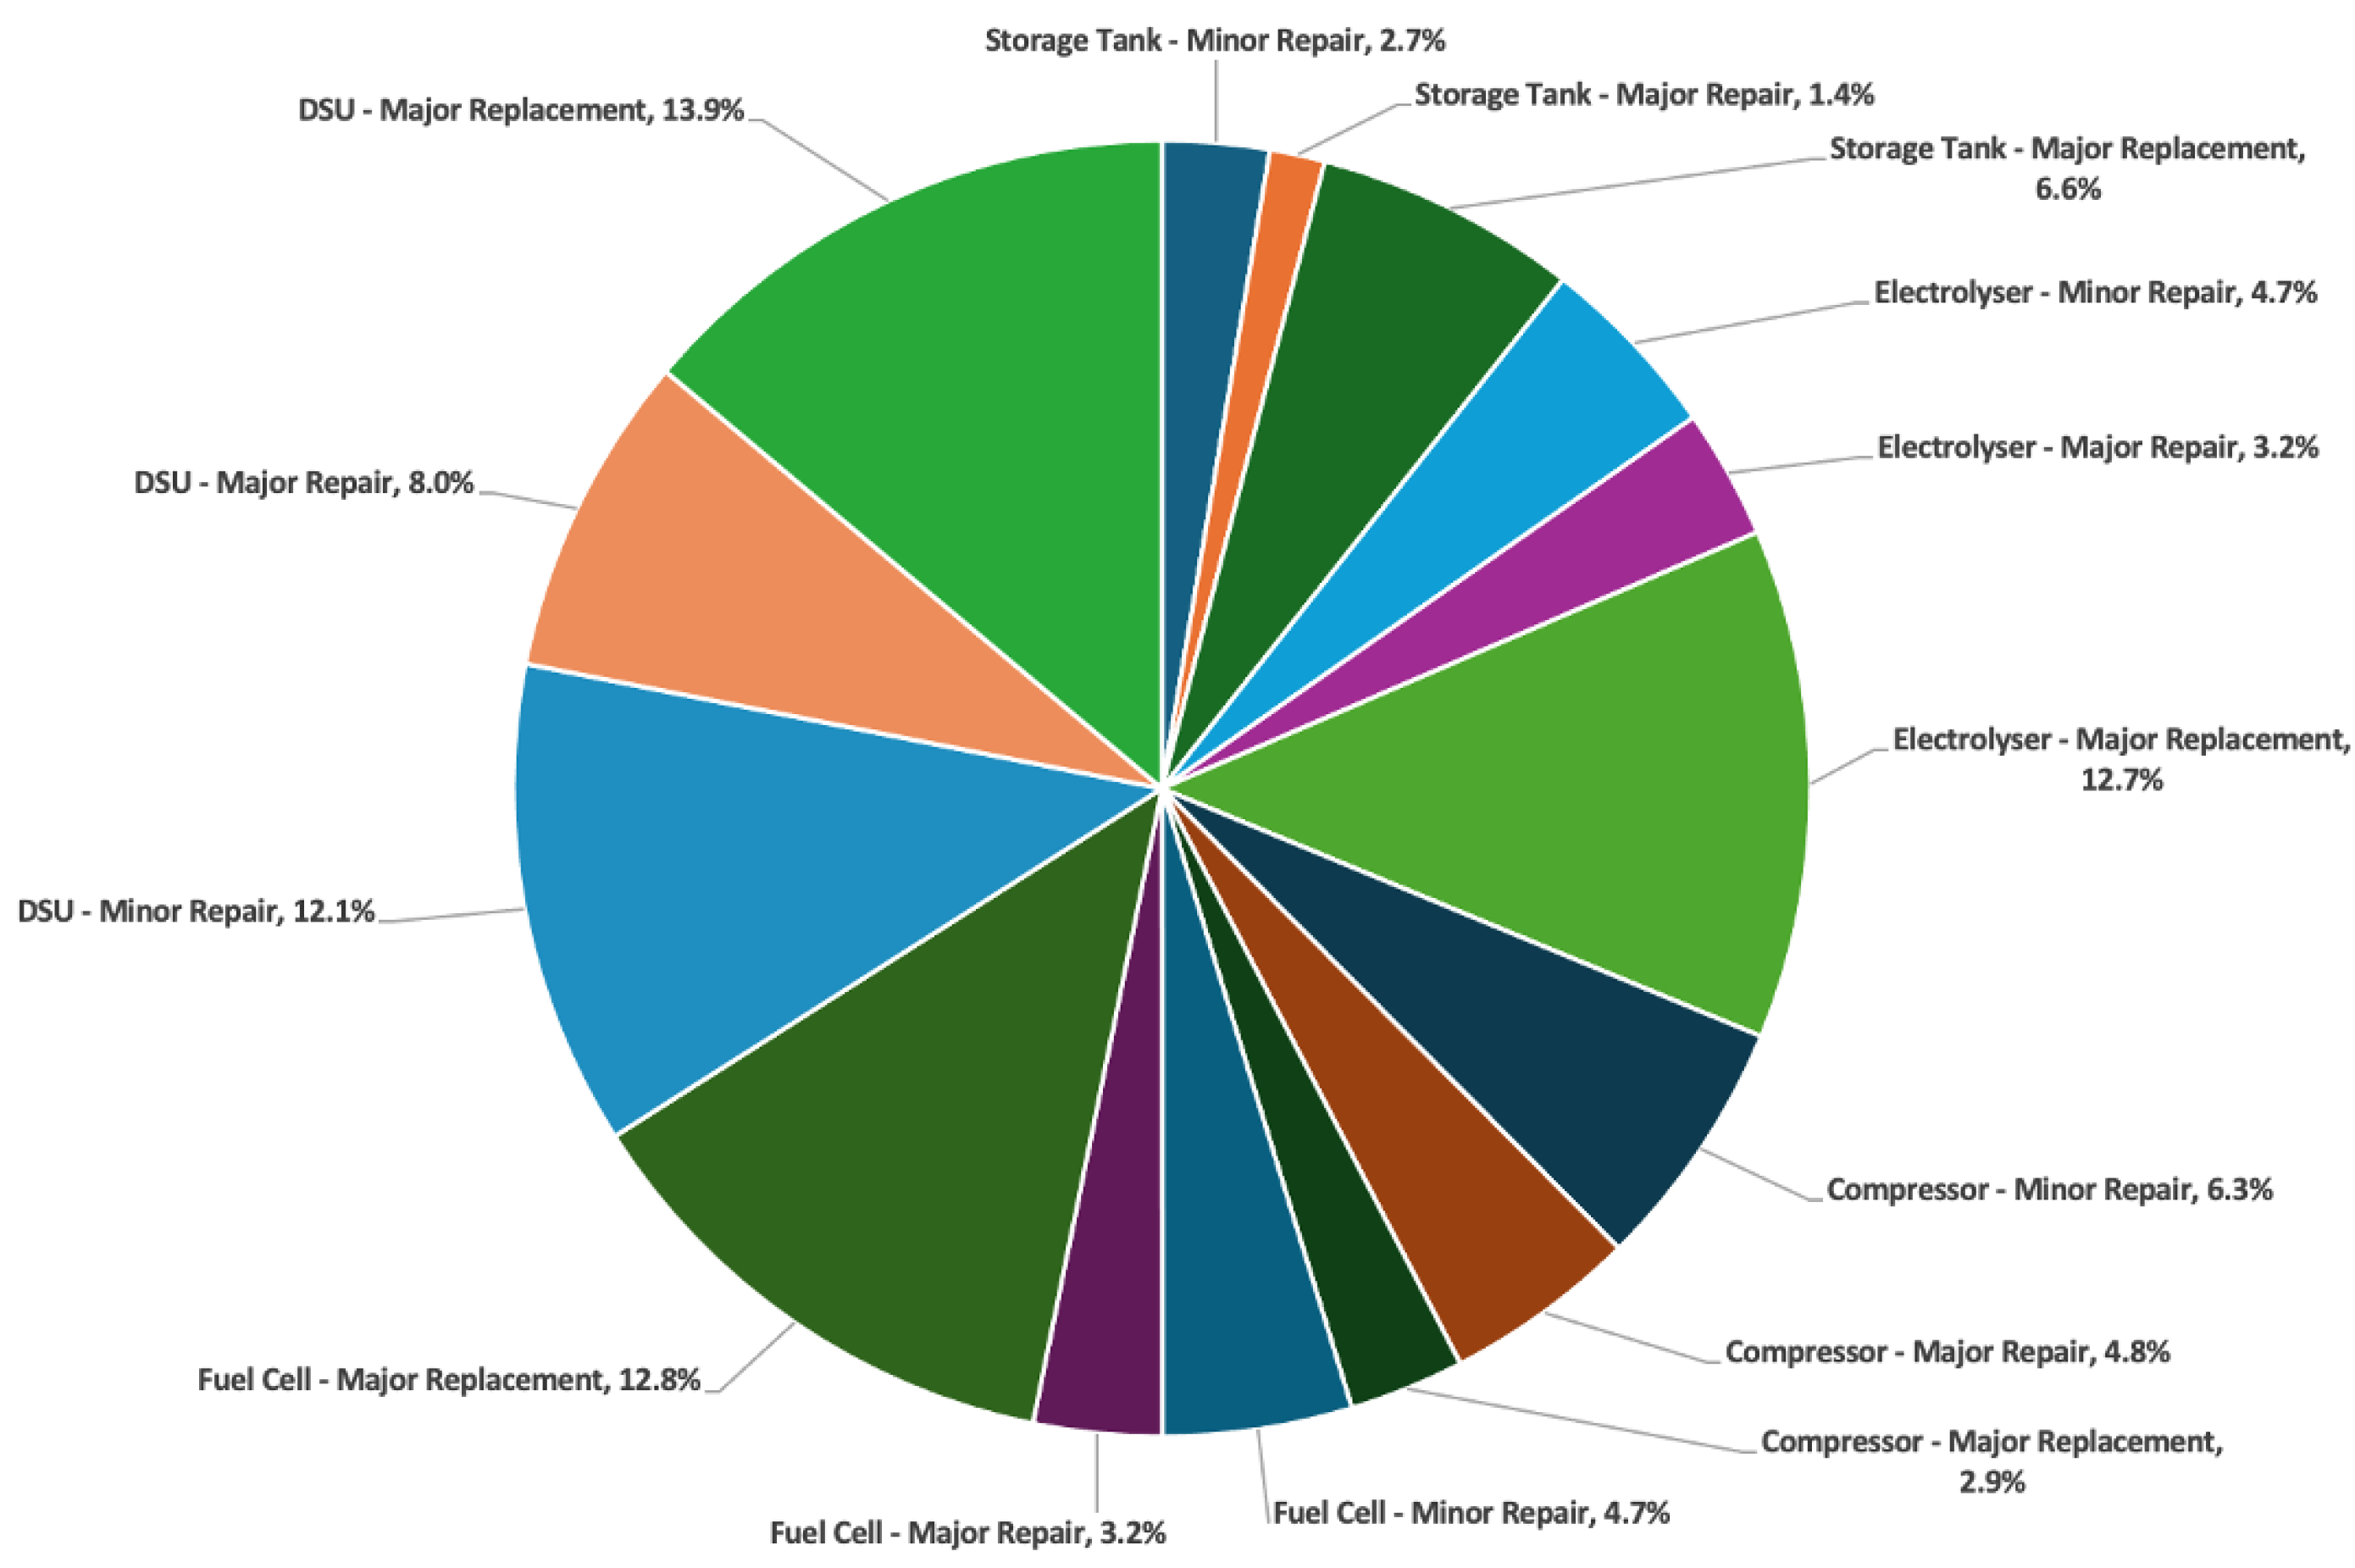
5.2. Contribution to Downtime

In terms of the contributions to downtime, the majority of downtime came from the “Rest of Turbine—Minor Repair” category totalling 24.1% of the overall downtime. In future, improved turbines or turbines from other manufacturers may have higher or lower failure rates, resource requirements and repair types; therefore, there is a slight uncertainty associated with this output [27]. However, it is interesting to note that some of the hydrogen components included in this study contributed a large portion to the downtime, especially the electrolyser, fuel cell and DSU. This was due to the technology readiness level of these components being relatively immature. However, the contribution of downtime associated with these components is expected to decrease as the technologies become more mature.

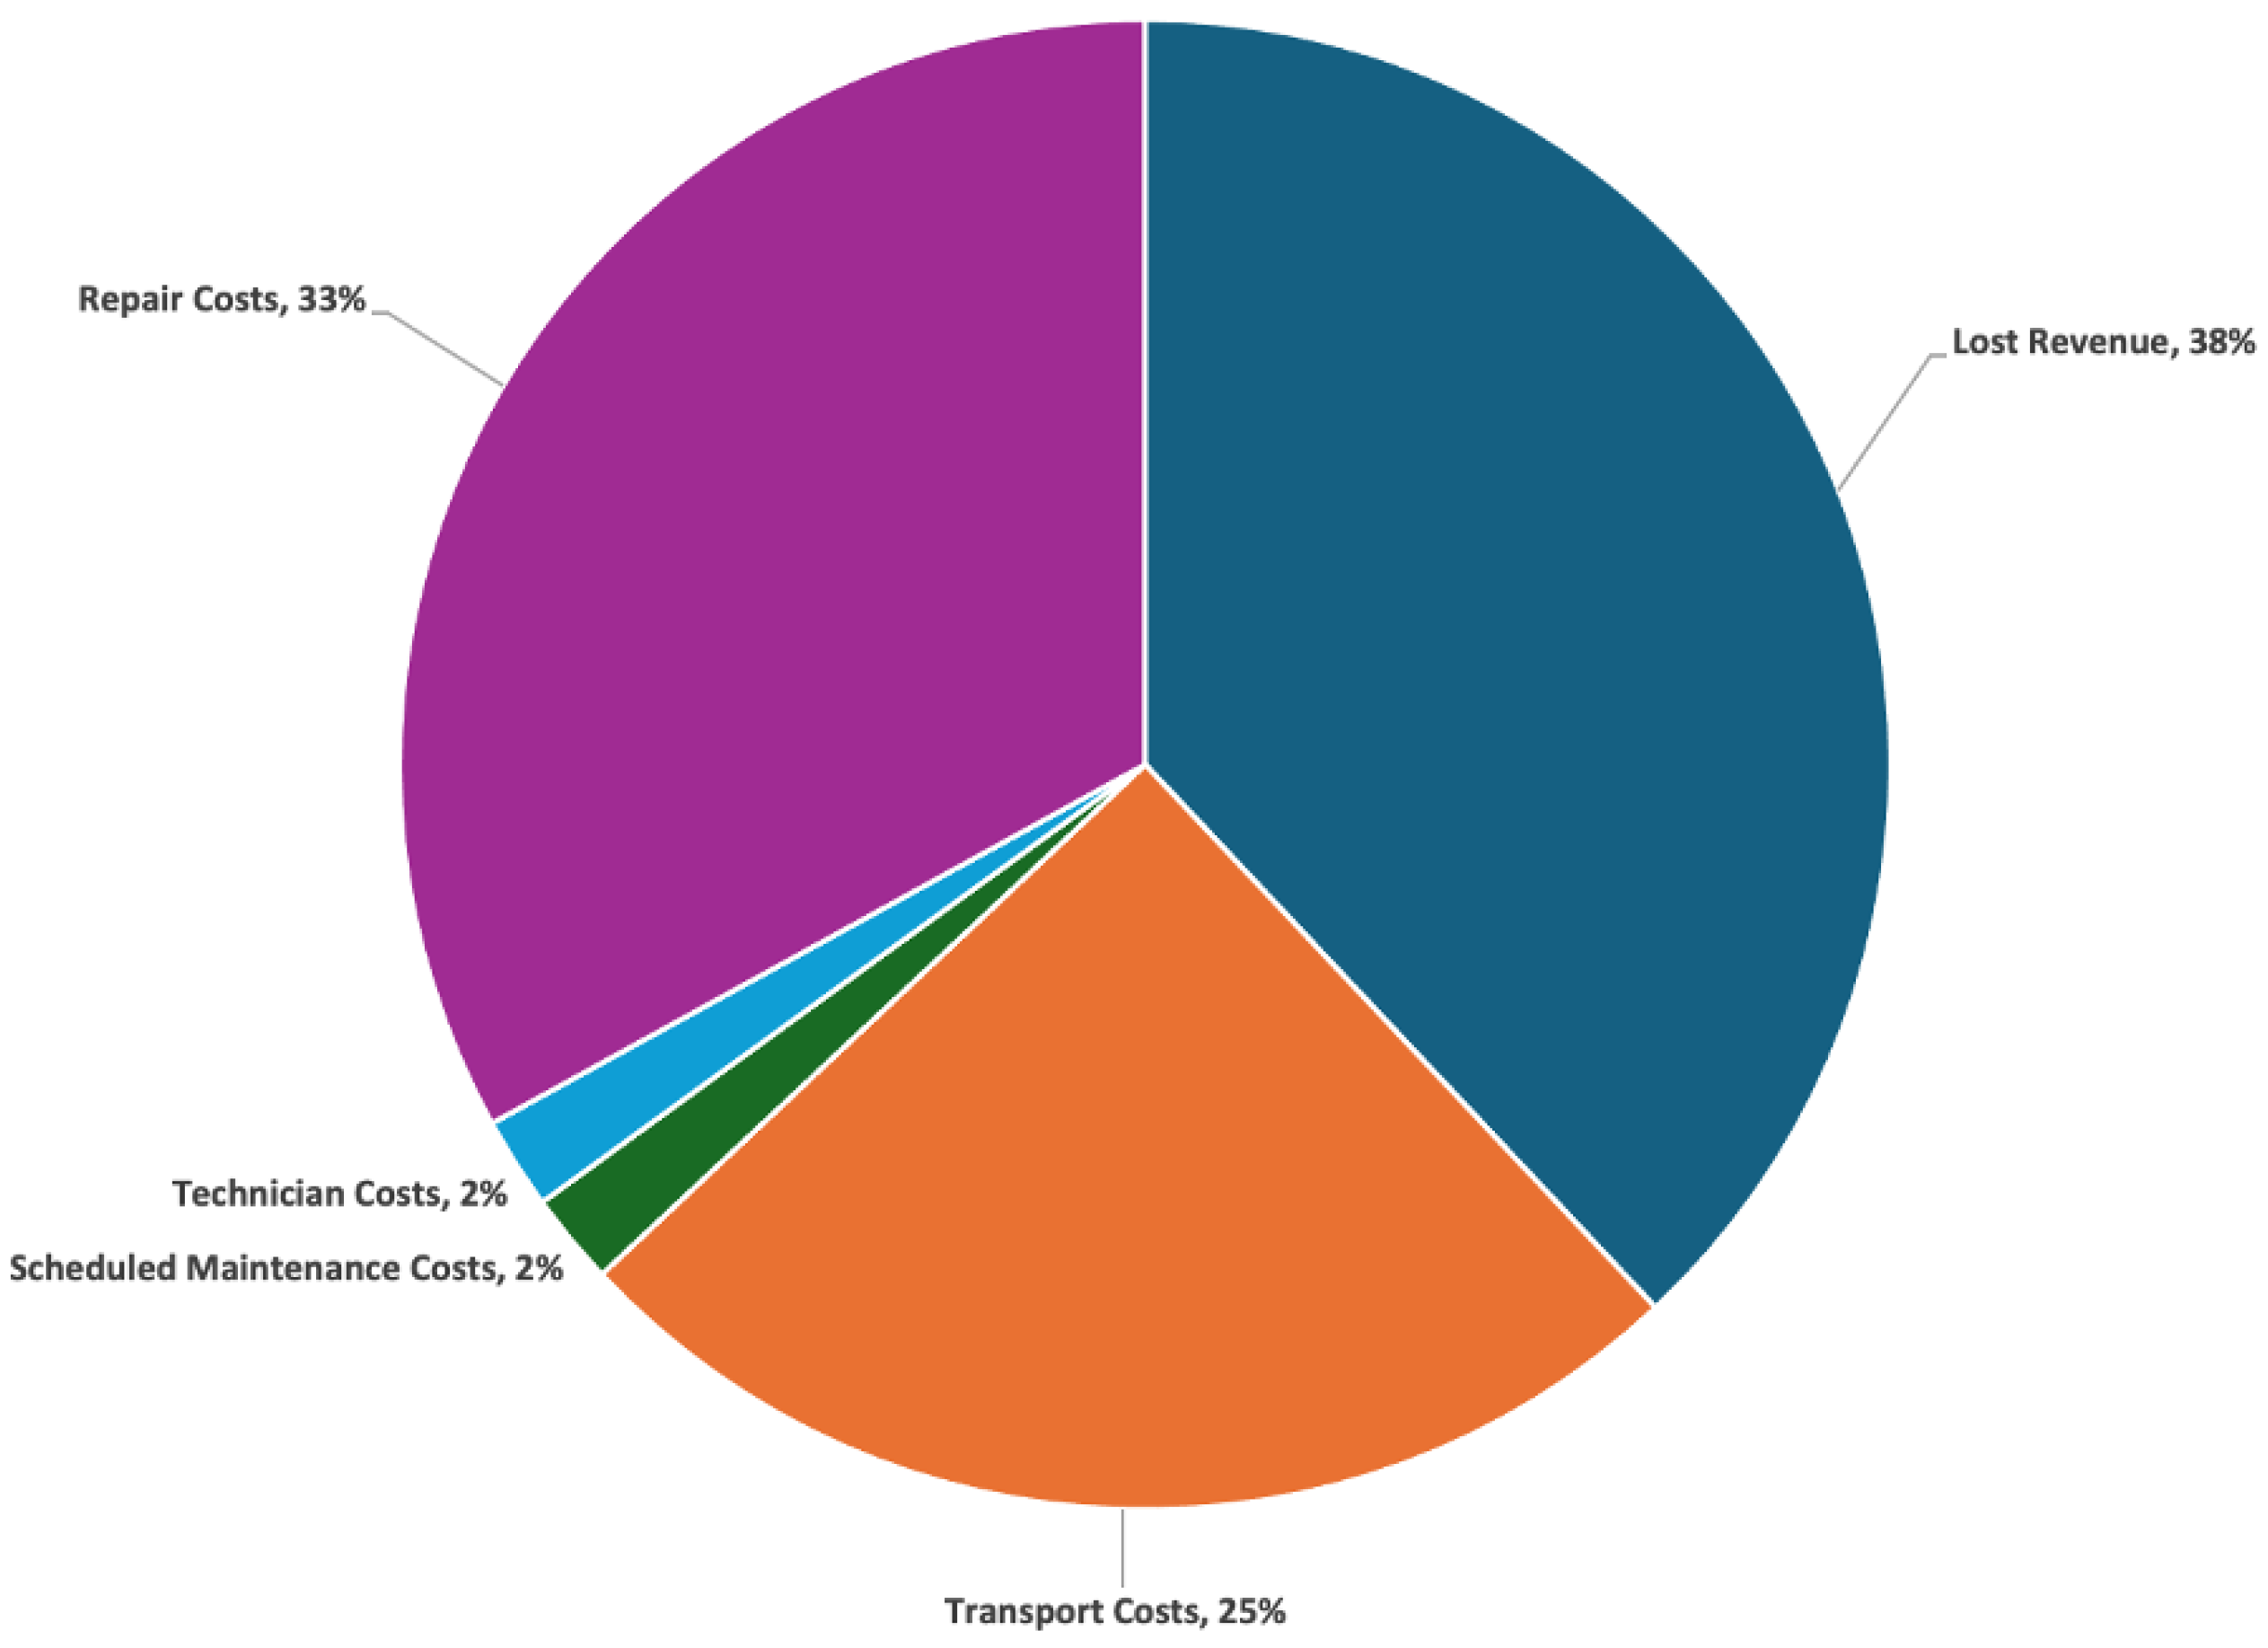
5.3. Lifetime O&M Costs

In terms of lifetime O&M costs, the main contributor was lost revenue, which was attributed to 38% of costs. The second-largest contributor were the repair costs, which could have been due to the use of expensive hydrogen components that were relative immature in terms of technology readiness level. However, it should be noted that the main contribution to repair costs was scheduled maintenance at 88%. From a maintenance perspective, this is favourable, as the majority of costs came from a preventative perspective instead of a reactive one. The third-largest contributor was the transport costs, which equated to 25%, and mainly comprised jack-up vessel costs. However, it was noted in this analysis that the CTV and FSVs took up a greater proportion of the transport costs when compared with ref. [27], which was due to the assumption that no hydrogen equipment required jack-up vessels to repair failures.

5.4. Robustness of Inputs

The quality of the results are analysed in this section, discussing the limitations of the study presented within this paper. The obvious limitation was that the failure rates and repair times were based on data from a large variety of sources. However, due to the limited literature of offshore hydrogen O&M modelling, many of these inputs were determined based on synthesised data and engineering judgement. This inevitably introduced a degree of uncertainty within the outputs produced by the Strathclyde O&M model. However, this study should be seen as a starting point for further studies to build upon the findings of this paper due to the novelty of the research area. It should also be noted that the hydrogen repairs in this model were denoted as “CTV” and “FSV” repairs due to the fact that the hydrogen-producing equipment would be at the base of the turbine. Therefore, jack-up vessels were not considered for the hydrogen equipment. However, O&M operators will have their own operating strategies for their assets; therefore, there is a natural uncertainty surrounding the vessel type and resource requirements for each failure observed in this study. Furthermore, it was assumed within the model that a corrective and preventative O&M strategy was employed to dictate how and when a failure should be repaired. With the advent of predictive and condition-based maintenance strategies, this could provide a useful means to improve hydrogen system availability. A sensitivity analysis was conducted in this study to determine the uncertainty associated with the failure rate, repair times and number of technicians inputs of the O&M model. It was shown that the failure rate inputs were the most sensitive inputs for the analysis; therefore, these inputs will be a priority to be refined in future studies to achieve a model of greater fidelity. However, the analysis was found to be robust to the number of technicians input; therefore, it can be said that the study was less dependent on the number of technicians input.

5.5. Future Work

There are a few areas of future work that could assist in the deficiencies within this study and provide useful input for the wind–hydrogen research area. First, it is proposed that expert elicitation is utilised to generate more precise failure rates and subsequent repair times for offshore hydrogen systems. This is where data of the opinions of industry experts on a subject are synthesised when there is uncertainty due to a lack of knowledge, or when such data are unavailable to the public domain. This study proposes that elicitation should be conducted in a similar methodology to [48] based on industry experts from onshore hydrogen operations and offshore wind and oil and gas O&M, as due to the relevant expertise in the area, they would be the most appropriate to synthesise the failure rates and repair times of offshore hydrogen components.
Furthermore, this study would benefit from operational data produced by these coupled wind–hydrogen systems. If any work orders were available to this study from O&M operators, a similar methodology used in ref. [34] could be utilised to determine the necessary failure rates, repair times and repair costs based on empirical operational data, which would greatly reduce the uncertainty associated with these inputs. It should be appreciated that there is no commercial offshore wind–hydrogen system as of yet, as most projects are in a trial phase, producing mere kilowatts; therefore, a potential scope of work could be to work with such operators when they reach commercial stages.
Whilst a variety of hydrogen system components were analysed within this study, it should be noted that the electrolyser component of the system did not include the electrical sub-components (transformer, DC system, etc.). Whilst the intention of this study was to give a starting point for offshore O&M modelling, these components will have failure rates and associated repair costs, which can be quite significant. Therefore, a future area of work is a more detailed analysis of the sub-components and failure rates of the electrolyser, with a focus on the electrical sub-components, as detailed previously.

6. Conclusions

This study provided a reasonable starting point for the O&M modelling of offshore wind–hydrogen systems. A literature review was conducted at the start of the study to review potential data sources and model inputs, which concluded that existing data sources were too generic for quantitative risk analysis and that useful inputs to the O&M model were very sparse. A hydrogen plant map was then created after a review of the current offshore wind–hydrogen systems in development, including Siemens Brande, ERM Dolphyn and Ørsted Gigastack. This resulted in the following components being included in the modelled system:
  • Desalination unit;
  • Electrolyser;
  • Export compressor;
  • Storage tank;
  • Fuel cell.
The inputs for each component were determined by the literature, synthesis or engineering judgement. When all failure rate, repair time and repair cost inputs were obtained for each component, they were inputted into the O&M model developed by the University of Strathclyde, along with other inputs representative of a wind farm consisting of 100 turbines rated at 3 MW each. The average lifetime availability of the offshore wind–hydrogen system was 85.24%, which was a drop in availability when compared with similar studies of wind farm O&M modelling. The main contribution to the downtime was the “Rest of Turbine—Minor Repair”, although in terms of the hydrogen system, the “Electrolyser—Major Replacement”, “DSU—Major Replacement” and “Fuel Cell—Major Replacement” categories contributed greatly to the downtime, surpassing the “Gearbox—Major Replacement” category. This could be explained by the infancy of the PEM electrolyser technology. In terms of the lifetime O&M costs, the main contributor to this was lost revenue, which totalled 38%, whereas the transport costs, which equated to 25%, mainly comprised the jack-up vessel costs. However, it was noted in this analysis that the CTVs and FSVs took a greater proportion of the transport costs when compared with similar studies, which was due to the assumption that no hydrogen equipment required jack-up vessels to repair failures in this study. Finally, the main contribution to repair costs was scheduled maintenance at 88%, which was ideal from a maintenance perspective, as the majority of costs came from a preventative perspective instead of a reactive one.
To summarise the work that was conducted by the authors of this paper, key O&M inputs, such as failure rates, repair times and repair costs, were discovered, synthesised and presented in this paper for hydrogen system components, which had not been attempted in the previous literature. O&M outputs, such as contributions to downtime, lifetime availability, contributions to O&M costs and transport costs, were also produced for a wind farm that was coupled with a hydrogen system, which, again, was not present in the literature. In terms of final remarks, it was shown that a coupled wind–hydrogen system could be feasible, as shown in this study; however, more accurate inputs are required to reduce the uncertainty associated with the O&M model.

Author Contributions

Conceptualization, R.L., O.D. and J.C.; methodology, R.L., O.D. and J.C.; validation, R.L.; formal analysis, R.L.; investigation, R.L.; data curation, R.L.; writing—original draft preparation, R.L.; writing—review and editing, J.C. and O.D.; supervision, J.C. and O.D. All authors have read and agreed to the published version of the manuscript.

Funding

This work was supported through the UK’s Engineering and Physical Research Council via the University of Strathclyde’s Wind and Marine Energy Systems and Structures Centre for Doctoral Training under grant numbers EP/S023801/1 and EP/T031549/1.

Institutional Review Board Statement

Not applicable.

Informed Consent Statement

Not applicable.

Data Availability Statement

The data presented in this study are available on request from the corresponding author. The data are not publicly available due to ongoing work.

Conflicts of Interest

The authors declare no conflicts of interest.

References

  1. Scottish Government. Scottish Energy Statistics Hub Index. 2023. Available online: https://www.gov.scot/publications/scottish-energy-statistics-hub-index/ (accessed on 7 August 2023).
  2. Scottish Government. Securing a Green Recovery on a Path to Net Zero: Climate Change Plan 2018–2032; Scottish Government: Edinburgh, UK, 2018.
  3. Offshore Renewable Energy Catapult. Offshore Wind and Hydrogen: Solving the Integration Challenge; Offshore Renewable Energy Catapult: Glasgow, UK, 2020. [Google Scholar]
  4. IRENA. Green Hydrogen: A Guide to Policy Making; International Renewable Energy Agency: Abu Dhabi, United Arab Emirates, 2020. [Google Scholar]
  5. Hassan, Q.; Abdulateef, A.M.; Hafedh, S.A.; Al-samari, A.; Abdulateef, J.; Sameen, A.Z.; Salman, H.M.; Al-Jiboory, A.K.; Wieteska, S.; Jaszczur, M. Renewable energy-to-green hydrogen: A review of main resources routes, processes and evaluation. Int. J. Hydrogen Energy 2023, 48, 17383–17408. [Google Scholar] [CrossRef]
  6. Net Zero Technology Centre. Technology Driving Green Energy Growth; Net Zero Technology Centre: Aberdeen, UK, 2023. [Google Scholar]
  7. West, M.; Al-Douri, A.; Hartmann, K.; Buttner, W.; Groth, K.M. Critical review and analysis of hydrogen safety data collection tools. Int. J. Hydrogen Energy 2022, 47, 17845–17858. [Google Scholar] [CrossRef]
  8. Lam, C.; Fuse, M.; Shimizu, T. Assessment of risk factors and effects in hydrogen logistics incidents from a network modeling perspective. Int. J. Hydrogen Energy 2019, 44, 20572–20586. [Google Scholar] [CrossRef]
  9. Barilo, N. Safety considerations for hydrogen and fuel cell applications. In Proceedings of the Hydrogen Safety Panel, ICC Annual Business Meeting, Long Beach, CA, USA, 27–29 September 2015. [Google Scholar]
  10. Wen, J.X.; Marono, M.; Moretto, P.; Reinecke, E.A.; Sathiah, P.; Studer, E.; Vyazmina, E.; Melideo, D. Statistics, lessons learned and recommendations from analysis of HIAD 2.0 database. Int. J. Hydrogen Energy 2022, 47, 17082–17096. [Google Scholar] [CrossRef]
  11. NREL. Next Generation Hydrogen Station Composite Data Products. 2023. Available online: https://www.nrel.gov/hydrogen/infrastructure-cdps-retail.html (accessed on 13 August 2023).
  12. Groth, K.M.; Al-Douri, A.; West, M.; Hartmann, K.; Saur, G.; Buttner, W. Design and requirements of a hydrogen component reliability database (HyCReD). Int. J. Hydrogen Energy 2023, 51, 1023–1037. [Google Scholar] [CrossRef]
  13. OREDA. OREDA Offshore Reliability Data; OREDA: Bhubaneswar, India, 2015. [Google Scholar]
  14. American Institute of Chemical Engineers; Center for Chemical Process Safety and CCPS (Center for Chemical 714 Process Safety). Guidelines for Process Equipment Reliability Data, with Data Tables; Wiley-AIChE: New York, NY, USA, 1989. [Google Scholar]
  15. Leib, C.T.M.; Pereira, C.; Maloney, J. Perry’s Chemical Engineers’ Handbook; McGraw-Hill: New York, NY, USA, 2008. [Google Scholar]
  16. Carroll, J.; McDonald, A.; McMillan, D.; Feuchtwang, J. Offshore availability for wind turbines with a hydraulic drive train. In Proceedings of the 3rd Renewable Power Generation Conference (RPG 2014), Naples, Italy, 24–25 September 2014; pp. 1–6. [Google Scholar]
  17. Greiner, C.J.; KorpÅs, M.; Holen, A.T. A Norwegian case study on the production of hydrogen from wind power. Int. J. Hydrogen Energy 2007, 32, 1500–1507. [Google Scholar] [CrossRef]
  18. Valverde-Isorna, L.; Ali, D.; Hogg, D.; Abdel-Wahab, M. Modelling the performance of wind–hydrogen energy systems: Case study the Hydrogen Office in Scotland/UK. Renew. Sustain. Energy Rev. 2016, 53, 1313–1332. [Google Scholar] [CrossRef]
  19. Chade, D.; Miklis, T.; Dvorak, D. Feasibility study of wind-to-hydrogen system for Arctic remote locations–Grimsey island case study. Renew. Energy 2015, 76, 204–211. [Google Scholar] [CrossRef]
  20. Siemens Gamesa. Green Hydrogen Unlocked: Brande Hydrogen; Siemens Gamesa: Zamudio, Spain, 2022. [Google Scholar]
  21. Newsletter, H. PEM (Proton Exchange Membrane) Electrolyzers vs. AEL (Alkaline Electrolysis) Electrolyzers: What Is the Best Selection for a Green Hydrogen Project? 2022. Available online: https://www.hydrogennewsletter.com/untitled-2/ (accessed on 26 August 2023).
  22. ERM Dolphyn. ERM Dolphyn Hydrogen Phase 2 Report; ERM Dolphyn: Manchester, UK, 2021. [Google Scholar]
  23. Lliffe, M. The Commercial Case for Hydrogen as a Route to Market for Offshore Wind in the North Sea. In Proceedings of the SPE Offshore Europe Conference and Exhibition, Online, 7–10 September 2021; p. D031S010R002. [Google Scholar]
  24. Ørsted. Gigastack Phase 2 Report; Ørsted: Fredericia, Denmark, 2021. [Google Scholar]
  25. Ibrahim, O.S.; Singlitico, A.; Proskovics, R.; McDonagh, S.; Desmond, C.; Murphy, J.D. Dedicated large-scale floating offshore wind to hydrogen: Assessing design variables in proposed typologies. Renew. Sustain. Energy Rev. 2022, 160, 112310. [Google Scholar] [CrossRef]
  26. Scottish Government. Offshore Wind to Green Hydrogen: Opportunity Assessment; Scottish Government: Edinburgh, UK, 2020.
  27. Carroll, J.; McDonald, A.; Dinwoodie, I.; McMillan, D.; Revie, M.; Lazakis, I. Availability, operation and maintenance costs of offshore wind turbines with different drive train configurations. Wind Energy 2017, 20, 361–378. [Google Scholar] [CrossRef]
  28. Dalgic, Y.; Lazakis, I.; Turan, O. Investigation of optimum crew transfer vessel fleet for offshore wind farm maintenance operations. Wind Eng. 2015, 39, 31–52. [Google Scholar] [CrossRef]
  29. Dalgic, Y.; Lazakis, I.; Dinwoodie, I.; McMillan, D.; Revie, M. Advanced logistics planning for offshore wind farm operation and maintenance activities. Ocean Eng. 2015, 101, 211–226. [Google Scholar] [CrossRef]
  30. Liu, B.; Liu, S.; Guo, S.; Zhang, S. Economic study of a large-scale renewable hydrogen application utilizing surplus renewable energy and natural gas pipeline transportation in China. Int. J. Hydrogen Energy 2020, 45, 1385–1398. [Google Scholar] [CrossRef]
  31. G+ Global Offshore Wind Health Organisation. Good Practice Guidelines; G+ Global Offshore Wind Health Organisation: London, UK, 2018. [Google Scholar]
  32. Gaborieau, M.; Yilmaz, O.C.; Dykes, K. Economic impact assessment of Hydrogen generated from Offshore Wind: A case study for Belgium. J. Phys. Conf. Ser. 2023, 2507, 012012. [Google Scholar] [CrossRef]
  33. Cummins. Hydrogen: The Next Generation of Cummins Electrolyser Technologies. 2023. Available online: https://www.cummins.com/sites/default/files/2021-08/cummins-hydrogen-generation-brochure-20210603.pdf. (accessed on 31 August 2023).
  34. Carroll, J.; McDonald, A.; McMillan, D. Failure rate, repair time and unscheduled O&M cost analysis of offshore wind turbines. Wind Energy 2016, 19, 1107–1119. [Google Scholar]
  35. Glenk, G.; Reichelstein, S. Economics of converting renewable power to hydrogen. Nat. Energy 2019, 4, 216–222. [Google Scholar] [CrossRef]
  36. National Renewable Energy Laborotary. Wind-to-Hydrogen Project: Electrolszer Capital Cost Study; National Renewable Energy Laborotary: Golden, CO, USA, 2008.
  37. McDonagh, S.; O’Shea, R.; Wall, D.M.; Deane, J.P.; Murphy, J.D. Modelling of a power-to-gas system to predict the levelised cost of energy of an advanced renewable gaseous transport fuel. Appl. Energy 2018, 215, 444–456. [Google Scholar] [CrossRef]
  38. National Renewable Laboratory. NREL Composite Data Products—Equipment Repair Times. 2023. Available online: https://www.nrel.gov/hydrogen/assets/images/cdp-retail-infr-23.jpg (accessed on 2 September 2023).
  39. Hamdi, M.; Thirua, S.; Gzara, L.; Mahfouz, A. Application of factorial design for modeling reverse osmosis process using thin film composite polyamide membrane: A theoretical analysis and experimental validation. Desalin. Water Treat. 2018, 124, 37–52. [Google Scholar] [CrossRef]
  40. Singlitico, A.; Østergaard, J.; Chatzivasileiadis, S. Onshore, offshore or in-turbine electrolysis? Techno-economic overview of alternative integration designs for green hydrogen production into Offshore Wind Power Hubs. Renew. Sustain. Energy Transit. 2021, 1, 100005. [Google Scholar] [CrossRef]
  41. Lenntech. LennRO Containerized Sea Water Desalinations Systems. 2023. Available online: https://www.lenntech.com/Data-sheets/ES_LennRO_SW_M_cont_rev01.pdf (accessed on 6 September 2023).
  42. Houchins, C.; James, B. Hydrogen Storage Cost Analysis; United States Department of Energy: Washington, DC, USA, 2022.
  43. Wang, Y.; Pang, Y.; Xu, H.; Martinez, A.; Chen, K.S. PEM Fuel cell and electrolysis cell technologies and hydrogen infrastructure development—A review. Energy Environ. Sci. 2022, 15, 2288–2328. [Google Scholar] [CrossRef]
  44. Dinwoodie, I. Modelling the Operation and Maintenance of Offshore Wind Farms. Ph.D. Thesis, Department of Electrical and Electronic Engineering, University of Strathclyde, Glasgow, UK, 2014. [Google Scholar]
  45. Bumdesamt für Seeschiffahrt und Hydrographie. FINO 1 Meteorological Dataset 2004–2012. 2012. Available online: https://www.bsh.de (accessed on 8 September 2023).
  46. Net Zero Technology Centre. Hydrogen Backbone Link Report; Net Zero Technology Centre: Aberdeen, UK, 2023. [Google Scholar]
  47. Chiachío-Ruano, J.; Hermile, M.; Kolios, A. A sensitivity study for operational availability of offshore wind energy assets. Int. Conf. Offshore Mech. Arct. Eng. 2019, 58783, V003T02A073. [Google Scholar]
  48. Jenkins, B.; Belton, I.; Carroll, J.; McMillan, D. Estimating the major replacement rates in next-generation offshore wind turbines using structured expert elicitation. J. Phys. Conf. Ser. 2022, 2362, 012020. [Google Scholar] [CrossRef]
Figure 1. Siemens Gamesa Brande hydrogen system components.
Wind 04 00007 g001
Figure 2. ERM Dolphyn project system components.
Wind 04 00007 g002
Figure 3. Gigastack project system components.
Wind 04 00007 g003
Figure 4. Coupled wind–hydrogen system plant map.
Wind 04 00007 g004
Figure 5. Sub-components of DSU.
Wind 04 00007 g005
Figure 6. Contributions to downtime.
Wind 04 00007 g006
Figure 7. Contributions to downtime (hydrogen system only).
Wind 04 00007 g007
Figure 8. Contributions to lifetime O&M costs.
Wind 04 00007 g008
Figure 9. Contributions to transport costs.
Wind 04 00007 g009
Figure 10. Failure rate sensitivity analysis.
Wind 04 00007 g010
Figure 11. Repair time sensitivity analysis.
Wind 04 00007 g011
Figure 12. Number of technicians sensitivity analysis.
Wind 04 00007 g012
Table 1. O&M inputs for PEM electrolyser.
InputMinor RepairMajor RepairMajor Replacement
Failure rate0.55800.29410.1030
Repair times (h)1.3469516.6708
Repair costs (£)664.043014,852.6367252,817.1424
Number of technicians2.35422.91946
Table 2. O&M inputs for desalination unit.
InputMinor RepairMajor RepairMajor Replacement
Failure rate1.52450.80340.1143
Repair times (h)0.94283.511.6696
Repair costs (£)2009.329444,942.6292765,000.0000
Number of technicians2.35422.91946
Table 3. O&M inputs for export compressor.
InputMinor RepairMajor RepairMajor Replacement
Failure rate0.76130.44800.1091
Repair times (h)1.3469516.6708
Repair costs (£)486.483910,880.1699185,199.1758
Number of technicians2.35422.91946
Table 4. O&M inputs for storage tank.
InputMinor RepairMajor RepairMajor Replacement
Failure rate0.29350.04650.0412
Repair times (h)2.69381033.3417
Repair costs (£)814.842218,225.5579310,230.0000
Number of technicians2.35422.91946
Disclaimer/Publisher’s Note: The statements, opinions and data contained in all publications are solely those of the individual author(s) and contributor(s) and not of MDPI and/or the editor(s). MDPI and/or the editor(s) disclaim responsibility for any injury to people or property resulting from any ideas, methods, instructions or products referred to in the content.

