
Towards an Integrated Design of Direct-Drive Wind Turbine Electrical Generator Supporting Structures


Abstract
:1. Introduction
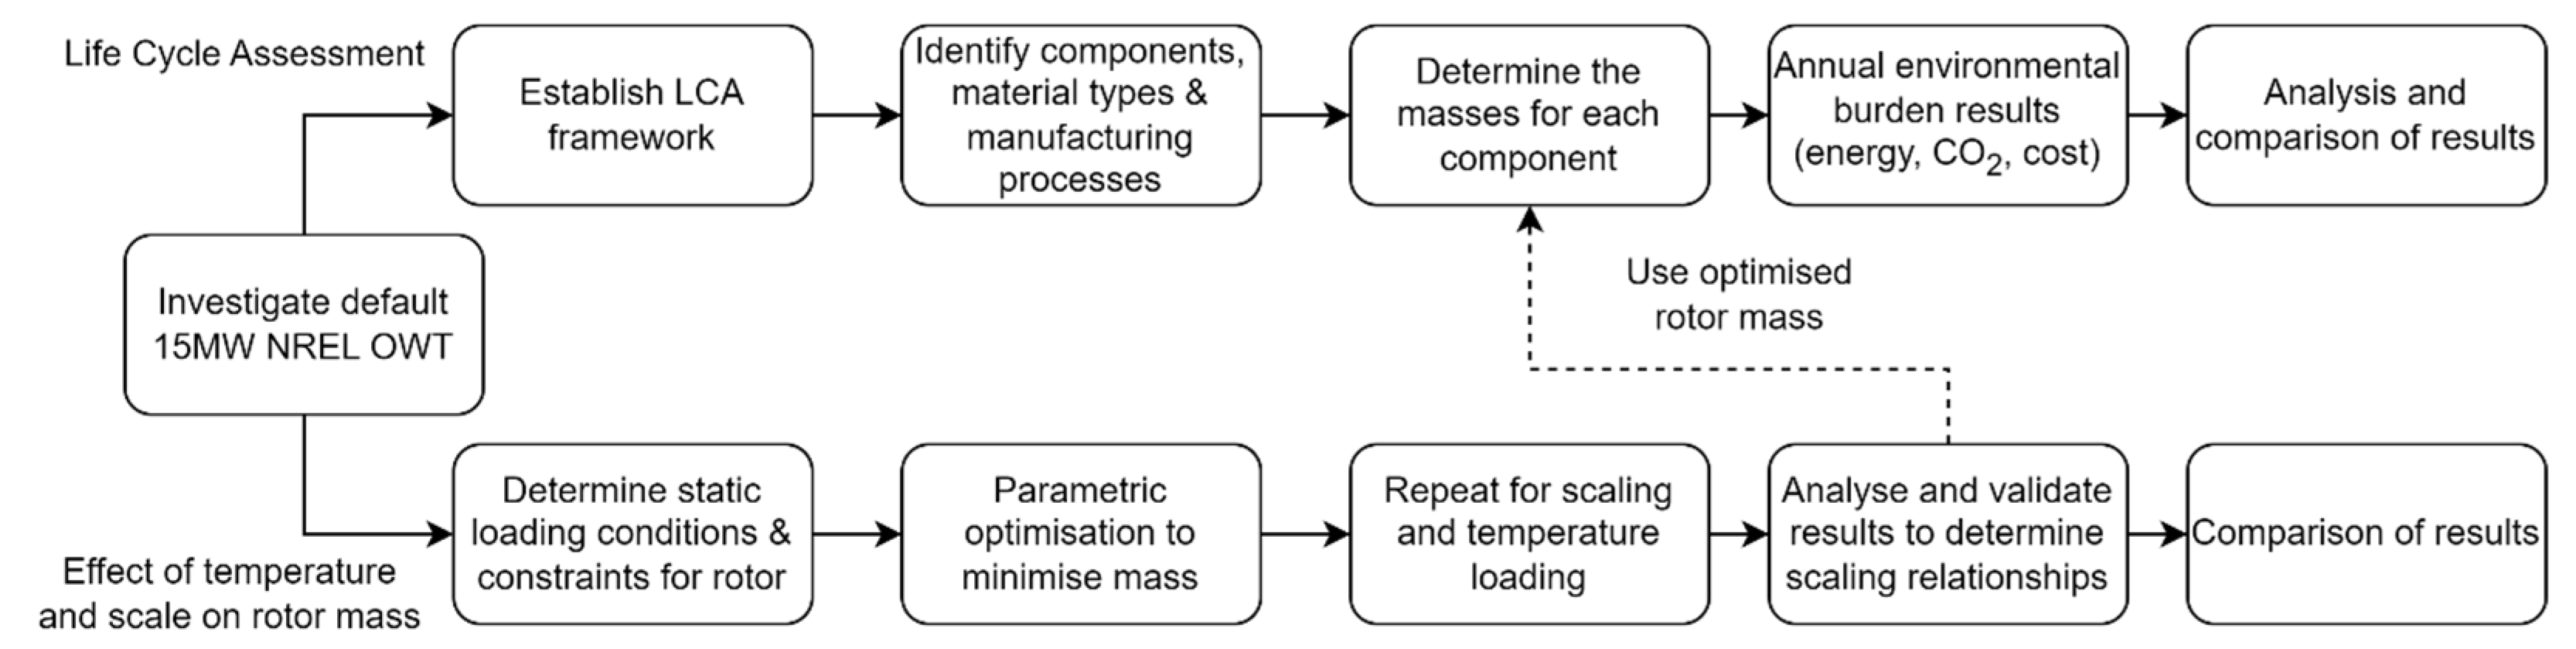
2. Methodology
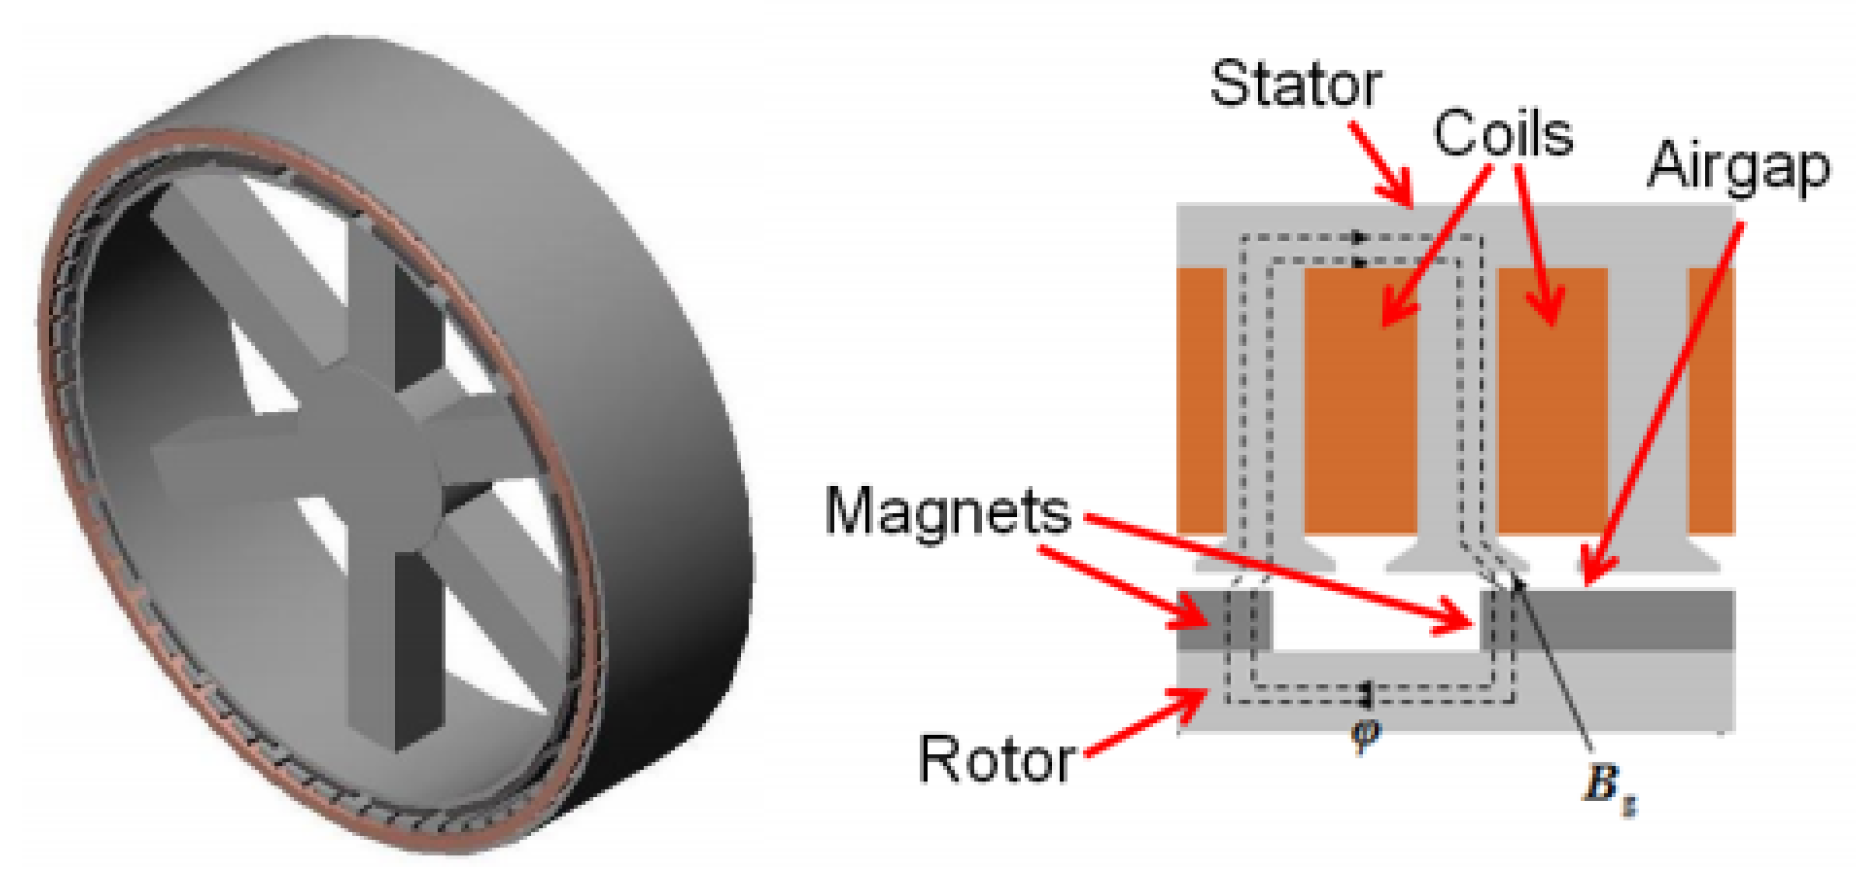
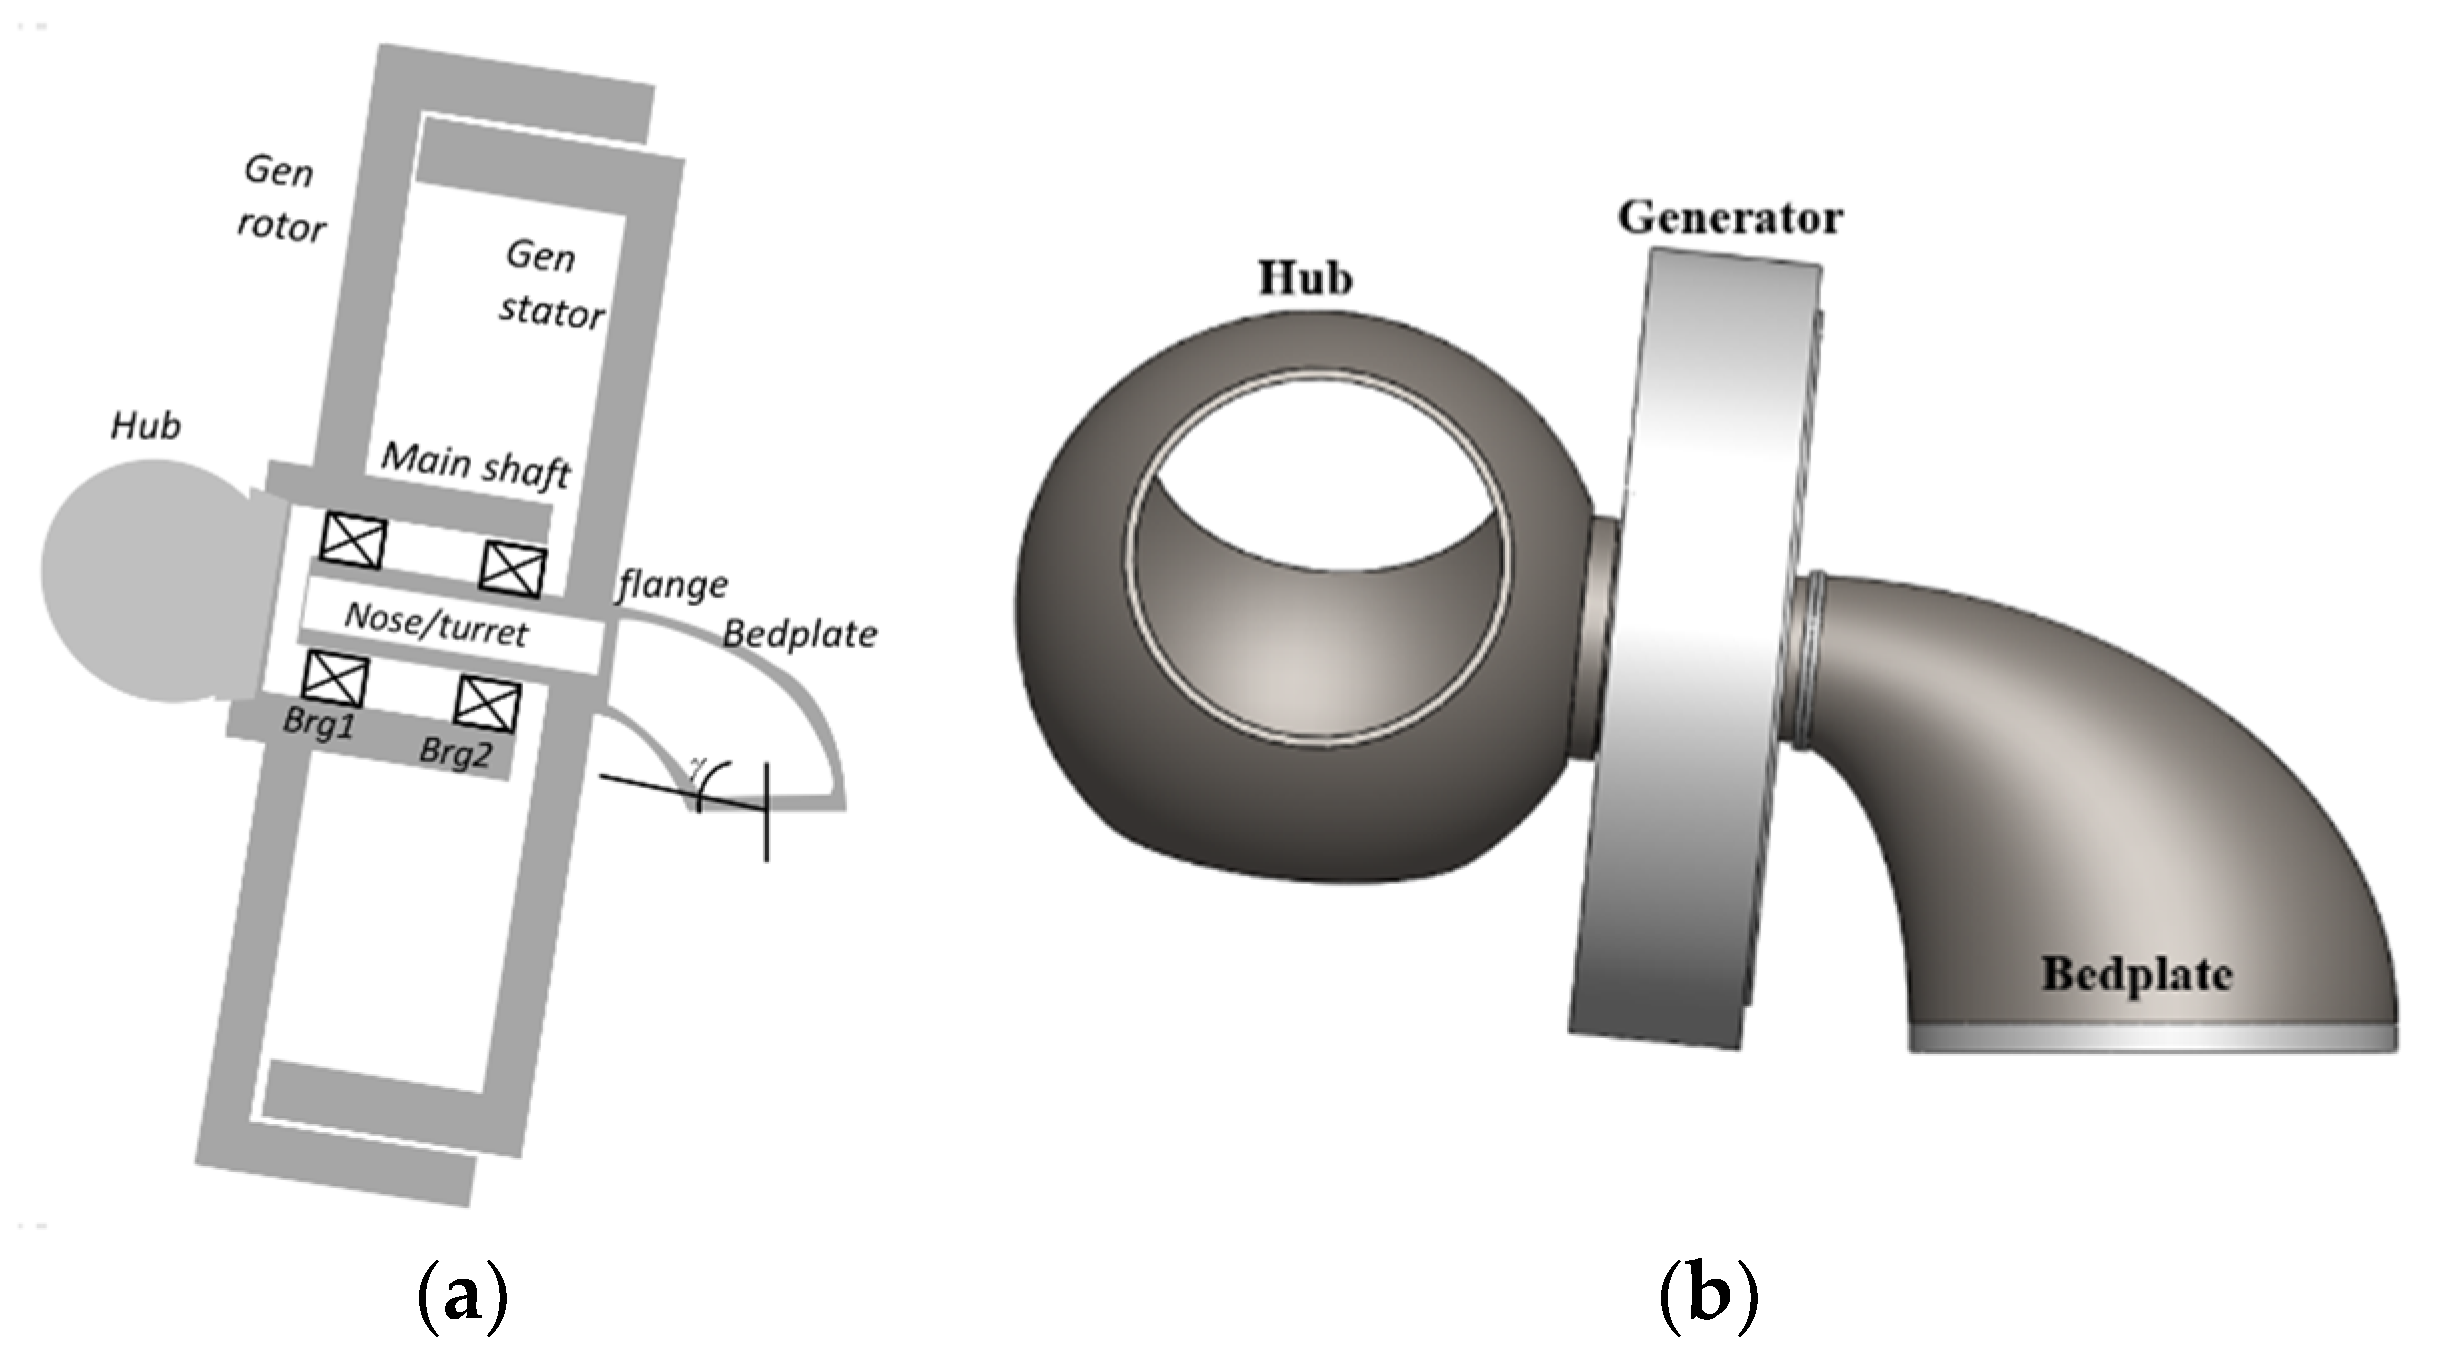
2.1. Initial Rotor Evaluation
- Airgap length: 10.16 mm;
- Rotor rim thickness: 63.69 mm;
- Rotor disc thickness: 81.75 mm;
- Total rotor structural steel mass: 86.2 tons;
- Structural material: plain carbon steel.
2.2. Scaling Considerations
2.3. LCA Framework
3. Results and Discussion
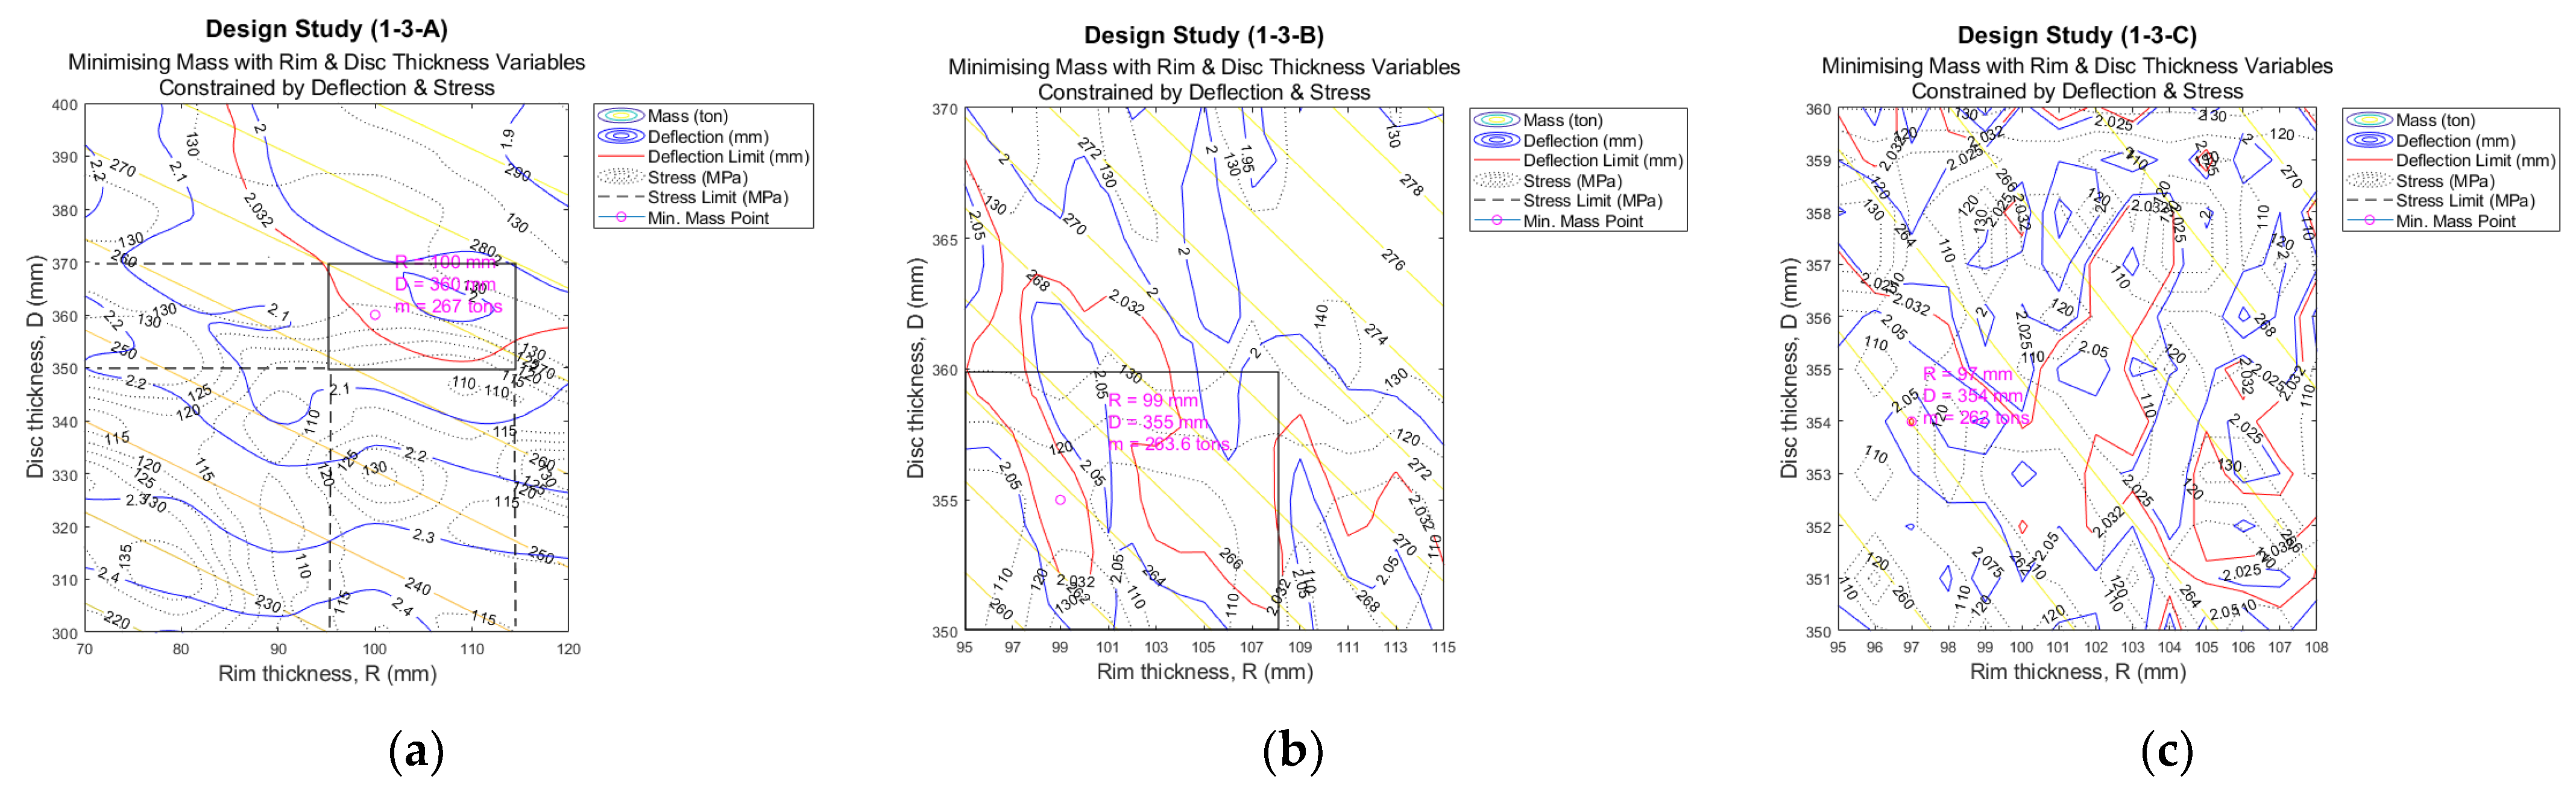
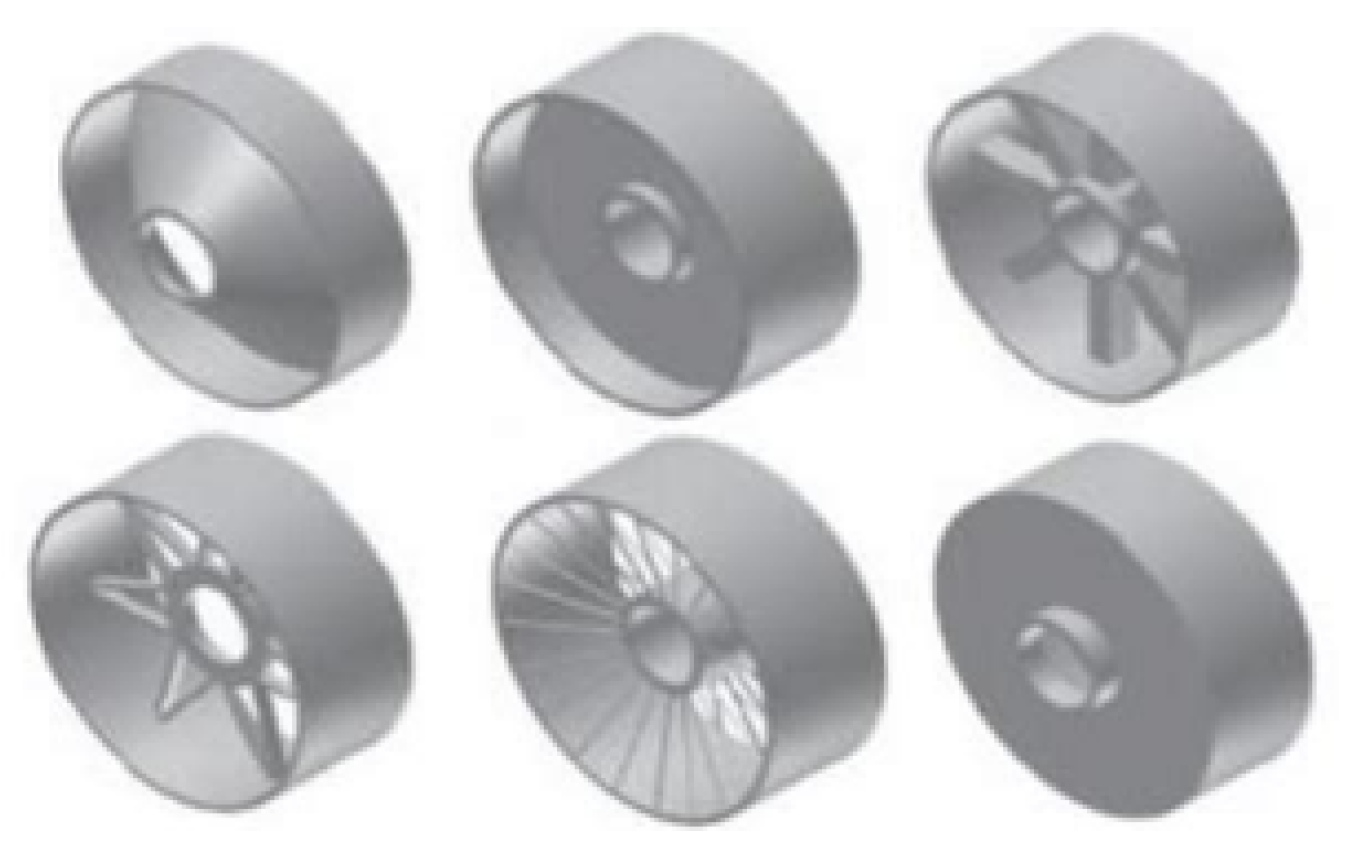
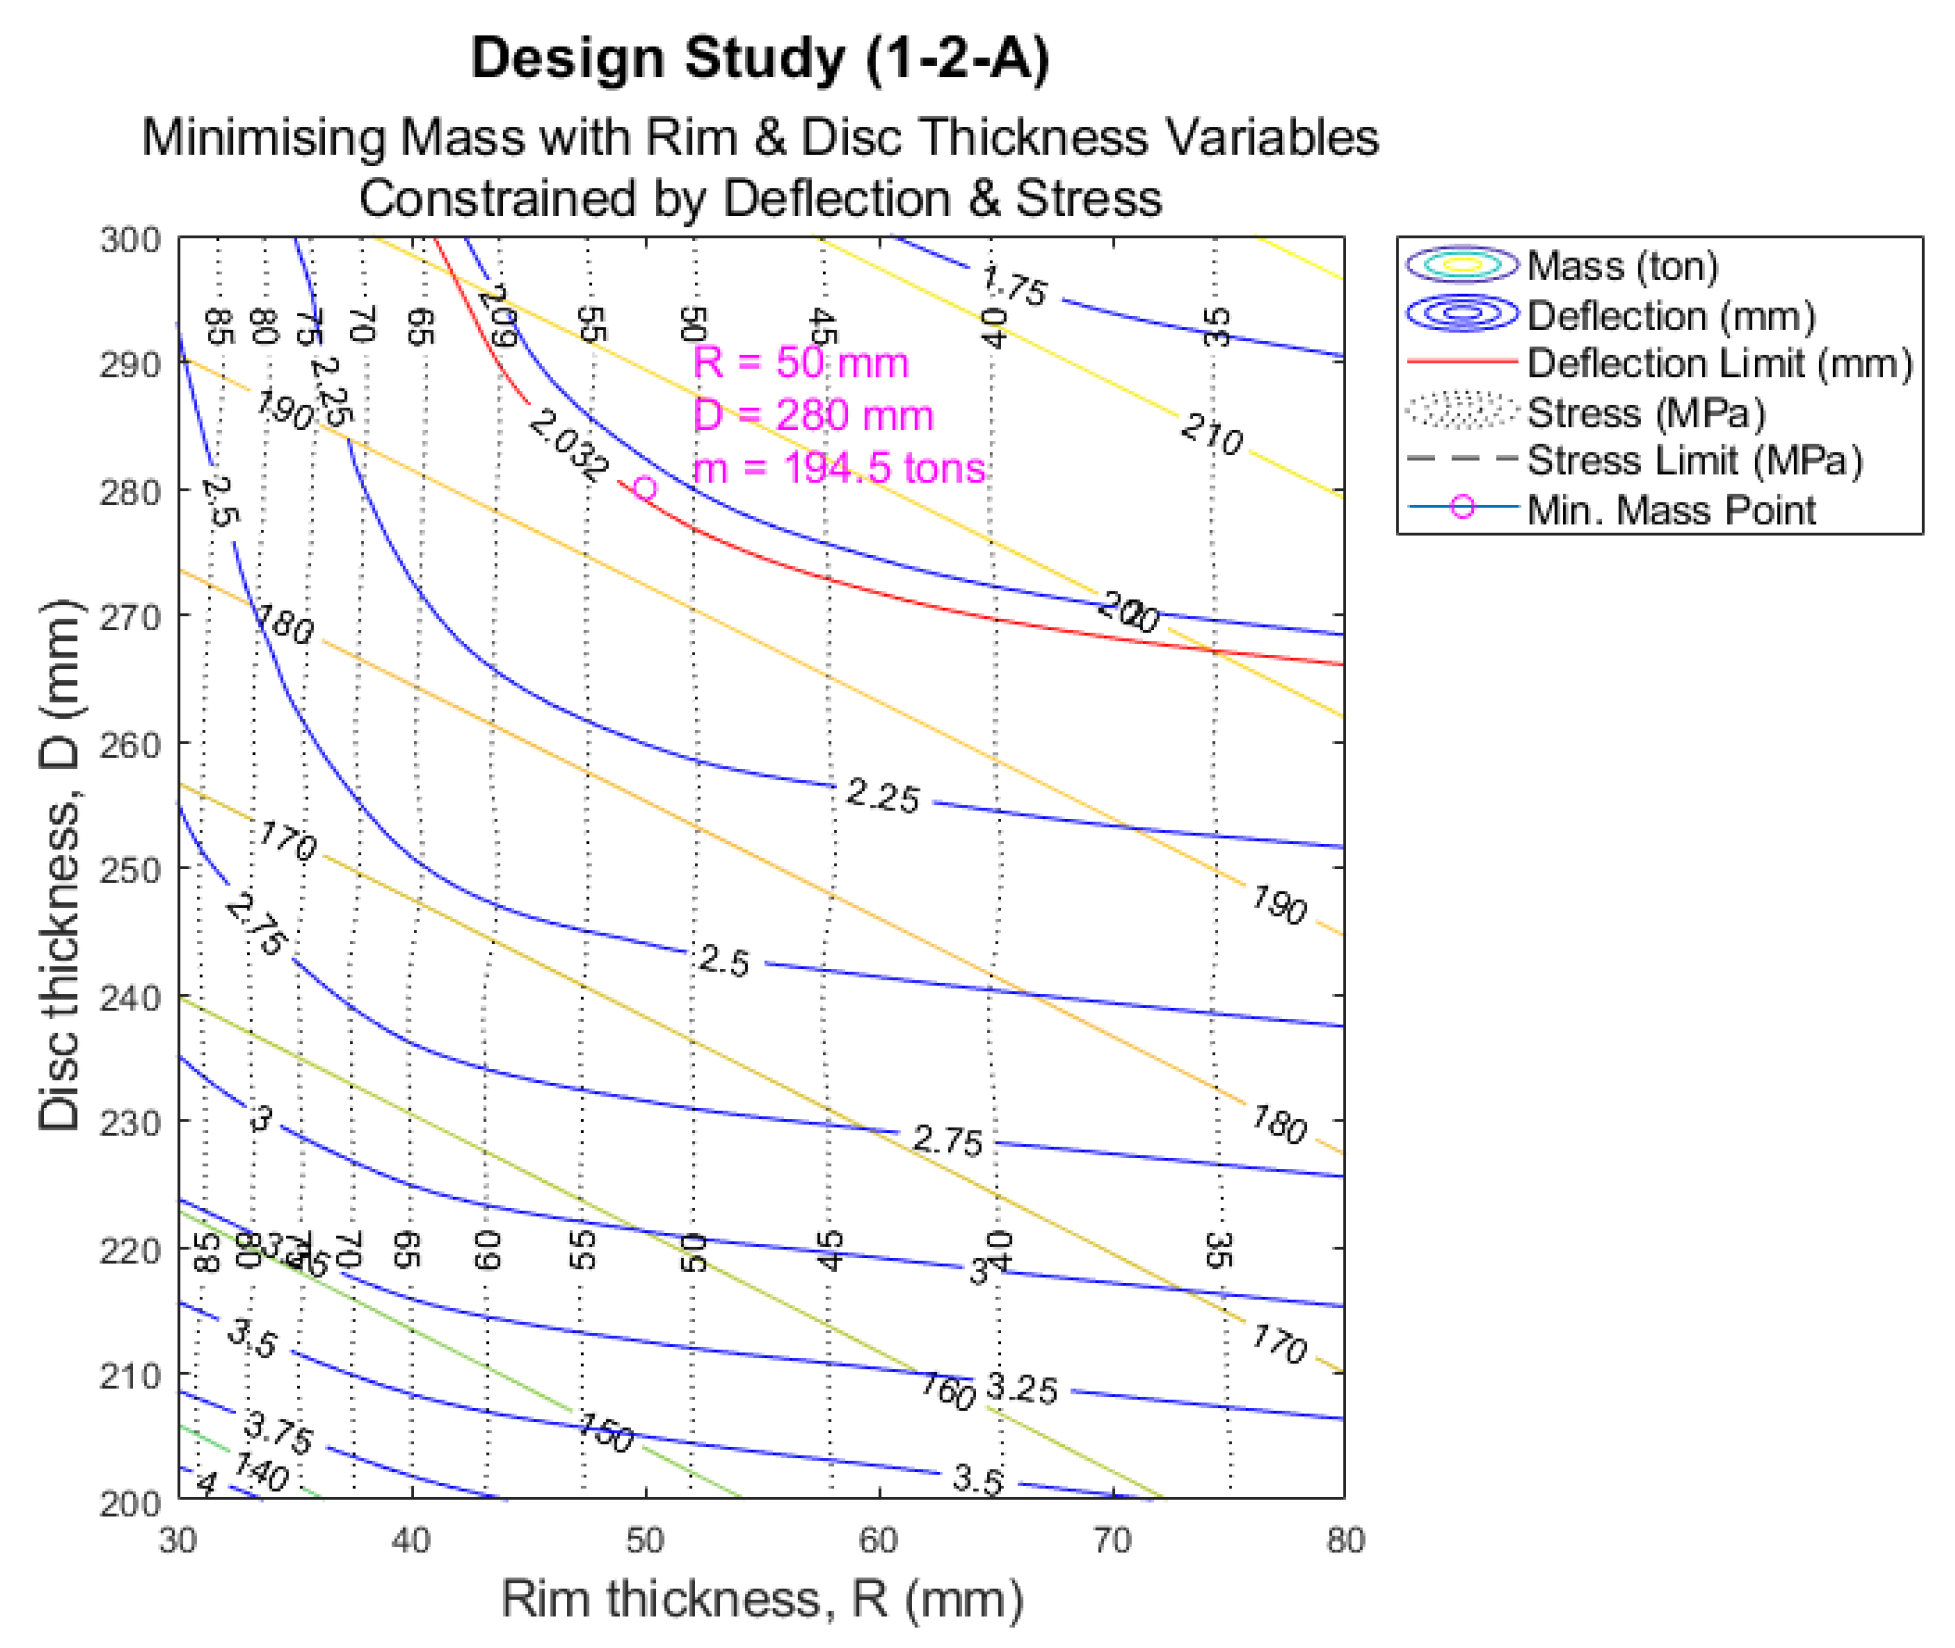
3.1. Comparison between Structures Using Contour Plots
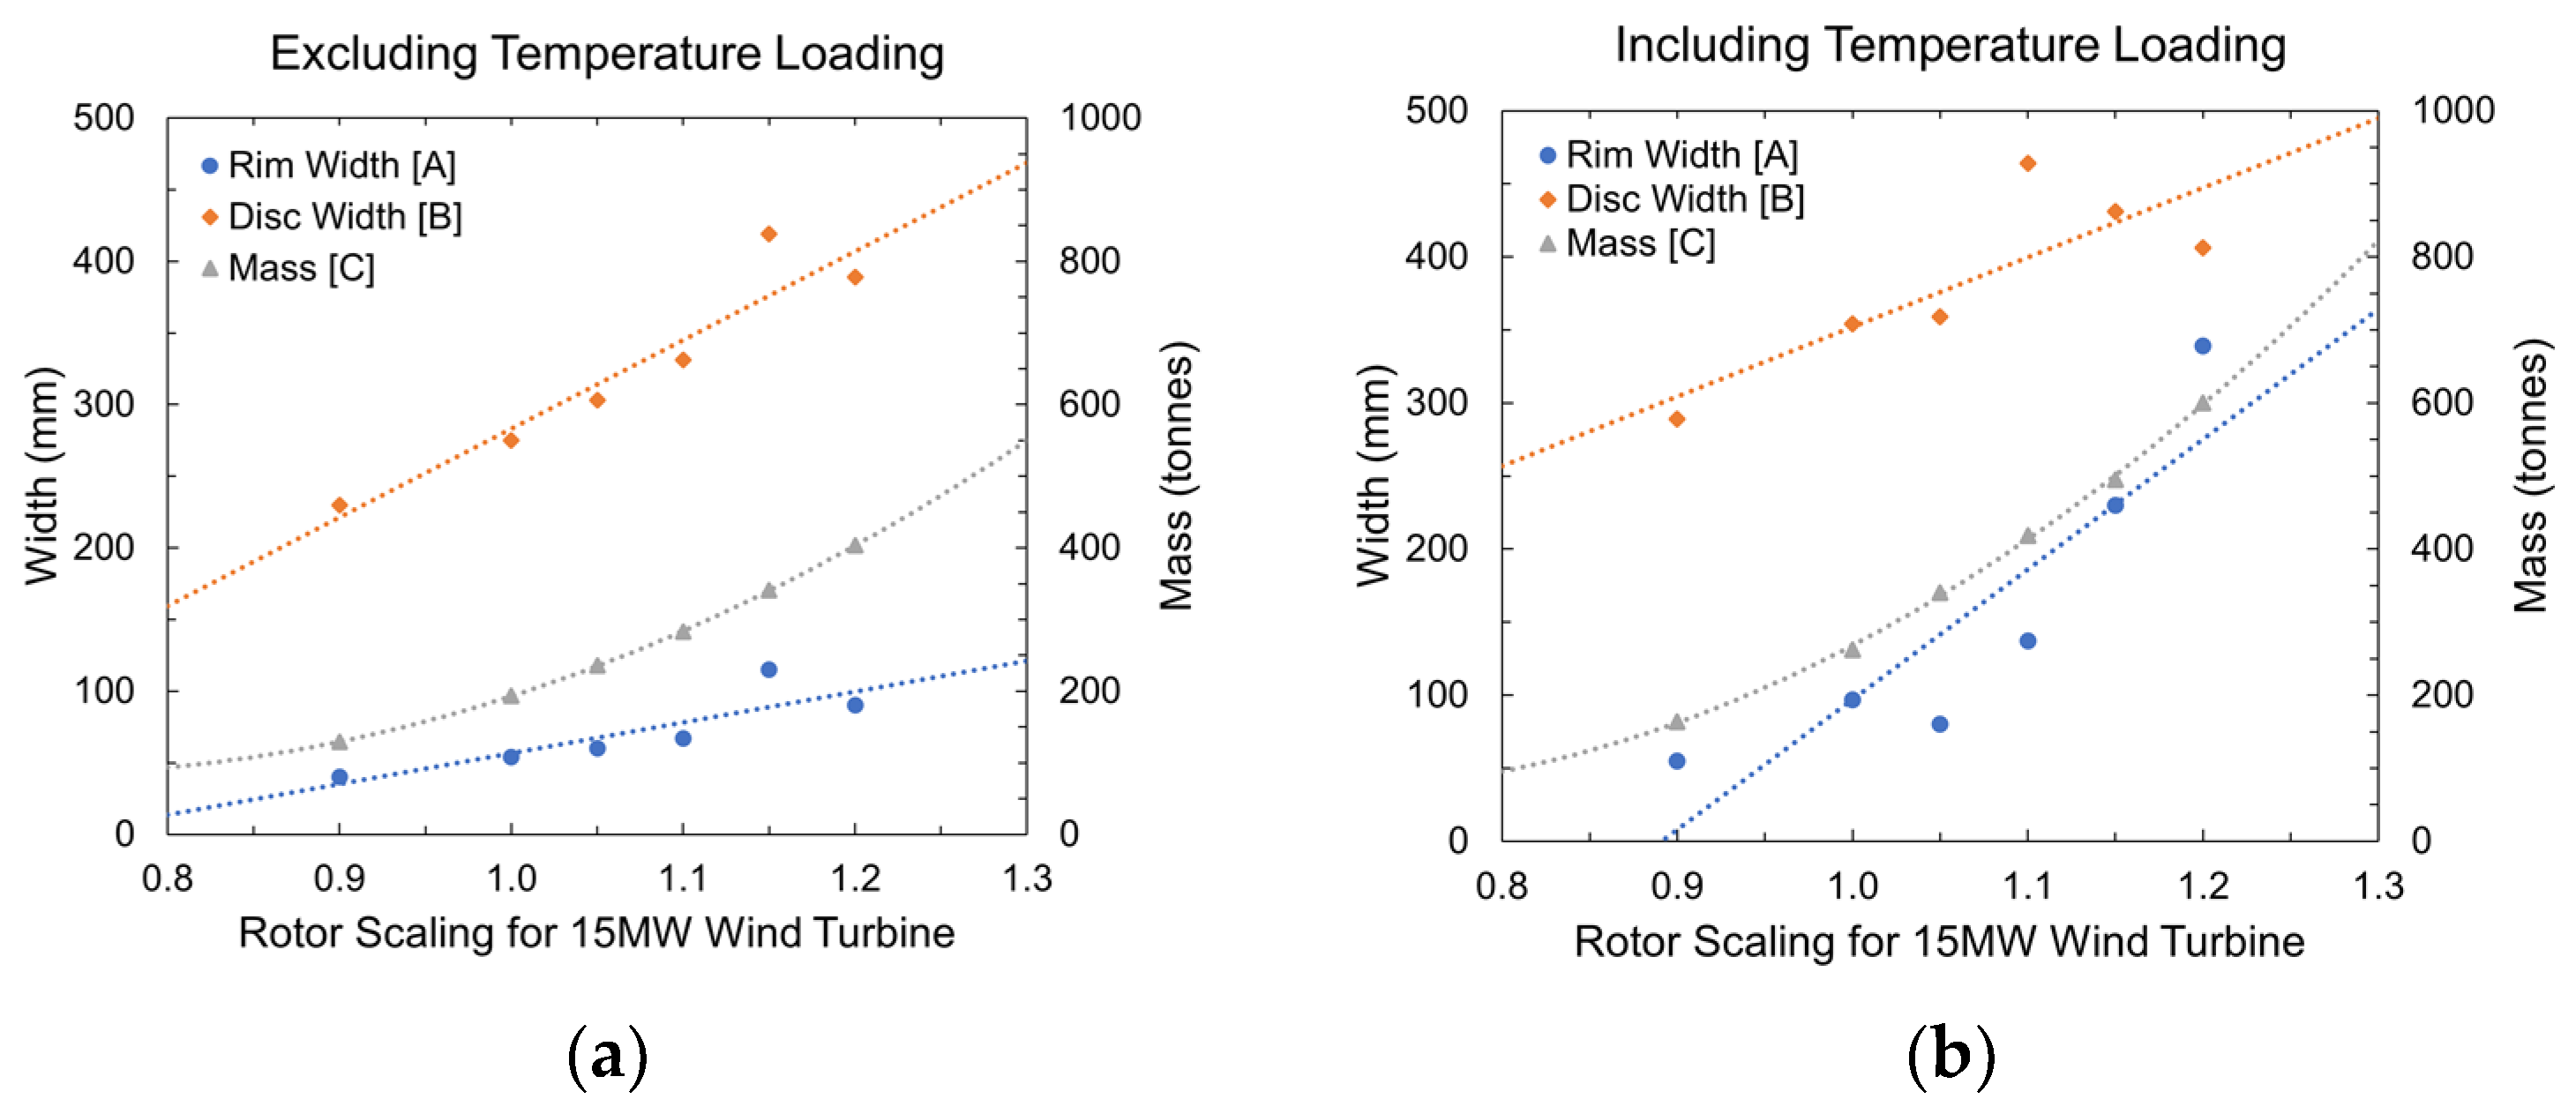
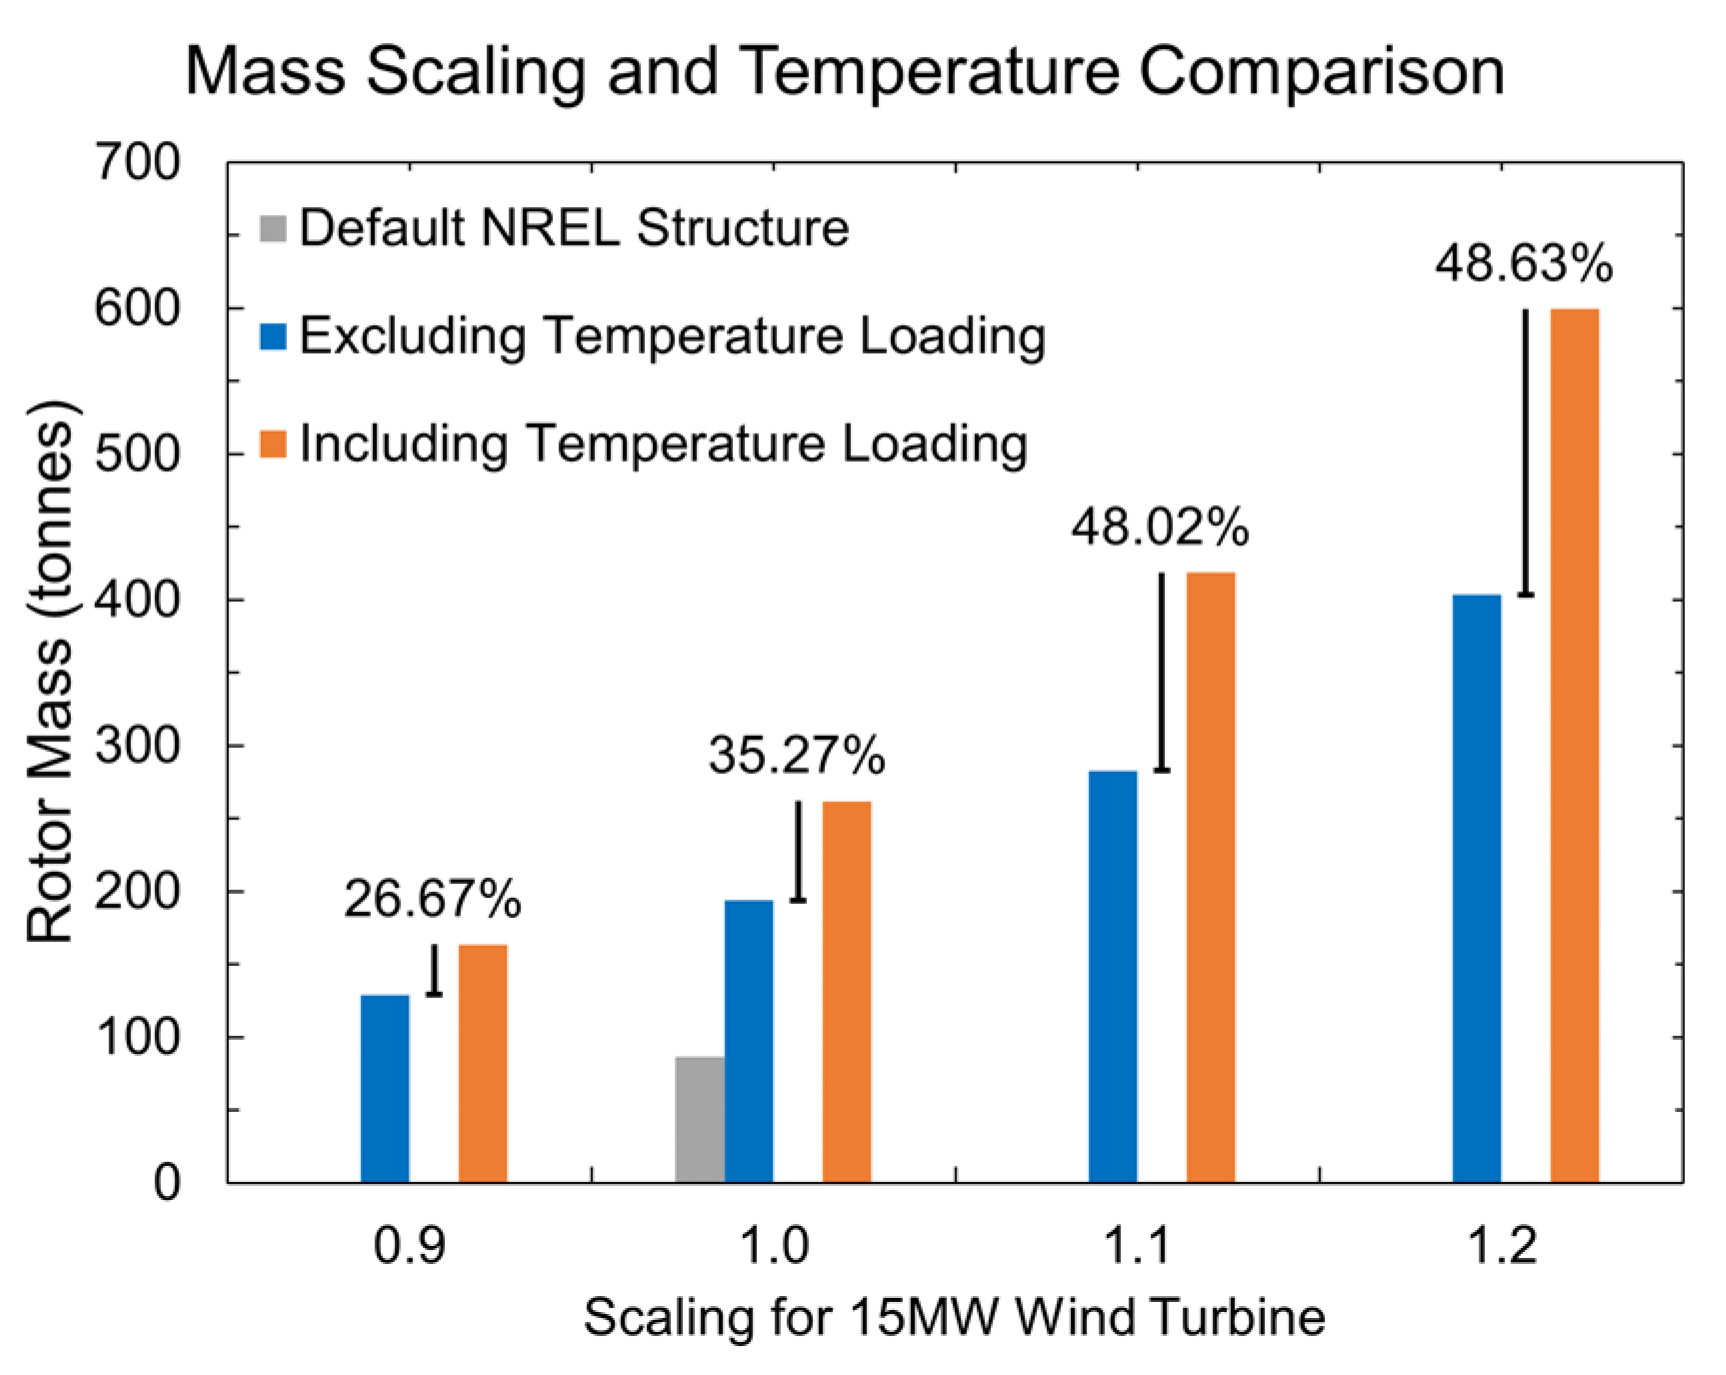
3.2. Deriving Validated Scaling Rules
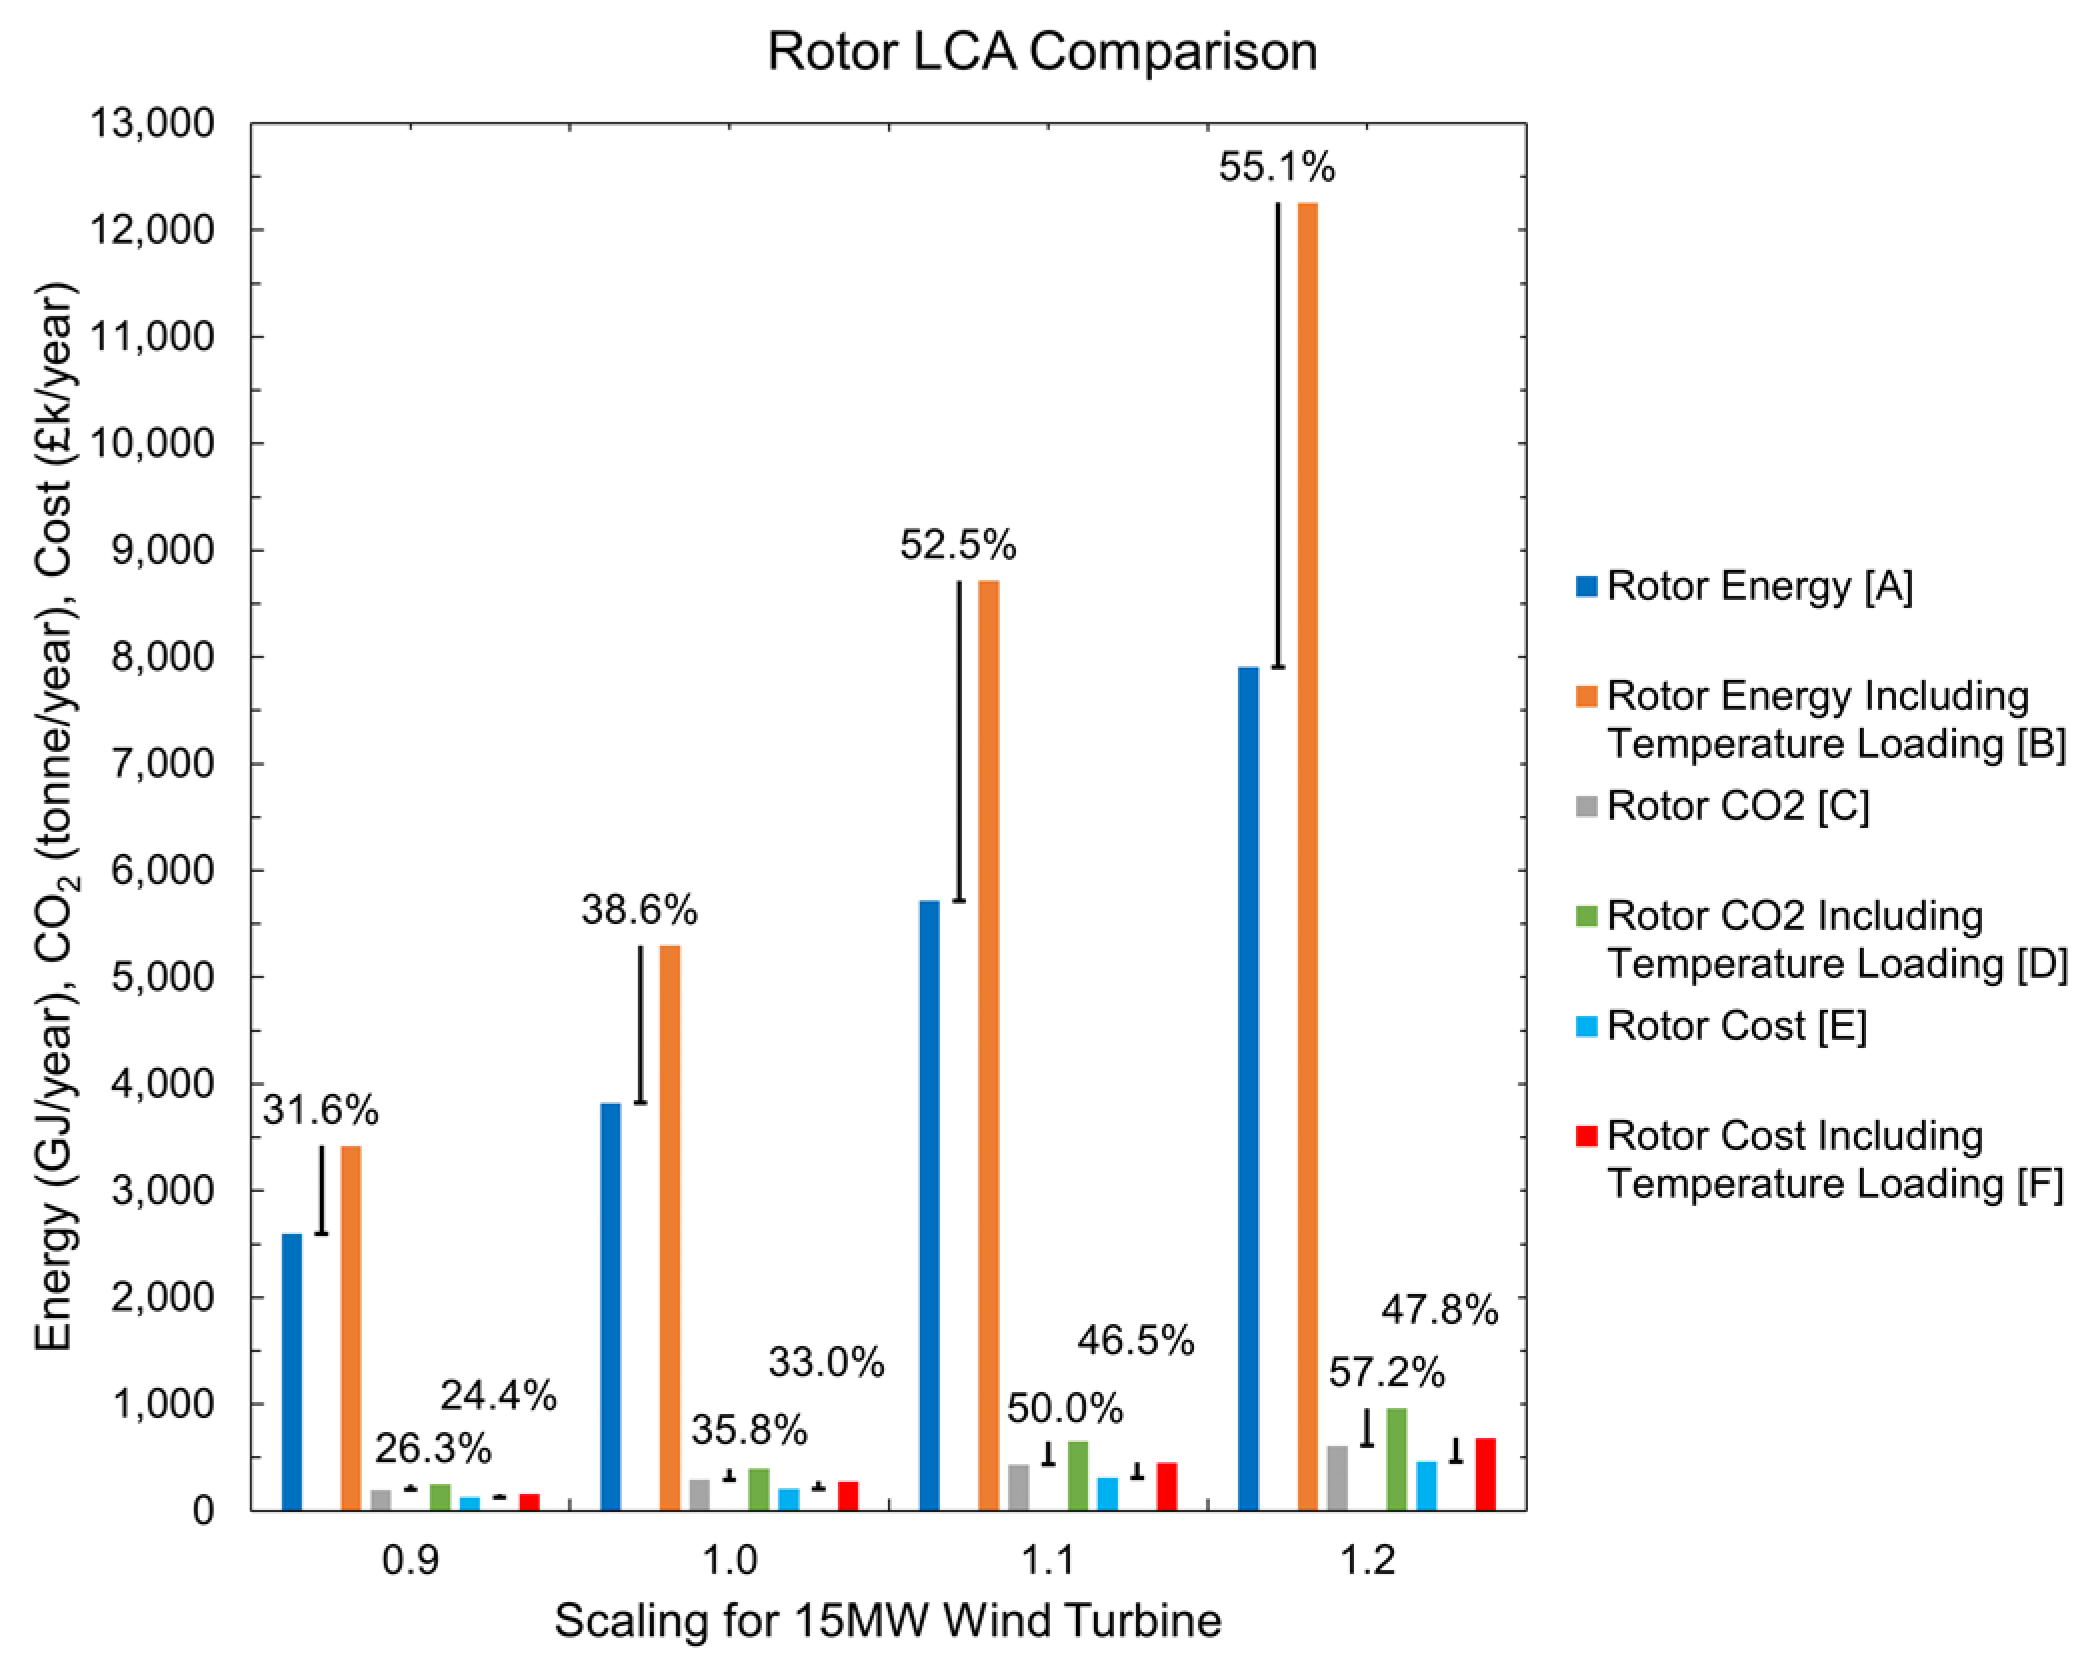
3.3. LCA—Turbine and Electrical Generator Rotor
4. Conclusions
Author Contributions
Funding
Conflicts of Interest
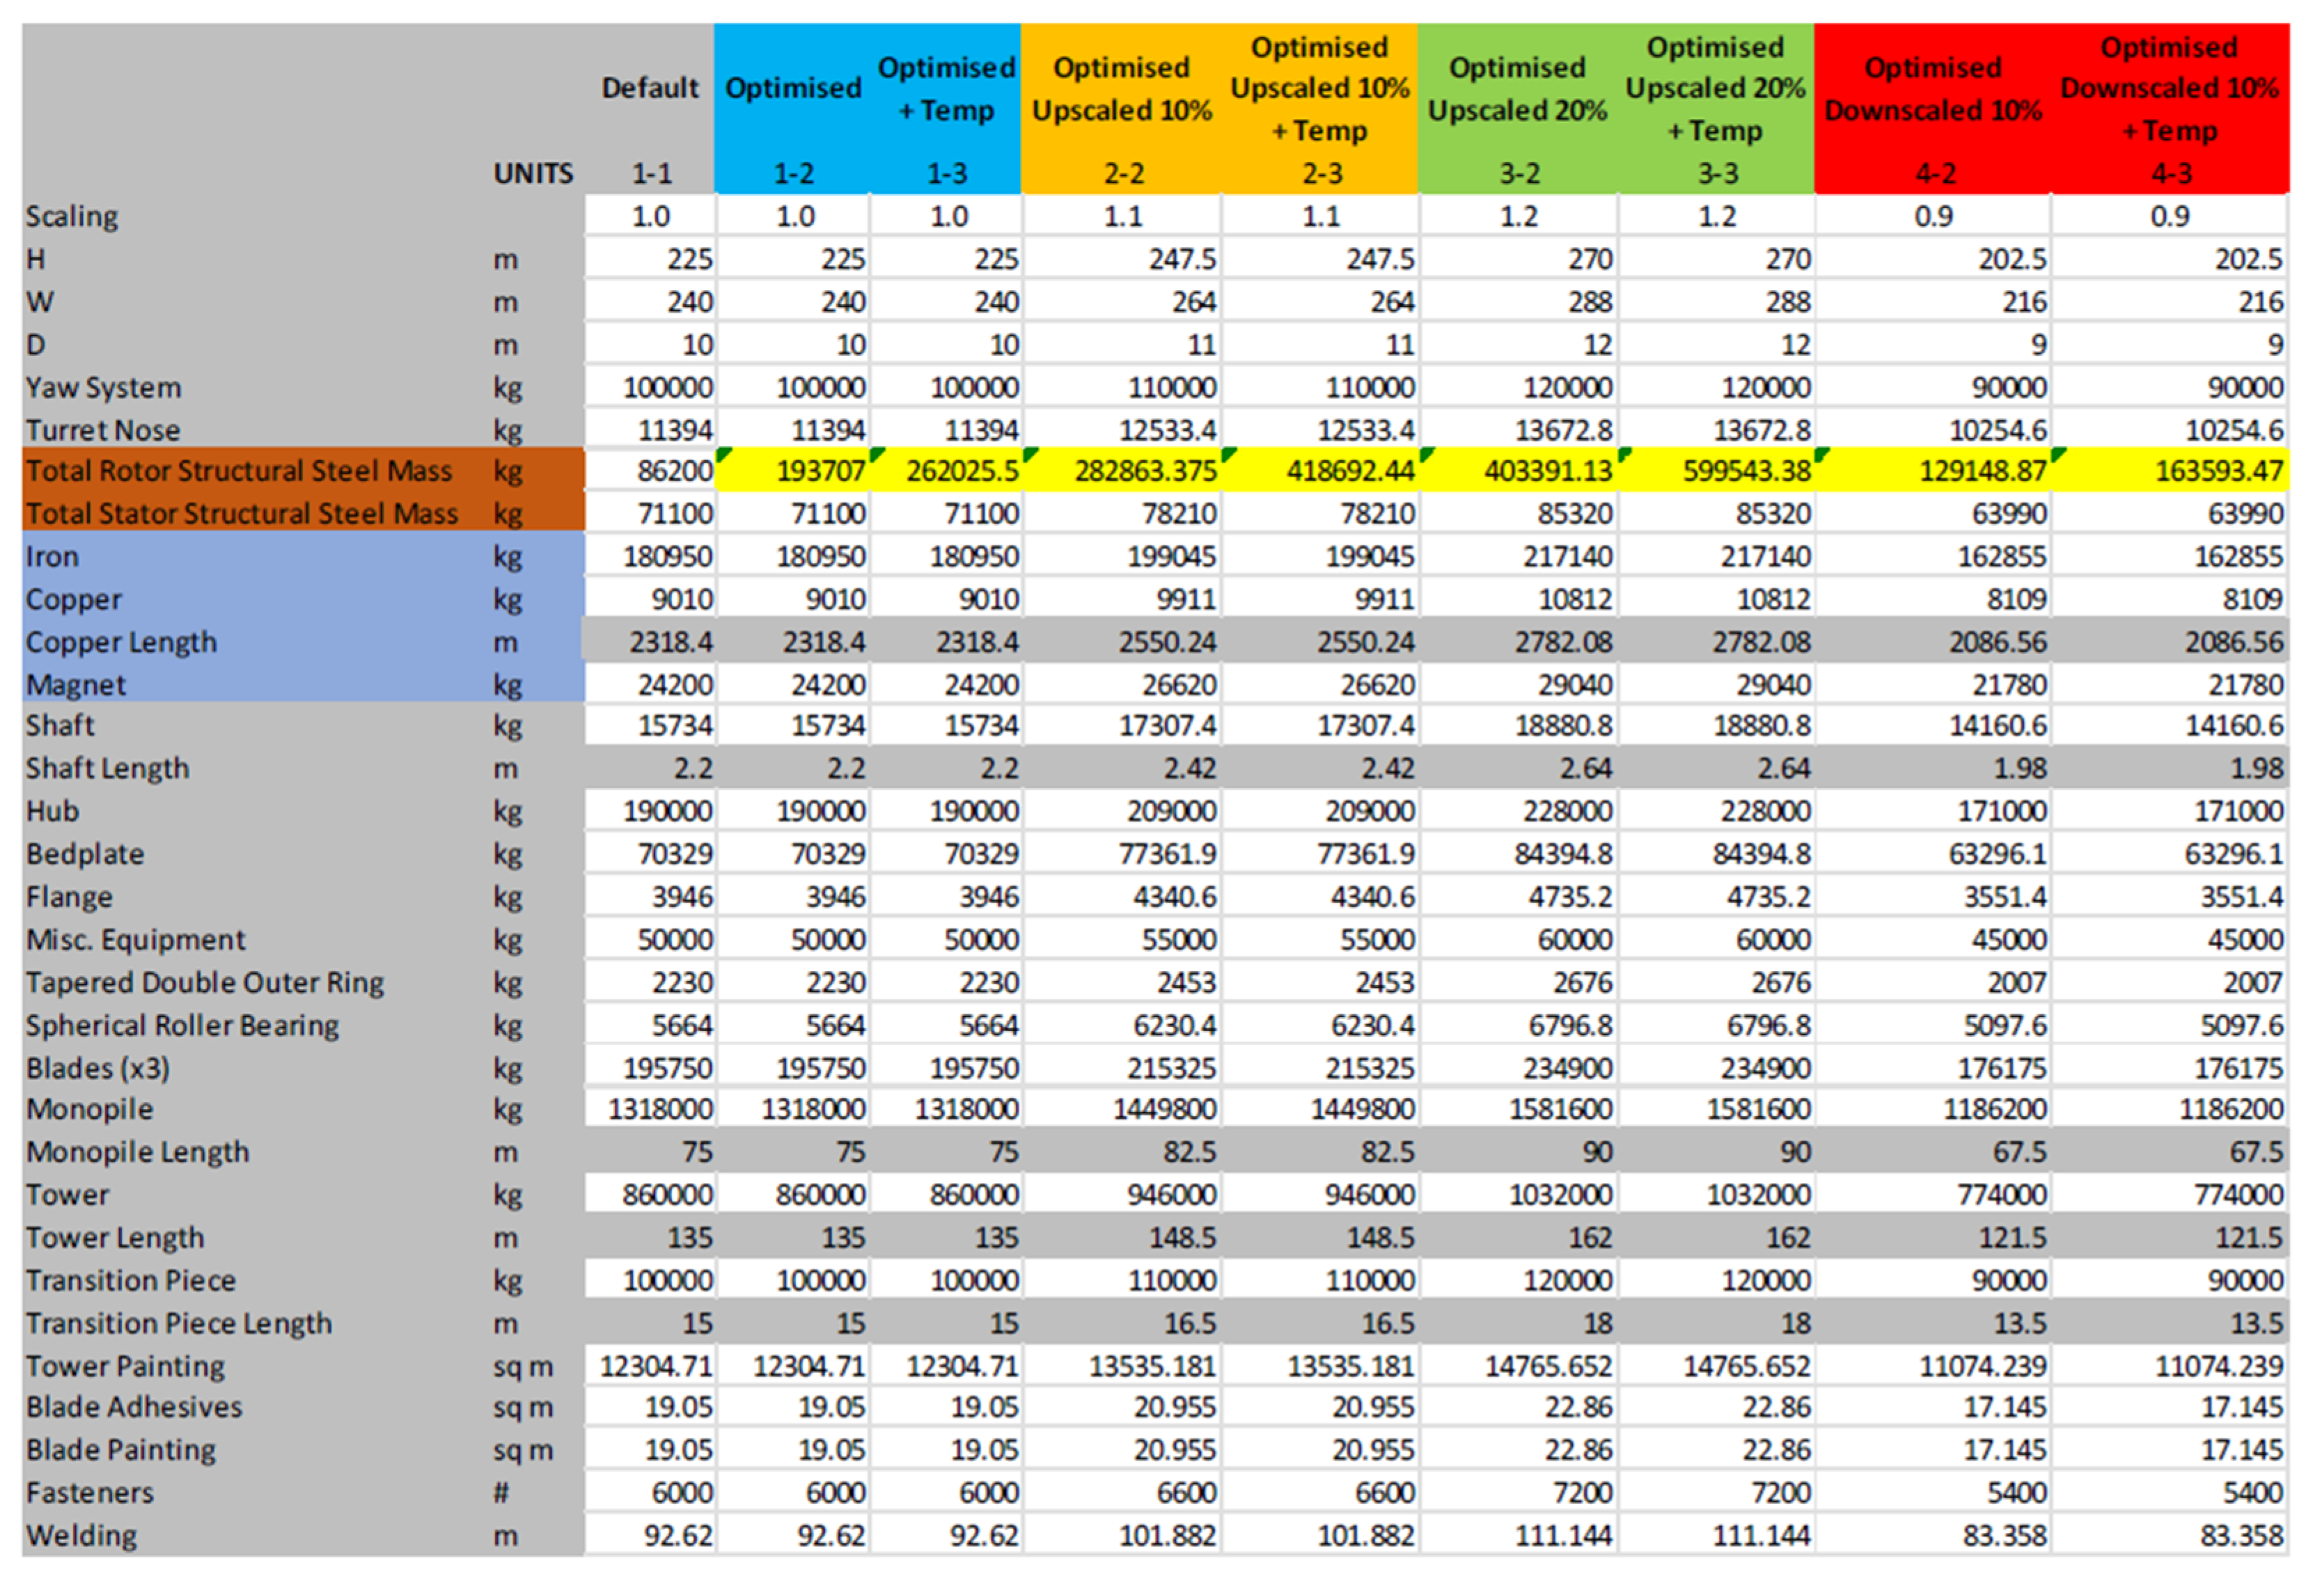
Appendix A. Bill of Materials

| Component | Material Spec. | 1st Manuf. Process | 2nd Manuf. Process | Mass (tons) | Mass (%) |
|---|---|---|---|---|---|
| Yaw System | Low alloy steel, AISI 4140, normalised | Casting | Fine machining | 100 | 3.04 |
| Turret Nose | Cast iron, nodular graphite, EN GJS 400 18 LT | Casting | Grinding | 11.394 | 0.35 |
| Total Rotor Structural Steel Mass | Low alloy steel, AISI 4140, normalised | Casting | Coarse machining | 86.2 | 2.62 |
| Total Stator Structural Steel Mass | Low alloy steel, AISI 4140, normalised | Casting | Coarse machining | 71.1 | 2.16 |
| Iron | Air melted magnetic iron | Forging | Fine machining | 180.95 | 5.49 |
| Copper | Copper, C12200, hard (phosphorous deoxidised arsenical h.c. copper) | Wire drawing | Cutting and trimming | 9.01 | 0.27 |
| Permanent Magnet | Neodynium magnet N40UH | Casting | Fine machining | 24.2 | 0.73 |
| Shaft | Low alloy steel, AISI 4140, normalised | Roll forming | Grinding | 15.734 | 0.48 |
| Hub | Cast iron, nodular graphite, EN GJS 400 18 LT | Casting | Grinding | 190 | 5.77 |
| Bedplate | Low alloy steel, AISI 4140, normalised | Casting | Coarse machining | 70.329 | 2.13 |
| Flange | Structural Steel, S355J | Forging | Fine machining | 3.946 | 0.12 |
| Misc. Equipment | N/A | N/A | N/A | 50 | 1.52 |
| Tapered Double Outer Ring | Low alloy steel, AISI 4140, normalised | Casting | Fine machining | 2.23 | 0.07 |
| Spherical Roller Bearing | Low alloy steel, AISI 4140, normalised | Casting | Fine machining | 5.664 | 0.17 |
| Blades (x3) | *** PVC cross-linked foam (rigid, closed cell, AC 0.090) | Polymer moulding | Cutting and trimming | 195.75 | 5.94 |
| Monopile—75 m | Structural Steel, S355J | Roll forming | Cutting and trimming | * 1318 | 40.01 |
| Tower—135 m | Structural Steel, S355J | Roll forming | Cutting and trimming | * 860 | 26.1 |
| Transition piece—15 m | Structural Steel, S355J | Roll forming | Cutting and trimming | ** 100 | 3.04 |
| Total Structural Mass | 3294.507 | 100 |
Appendix B. LCA Details
- Number of fasteners, 6000 [28];
- Tower Painting, Blade Painting, and Adhesives—surface areas found using IEA
- Welding length found by adding all circumference connection points in the tower, found using IEA 15 MW Reference Turbine CAD model in SolidWorks [21]: 92.62 m = 3.25 + 2.4 + 6.5 + 6.5 + 6.57 + 6.75 + 6.91 + 7.39 + 8.15 + 8.83 + 9.44 + 9.93 + 10.
References
- IPCC. AR6 Synthesis Report: Climate Change 2023—IPCC. 2023. Available online: https://www.ipcc.ch/report/sixth-assessment-report-cycle/ (accessed on 5 July 2023).
- BVG Associates. Wind Farm Costs–Guide to an Offshore Wind Farm. The Crown Estate and the Offshore Renewable Energy Category, January. 2019. Available online: https://guidetoanoffshorewindfarm.com/wind-farm-costs (accessed on 5 July 2023).
- Carroll, J.; McDonald, A.; McMillan, D. Failure rate, repair time and unscheduled O&M cost analysis of offshore wind turbines: Reliability and maintenance of offshore wind turbines. Wind Energy 2016, 19, 1107–1119. [Google Scholar]
- Tartt, K.; Amiri, A.K.; McDonald, A.; Jaen-Sola, P. Structural optimisation of offshore direct-drive wind turbine generators including static and dynamic analyses. J. Phys. Conf. Ser. 2021, 2018, 012040. [Google Scholar] [CrossRef]
- Turnbull, A.; McKinnon, C.; Carrol, J.; McDonald, A. On the Development of Offshore Wind Turbine Technology: An Assessment of Reliability Rates and Fault Detection Methods in a Changing Market. Energies 2022, 15, 3180. [Google Scholar] [CrossRef]
- Mueller, M.; Polinder, H. Electrical Drives for Direct Drive Renewable Energy Systems; Woodhead Publishing Limited: Sawston, UK, 2013. [Google Scholar]
- Gaertner, E.; Rinker, J.; Sethuraman, L.; Zahle, F.; Anderson, B.; Barter, G.E.; Abbas, N.J.; Meng, F.; Bortolotti, P.; Skrzypinski, W.; et al. Definition of the IEA 15 MW Offshore Reference Wind Turbine. Golden, CO. 2020. Available online: https://www.nrel.gov/docs/fy20osti/75698.pdf%0ANRE (accessed on 5 July 2023).
- Jaen-Sola, P. Advanced Structural Modelling and Design of Wind Turbine Electrical Generators. Ph.D. Thesis, University of Strathclyde, Glasgow, UK, 2017. [Google Scholar]
- Chen, H.; Zuo, Y.; Chau, K.T.; Zhao, W.; Lee, C.H.T. Modern electric machines and drives for wind power generation: A reviewof opportunities and challenges. IET Renew. Power Gener. 2021, 15, 1864–1887. [Google Scholar] [CrossRef]
- McDonald, A.; Mueller, M.; Polinder, H. Structural Mass in Direct-Drive Permanent Magnets Electrical Generators. IET Renew. Power Gener. 2008, 2, 3–15. [Google Scholar] [CrossRef]
- Stander, J.N.; Venter, G.; Kamper, M.J. Review of direct-drive radial flux wind turbine generator mechanical design. Wind Energy 2012, 15, 459–472. [Google Scholar] [CrossRef]
- Zhang, Z.; Chen, A.; Matveev, A.; Nilssen, R.; Nysveen, A. High Power Generators for Offshore Wind Turbines. Energy Procedia 2013, 35, 52–61. [Google Scholar] [CrossRef]
- McDonald, A.S. Structural Analysis of Low Speed, High Torque Electrical Generators for Direct Drive Renewable Energy Converters. Ph.D. Thesis, University of Edinburgh, Edinburgh, UK, 2008. [Google Scholar]
- Zavvos, A. Structural Optimisation of Permanent Magnet Direct Drive Generators for 5MW Wind Turbines. Ph.D. Thesis, University of Edinburgh, Edinburgh, UK, 2013. [Google Scholar]
- Hayes, A.; Sethuraman, L.; Dykes, K.; Fingersh, L.J. Structural Optimization of a Direct-Drive Wind Turbine Generator Inspired by Additive Manufacturing. Procedia Manuf. 2018, 26, 740–752. [Google Scholar] [CrossRef]
- Hayes, A.C.; Whiting, G.L. Reducing the Structural Mass of Large Direct Drive Wind Turbine Generators through Triply Periodic Minimal Surfaces Enabled by Hybrid Additive Manufacturing. Clean Technol. 2021, 3, 227–242. [Google Scholar] [CrossRef]
- Gonzalez-Delgado, D.; Jaen-Sola, P.; Oterkus, E. Design and optimisation of multi-MW offshore direct-drive wind turbine electrical generator structures using generative design techniques. Ocean Eng. 2023, 280, 114417. [Google Scholar] [CrossRef]
- Jaen-Sola, P.; Oterkus, E.; McDonald, A.S. Parametric lightweight design of a direct-drive wind turbine electrical generator 574 supporting structure for minimising dynamic response. Ships Offshore Struct. 2021, 16 (Suppl. S1), 266–274. [Google Scholar] [CrossRef]
- SolidWorks. SolidWorks Academic Research. SolidWorks. 2021. Available online: https://www.solidworks.com/ (accessed on 13 April 2023).
- ORE Catapult. 7 MW Levenmouth Demonstration Turbine—ORE. Available online: https://ore.catapult.org.uk/what-we-do/testing-validation/levenmouth/ (accessed on 5 July 2023).
- Gaertner, E.; Rinker, J.; Sethuraman, L.; Zahle, F.; Anderson, B.; Barter, G.E.; Abbas, N.J.; Meng, F.; Bortolotti, P.; Skrzypinski, W.; et al. IEAWindTask37/IEA-15-240-RWT: 15MW Reference Wind Turbine Repository. Available online: https://github.com/IEAWindTask37/IEA-15-240-RWT (accessed on 5 July 2023).
- BS EN ISO 14040:2006+A1:2020; Environmental Management—Life Cycle Assessment—Principles and Framework. BSI Standards Publication: London, UK, 2006.
- ANSYS. ANSYS GRANTA Academic Research; ANSYS: Canonsburg, PA, USA, 2022. [Google Scholar]
- SeagreenWindEnergy. Seagreen Wind Energy—Home. Available online: https://www.seagreenwindenergy.com (accessed on 5 July 2023).
- SSE Seagreen 1A. Available online: https://www.seagreen1a.com (accessed on 5 July 2023).
- Seagreen. Seagreen (United-Kingdom)—Wind Farms—Online Access—The Wind Power. Available online: https://www.thewindpower.net/windfarm_en_16768_seagreen.php (accessed on 5 July 2023).
- Compass Handbooks. Marshalling Underway at Largest Offshore Wind Farm. UK Ports. 12 November 2021. Available online: https://uk-ports.org/marshalling-underway-at-largest-offshorewind-farm/ (accessed on 5 July 2023).
- Conlong, M. Optimal Way to Measure Bolt Tension in Wind Turbine in Service: Most Accurate, Quickest and Cost-Efficient? Moller International. Available online: https://mollerint.com/news/press-releases/number-of-bolts-in-a-wind-turbine/ (accessed on 5 July 2023).


| Property | Value | Unit |
|---|---|---|
| Elastic Modulus | 2.1 × 10⁵ | MPa |
| Poisson’s Ratio | 0.28 | |
| Shear Modulus | 7.9 × 10⁴ | MPa |
| Mass Density | 7800 | kg/m3 |
| Tensile Strength | 400 | MPa |
| Yield Strength | 220 | MPa |
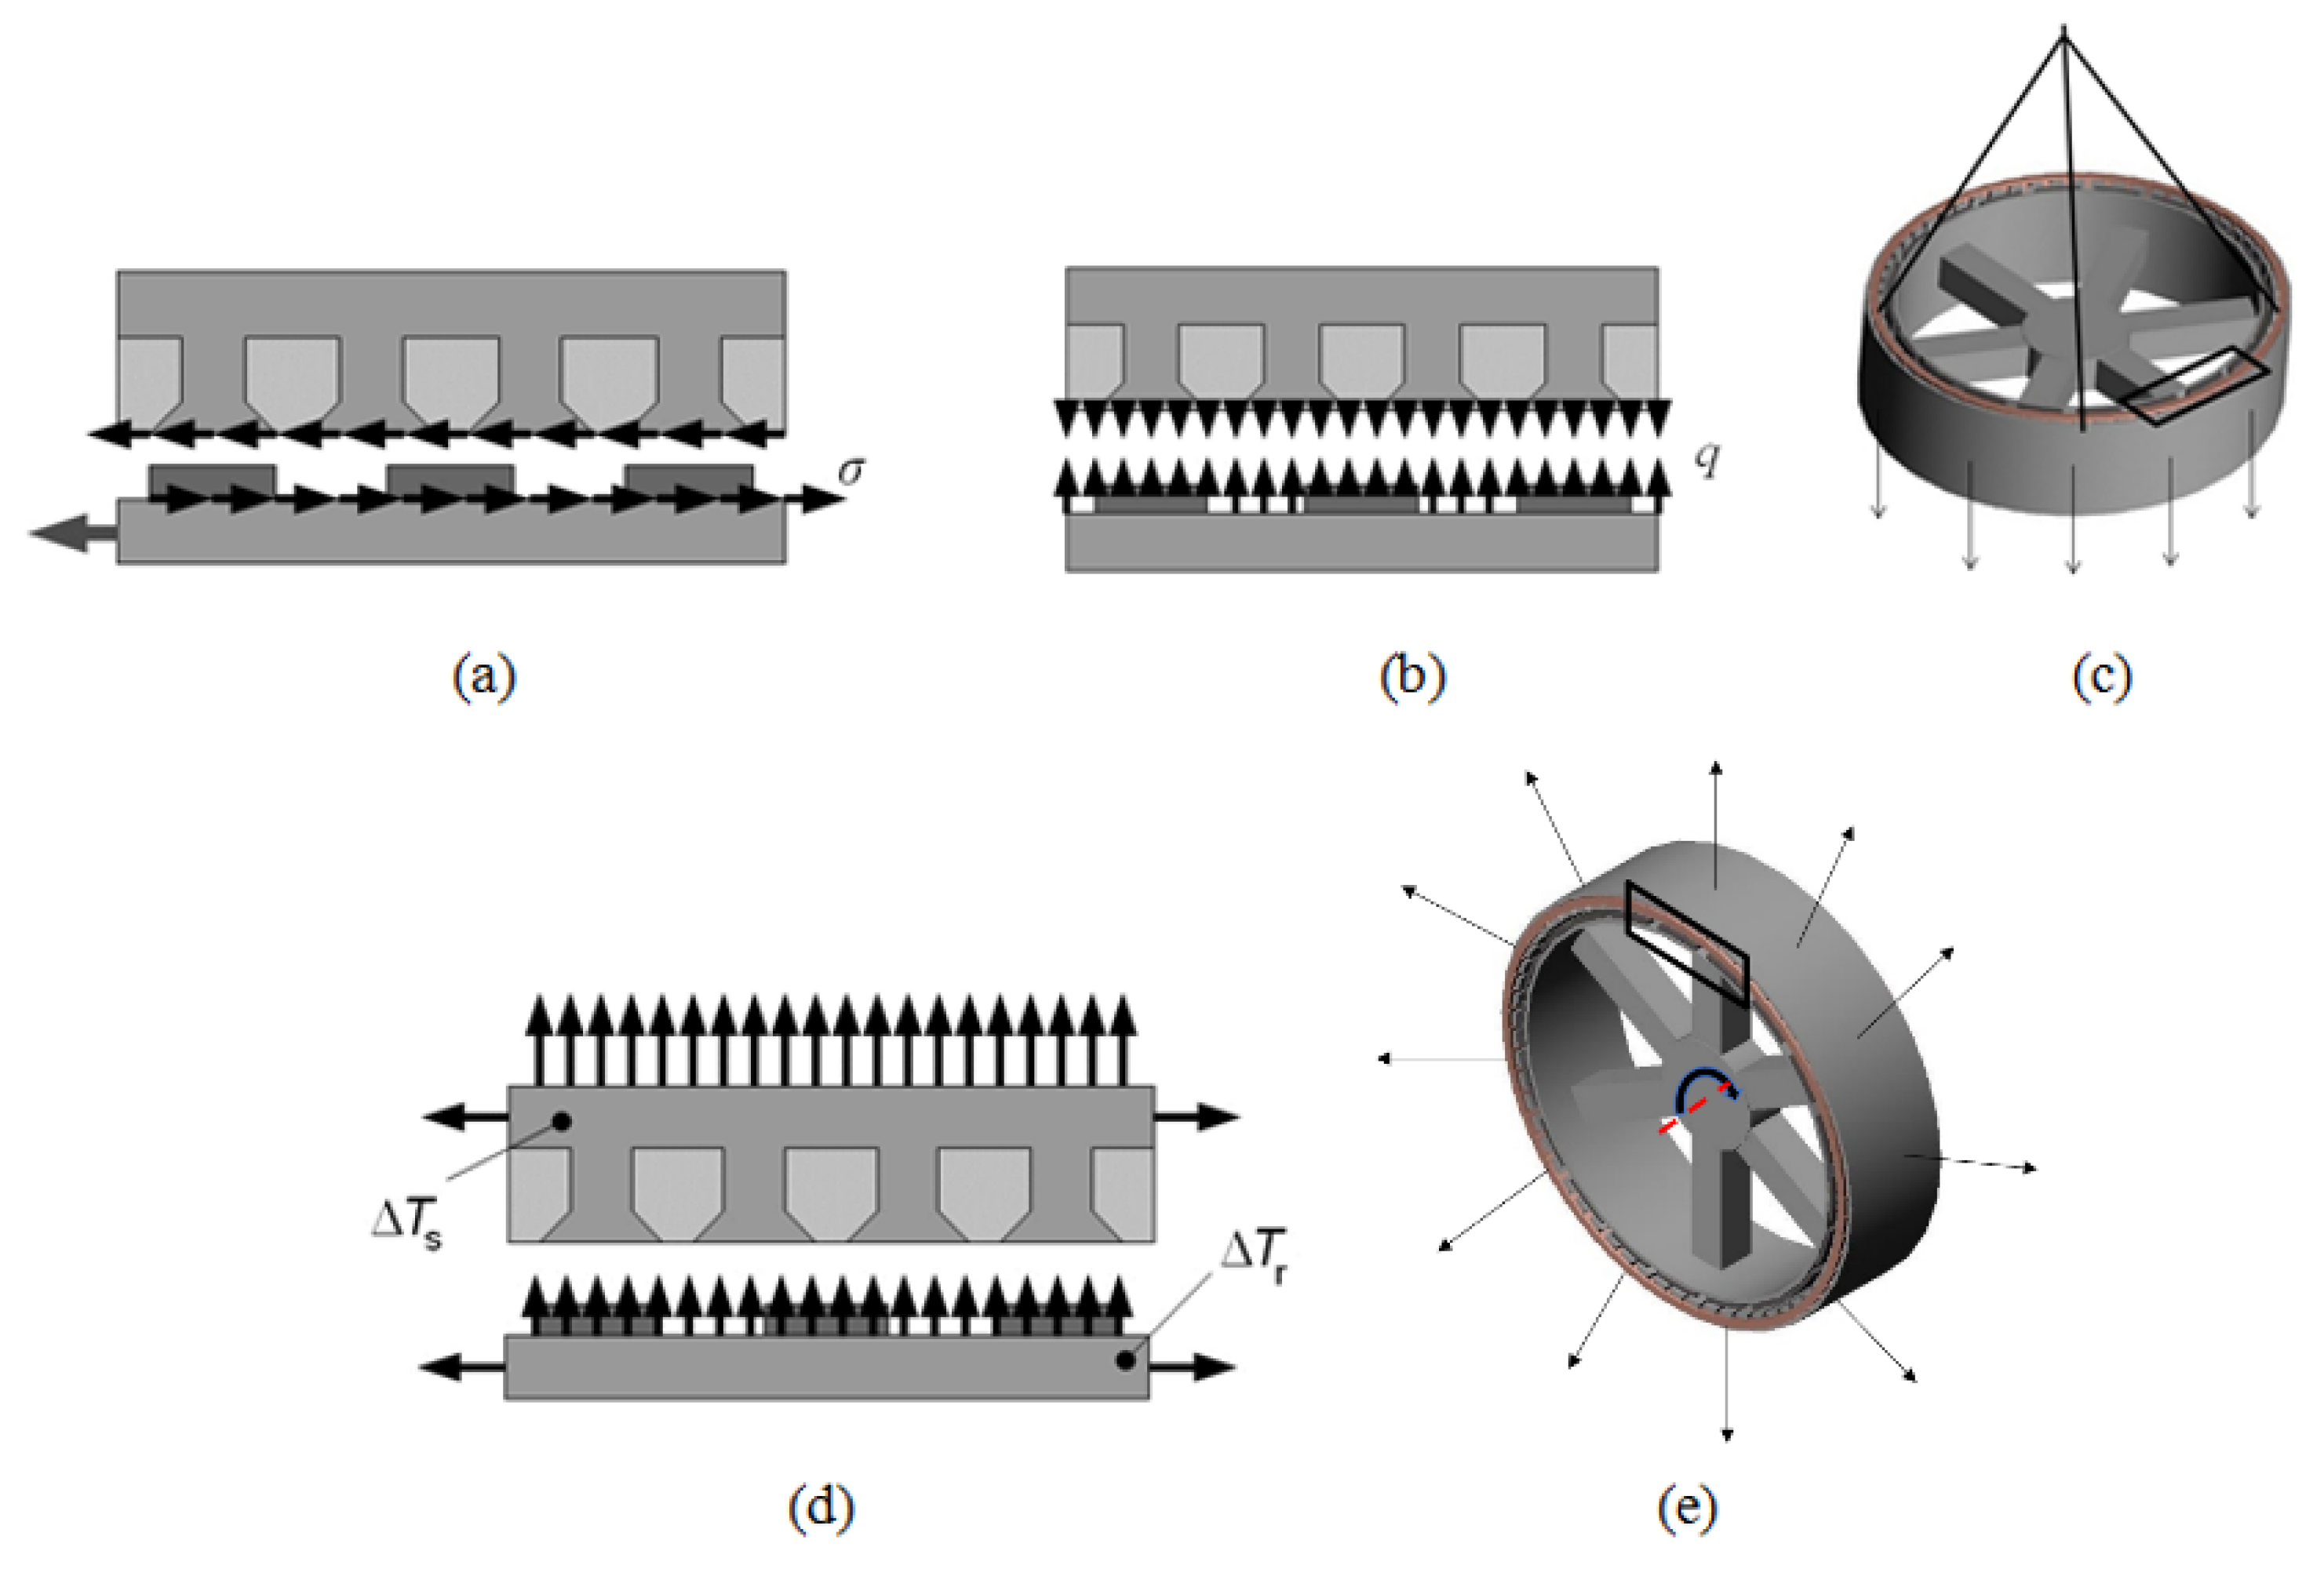
| Load | Magnitude | Unit | Calculation | Application and Direction |
|---|---|---|---|---|
| Magnetic Attraction | 0.447 | MPa | Applied to the inner surface of the rim, facing inwards towards the stator | |
| Shear Loading | 21 | MNm | Applied to the inner surface of the rim, clockwise direction | |
| Gravitational Loading | 9.756 | m/s2 | g cos(θπ/180) | Applied to the whole structure, downwards |
| Centripetal Loading | 7.55 | rpm | 60v/2πr | Applied to the whole structure, clockwise direction |
| Distributed Mass | 46.021 | tons | Applied to the inner surface of the rim | |
| Normal Operating Temperature | 55.69 | Deg. Celsius | Applied to all the external faces of the model |
| Character | Description |
|---|---|
| V | Prefix V is only for the validated attempts (1.05, 1.15) |
| 1–4 | Version in chronological testing order (1 = 1.0, 2 = 1.1, 3 = 1.2, 4 = 0.9) |
| 1–3 | 1 = default starting point; 2 = excluding temperature loading; 3 = including temperature loading |
| A–C | Iteration of parametric optimization (A = initial; B = second; C = final) |
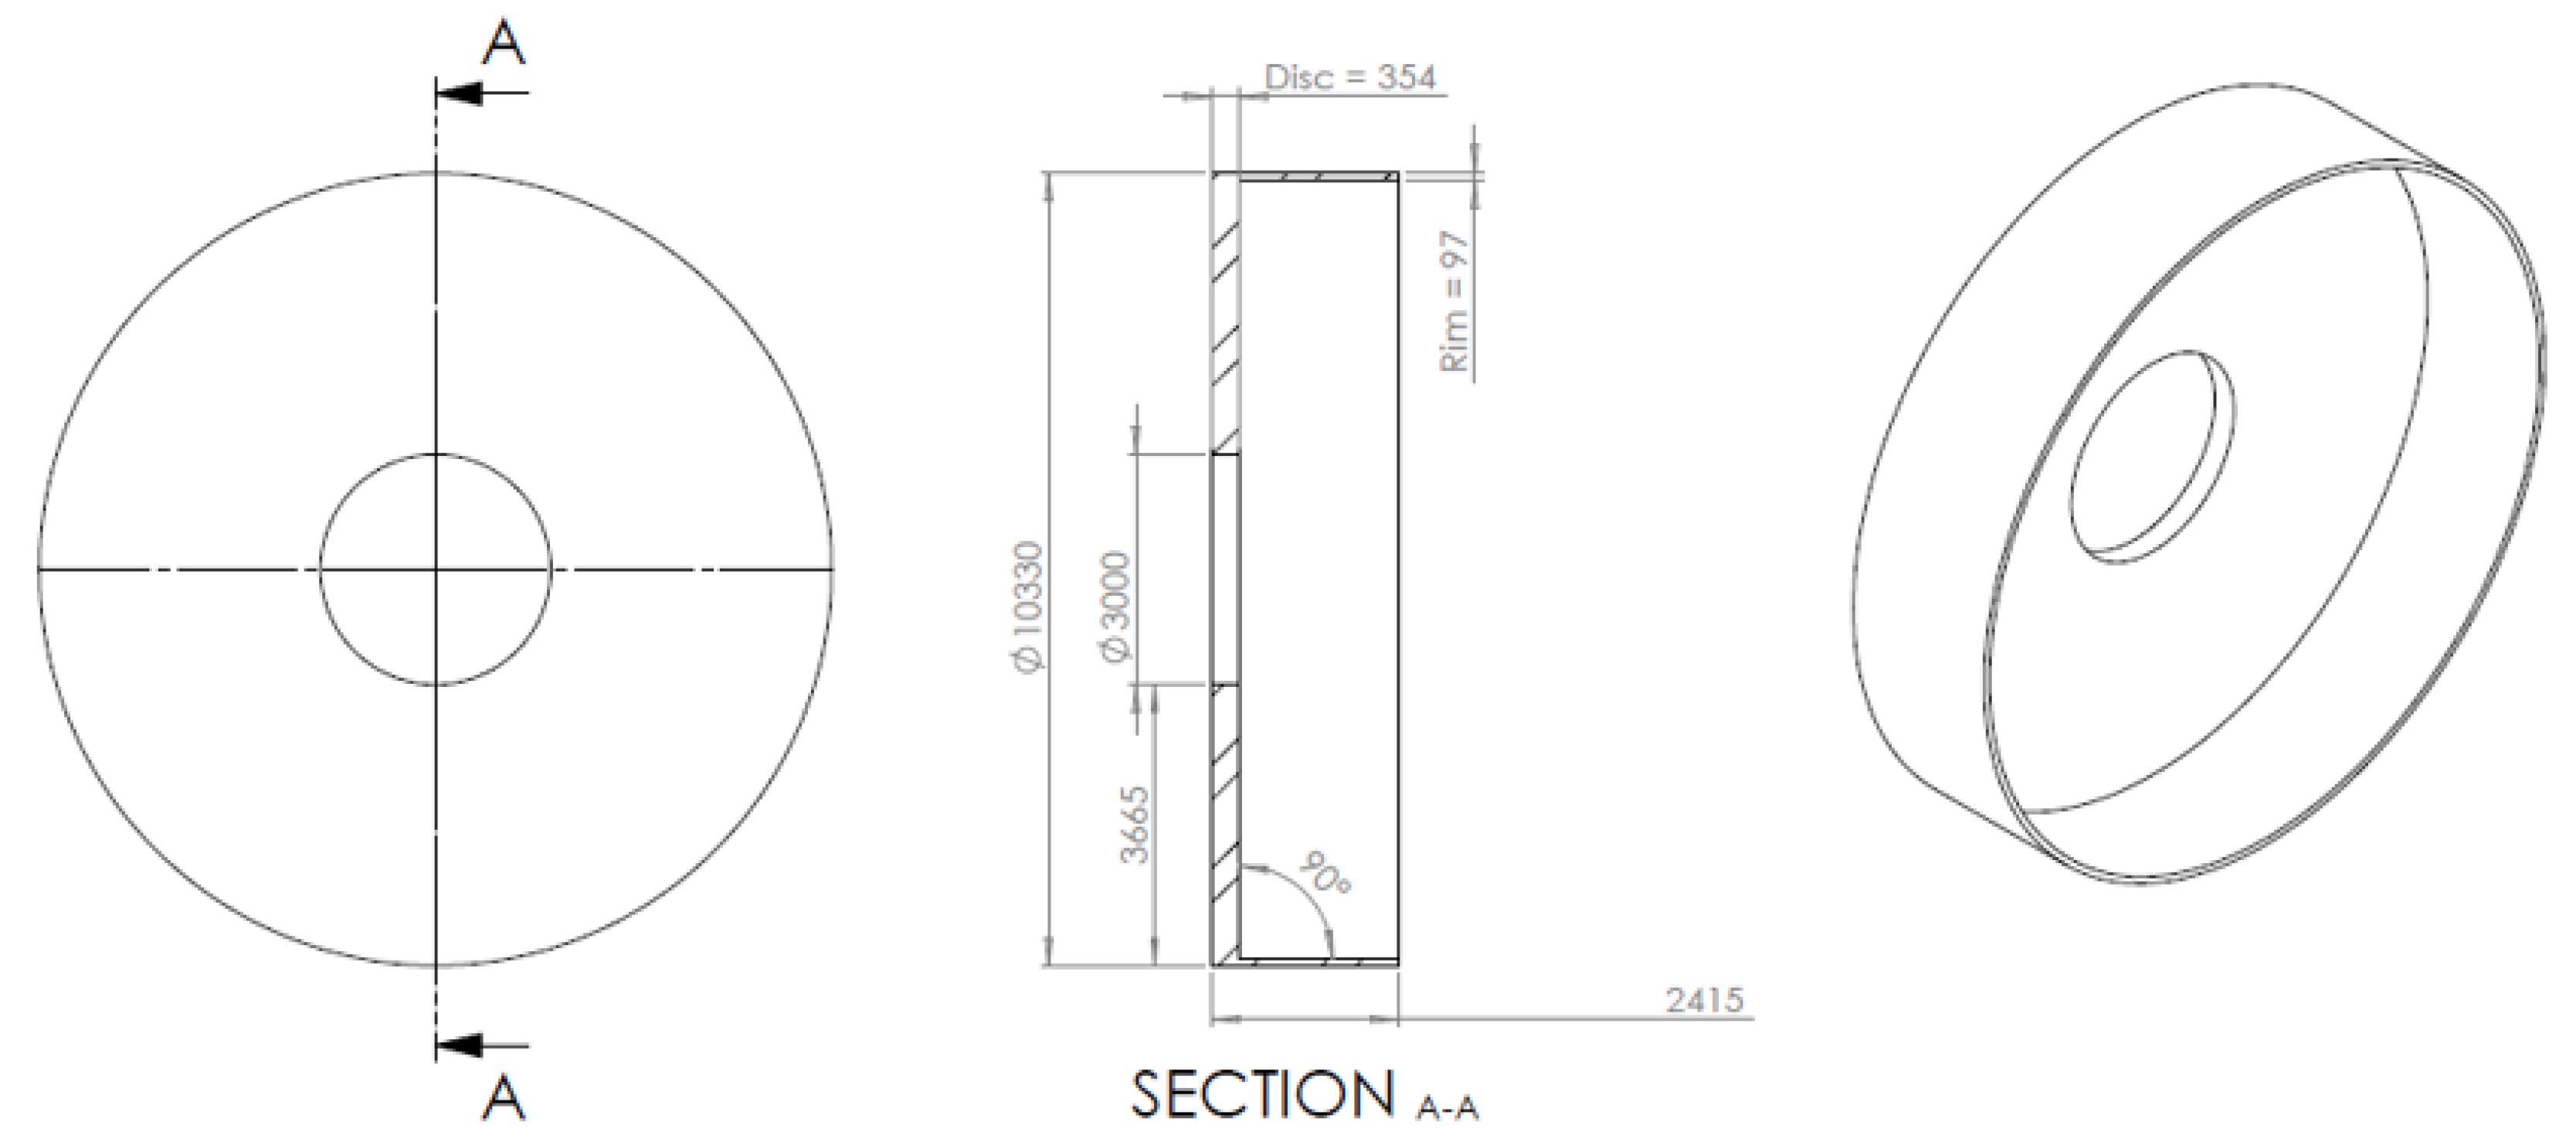
| Scale | Length (mm) | Shaft Hole (mm) | Radius (mm) | Disc Thickness (mm) | Rim Thickness (mm) |
|---|---|---|---|---|---|
| 1.0 (1-1) | 2415 | 1500 | 5165 | 81.75 | 63.69 |
| 1.1 (2-1) | 2656.5 | 1650 | 5681.5 | 389.4 | 106.7 |
| 1.2 (3-1) | 2898 | 1800 | 6198 | 424.8 | 116.4 |
| 0.9 (4-1) | 2173.5 | 1350 | 4648.5 | 318.6 | 87.3 |
| Figure 11 Design Variable | Fitted Equation | R2 |
|---|---|---|
| (a) Rim Width [A] | y = 215.14x − 158.49 | 0.73 |
| (a) Disc Width [B] | y = 618.86x − 355.61 | 0.89 |
| (a) Mass [C] | y = 1388x2 − 2002.7x + 807.41 | 0.99 |
| (b) Rim Width [A] | y = 890.86x − 793.91 | 0.787 |
| (b) Disc Width [B] | y = 476x − 123.9 | 0.672 |
| (b) Mass [C] | y = 1966.8x2 − 2677.2 + 978.63 | 0.99 |
Disclaimer/Publisher’s Note: The statements, opinions and data contained in all publications are solely those of the individual author(s) and contributor(s) and not of MDPI and/or the editor(s). MDPI and/or the editor(s) disclaim responsibility for any injury to people or property resulting from any ideas, methods, instructions or products referred to in the content. |
© 2023 by the authors. Licensee MDPI, Basel, Switzerland. This article is an open access article distributed under the terms and conditions of the Creative Commons Attribution (CC BY) license (https://creativecommons.org/licenses/by/4.0/).
Share and Cite
Touw, L.; Jaen Sola, P.; Oterkus, E. Towards an Integrated Design of Direct-Drive Wind Turbine Electrical Generator Supporting Structures. Wind 2023, 3, 343-360. https://doi.org/10.3390/wind3030020
Touw L, Jaen Sola P, Oterkus E. Towards an Integrated Design of Direct-Drive Wind Turbine Electrical Generator Supporting Structures. Wind. 2023; 3(3):343-360. https://doi.org/10.3390/wind3030020
Chicago/Turabian StyleTouw, Lucas, Pablo Jaen Sola, and Erkan Oterkus. 2023. "Towards an Integrated Design of Direct-Drive Wind Turbine Electrical Generator Supporting Structures" Wind 3, no. 3: 343-360. https://doi.org/10.3390/wind3030020
APA StyleTouw, L., Jaen Sola, P., & Oterkus, E. (2023). Towards an Integrated Design of Direct-Drive Wind Turbine Electrical Generator Supporting Structures. Wind, 3(3), 343-360. https://doi.org/10.3390/wind3030020