1. Introduction
With the rapid growth of the world’s population, the use of fossil fuels as a conventional energy is in a foreseeable shortage. Wind energy is becoming one of the most common and preferred forms of renewable energy [
1,
2,
3,
4,
5,
6,
7,
8]. The capabilities of offshore wind energy show increasing promise, with the abundance of wind resources and more uniform wind features. To better design wind turbines and more effectively harness wind energy, a solid understanding of the aerodynamics features of wind turbines is needed. As such, much research work has been conducted experimentally or numerically to study the aerodynamic performance of offshore wind turbines.
In 2009, the NREL created a comprehensive design of a 5-MW offshore wind turbine. Extensive experiments were also performed [
9]. Since then, the NREL 5-MW offshore wind turbine has been widely used in aerodynamic research.
Coulling et al. used a 1/50-scale model of an NREL 5-MW offshore wind turbine constructed for a floating platform to verify a model of FAST [
10]. Comparing test results to FAST predictions, they discovered that FAST and the test achieved a high level of agreement with the turbine’s performance in terms of elasticity, aerodynamics, and hydrodynamics. Shin et al. constructed a 1/128-scale model of a 5-MW floating offshore wind turbine in a water depth of 50 m in the University of Ulsan’s Ocean Engineering Wide Tank [
11]. The response amplitude operator in natural frequency was produced and compared under various situations. Duan et al. simulated a test to examine the dynamical reaction of an OC3 model of spar floating wind turbine at 1/50 scale [
12]. They also documented the reaction behavior under wind and wave conditions. These investigations were meticulously planned and carried out in order to provide references for simulation research. More recently, Chen et al. [
13] conducted a review of model experimental methods for floating offshore wind turbines, addressing their development status and existing limitations. Boersma et al. [
14] built a scaled-down model of the 61 m NREL 5-MW blade (30:1), and conducted a series of experiments on it. They observed coupled-mode flutter, which further proved that larger wind turbine blades are susceptible to coupled-mode flutter.
Experimental study is costly; further, simultaneously using Froude scaling and Reynolds scaling for large-scale offshore wind turbines was deemed unfeasible for satisfying platform testing. This can be attributed to the inaccuracy that occurs when the test findings are applied to full-scale wind turbines. When looking for an alternative, it was determined that numerical study would be cost efficient without compromising the integrity of the experimental findings.
Wang [
15] utilized the CFD approach to describe the three-dimensional transient flow for an offshore 5-MW wind turbine at 9 m/s. The contours of velocities and pressure were presented. He calculated the wind turbine aerodynamic torque efficiency to be 72.2% using the LES model, and concluded that the LES method was a reliable tool to study complex transient turbulent flows. Cheng et al. [
16] investigated the aerodynamic and hydrodynamic responses of an NREL 5-MW offshore wind turbine placed on a semi-submersible foundation using OpenFOAM. Zhou et al. [
17] analyzed the aerodynamic behaviors of the 5-MW offshore wind turbine in downwind and upstream settings using the PimpleDyMFoam solver based on OpenFOAM. Wake vortices, pressure distributions on the blade, and limiting streamlines were analyzed. Cheng et al. [
18] also investigated the unstable aerodynamic characteristics of the NREL 5-MW offshore wind turbine with periodic pitch and surge movements of the platform using the naoe-FOAM-SJTU technique based on OpenFOAM. They also demonstrated that, compared with surge motion, pitch motion had a greater effect on the thrust and torque of the rotor.
The multiple reference frame (MRF) technique, which is based on OpenFOAM, was used by Zhao et al. [
19] to simulate a 5-MW offshore wind turbine at varying wind speeds. They obtained the aerodynamic features on the blade surfaces and got the wake vortex, rotor thrust, and torque without considering the effect of the floating structure. The aerodynamic performance of a selected 5-MW offshore baseline wind turbine at the mouth of the Chesapeake Bay was modelled by Ian et al. [
20]. They calculated the lift coefficient, drag coefficient, tangential velocity, axial velocity, and AOA at different inlet wind velocities along the azimuth and blades. De Cillis et al. [
21] focused on the NREL 5-MW wind turbine wake effects from the incoming turbulence influence. Unsteady wake characteristics of the NREL 5-MW wind turbine were discussed further by Xue et al. [
22], based on an LBM-LES model. Arabgolarcheh et al. [
23] focused on the near wake characteristics of NREL phase VI and 5-MW offshore wind turbine analysis using an actuator line method. Besides the direct modeling techniques, Fan et al. [
24] conducted a numerical study on the NREL 5-MW wind turbine wake effects in yaw conditions using an improved actuator line method based on OpenFOAM.
Lienard et al. [
25] used CFD to examine the aerodynamic behavior of a 5-MW offshore wind turbine under various wave movements. According to their findings, pitch and surge movements had a significant impact on boosting mean aerodynamic power among six degrees of freedom motions. Yuan et al. [
26] discussed the aerodynamic characteristics of the NREL 5-MW offshore wind turbine under wind shear effects based on the Lattice–Boltzmann method; they concluded that, due to the wind shear effects, the angle of attack deviates from the theoretical optimal value, which decrease the torque generated by the wind turbine. Tran et al. [
27] demonstrated a floating wind turbine device with a periodic pitch motion. They completed the spinning turbine’s unsteady aerodynamic study satisfactorily. The effects of platform movements on aerodynamic performance were examined by Lee et al. [
28]. They tested the 5-MW offshore wind turbine with periodic translational and rotational movements and compared the results to the bottom-fixed simulation. The result they reached also suggests that surge and pitch motions have a major impact on thrust and power, which is similar to that obtained by Lienard et al. [
21] and Cheng et al. [
16]. De Oliveira et al. [
29] focused on the aspects of solver configuration and discretization strategies in blade-resolved numerical simulation of the 5-MW NREL offshore wind turbine, and attempted to improve the simulation accuracy and reduce the computational cost. Further, Papi et al. [
30] discussed the technical difficulties in floating offshore wind turbine upscaling based on the NREL 5-MW and IEA 15-MW wind turbines.
Although much research on the aerodynamic behavior of a 5-MW offshore baseline wind turbine has been conducted, a comprehensive analysis of the aerodynamic behavior on the NREL 5-MW offshore wind turbine is missing in the literature. The current research was carried out to obtain the aerodynamic performance on the NREL 5-MW offshore wind turbine under various inflow velocities, including: below the rated wind speed, at the rated wind speed and above the rated wind speed; developing eight test cases; conducting detailed analysis on aerodynamic properties such as the near wake flow features, torque and thrust, pressure and pressure coefficient distribution; limiting streamline along wind turbine blades, and evaluating the power coefficient as a function of tip speed ratio. The comprehensive and in-depth modeling and simulation results of the aerodynamic characteristics of the NREL 5-MW are expected to provided valuable input for wind turbine design, which will eventually contribute to efficiently harnessing wind energy.
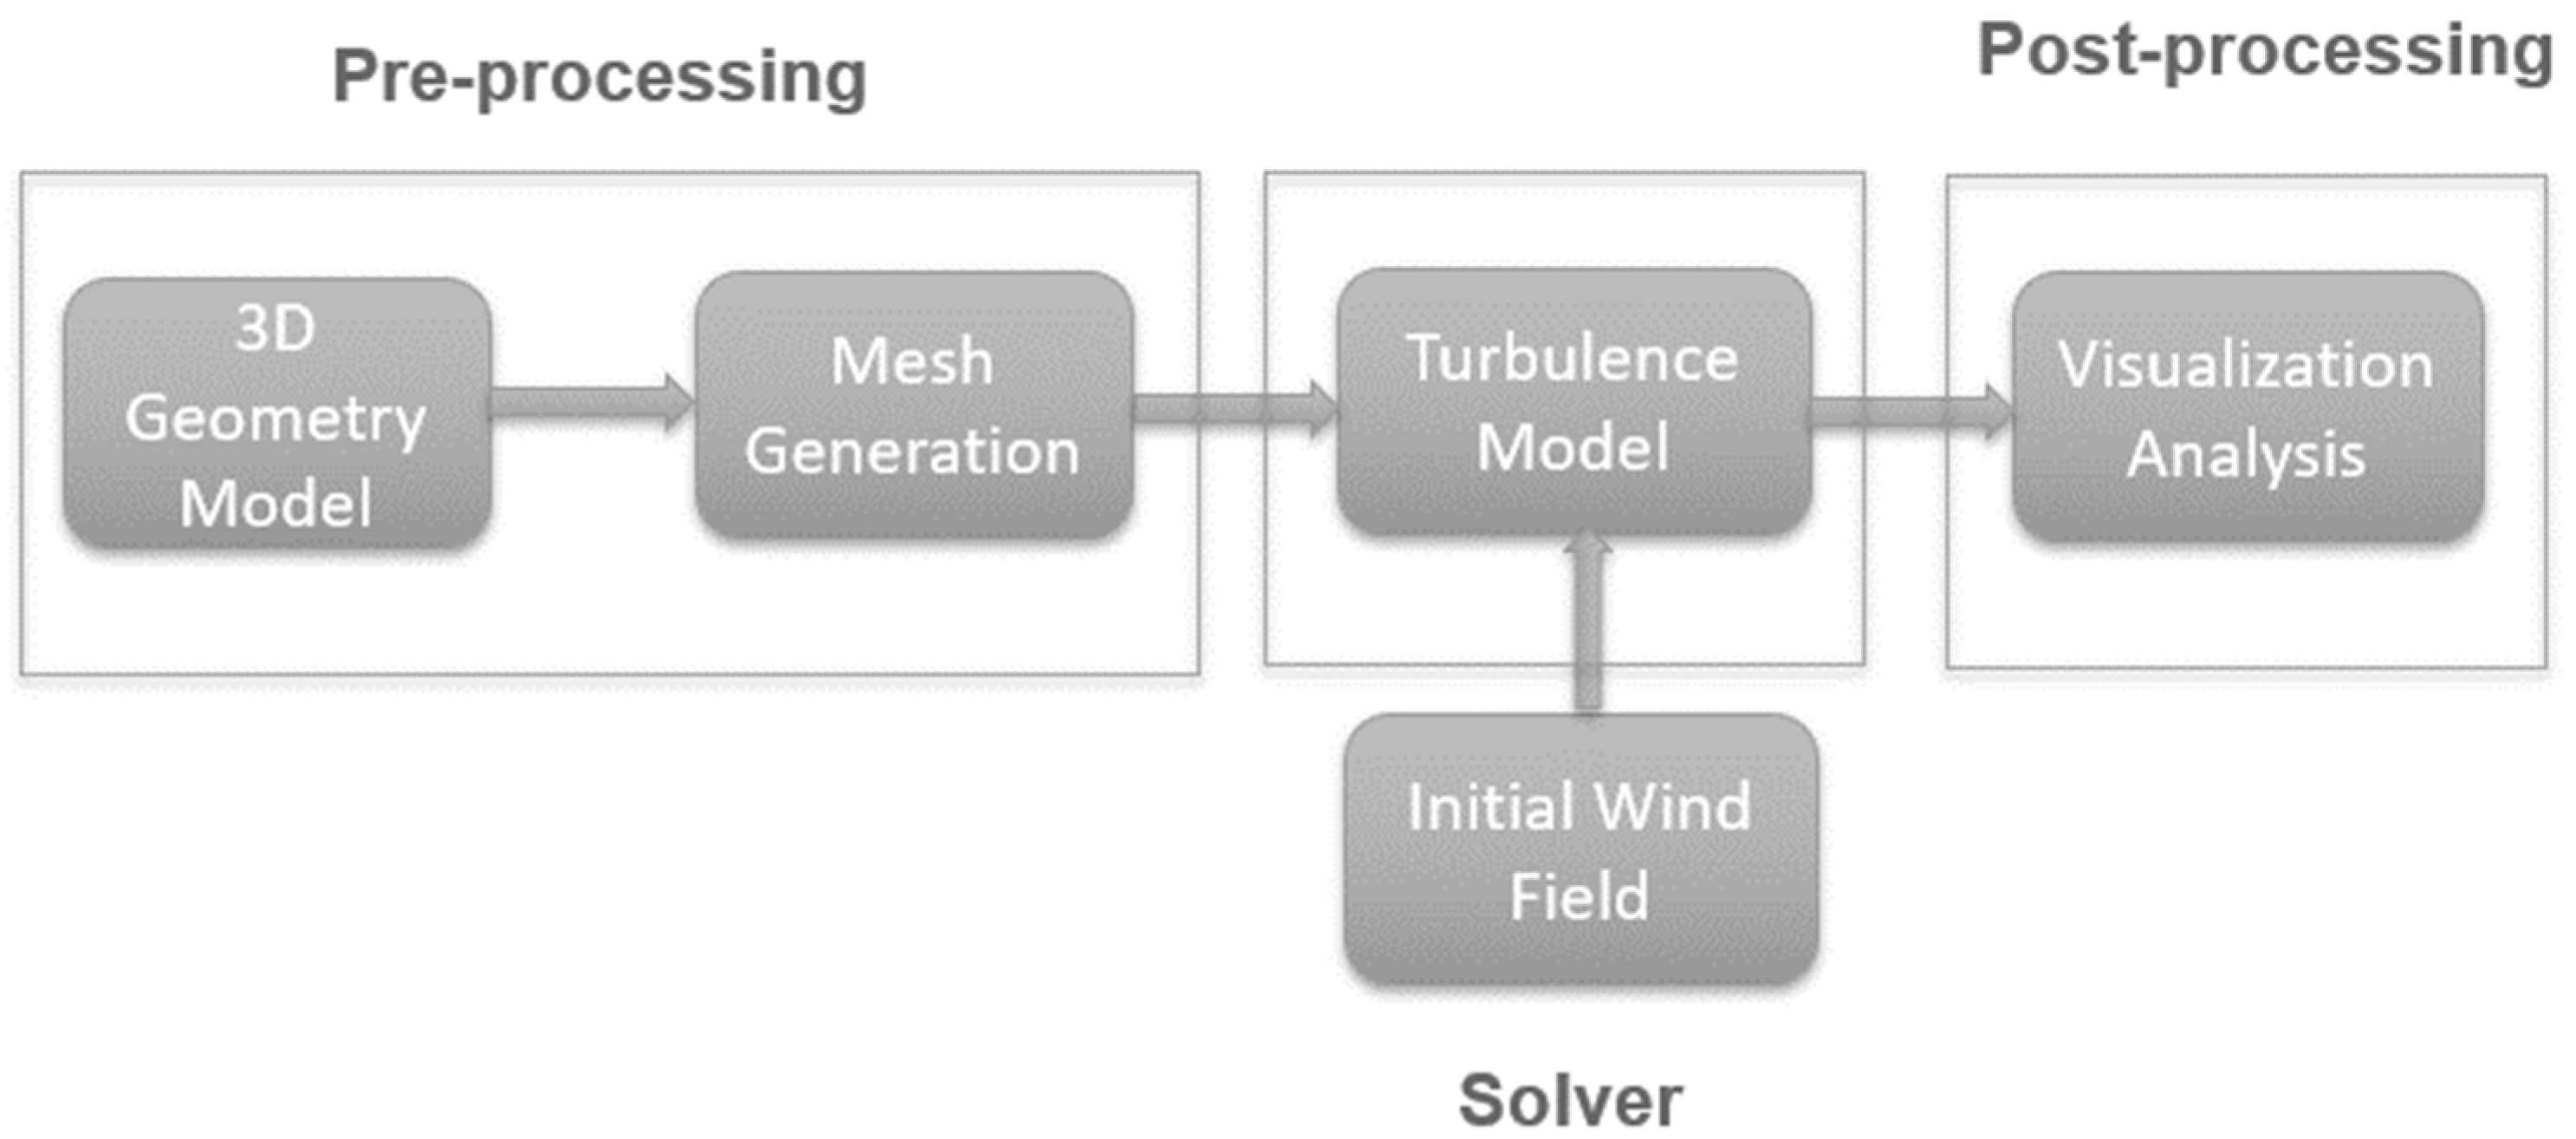
The general process of solving the problem is discussed in
Section 2, which includes geometry modeling, mesh generation and turbulence modeling, followed by instructions; the results are presented in
Section 3, where detailed discussion of the aerodynamic characteristics of the NREL 5-MW wind turbine is provided; and
Section 4 summarizes the conclusions of the presented work along with limitations and future research recommendations.
3. Results
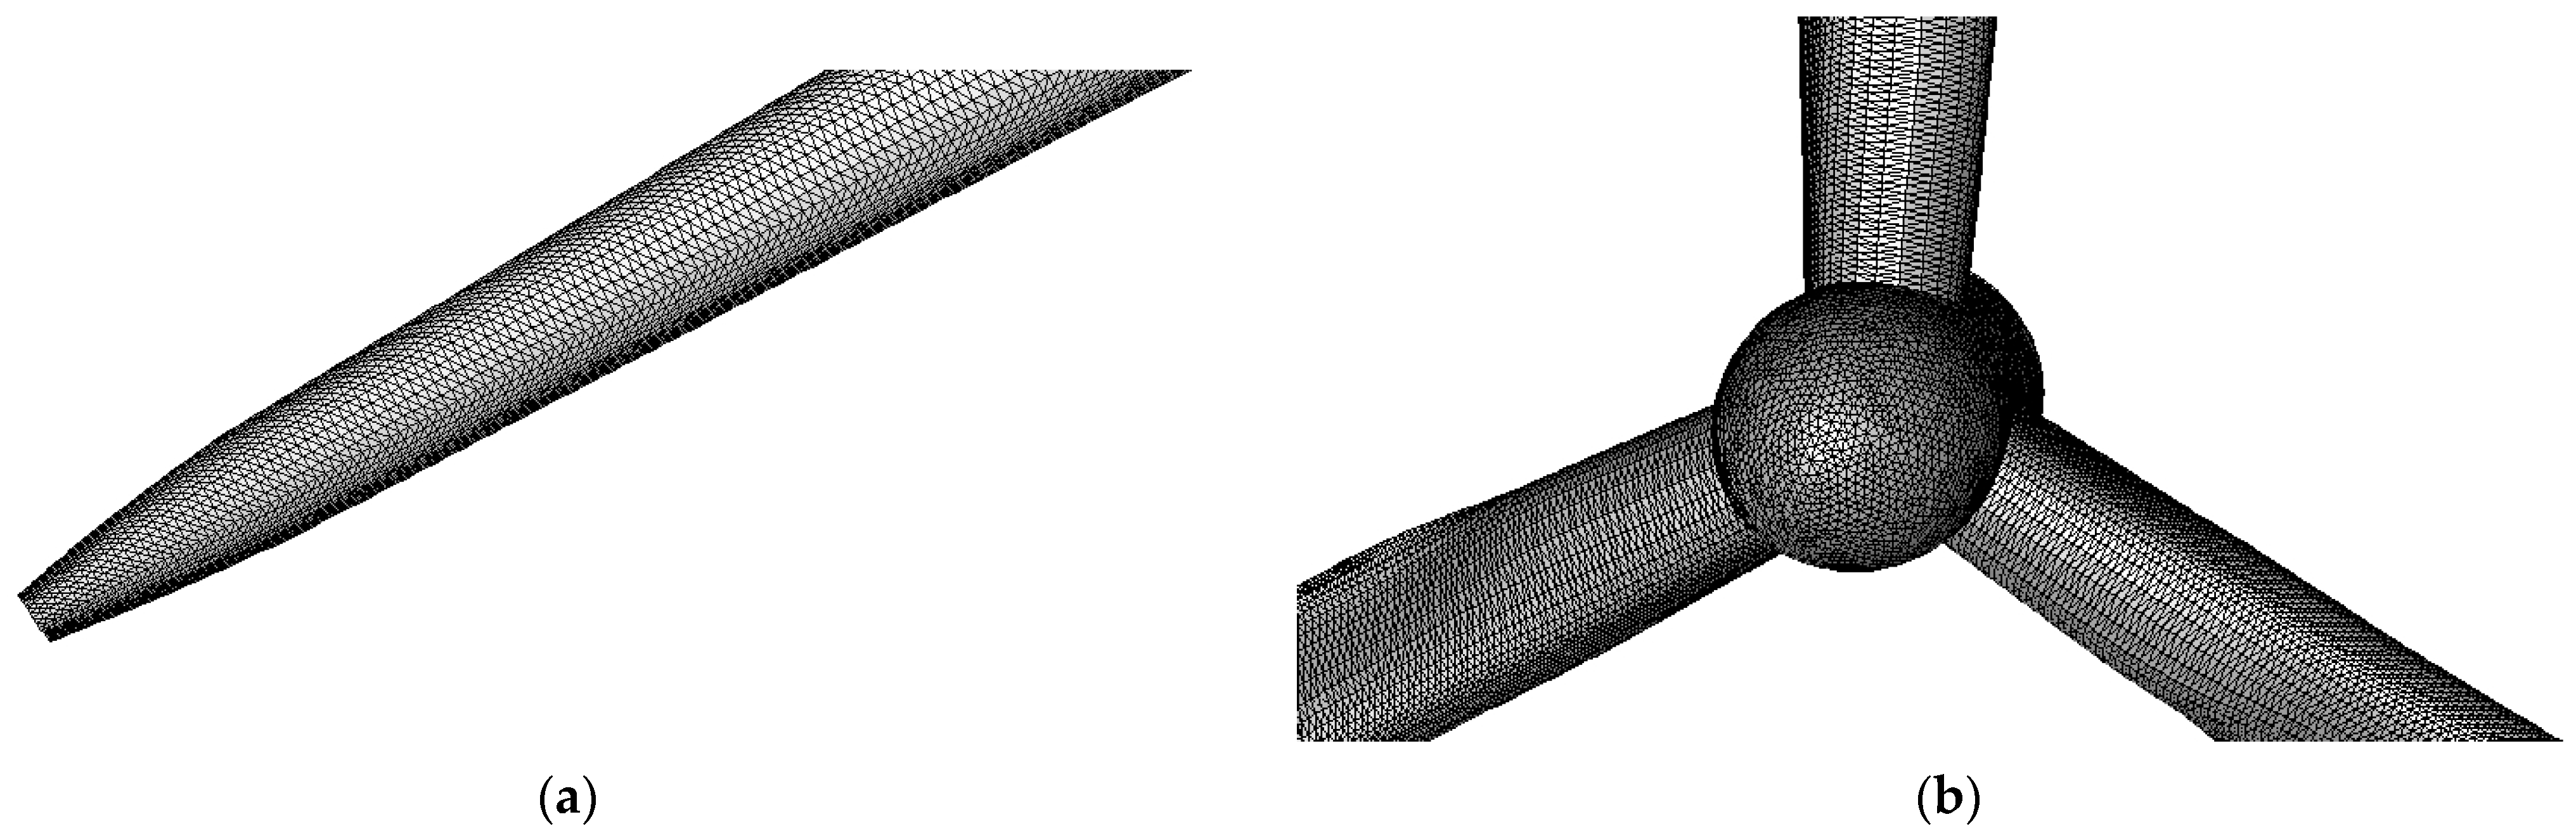
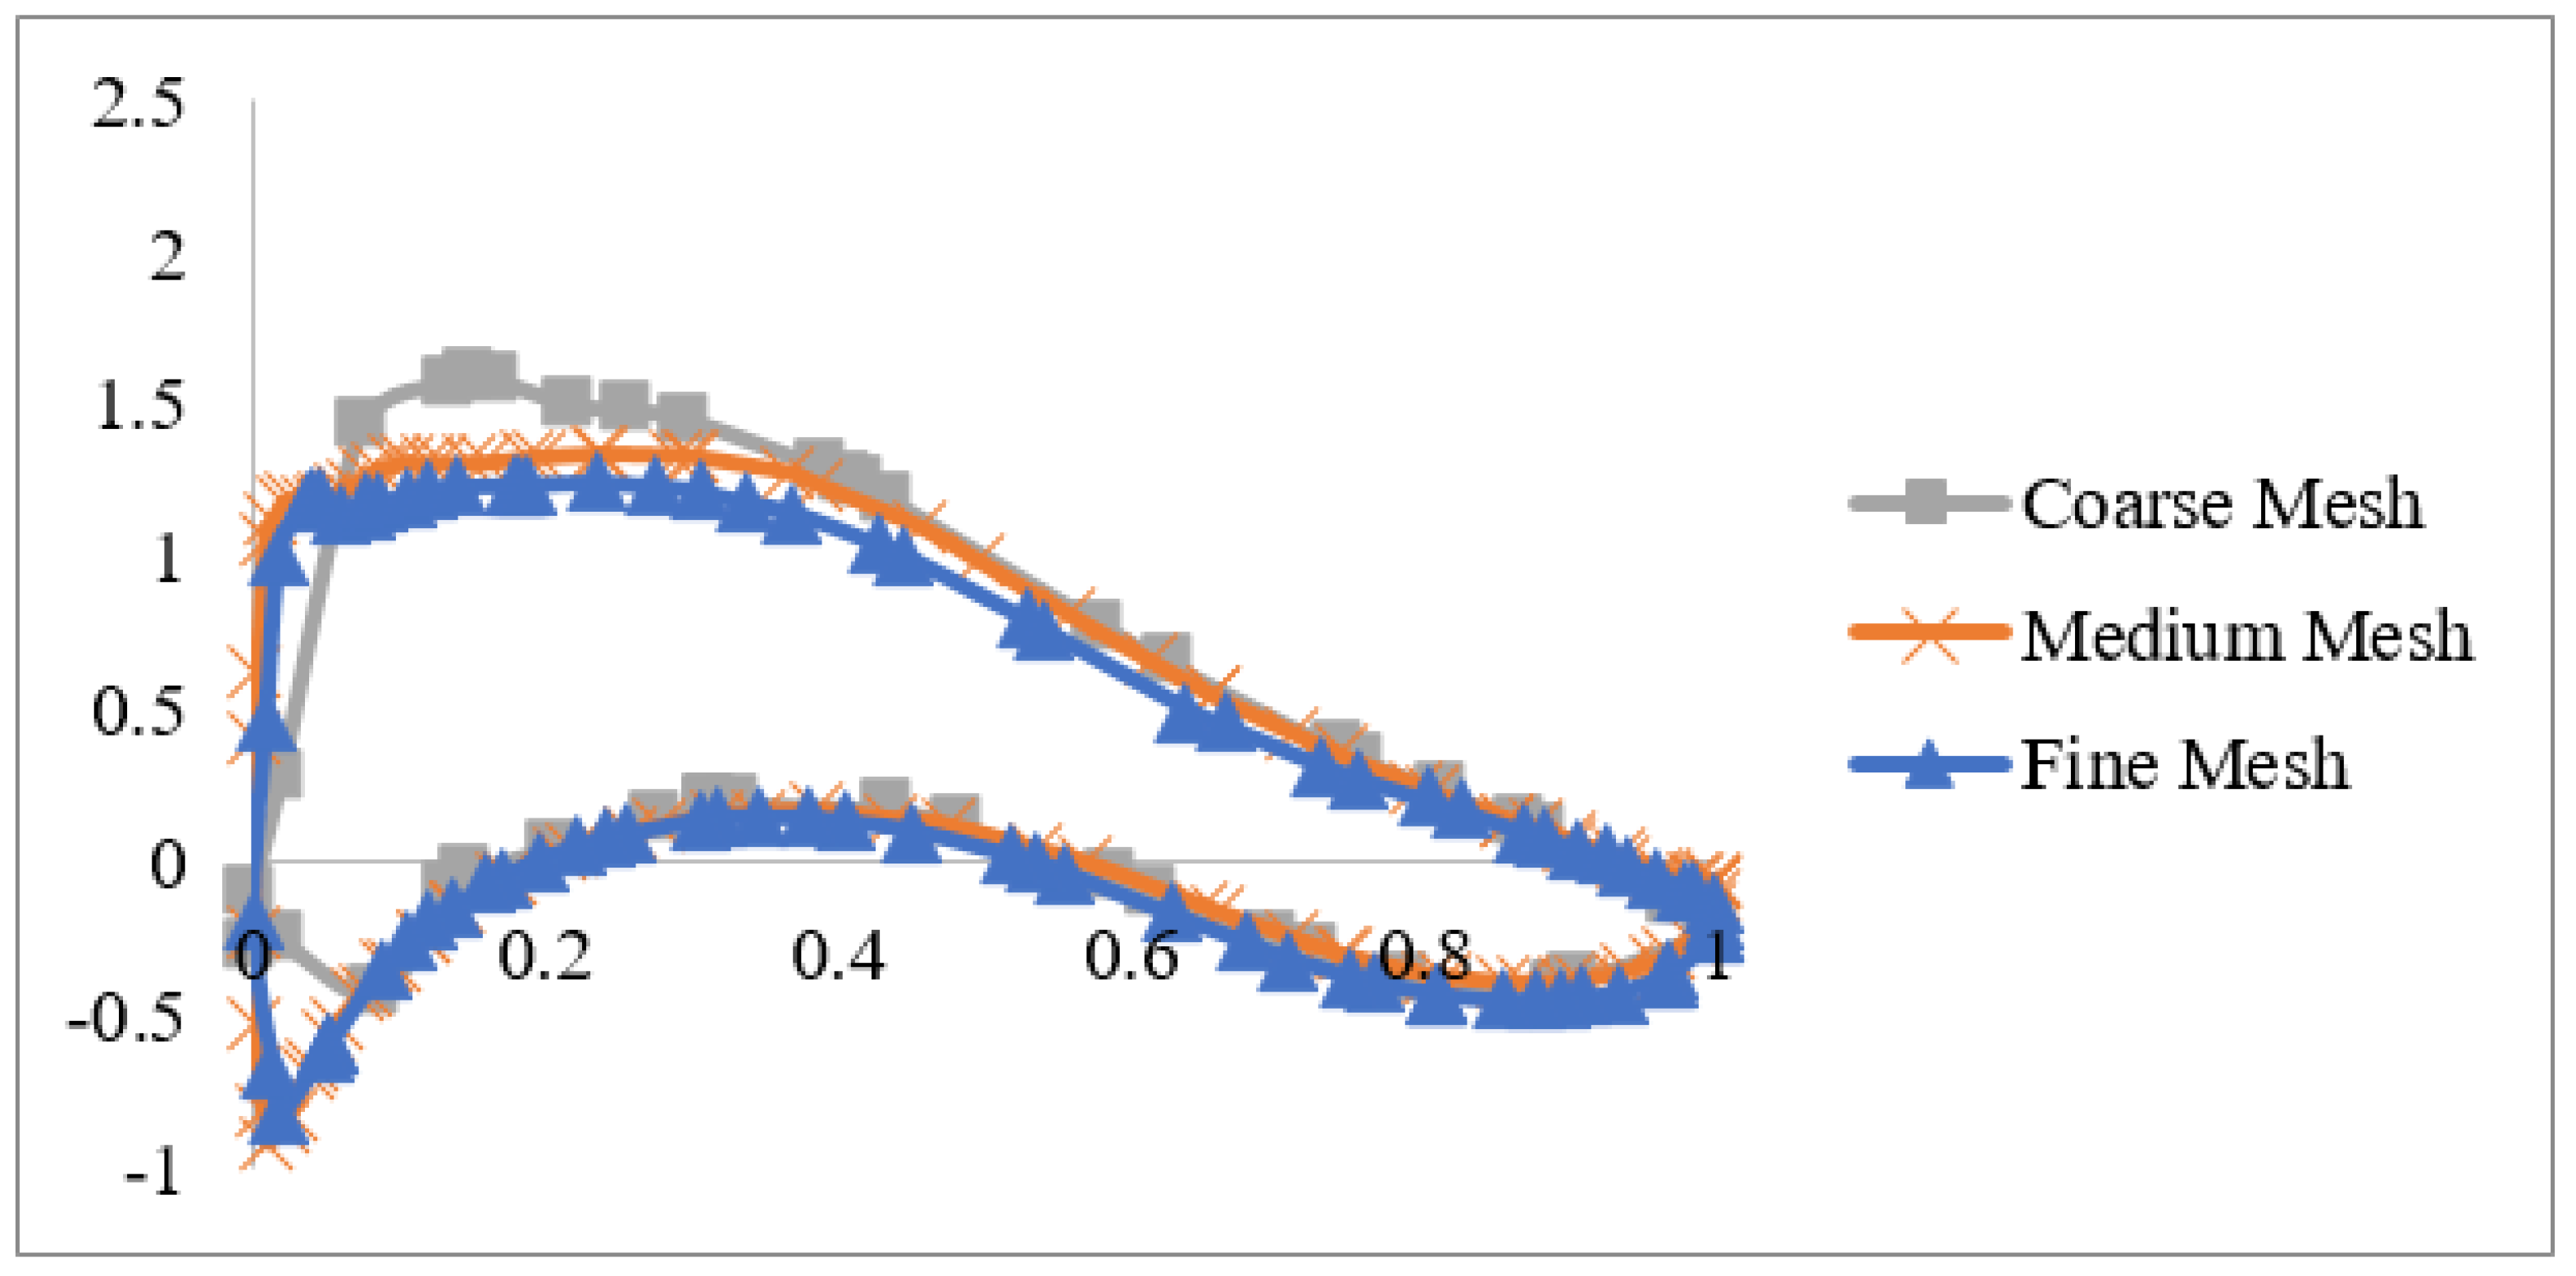
3.1. Mesh Independent Study
The mesh independent study was conducted to analyze the effects of mesh size on simulation results. Three different mesh settings are selected and tested: the total cell number for the coarse mesh is 1,613,463, for the medium mesh is 2,479,240 and for the fine mesh is 4,262,617.
Figure 5 shows the pressure coefficient at the location where r/R equals 0.63 when the inlet wind speed was set as 9 m/s. It is designed to identify whether the results under different mesh conditions are precise enough. The results from the coarse mesh and the fine mesh show evident differences, while a similar pressure coefficient profile was observed for both the medium mesh and the fine mesh. The medium mesh size was finally selected as it provided a good balance between the computational time and accuracy.
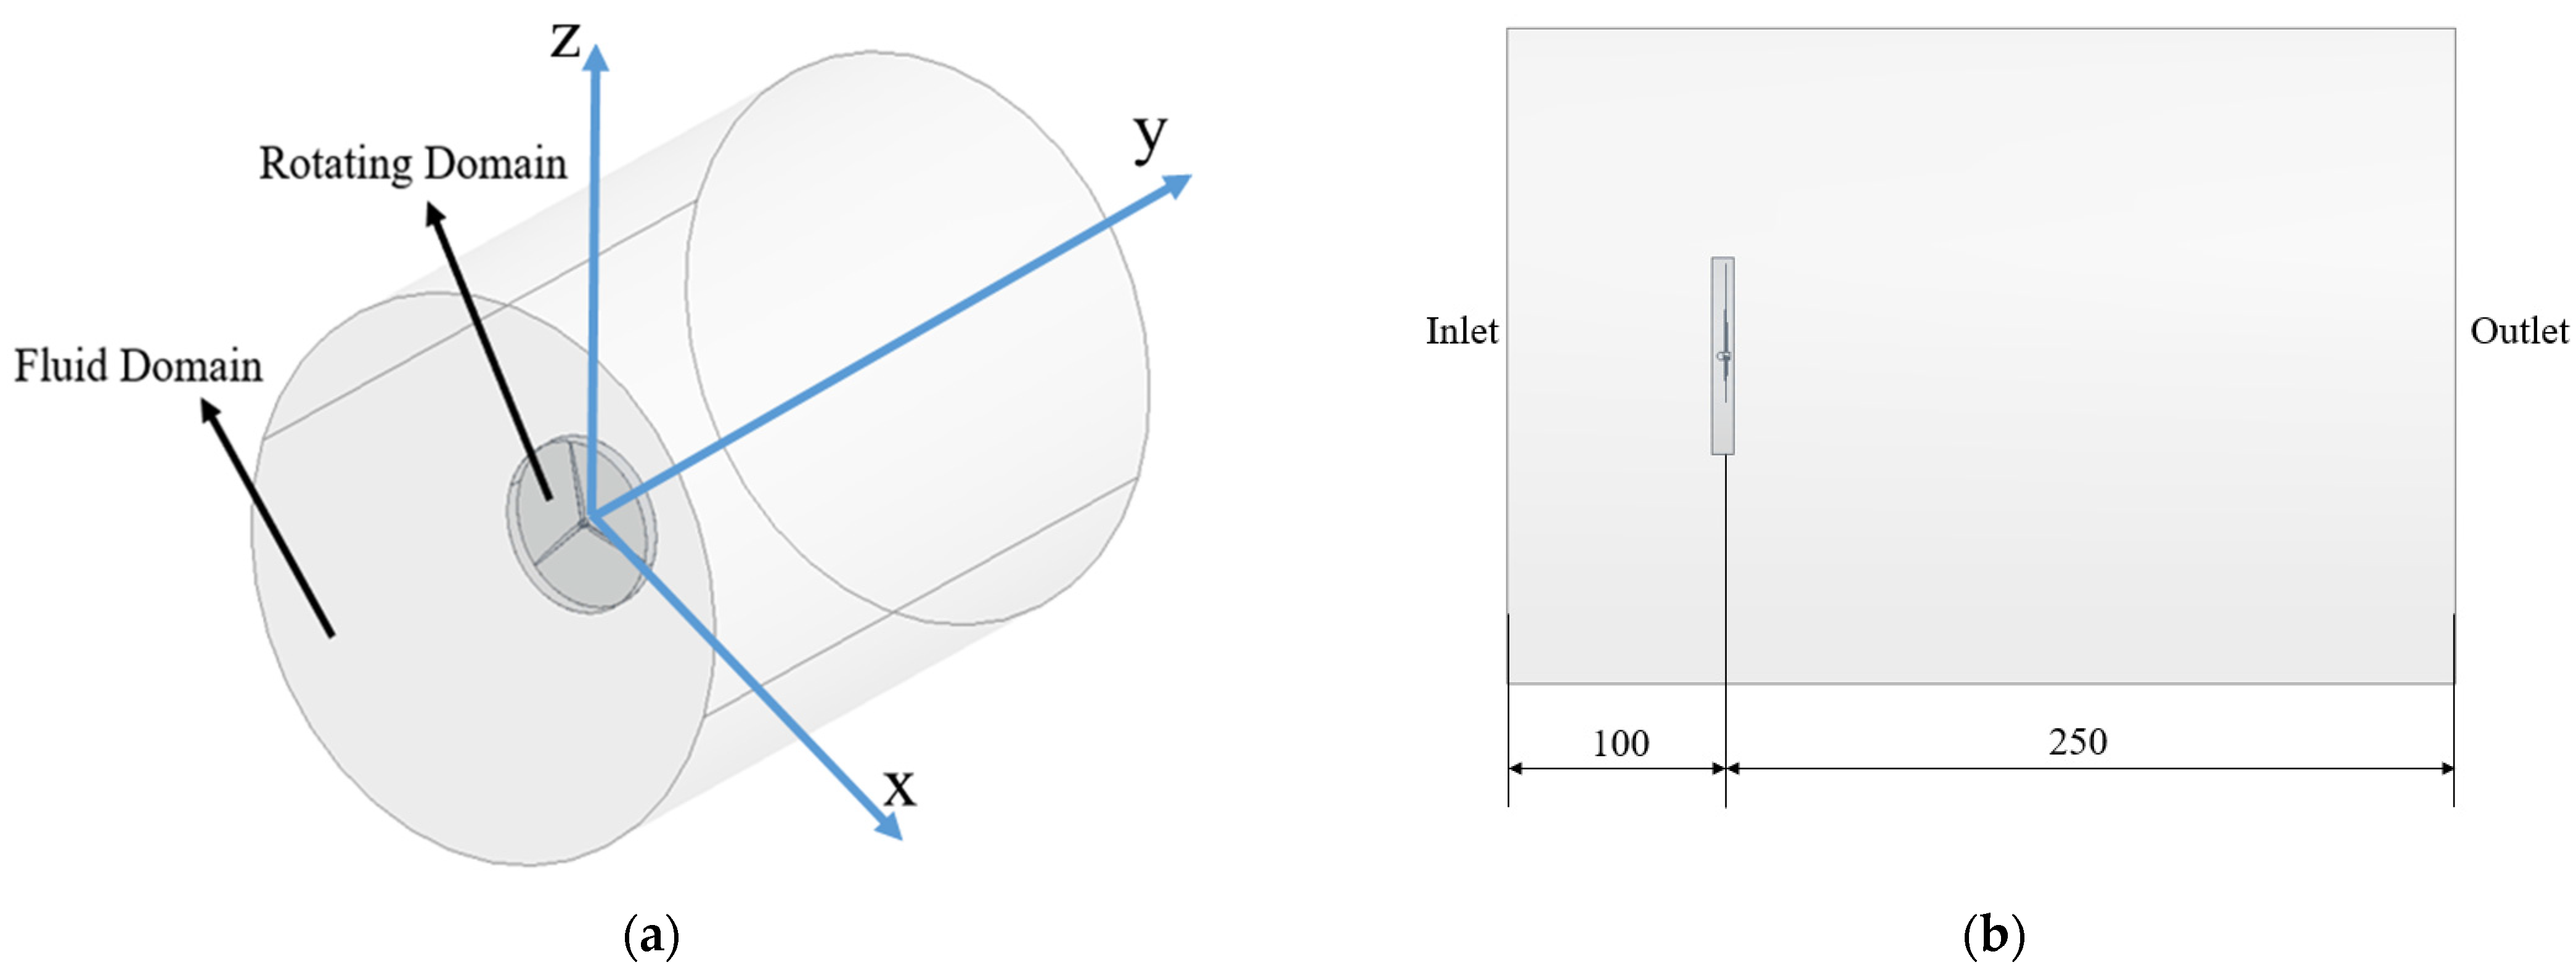
3.2. Computational Domain and Boundary Settings
Model validation was conducted, and the results were compared with Zhao’s work [
14]. The same computational domain was used; the center of the rotor blades, which is also the center of the hub, coincided with the center of global coordinates. As shown in
Figure 6, two domains consisting of computational fluid and rotational region were generated. The rotating domain contains the rotor blade as a smaller cylinder with a 62.9 m in radius, while the fluid domain has a radius of 200 m. The distance from the inlet to the rotor blade is 100 m and the length between the rotor blade and the outlet is 250 m.
In this paper, the aerodynamic performances of NREL offshore 5-MW wind turbine under different fixed wind speeds in the range of 3 m/s to 25 m/s were simulated. The rotor torque, thrust, power, power coefficient, pressure coefficient, wake vortices and velocity profiles are obtained in detail. A total of eight cases were designed and are listed in
Table 1. The rated wind speed for NREL offshore 5-MW wind turbine is 11.4 m/s. For cases 1, 2, 3 and 4, the inlet wind velocity is below the rated speed, and the inlet wind velocity in case 5 is at the rate wind speed, while in cases 6, 7 and 8 the inlet wind velocity is above the rated wind speed. First and foremost, case 4 was validated by comparing the rotor torque and efficiency to numerical results from [
19] and experimental results from [
9], and good agreements were observed. Then, further simulations were conducted to obtain the aerodynamic features for all the eight cases. The aerodynamic features from different cases were also compared with each other. The detailed simulation results are presented in the next section.
3.3. Model Validation Study
Validation was conducted using case 4, with the inlet wind velocity at 9 m/s. The simulated torque was compared the data in the literature for both the numerical results [
19] and experimental results [
9]. A summary of the comparison is given in
Table 2.
The power generated can be determined using
The percentage error of the torque can be calculated as:
Compared with the data from the literature, the percentage errors are less than 5%, and good agreement is observed. Consequently, the current numerical model and settings are appropriate for the following case studies.
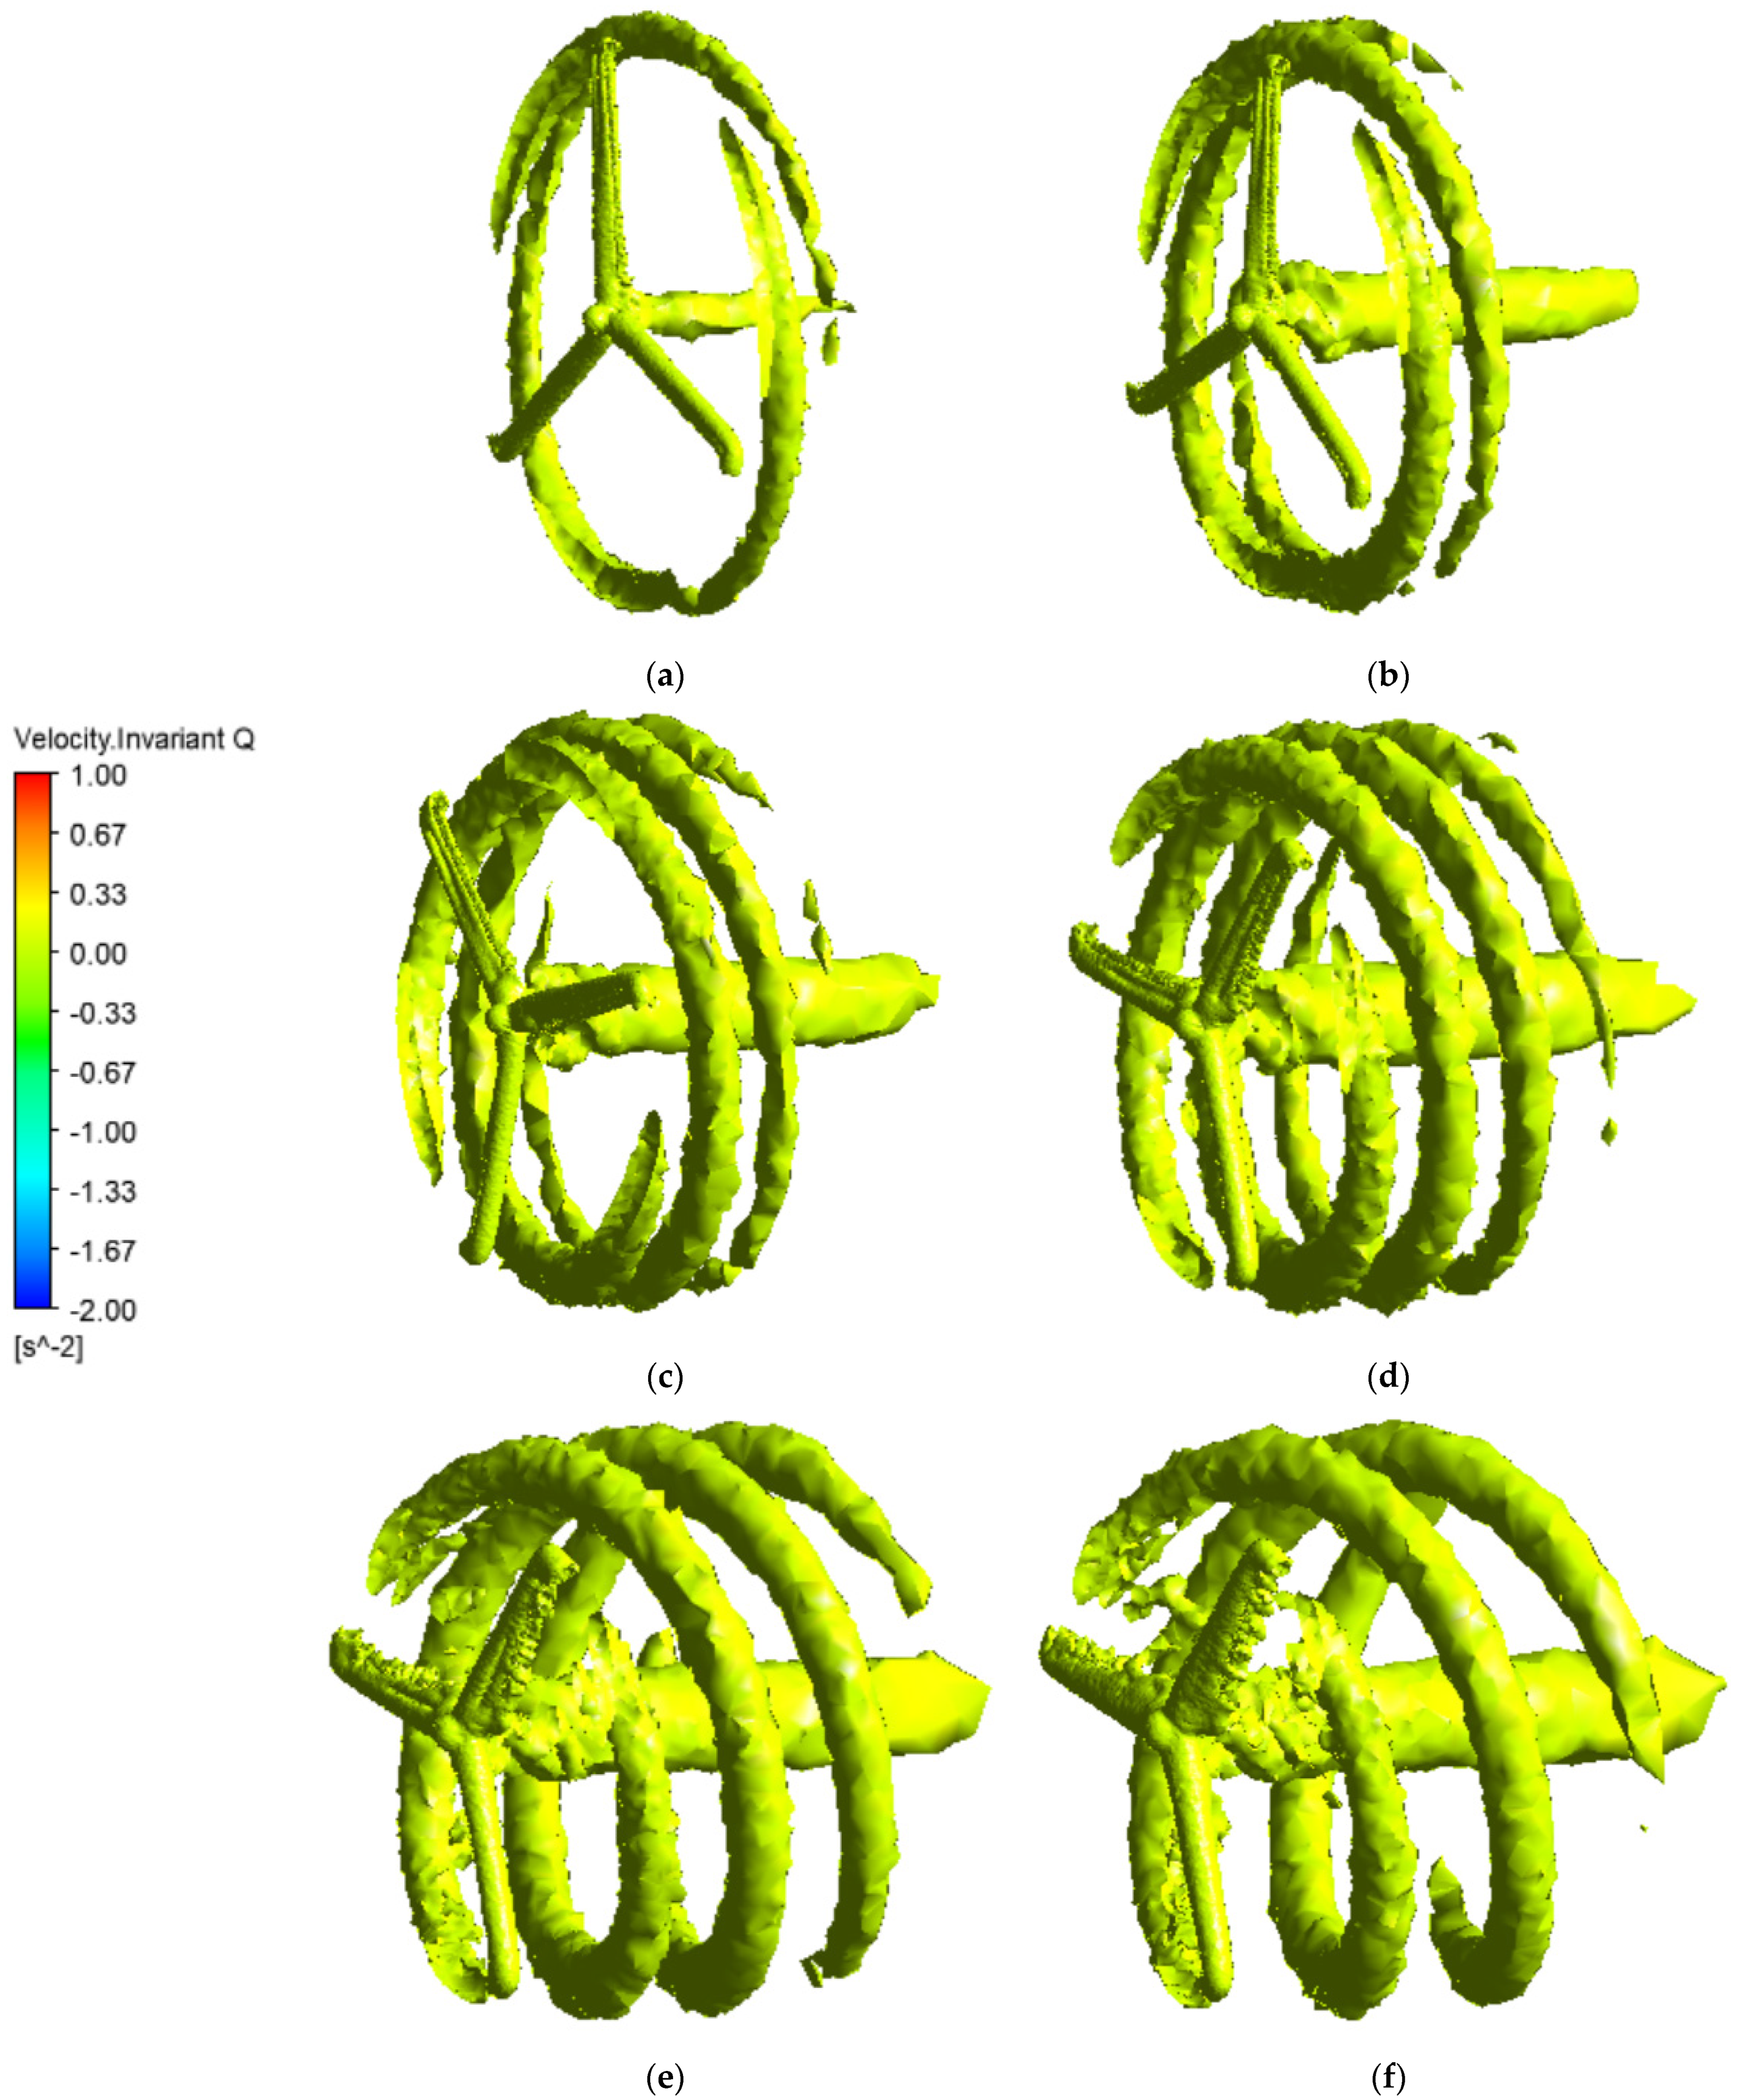
3.4. Wake Vortex Development
Figure 7 shows the iso-surfaces of
Q = 0.008 under different uniform inlet velocities, and clearly demonstrates the wake vortices near and behind the blades. The wake vortex is one of the most significant properties for the aerodynamic analysis of the turbine blade. Additionally,
Q is a second invariant velocity gradient tensor. It is used to capture the wake vortices around the blades and indicates the wake vortices.
Q is expressed as
where
represents the vorticity tensor and
represents the rate of strain tensor.
The wake patterns at the back of the wind turbine rotor under different wind speeds are visualized in
Figure 7. Since the wind turbine blades are rotating, the turbine blades and the surrounding fluid interact with each other. The vortices are generated due to this interaction. The vortices perform helically, intensely, and symmetrically, and then dissipate. With an increase of wind speed, the helical vortices could persist in a longer downstream distance. Once the inlet wind speed is greater than the rated wind speed, the distance between each tip vortex revolution apparently increases.
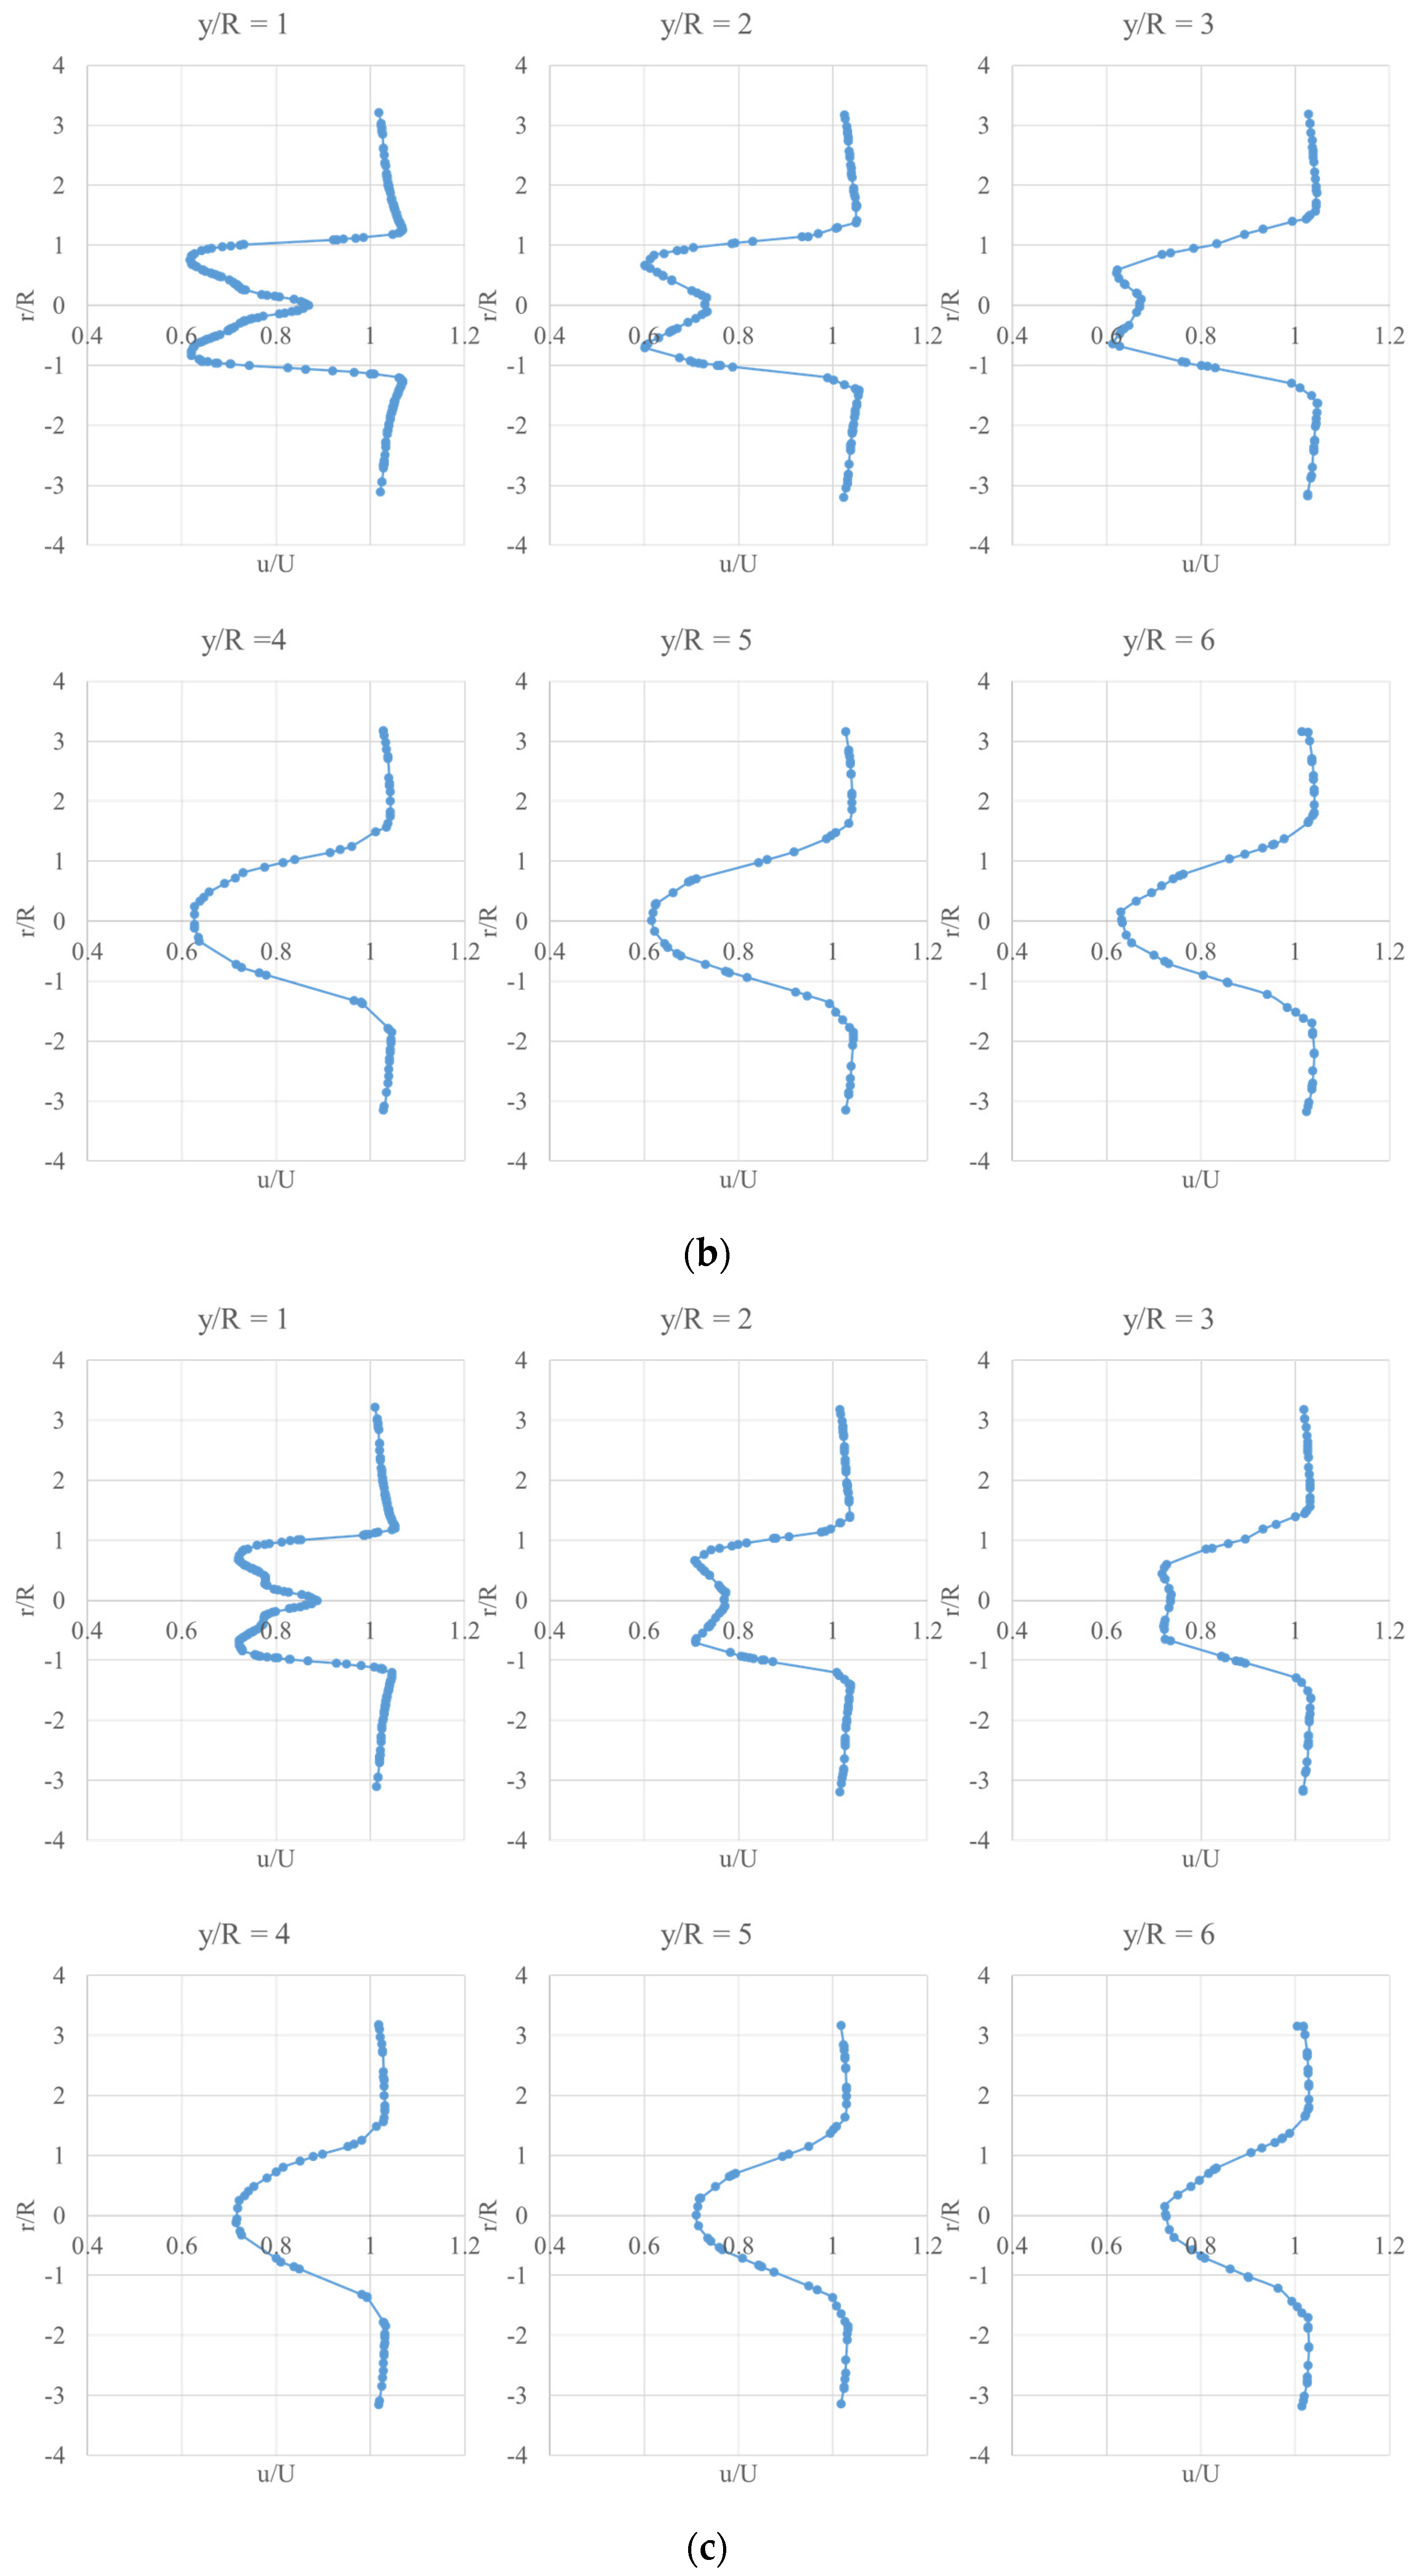
3.5. Near Wake Flow Features
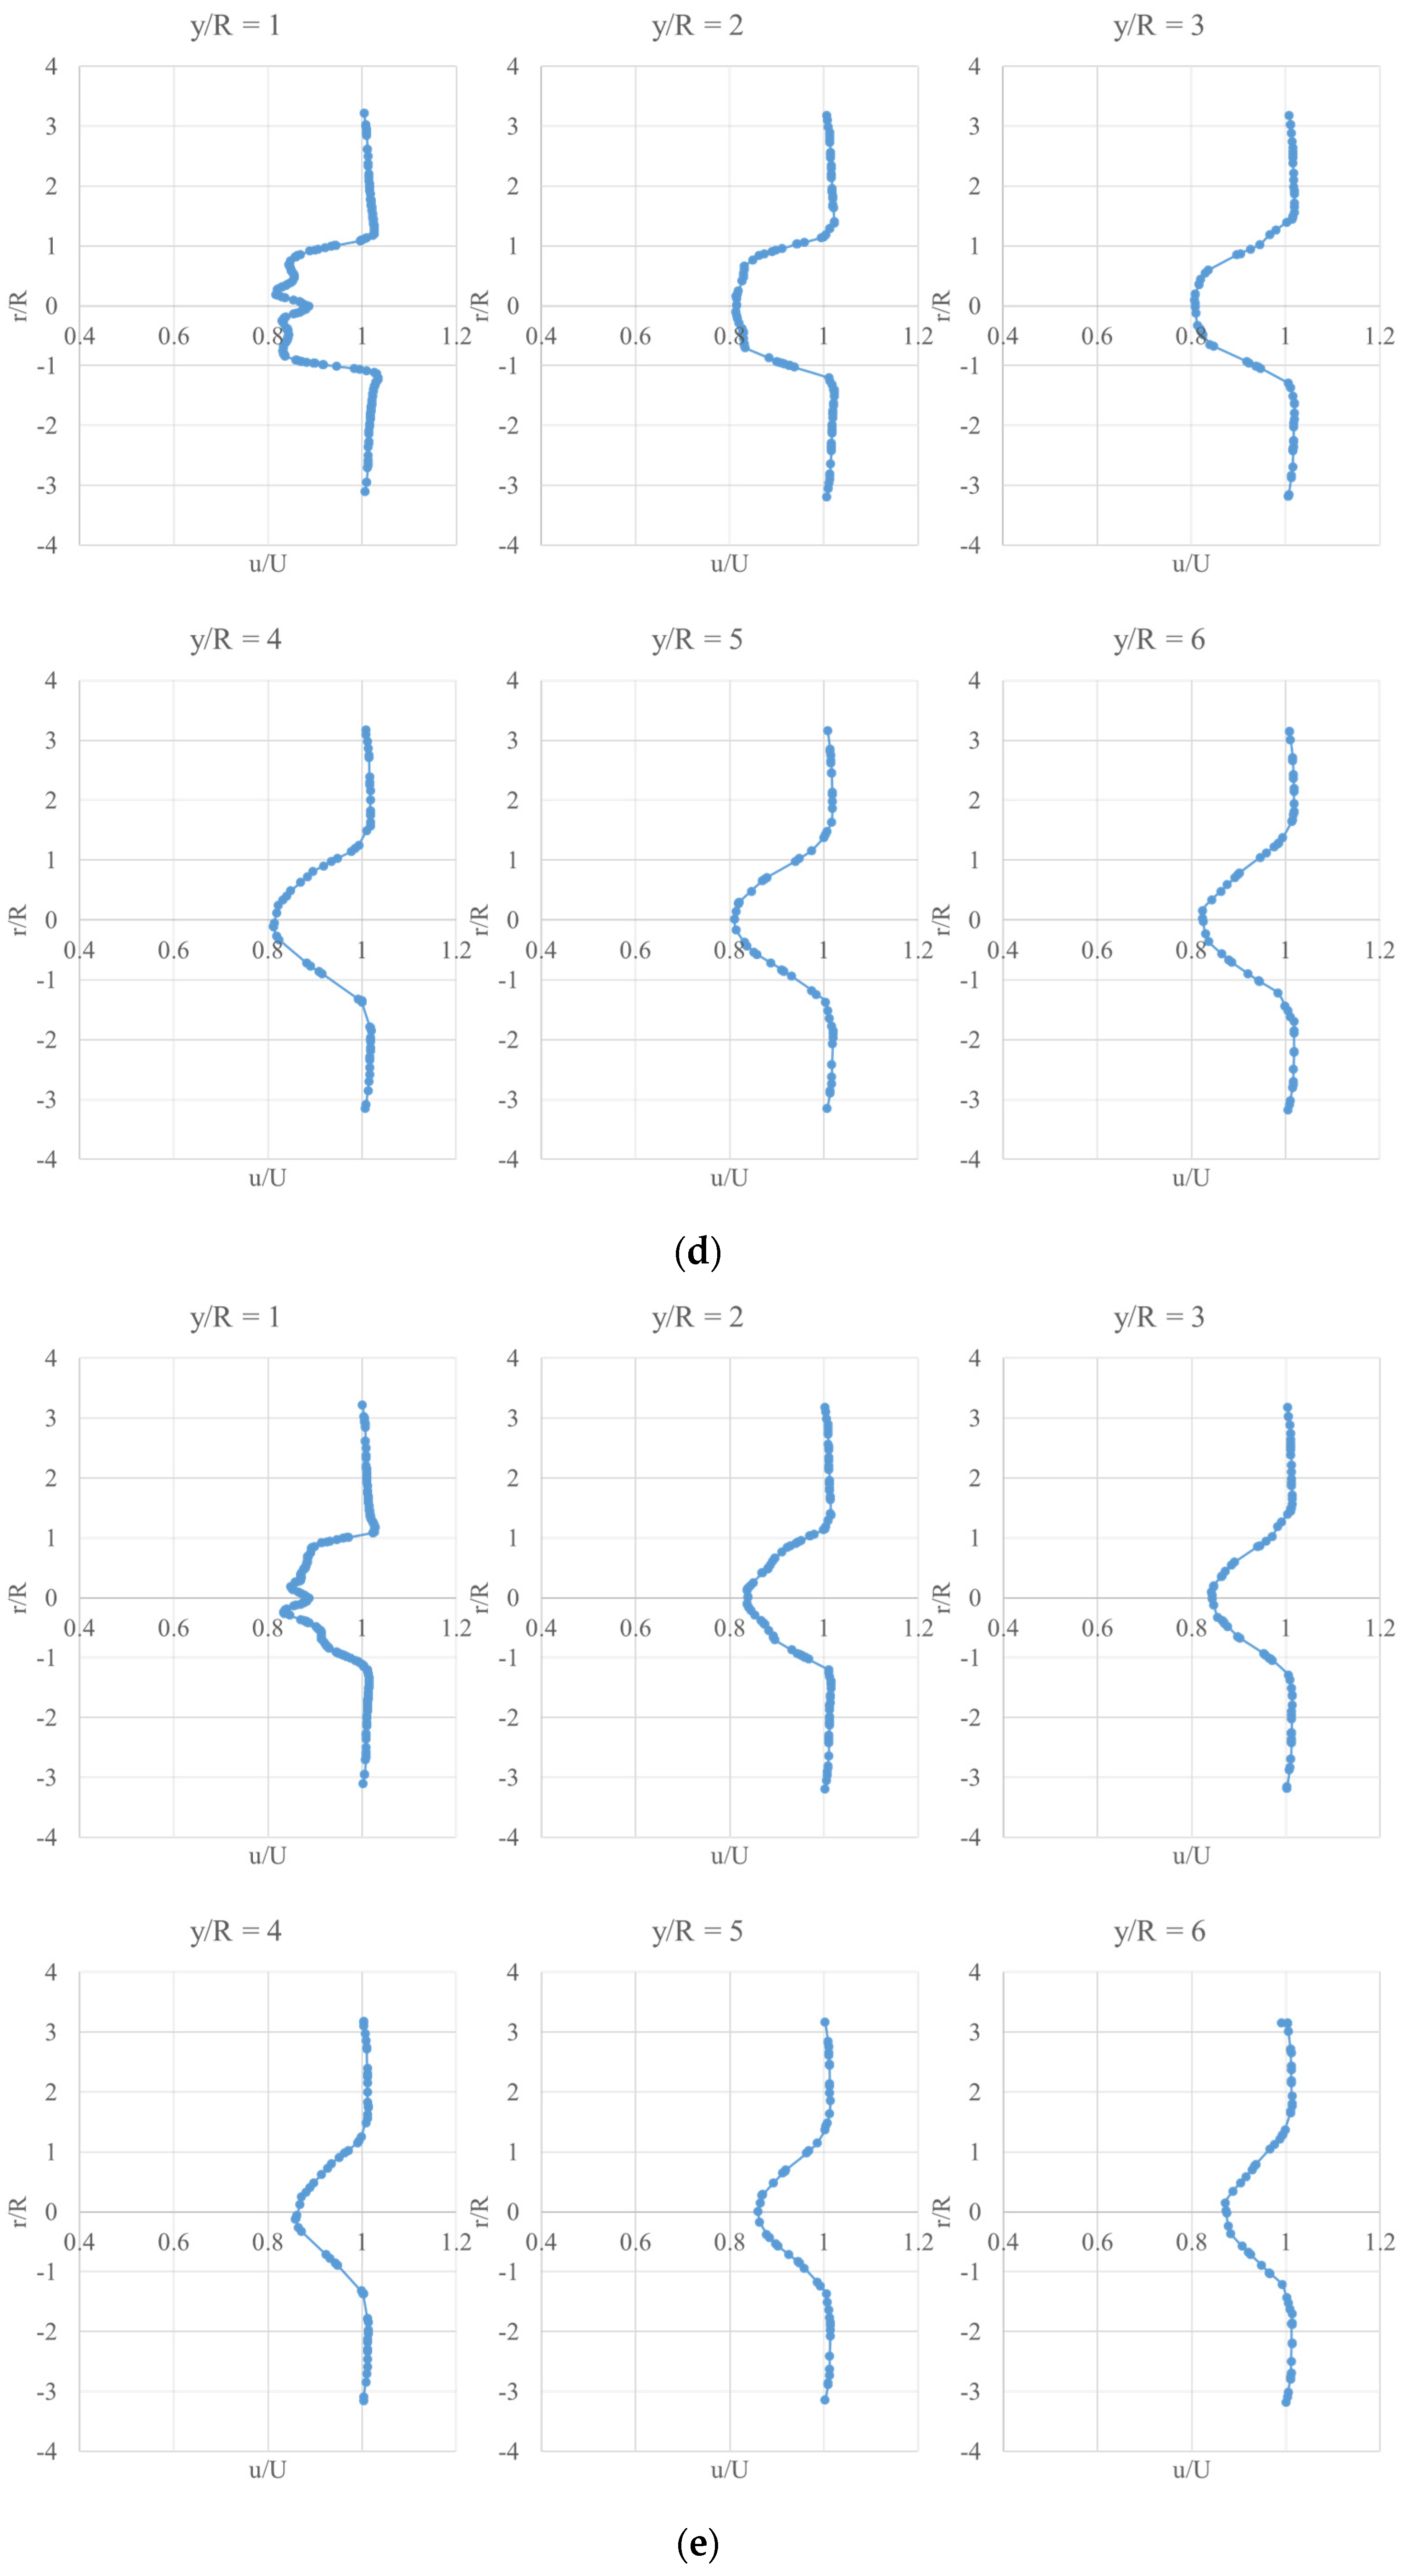
Downstream velocity profiles at various locations (y/R = 1, y/R = 2, y/R = 3, y/R = 4, y/R = 5, y/R = 6) under different inlet wind conditions are shown in
Figure 8. u is local wind velocity and U is the inlet wind speed. When the inlet velocity remains the same, the velocity deficit reaches the peak at y/R = 1, which is the closest region to the wind turbine blade. With the increase of y/R, the selected locations gradually move away from the wind turbine, and the velocity deficit decreases. The center of the velocity profile may be influenced by the wind turbine hub. Focusing on the locations of y/R = 1, 2 and 3, the velocity variation around the center is big. Checking the locations of y/R = 4, 5 and 6, it is easy to find that the velocity barely changes. Thus, when the selected location is gradually further away from the hub, the influence of the wind turbine hub decreases. The velocity recovery process is vividly presented. Somewhere after a downstream of 4R, there is an apparent change from a Double-Gaussian to a Single-Gaussian distribution.
Comparing the velocity profiles under different wind speeds, it can be concluded that as the inlet wind speed increases, the influence of the hub on the velocity profile reduces. Especially when observing the velocity profile at the y/R = 1 location under different wind speeds, the velocity variation around the center when U = 5 m/s is big when compared to the velocity variation under U = 25 m/s.
3.6. Wind Flow Features near Turbine Blades
The near blade flow behavior has a big impact on the rotor, which will be discussed in this section. The limiting streamline is a streamline whose distance normal to the body surface is close to zero but not equal to zero, and it clearly shows the flow separation near the blade. The limiting streamline offers a method to exhibit detailed flow structure near the turbine blade.
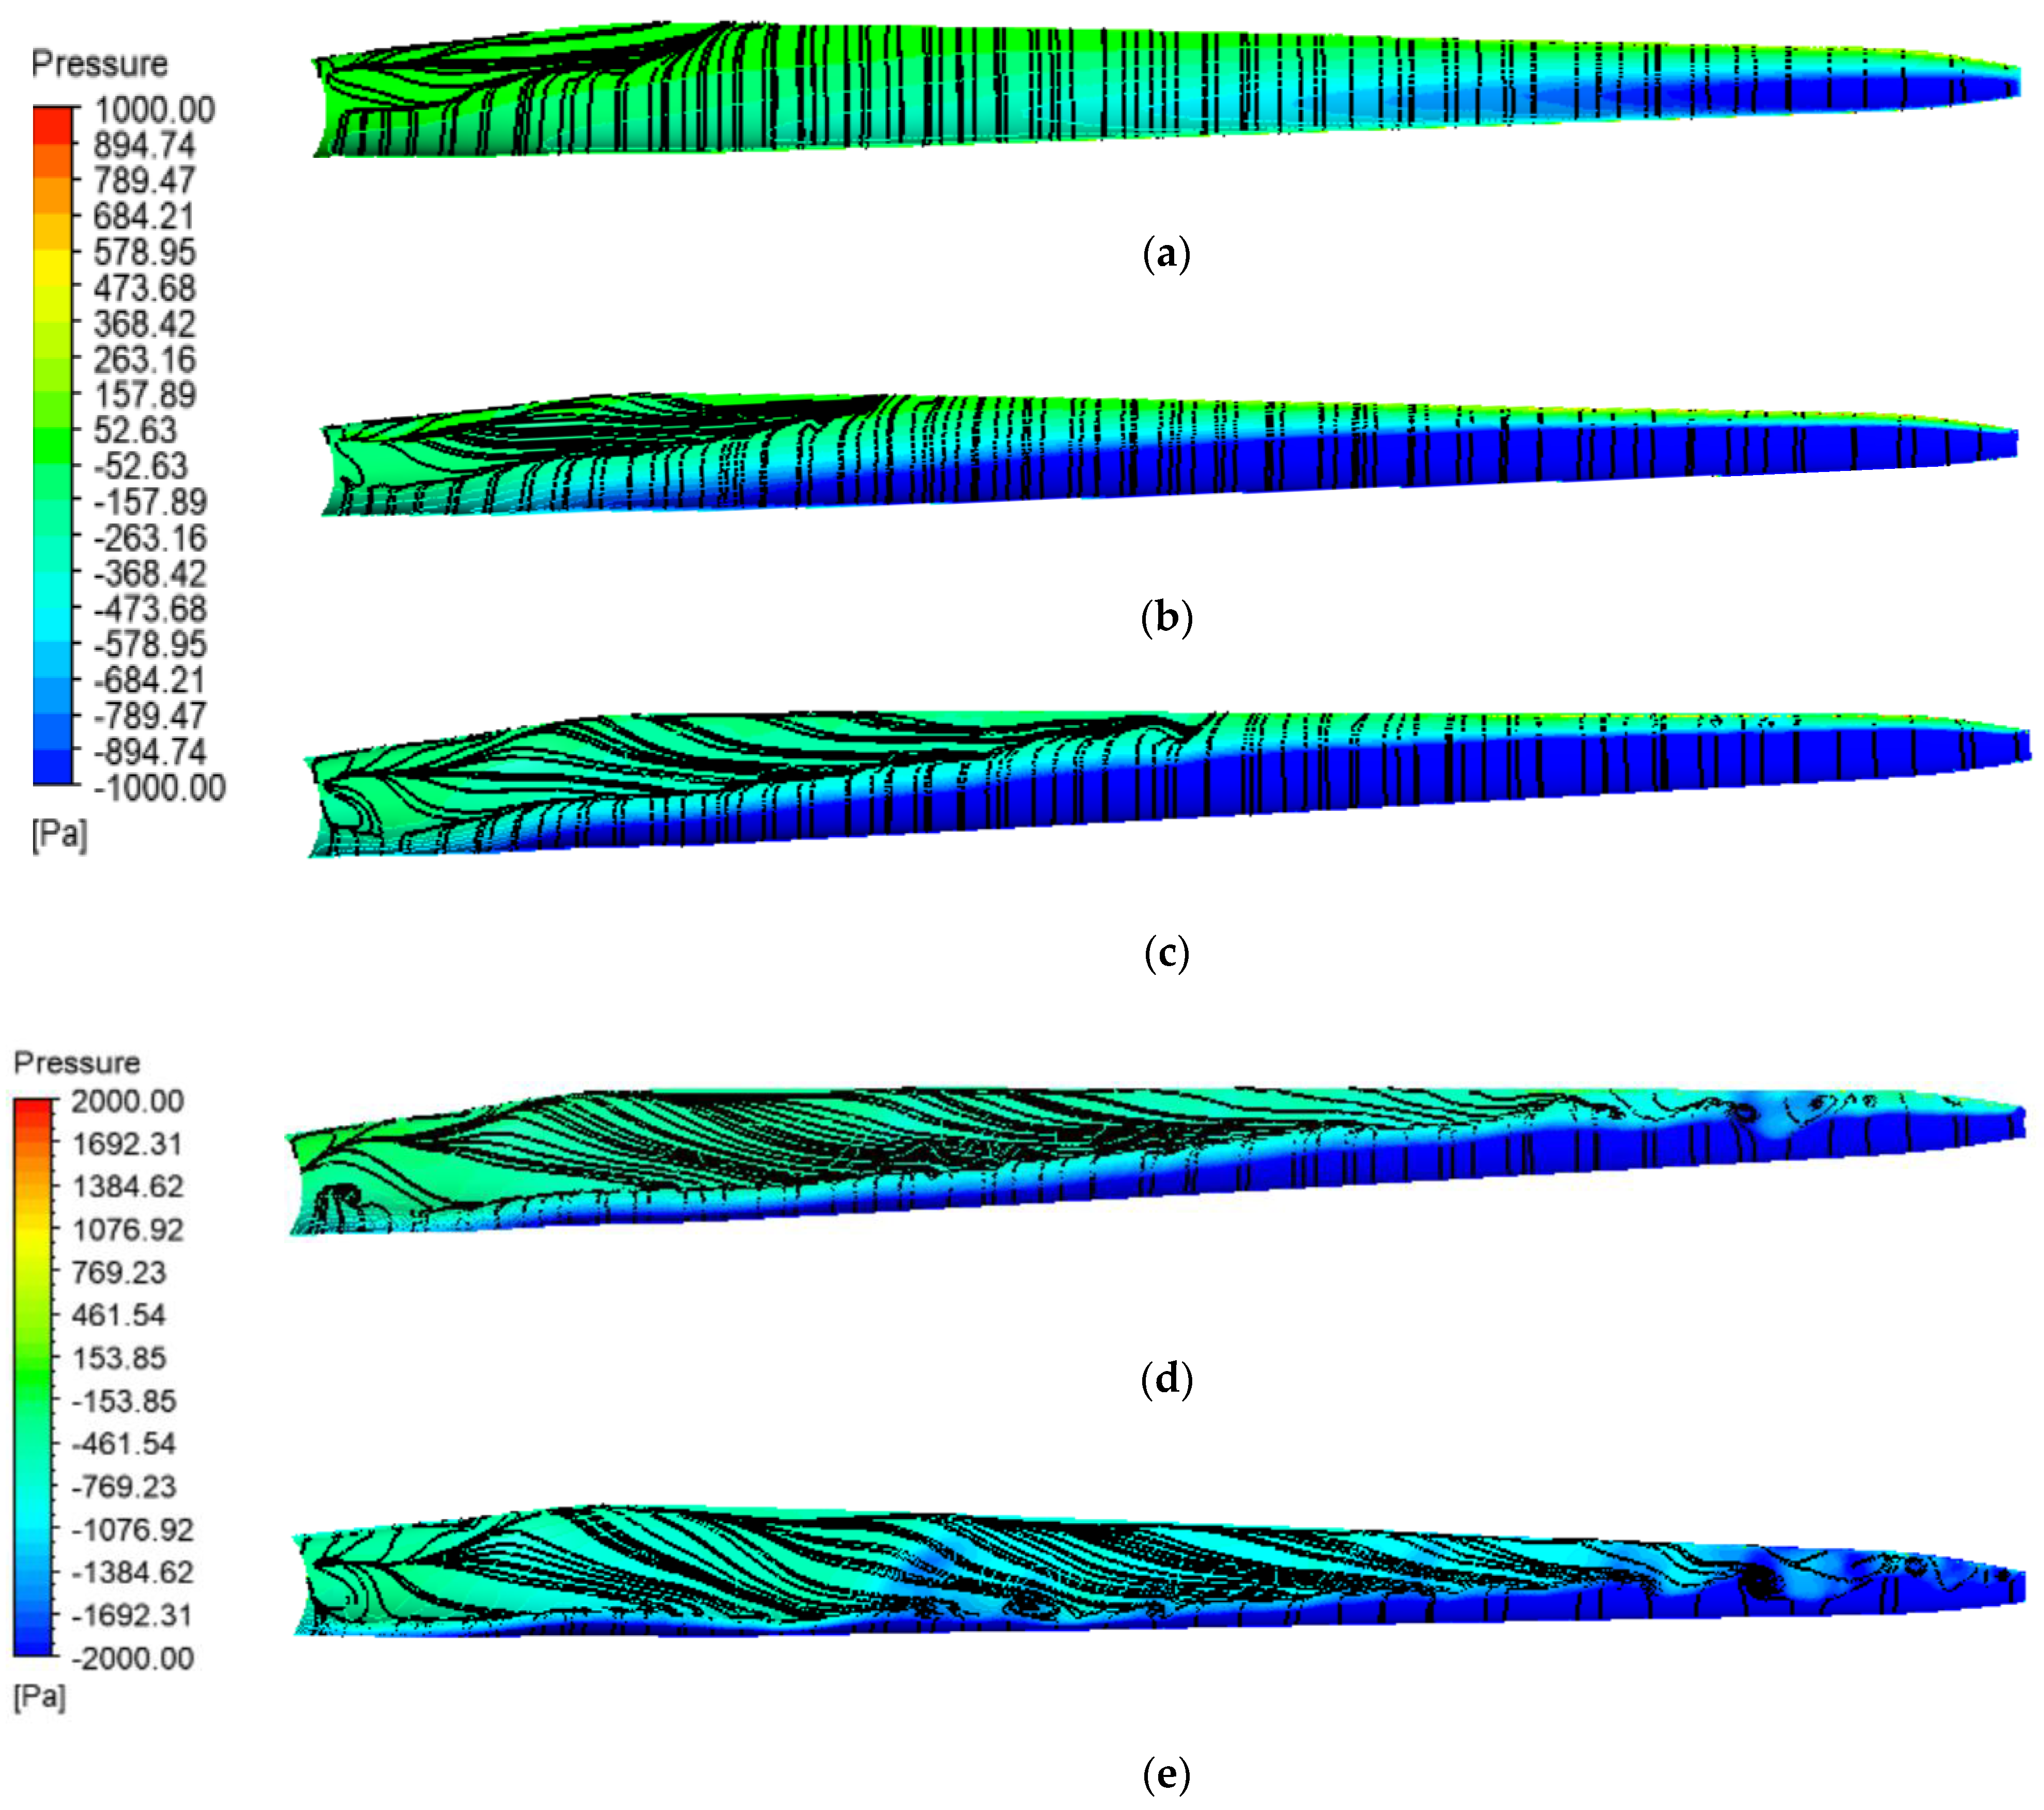
The limiting streamline, along with the distribution of pressure on the suction and pressure side for various conditions, are shown in
Figure 9 and
Figure 10. The changes of the limiting streamline on the suction side are apparent. In
Figure 9, we can see that the flow separation occurs near the root and leading edge part of the blade. This is caused by the pressure difference between the blade’s leading and following edges. Observing the following five conditions, it is easy to conclude that the near root flow separation seems to extend throughout much of the turbine blade as the wind velocity rises. This is due to the rotational centrifugal acceleration. When the inflow wind velocity is big, vortices appear at the trailing edge, while the streamline on the pressure side shows small changes with the various wind speeds. When flow is separated in a stalled region, the pressure difference between the pressure and suction sides of the root is less, leading to a small lift.
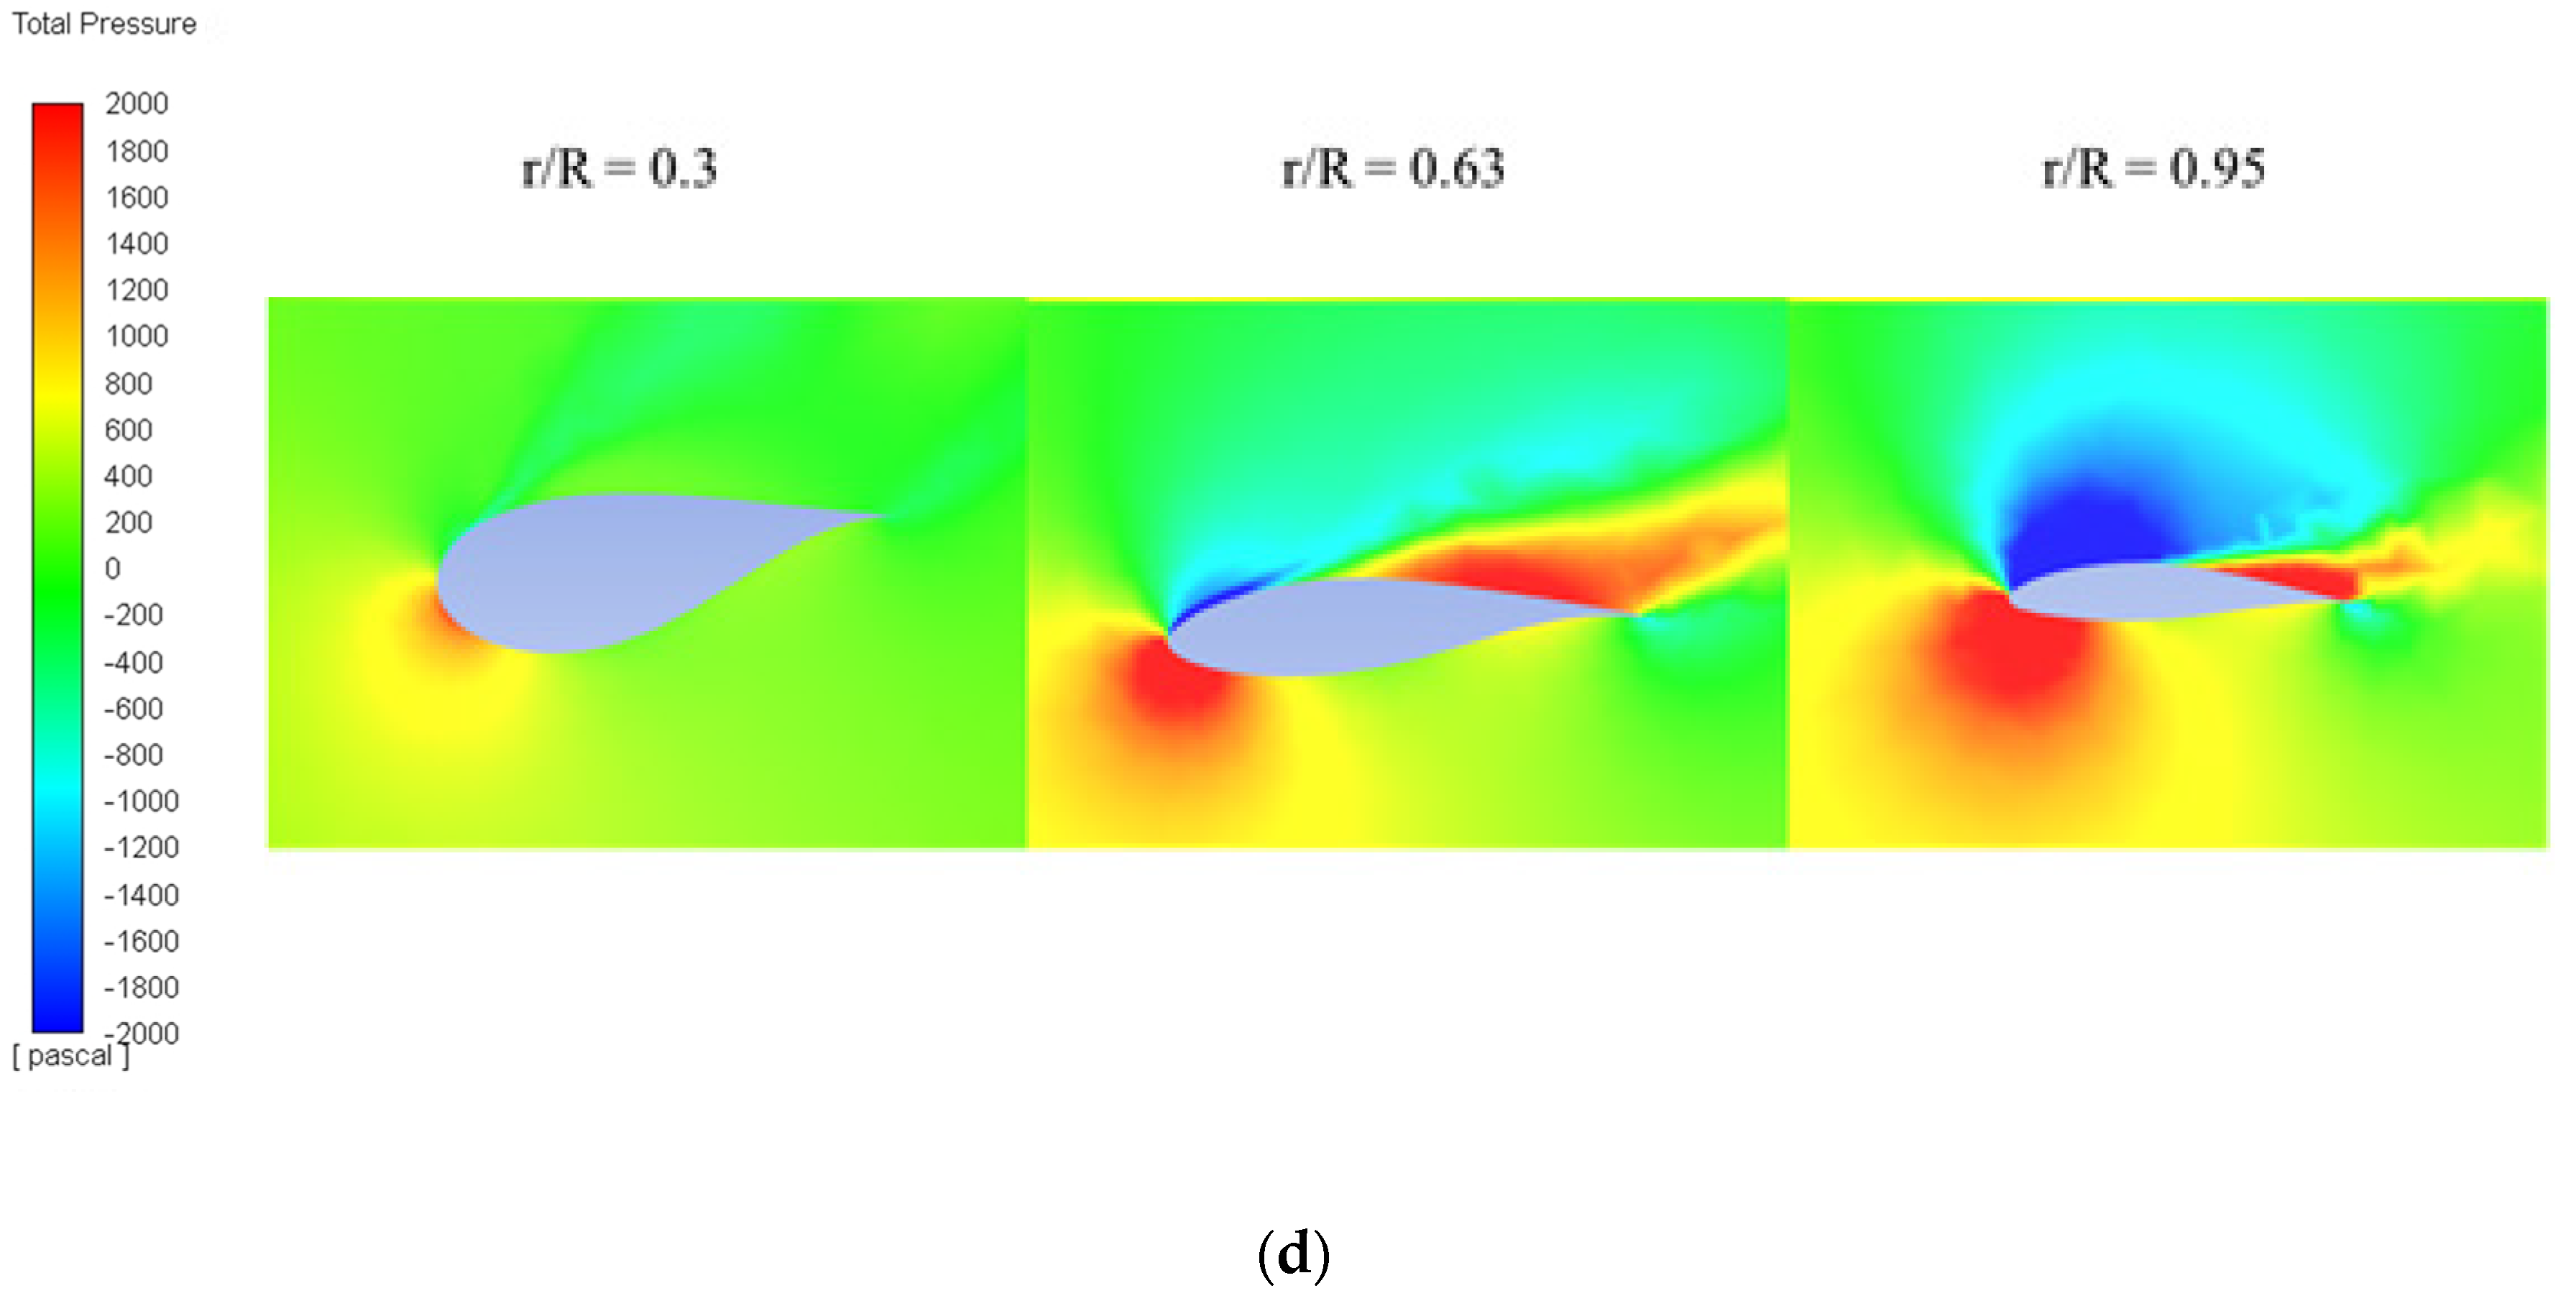
3.7. Pressure and Pressure Coefficient Distribution
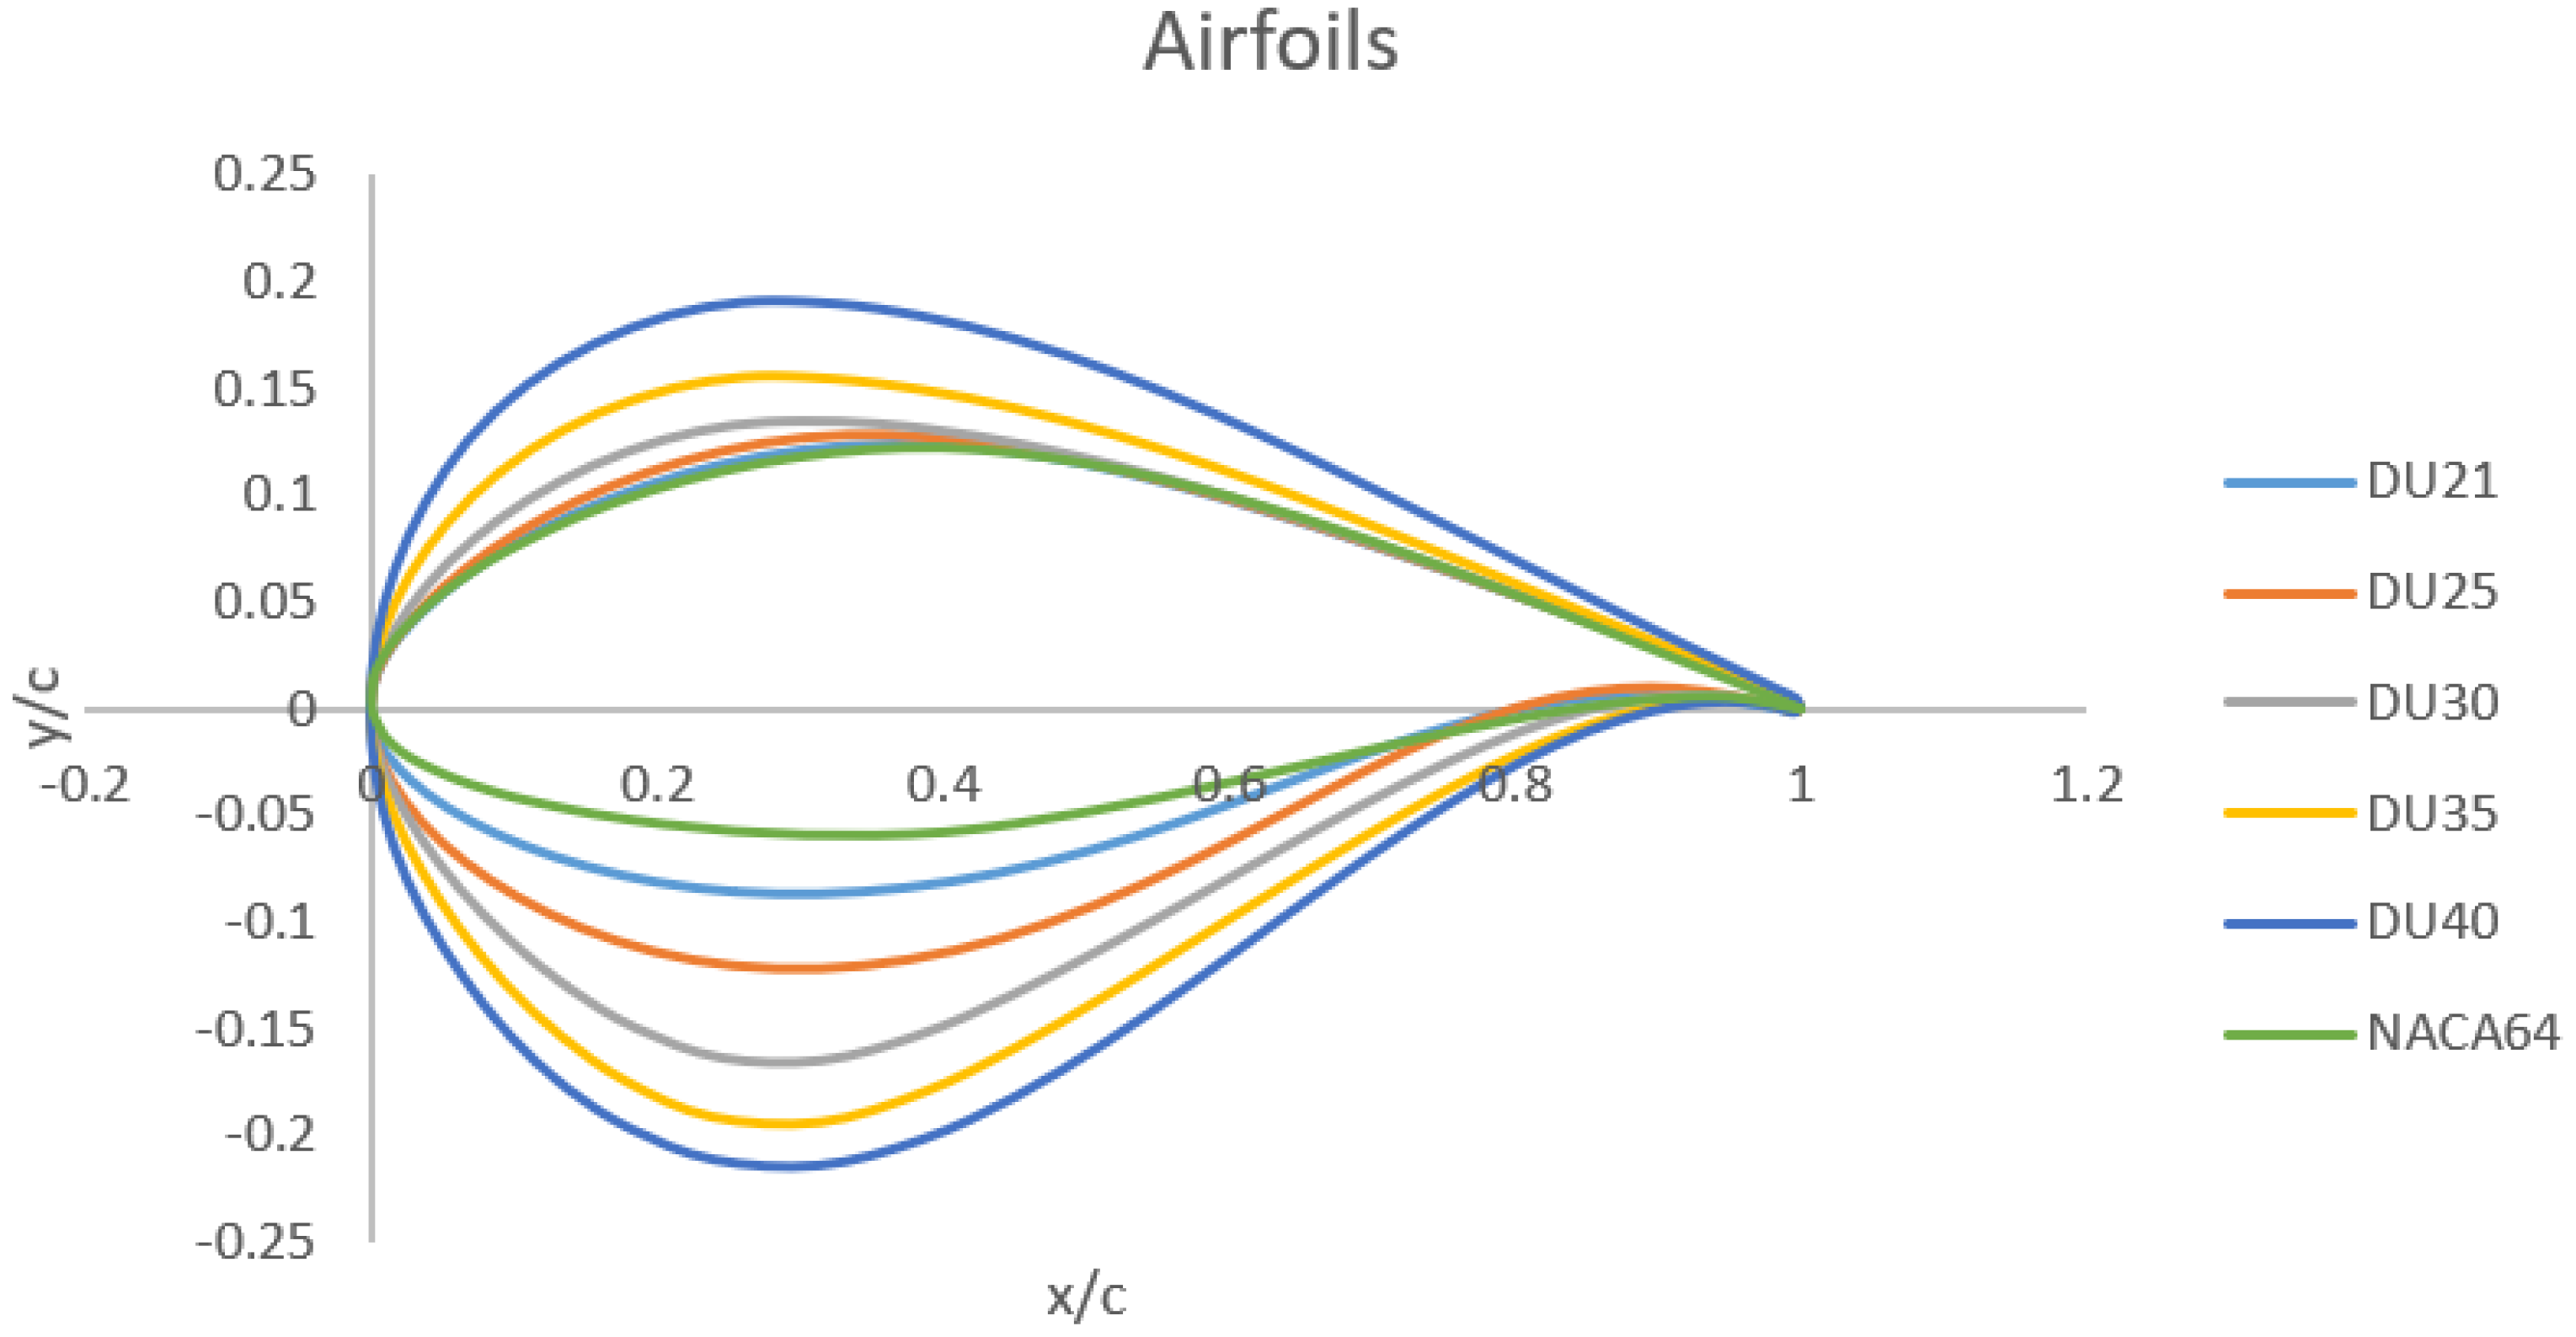
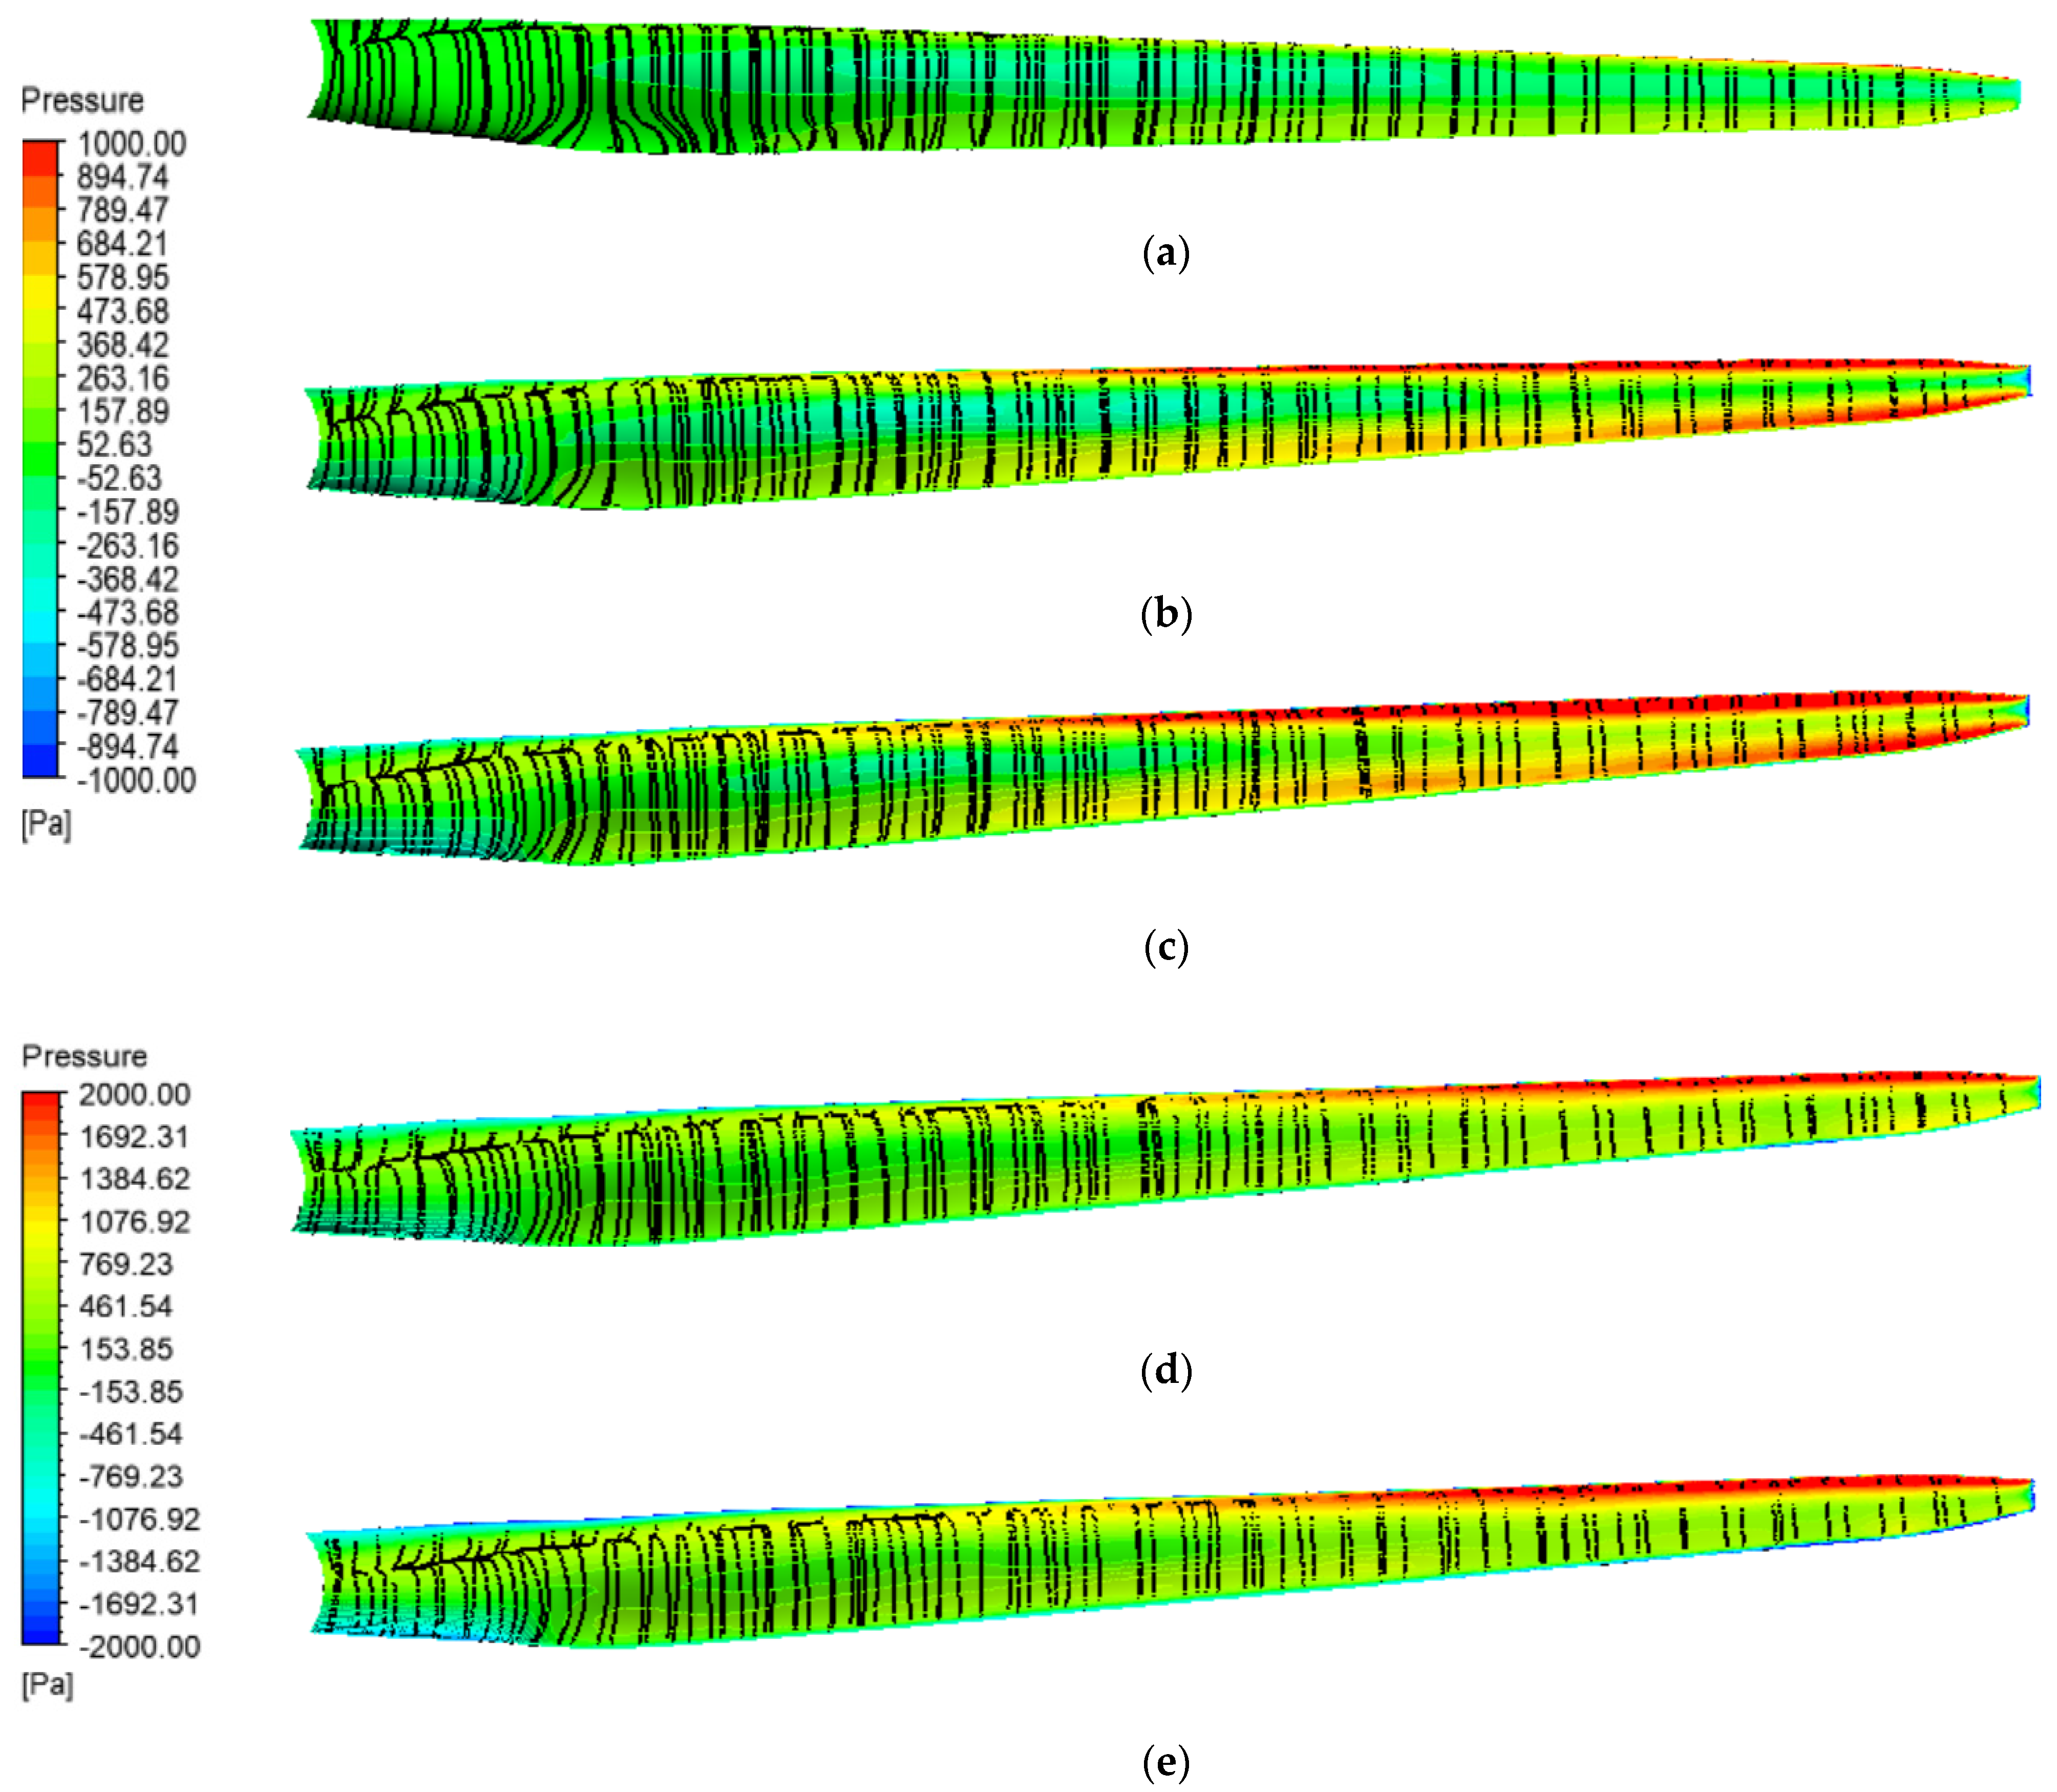
Figure 11 shows the pressure distribution along the blade at r/R = 0.3, 0.63 and 0.95 under various inlet wind speeds. r/R represents the different cross sections of the turbine blade. When r/R = 0.3, Du 35 is implemented for the blade. When r/R is 0.63, Du 21 is used. When r/R = 0.95, NACA 64 is utilized. NACA 64 is more elliptical than the other two selected airfoils.
For the same inflow condition, pressure increases at the leading and the trailing edges; as the inlet velocity increases, the pressure also increases at both the leading and the trailing edges. The lifting pressure increases from the base to the tip under the same inflow condition, it also increases when the inflow velocity is below the rated wind speed; however, once the inflow velocity is above the rated wind speed, that is not the case.
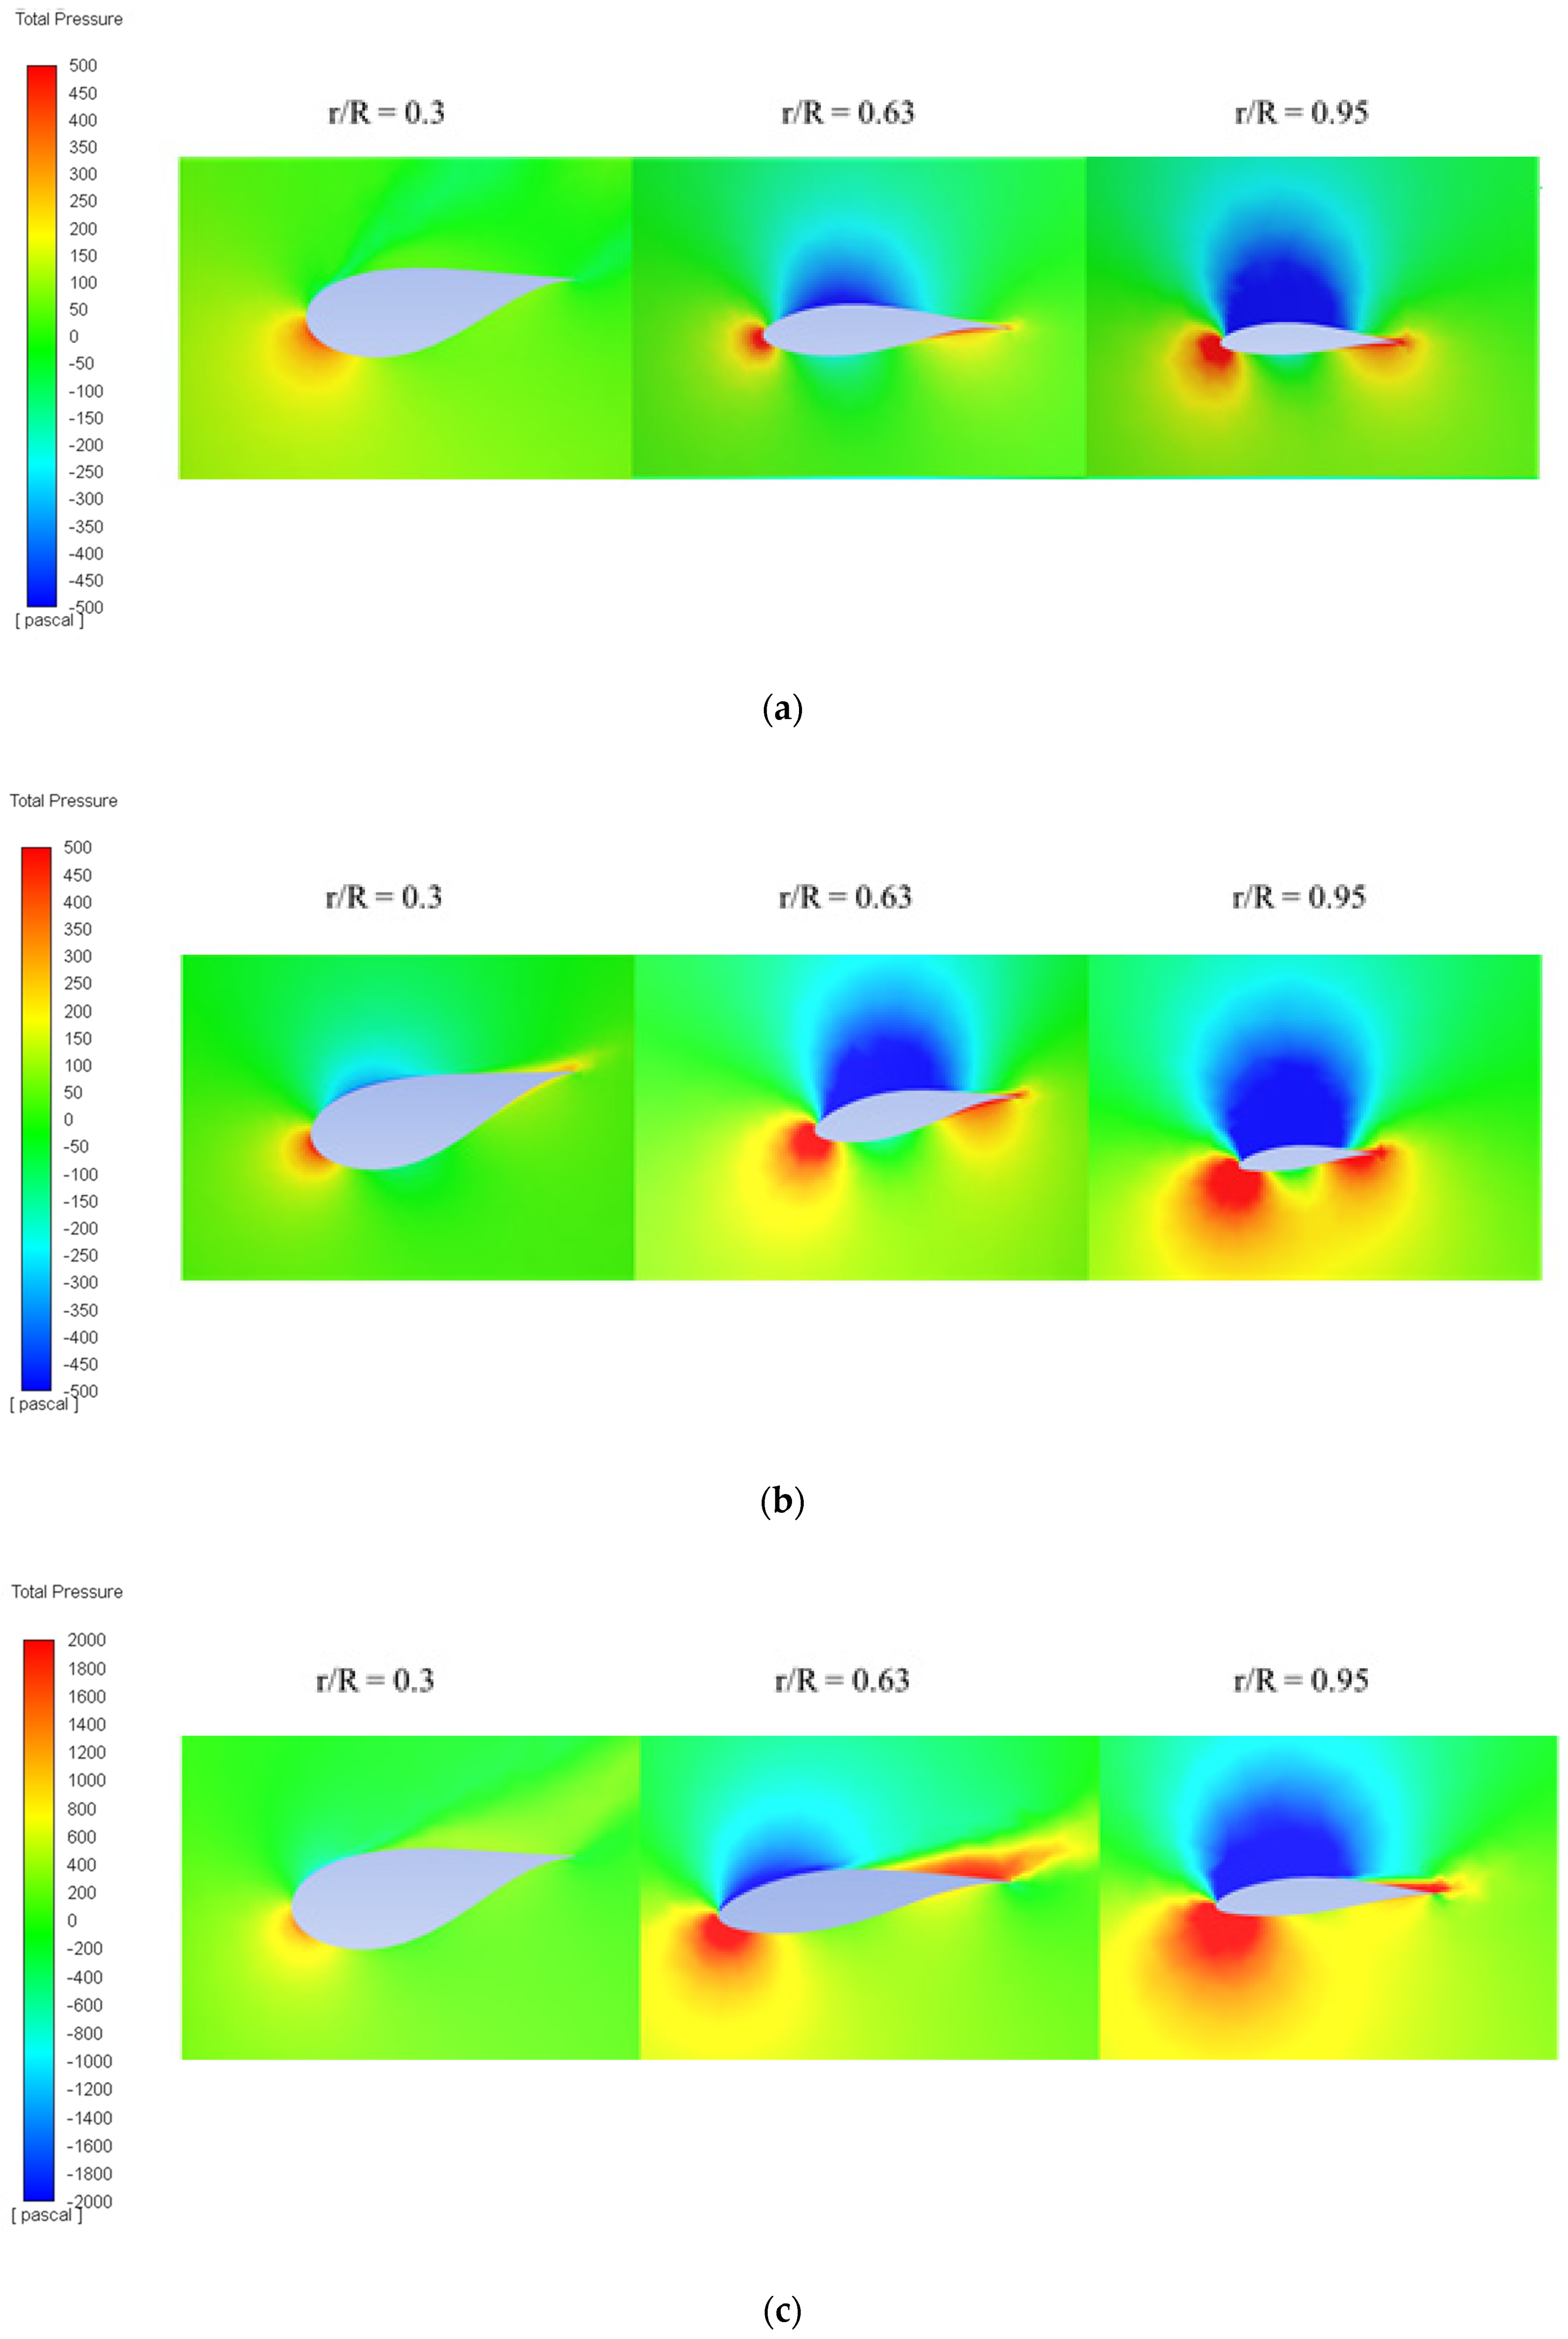
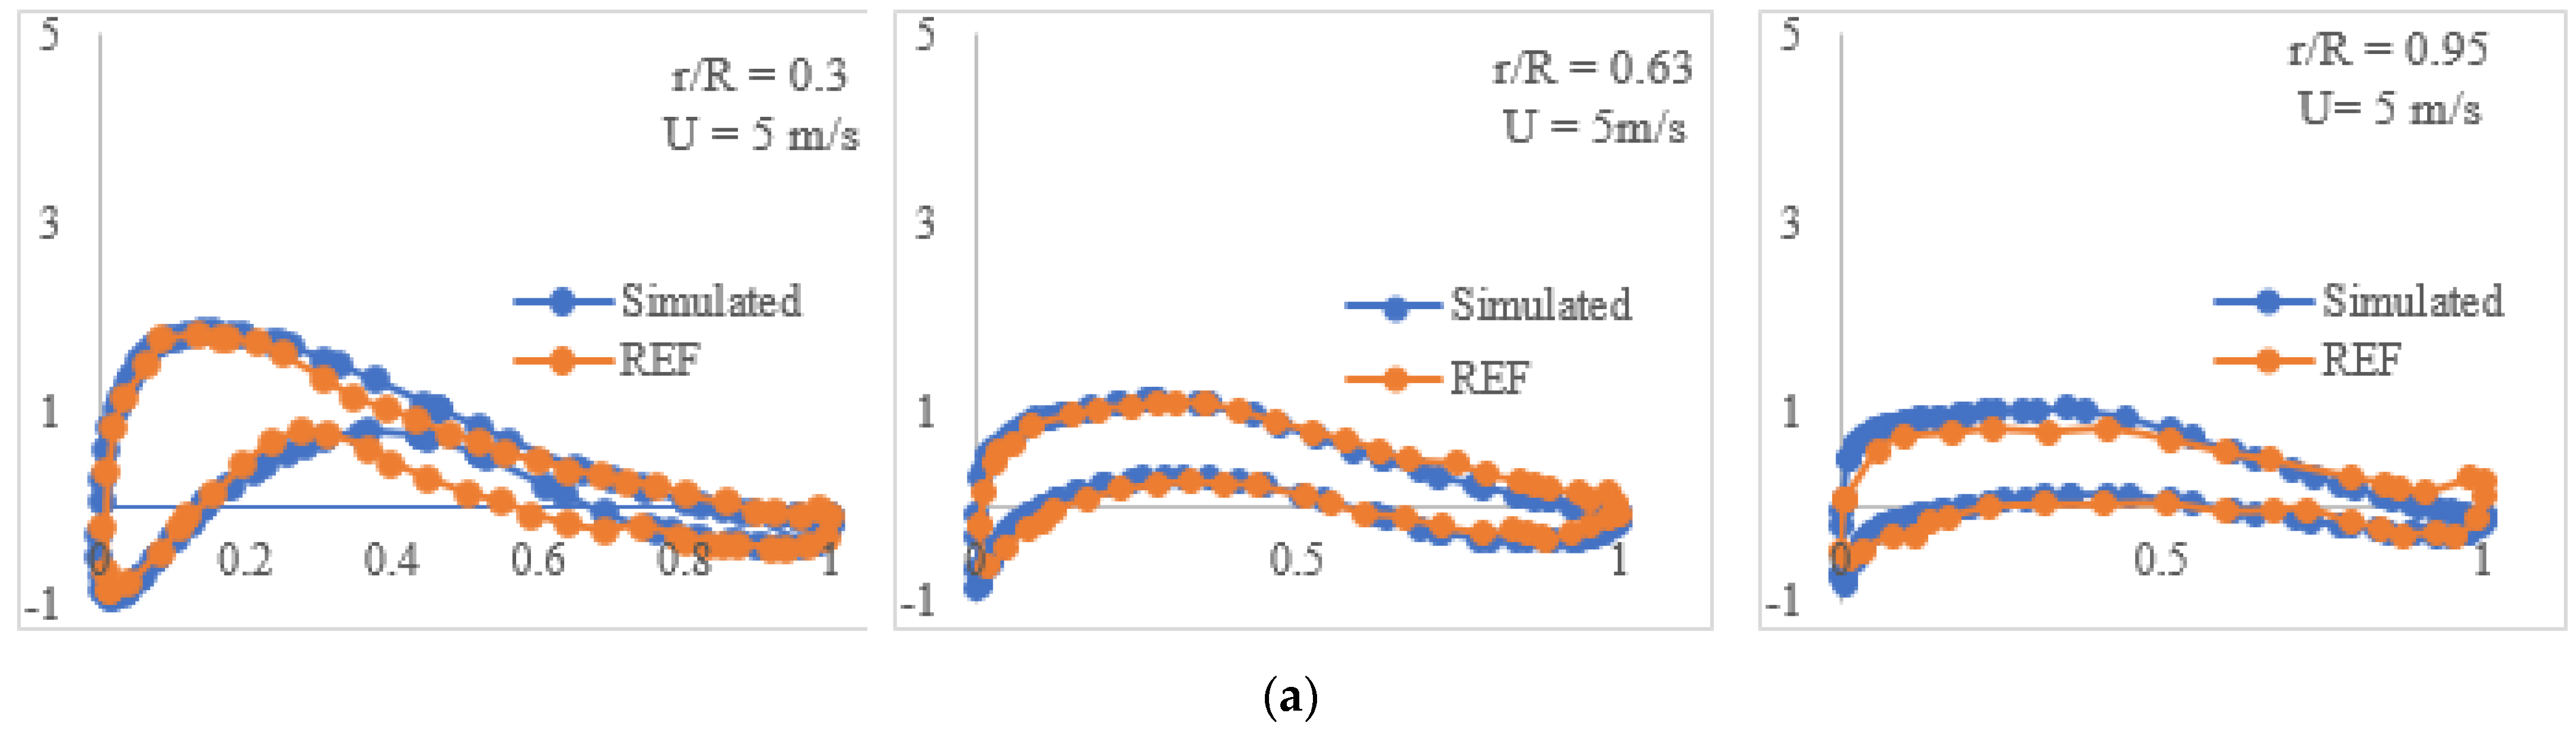
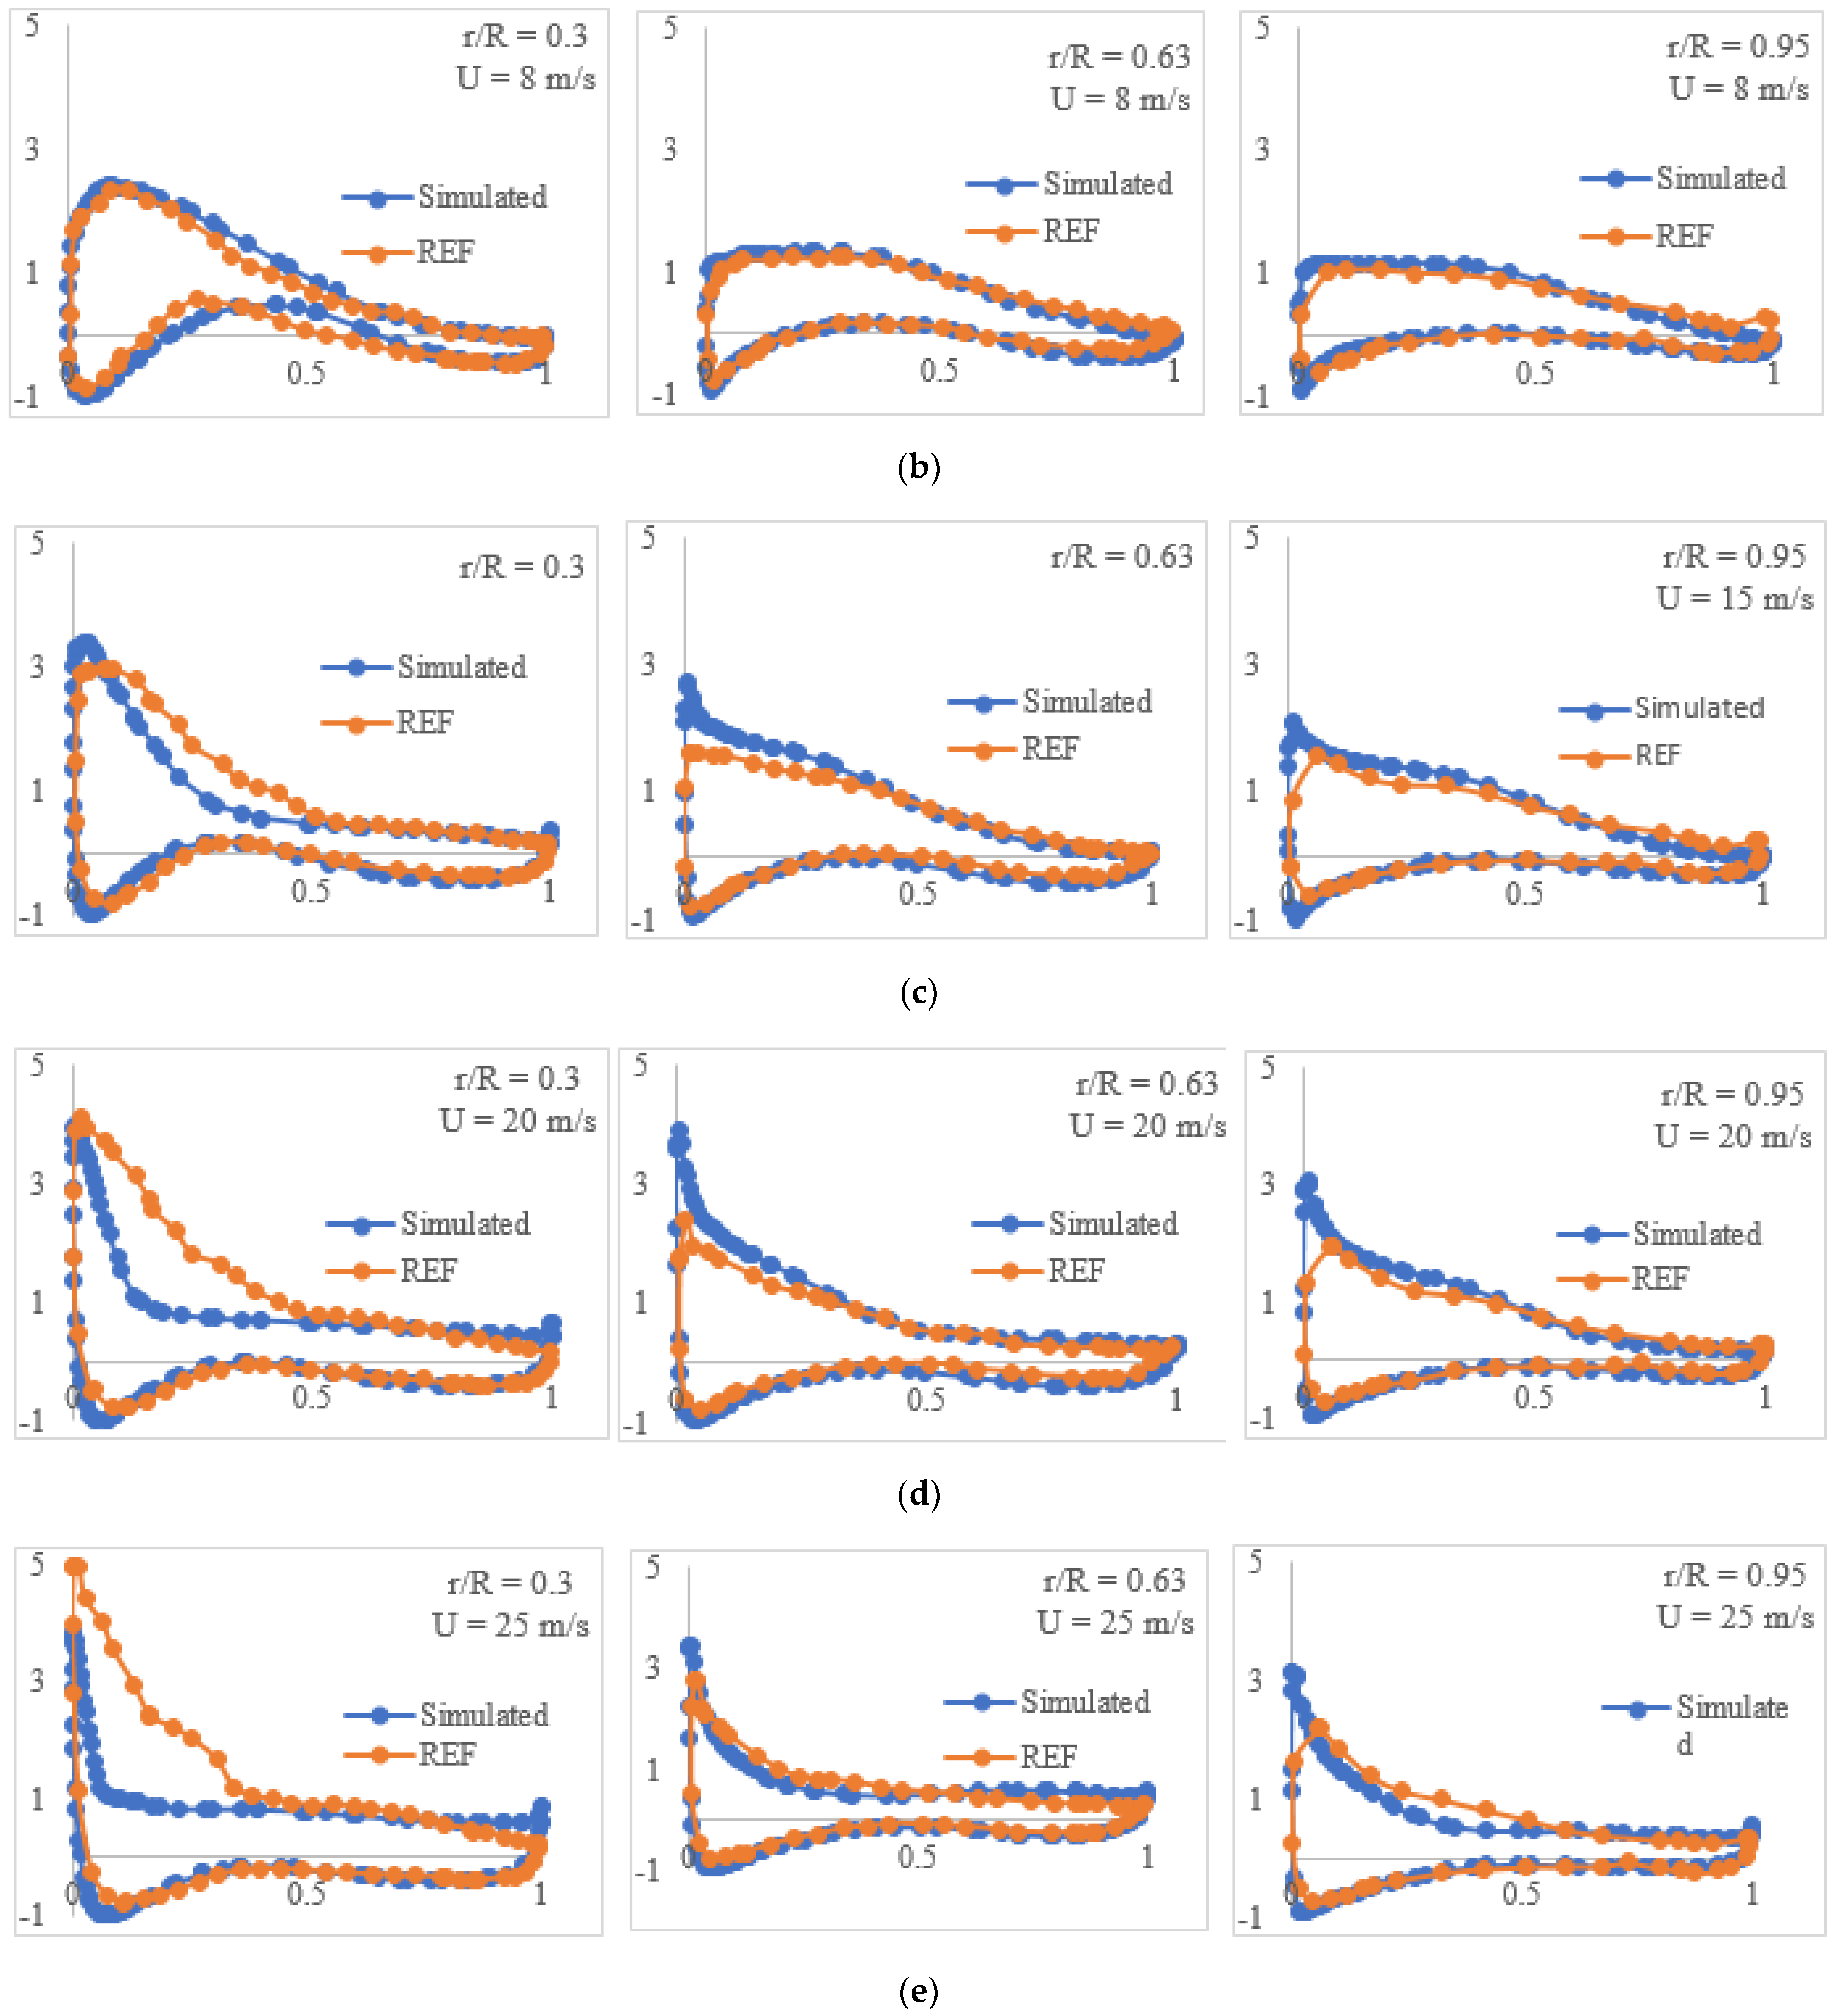
The pressure coefficient distribution of the selected airfoils, DU 35, DU 21, and NACA 64 under different inlet wind speeds is shown in
Figure 12. The simulated pressure coefficient shows great consistency with the reference data, especially when the inlet wind velocity is low. As the inlet wind speed increases, it can be seen that the pressure coefficient at the same location increases. For case 1, at location r/R is 0.3, the largest pressure coefficient is around 2, but for case 8, the largest pressure coefficient is nearly equal to 4 at the same location, which is almost double the value for that at case 2. In addition, the difference of pressure coefficient increases from the root of the blade to the tip of the blade. A larger inlet velocity also leads to a more evident curvature of the pressure coefficient profile, especially when the inlet wind speed is greater than the rated value, which indicates more that structural strength design needs to be considered.
3.8. Torque and Thrust
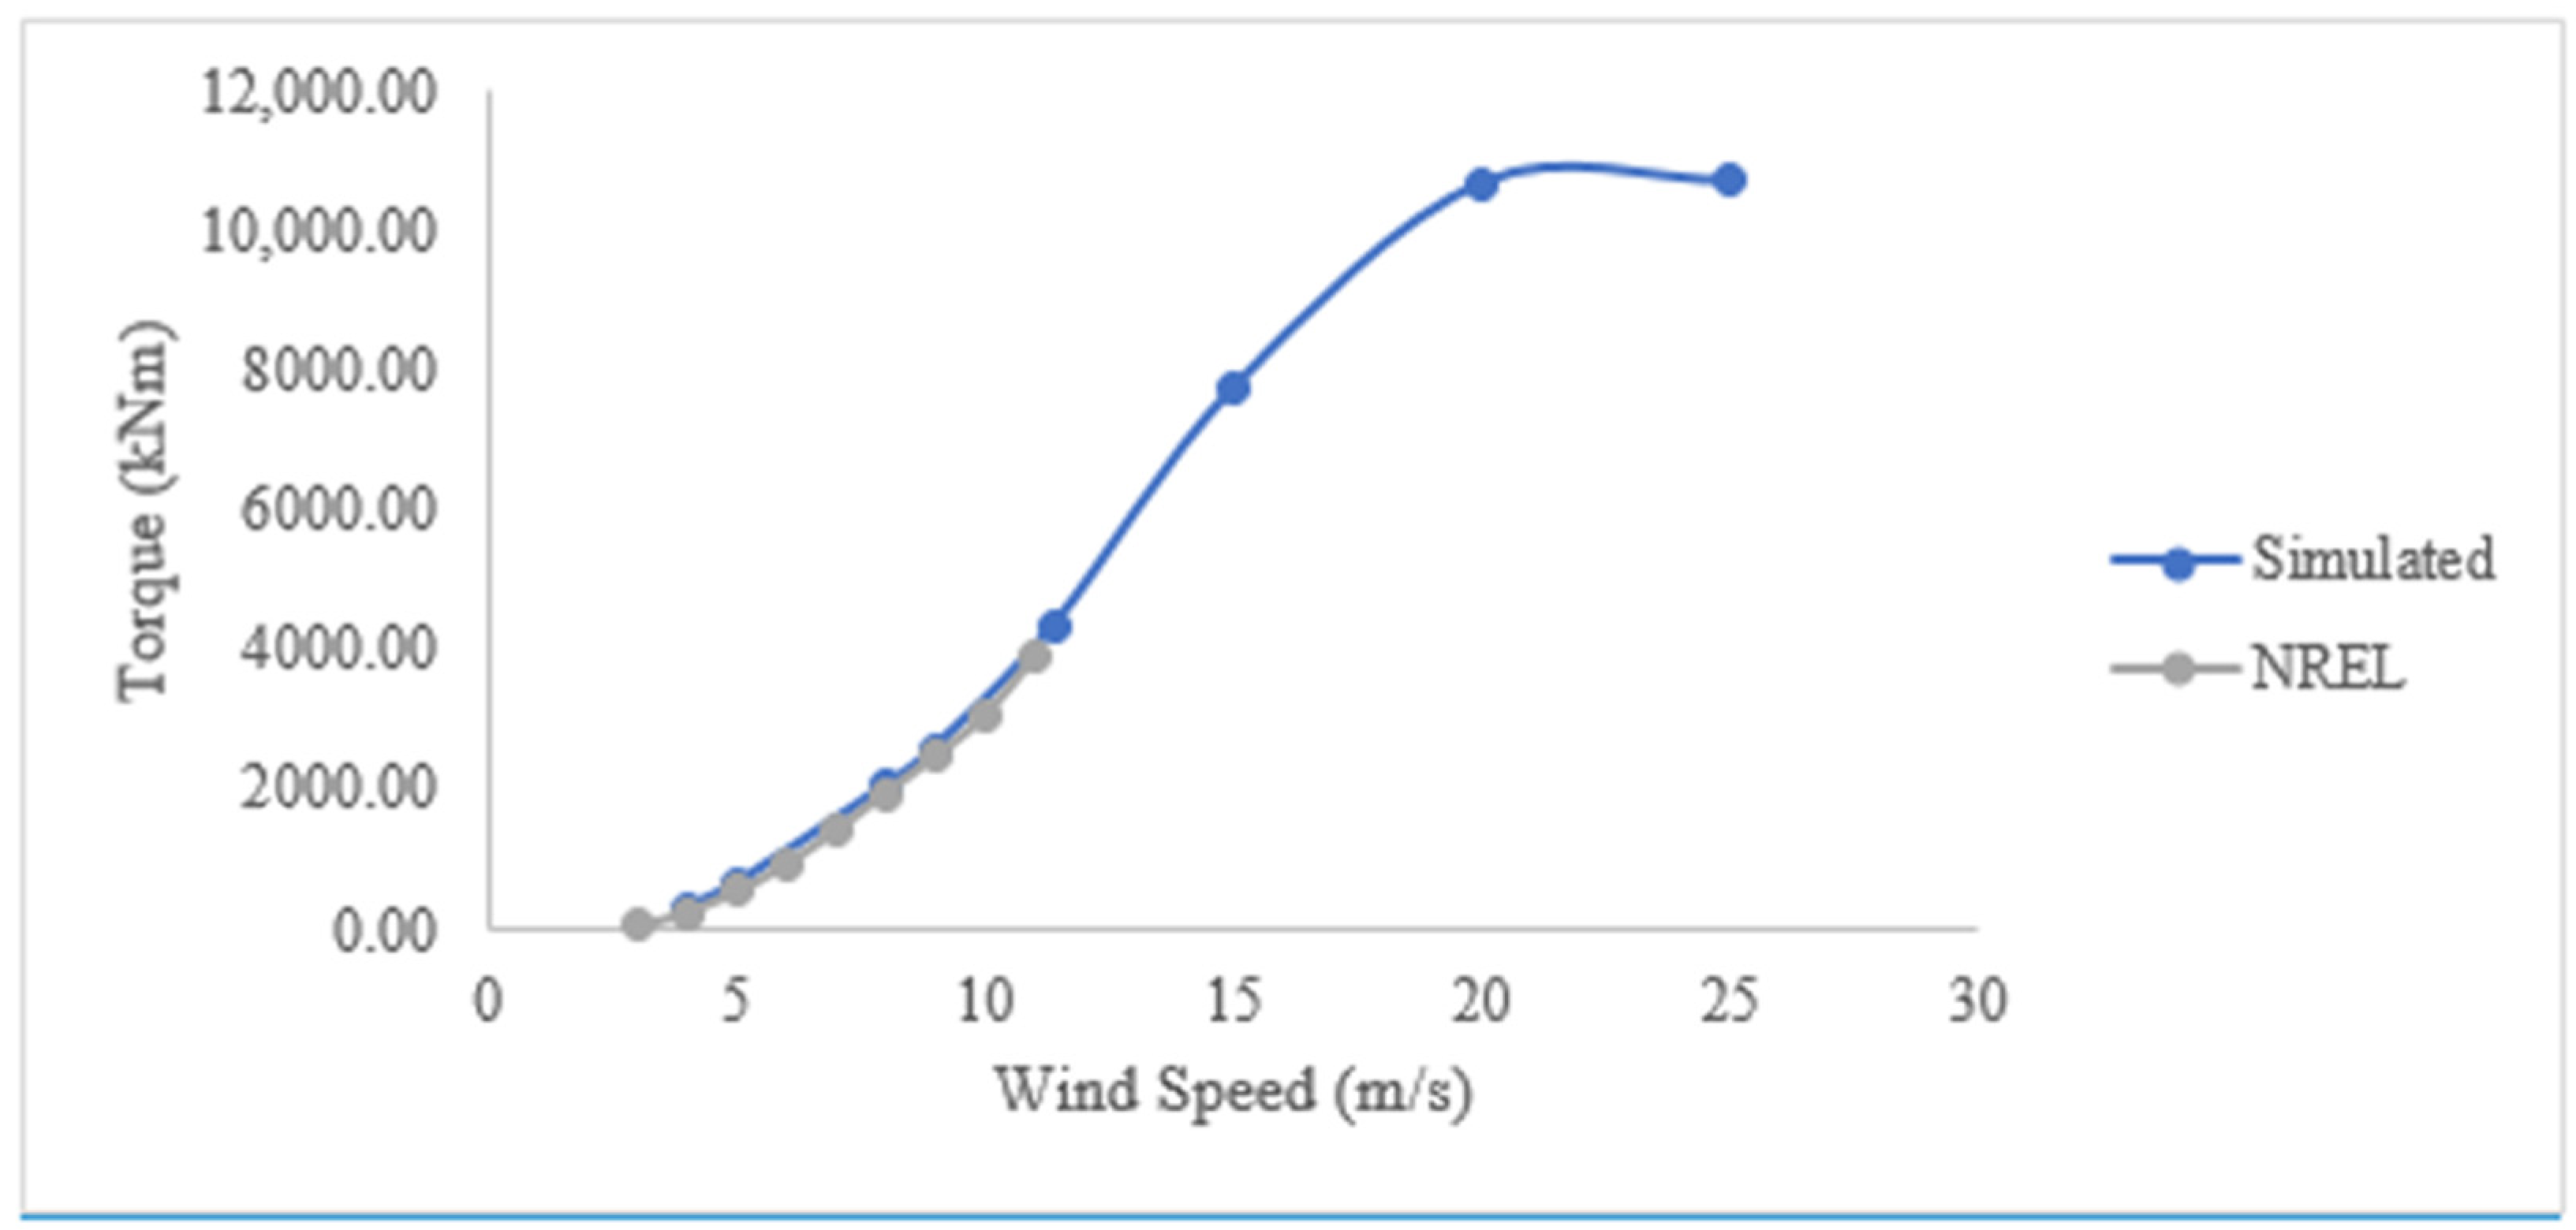
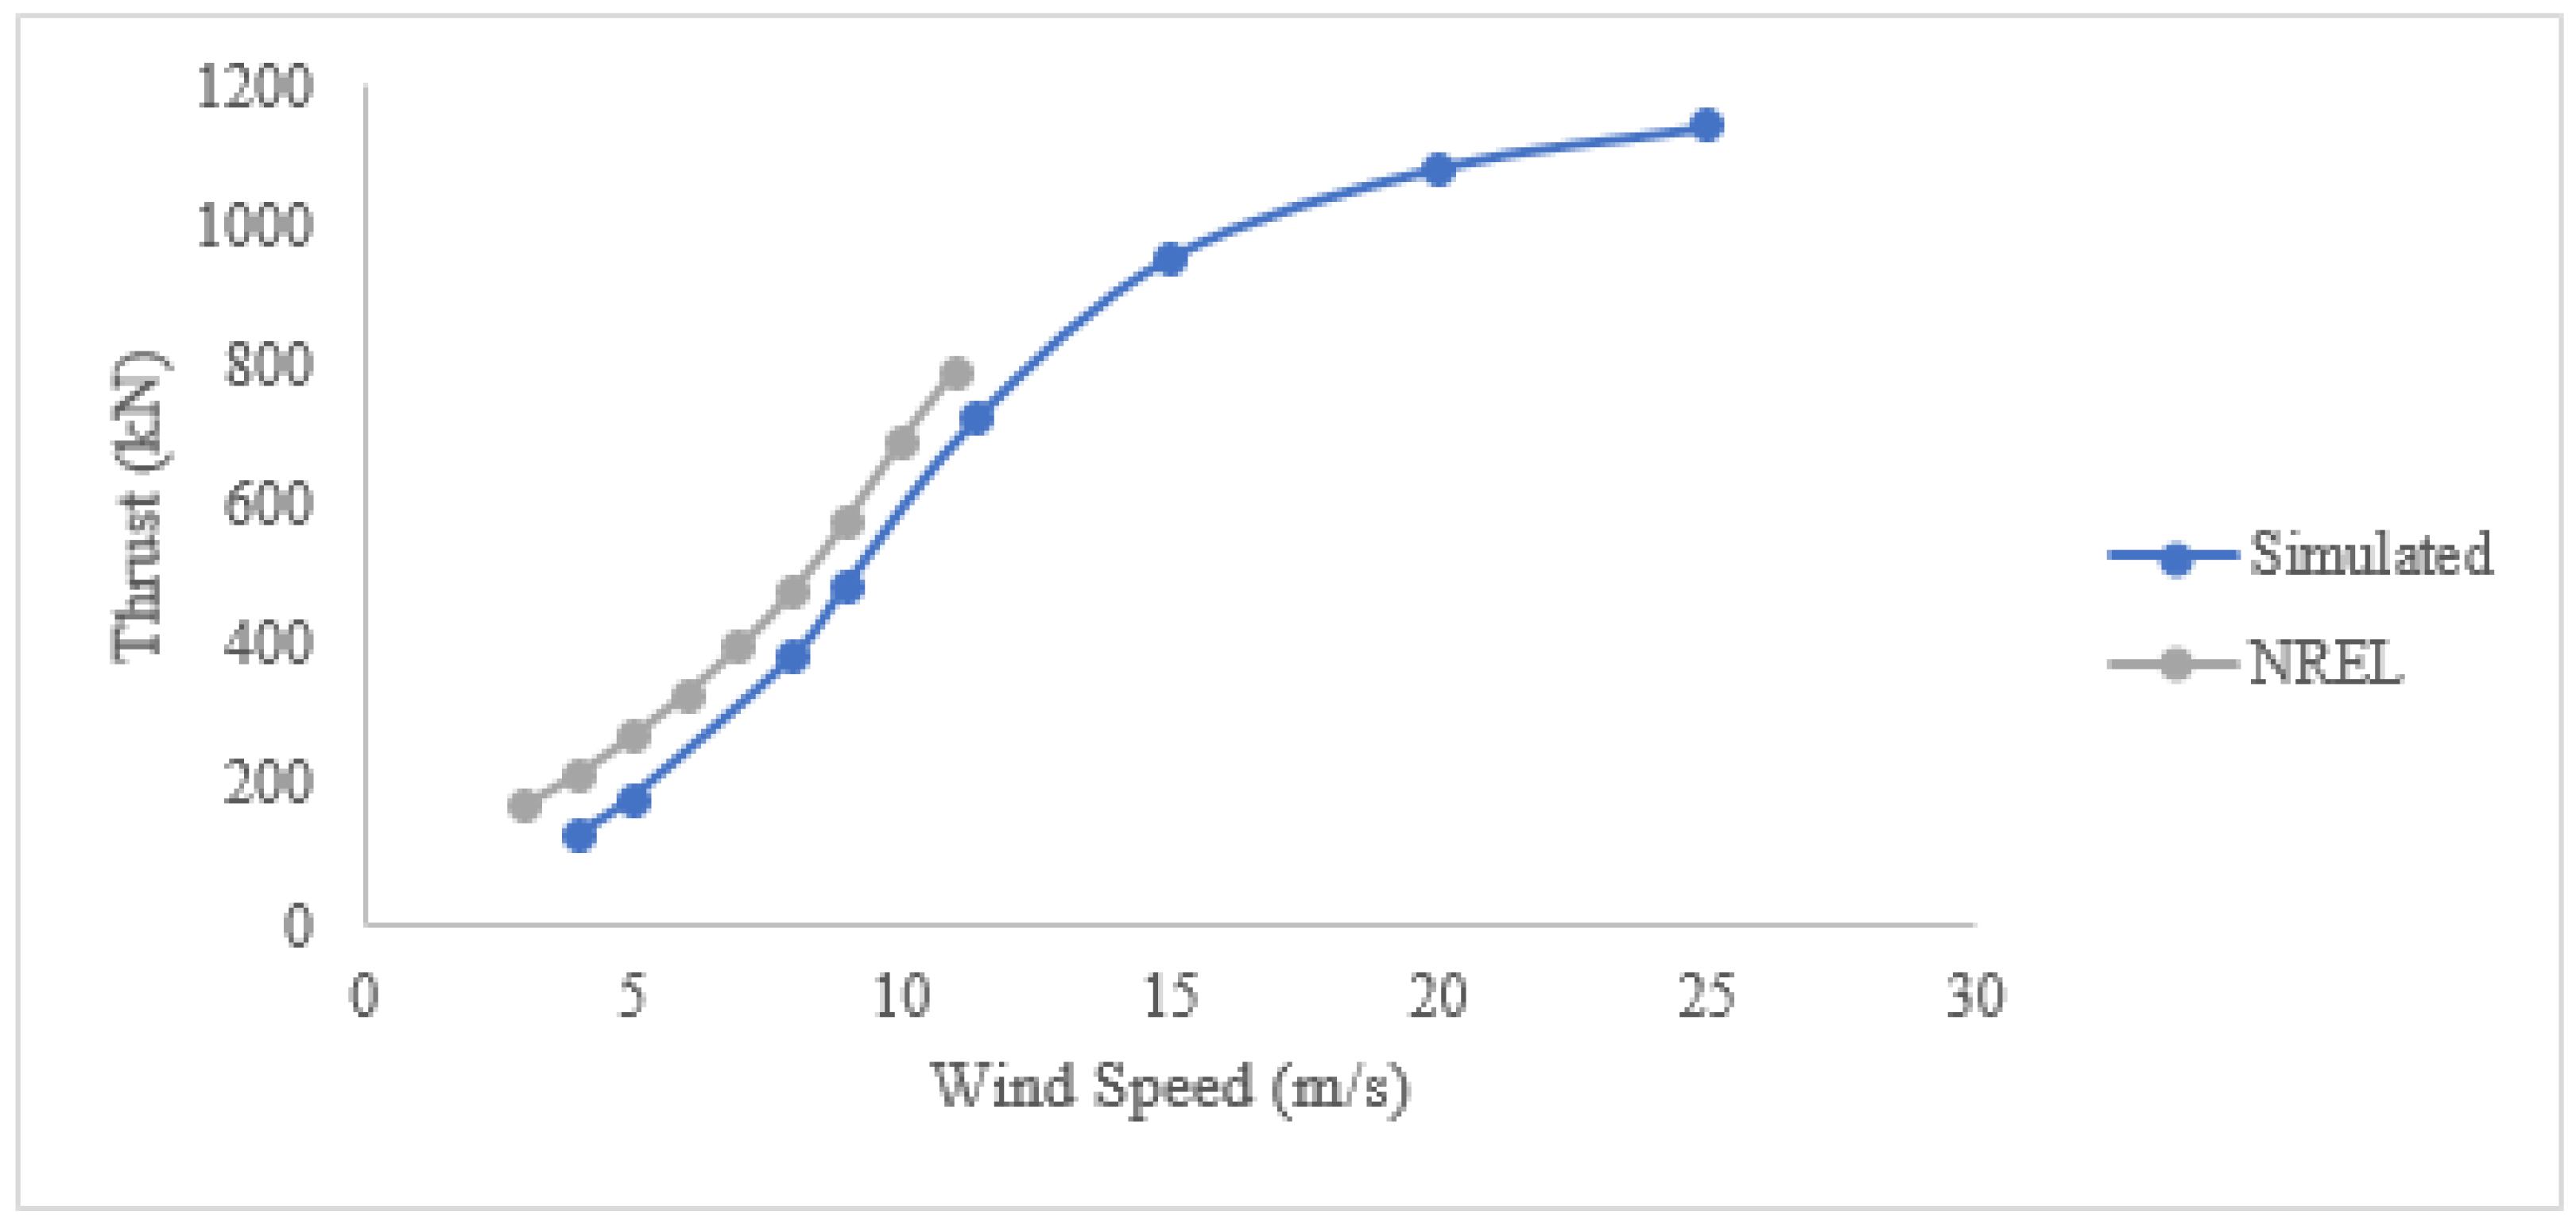
The torque and thrust under different inflow conditions were analyzed. As mentioned, 11.4 m/s is the rated wind velocity. When the inlet wind velocity is smaller than the rated wind speed, the rotation speed rises as the wind speed increases. When the inlet wind velocity exceeds 11.4 m/s, the rotation speed remains the same even if the wind speed keeps increasing. It is obvious that when the inlet wind velocity increases, the corresponding torque and thrust increase as well.
With the increase in wind velocity, the thrust increases gradually, but the torque increases dramatically.
Figure 13 shows the variation of torque as a function of the inlet wind speed. When the wind speed is smaller than the rated wind velocity, the curve from the simulation results shows great consistency with the NREL results [
9]. When the inlet wind velocity exceeds 11.4 m/s, there is not enough information from NREL results.
Figure 14 shows the variation of thrust with wind speed. A similar trend was observed compared with available NREL data.
3.9. Power Coefficient and Tip Speed Ratio
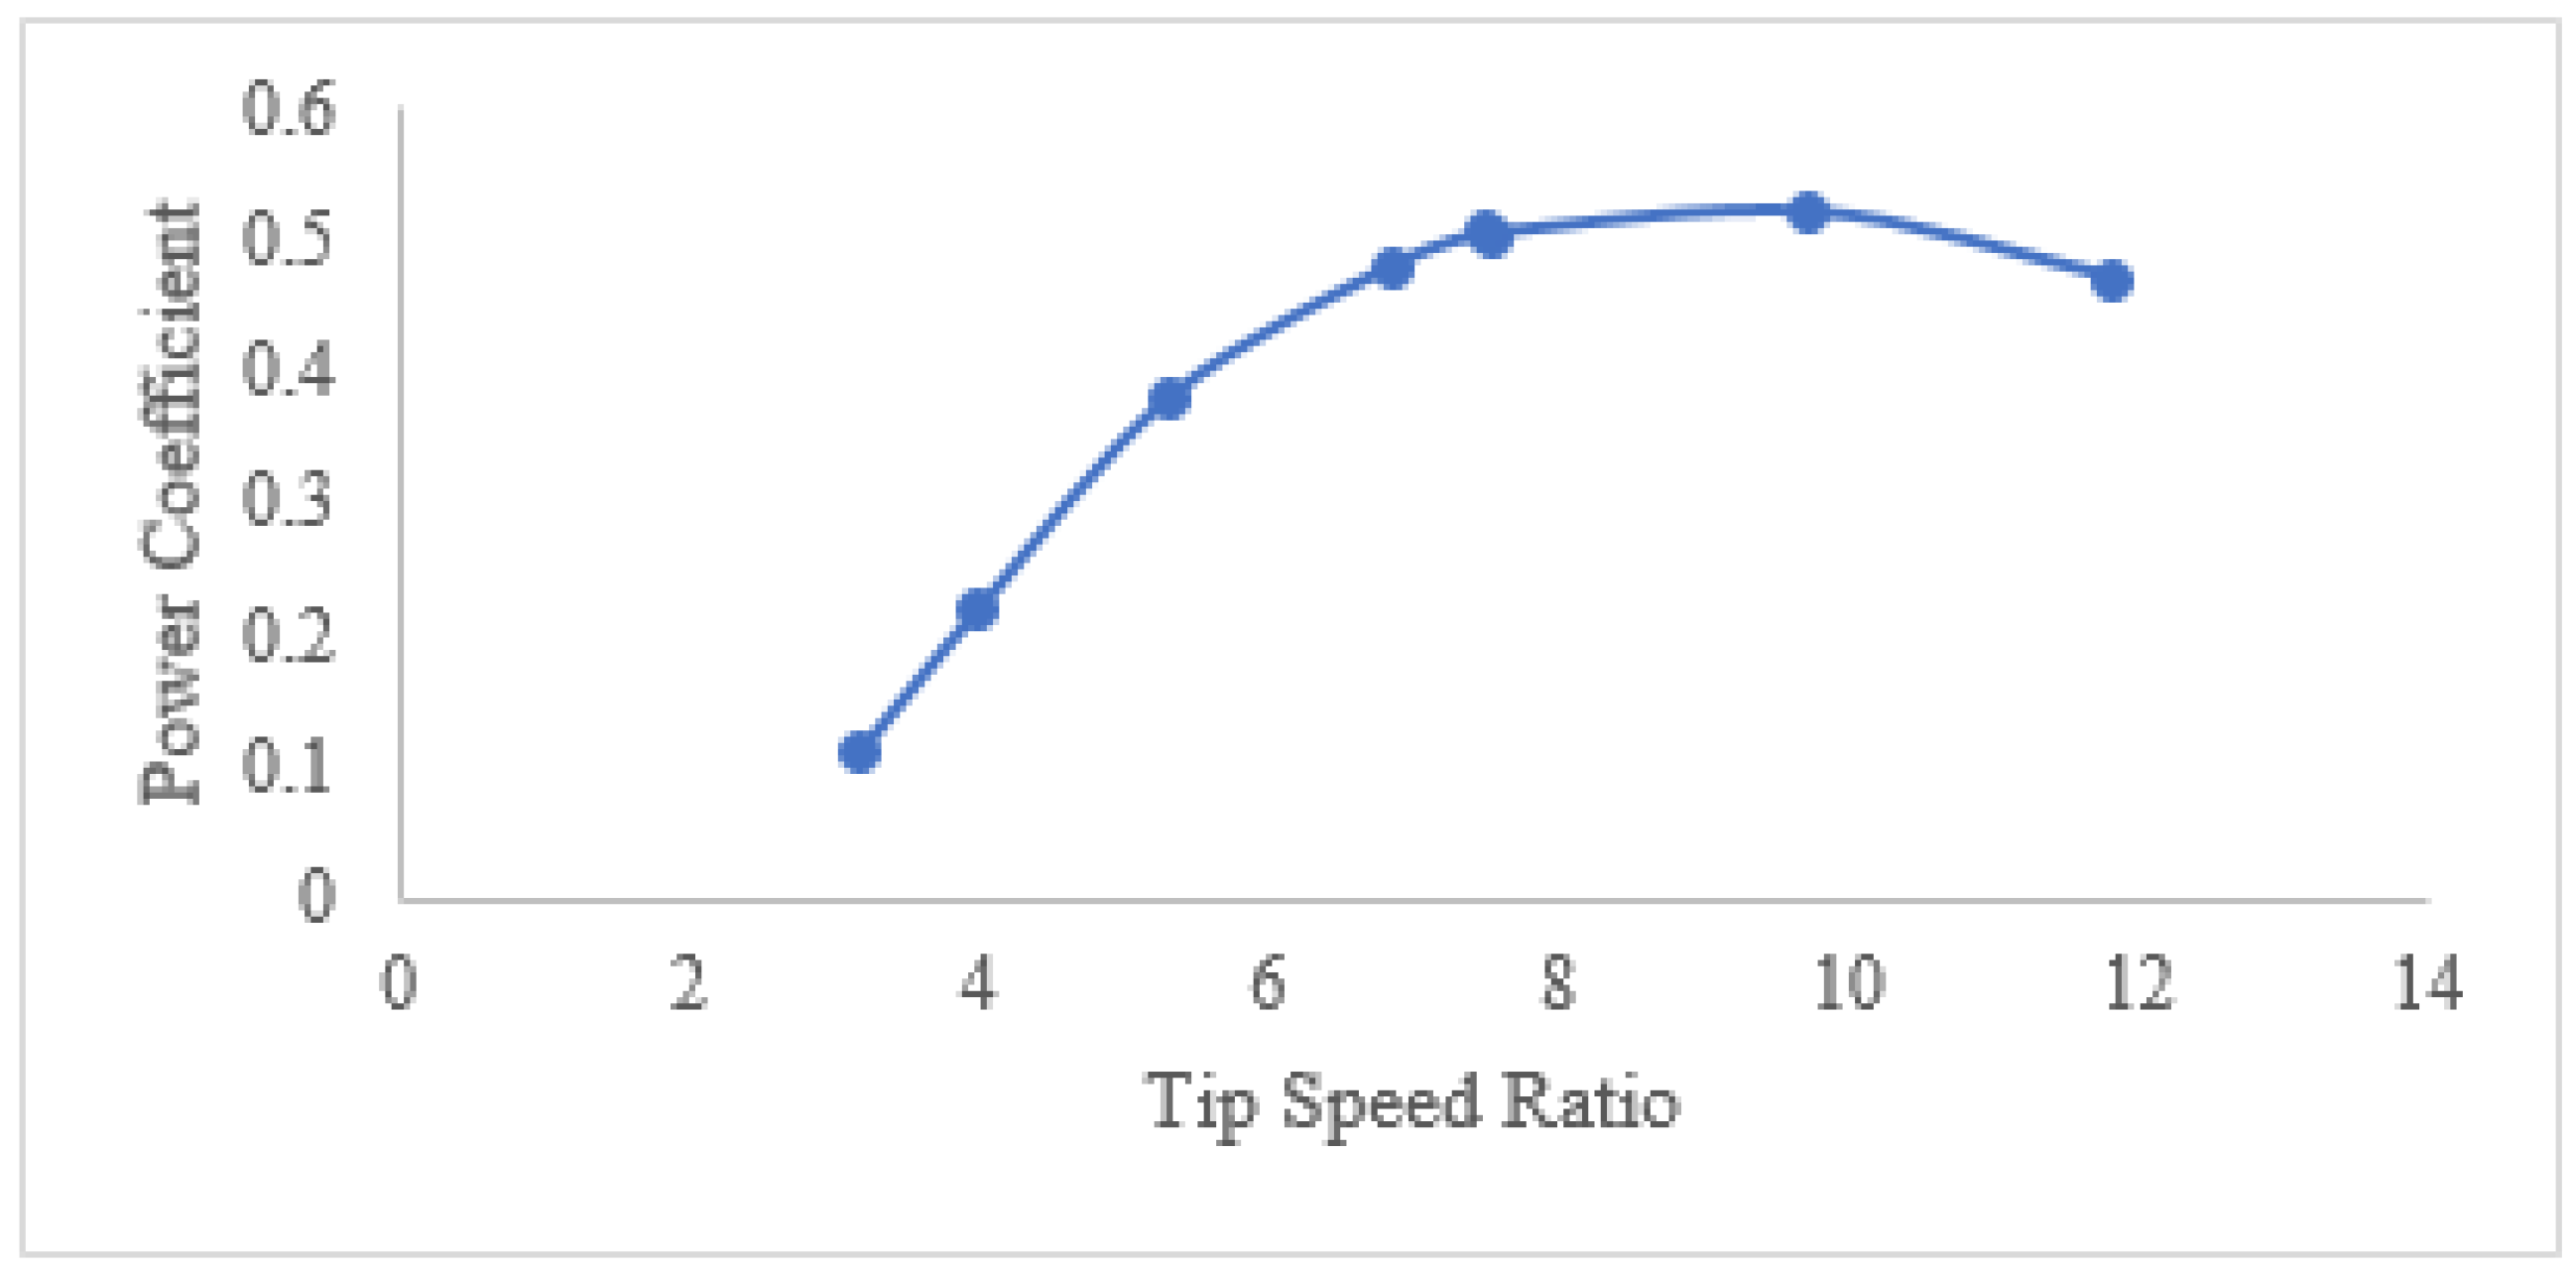
Power coefficient is directly affected by the wind turbine tip speed ratio. If a turbine rotates very fast, the turbine blades will function like a solid wall, which may block most of the wind blowing on it and reduce the power extraction; on the other hand, if a turbine rotates very slow, most of the wind will pass through it with no or little disturbance, resulting in little power extraction from the turbine. Maximum power extraction can only be expected at the optimal tip speed ratio.
As shown in
Figure 15, as the wind speed increases, the tip speed ratio increases, the power coefficient has a strong tendency to increase. After the power coefficient reaches the peak, it goes down. In addition, when TSR is between 2 and 6, the power coefficient grows rapidly. While TSR is from 6 to 10, the rate of growth of the power coefficient slows down. With TSR in the range of 10 to 12, the power coefficient goes down. To conclude based on the current simulation results, the optimum tip speed ratio for the maximum coefficient of power is around 9.
4. Discussion
A comprehensive numerical investigation was conducted for the NREL 5-MW offshore wind turbine. The numerical simulation was first validated by comparing the torque with others’ work and good agreement was observed. The error between the simulated torque and data in the literature was calculated to be less than 5%. This small error reflects that the current setting and model are feasible.
Eight test cases were developed with different inlet wind speeds: four with inlet velocity lower than the rated wind speed; one with inlet velocity equal to the rated wind speed and the remaining three with inlet velocity above the rated wind speed. The relation between torque, thrust and wind speed was then obtained. The velocity profile at various selected locations under different wind speeds was presented. When the selected location is close in proximity to the turbine hub, the influence from the hub to the velocity profile is significant. As the selected location is gradually further away from the blade, the influence of the wind turbine hub on the velocity profiles decreases. The recovery process of the velocity is presented. After comparing the velocity profiles under different wind speeds, it can be concluded that with an increase in wind speed, the influence of the hub on the velocity profile reduces.
In addition to the near wake velocity profile, limiting streamline was presented. This indicated that the flow of the whole turbine blade was smooth except for near the root area when the wind speed inlet was low. As the wind speed gradually increased, the whole turbine blade increasingly became occupied by vortices. The wake of the vortices which perform helically, intensely, and symmetrically were visualized. It was also concluded that with the growth of inlet wind velocity, the helical vortices could persist over a longer downstream distance.
Further, the pressure distribution along the blade was visualized and the pressure coefficient at cross sections of 0.3, 0.63, and 0.95 under different wind speeds were obtained. The results indicate that a larger inlet velocity led to a more evident curvature of the pressure coefficient profile. This was especially true when the inlet wind speed was greater than the rated wind velocity, which indicates that structure strength design needs to be considered further. At the end, the relation between the power coefficient and TSR were investigated. When the wind speed increased, the power coefficient increased until it reached a peak: the optimal tip speed ratio was around 9.
In conclusion, a comprehensive aerodynamic analysis of the NREL 5-MW wind turbine under various uniform inflow conditions was conducted. The variation of velocity profiles, pressure, pressure coefficient, limiting streamline, near wake flow feature, wind turbine torque, thrust and power coefficient were analyzed. The detailed wind turbine aerodynamic analysis results are expected to provide valuable input to wind turbine design and help to improve the effectiveness of harnessing wind energy. Current results are limited to uniform inflow condition; further research will be conducted by considering different inflow conditions (such as linear wind shear and linear wind shear with turbulence) effects on the wind turbine aerodynamic characteristics along with floating wind turbine settings.


