Article

Dietary Ammonium Hydroxide Enhancement Modulates Renal Inflammatory and Apoptotic Signaling and Mitochondrial-Associated Pathways in High-Fat-Fed C3H/HeJ Mice


Department of Biological Sciences, Texas Tech University, 2500 Broadway, Lubbock, TX 79409, USA
*
Author to whom correspondence should be addressed.
Dietetics 2026, 5(4), 54; https://doi.org/10.3390/dietetics5040054
Submission received: 20 July 2026 / Revised: 20 August 2026 / Accepted: 26 August 2026 / Published: 1 September 2026
(This article belongs to the Topic Nutrition, Obesity and Metabolic Diseases)

Abstract

Diet-induced obesity contributes to chronic inflammation, mitochondrial dysfunction, and progressive kidney injury, while increased dietary acid load may further impair renal homeostasis. In our previous studies, we showed that ammonium hydroxide enhancement (AHE) of dietary protein, prior to incorporation into the complete diet, increases dietary alkalinity and has improved longevity, decreased secretion of adipocytokines, and beneficially affected the microbiome in high-fat diet fed C3H/HeJ mice. However, its effects on renal molecular and structural responses remain unknown. In this study, kidney tissues from male C3H/HeJ mice fed control casein (CC), ammonium hydroxide-enhanced casein (CCN), high-fat casein (HFC), ammonium hydroxide-enhanced high-fat casein (HFCN), high-fat beef (HFB), or ammonium hydroxide-enhanced high-fat beef (HFBN) diets were analyzed using quantitative PCR, Western blotting, and histological morphometry. Results showed that AHE reduced renal inflammatory signaling, evidenced by decreased TLR4, TNFα, Il1-β, IL6, and NFκB expression. Apoptosis-associated signaling was attenuated through reduced Caspase-3 and p53 expressions and increased BCL2 levels. AHE also modulated mitochondrial-associated markers. Increased markers of mitochondrial biogenesis and fusion, and decreased fission-associated markers were observed, along with increased PINK1 expression, while Parkin remained unchanged. In addition, expression levels of the ammonia transporters, RHBG and RHCG, were elevated, indicating altered renal ammonia transporter expression. Histological and morphometric analyses demonstrated AHE-associated changes in tubular areas, while glomerular and Bowman’s capsule areas remained largely unchanged. Collectively, these findings suggest that long-term dietary AHE is associated with alterations in renal inflammatory and apoptotic signaling, mitochondrial-associated pathways, ammonia transporter expression, and renal histomorphometry in male C3H/HeJ mice.

1. Introduction

The prevalence of obesity and metabolic disorders has increased dramatically worldwide, largely driven by the consumption of energy-dense diets rich in fat and animal-derived proteins [1,2]. High-fat diets have been associated with numerous adverse health outcomes, including insulin resistance, chronic low-grade inflammation, cardiovascular disease, and organ dysfunction [3,4,5]. Among the organs affected by dietary excess, the kidney is particularly vulnerable because of its central role in maintaining metabolic homeostasis, electrolyte balance, waste elimination, and acid–base regulation [6,7,8]. Chronic exposure to high-fat and high-protein diets has been linked to renal inflammation, oxidative stress, tubular injury, and progressive deterioration of kidney function [9,10].
Emerging evidence suggests that dietary acid load is an important contributor to renal pathology [11]. Western-style diets, characterized by high consumption of animal proteins and low intake of fruits and vegetables, generate substantial quantities of nonvolatile acids that must be buffered and excreted by the kidneys. Persistent acid retention increases renal ammoniagenesis and places a significant metabolic burden on renal tubular cells, which may promote inflammation, oxidative stress, and structural injury [12]. Epidemiological and experimental studies have demonstrated associations between elevated dietary acid load and chronic kidney disease progression, renal fibrosis, impaired metabolic function, and systemic inflammation [13]. Consequently, strategies aimed at reducing dietary acid burden have attracted increasing attention as potential approaches to support kidney health [14].
Dietary protein is a major determinant of metabolic health, yet the influence of protein source on chronic disease development remains incompletely understood. Animal-derived proteins differ substantially in amino acid composition, digestibility, and net endogenous acid production. Until recently, the influence of dietary protein composition and its modification on the development and progression of chronic metabolic diseases had received limited attention. A series of studies from our laboratory demonstrated that modification of dietary proteins through ammonium hydroxide enhancement (AHE) improves multiple aspects of metabolic health, including reductions in fasting blood glucose, attenuation of obesity-associated metabolic dysfunction, alterations in the gut microbiome, and improvements in longevity and health span in C3H/HeJ mice [2,15,16,17,18,19,20]. These findings suggest that dietary protein modification can influence systemic metabolic homeostasis beyond its traditional nutritional role and provide a rationale for investigating its effects on renal health. Accumulating evidence suggests that chronic low-grade metabolic acidosis contributes to obesity-related pathologies through activation of inflammatory pathways, mitochondrial dysfunction, and cellular injury [13]. Accordingly, dietary alkalization strategies show potential as promising approaches to counteract the detrimental effects of acidogenic dietary patterns while preserving normal physiological function.
Ammonium hydroxide enhancement (AHE) is an FDA-approved food-processing approach used in the production of beef [21]. Previous long-term studies from our laboratory demonstrated that AHE of high-fat beef- and casein-based diets improved longevity and metabolic outcomes and beneficially remodeled the microbiota in C3H/HeJ mice in a sex- and dietary protein source-dependent manner [2,15,16,17,18,19,20]. In addition, subsequent liver-focused analyses showed that AHE modified hepatic metabolic signaling and inflammation-associated pathways, further suggesting that dietary protein alkalinization may influence systemic metabolism beyond body composition alone [15]. Because the liver and kidney are metabolically interconnected through nutrient handling, acid–base regulation, ammonia metabolism, and inflammatory signaling [22,23,24], these prior hepatic metabolic findings provided a rationale to investigate renal outcomes. Given the kidney’s central role in acid–base homeostasis, ammonia transport, and mitochondrial-dependent energy metabolism [20,24,25,26], understanding the renal consequences of long-term dietary AHE represents an important next step in elucidating the tissue-specific responses associated with these favorable metabolic outcomes. Based on the prominent sex-dependent metabolic and hepatic responses, including substantial responses in males, observed in our previous studies [2,15], the present manuscript focuses on kidney tissues from male mice.
Chronic low-grade inflammation is a hallmark of obesity-associated kidney injury and contributes significantly to the progression of renal dysfunction [27,28]. Activation of Toll-like receptor 4 (TLR4) and its downstream nuclear factor-kappa B (NFκB) signaling pathway promotes the production of pro-inflammatory cytokines, including tumor necrosis factor alpha (TNFα) and interleukin-6 (IL6, IL1-β), which exacerbate oxidative stress, mitochondrial dysfunction, and apoptotic cell death [29,30]. Persistent activation of these inflammatory pathways has been implicated in the development of tubular injury and chronic kidney disease [31]. Therefore, therapeutic approaches capable of suppressing inflammatory signaling may provide protection against metabolic stress-induced renal injury [32].
Mitochondrial dysfunction has emerged as a central mechanism underlying obesity-associated kidney injury [33]. Renal tubular epithelial cells possess high energy demands and rely heavily on mitochondrial oxidative metabolism to maintain active transport processes and cellular homeostasis [25,26,34]. Excess nutrient exposure, lipid accumulation, and chronic inflammation can impair mitochondrial function, resulting in increased reactive oxygen species production, altered mitochondrial dynamics, defective mitophagy, and activation of apoptotic pathways [35,36]. Mitochondrial quality control is maintained through a coordinated balance of mitochondrial biogenesis, fusion, fission, and mitophagy. Disruption of these processes contributes to cellular dysfunction and has been implicated in the development and progression of chronic kidney disease [37,38]. Key regulators of mitochondrial homeostasis, including peroxisome proliferator-activated receptor gamma coactivator-1 alpha (PGC1α), mitochondrial transcription factor A (TFAM), mitofusin-2 (MFN2), optic atrophy protein 1 (OPA1), dynamin-related protein 1 (DRP1), mitochondrial fission protein 1 (FIS1), PTEN-induced kinase 1 (PINK1), and Parkin play important roles in these processes [25,34,35,39]. Therefore, interventions capable of improving mitochondrial quality control may provide protection against diet-induced kidney injury.
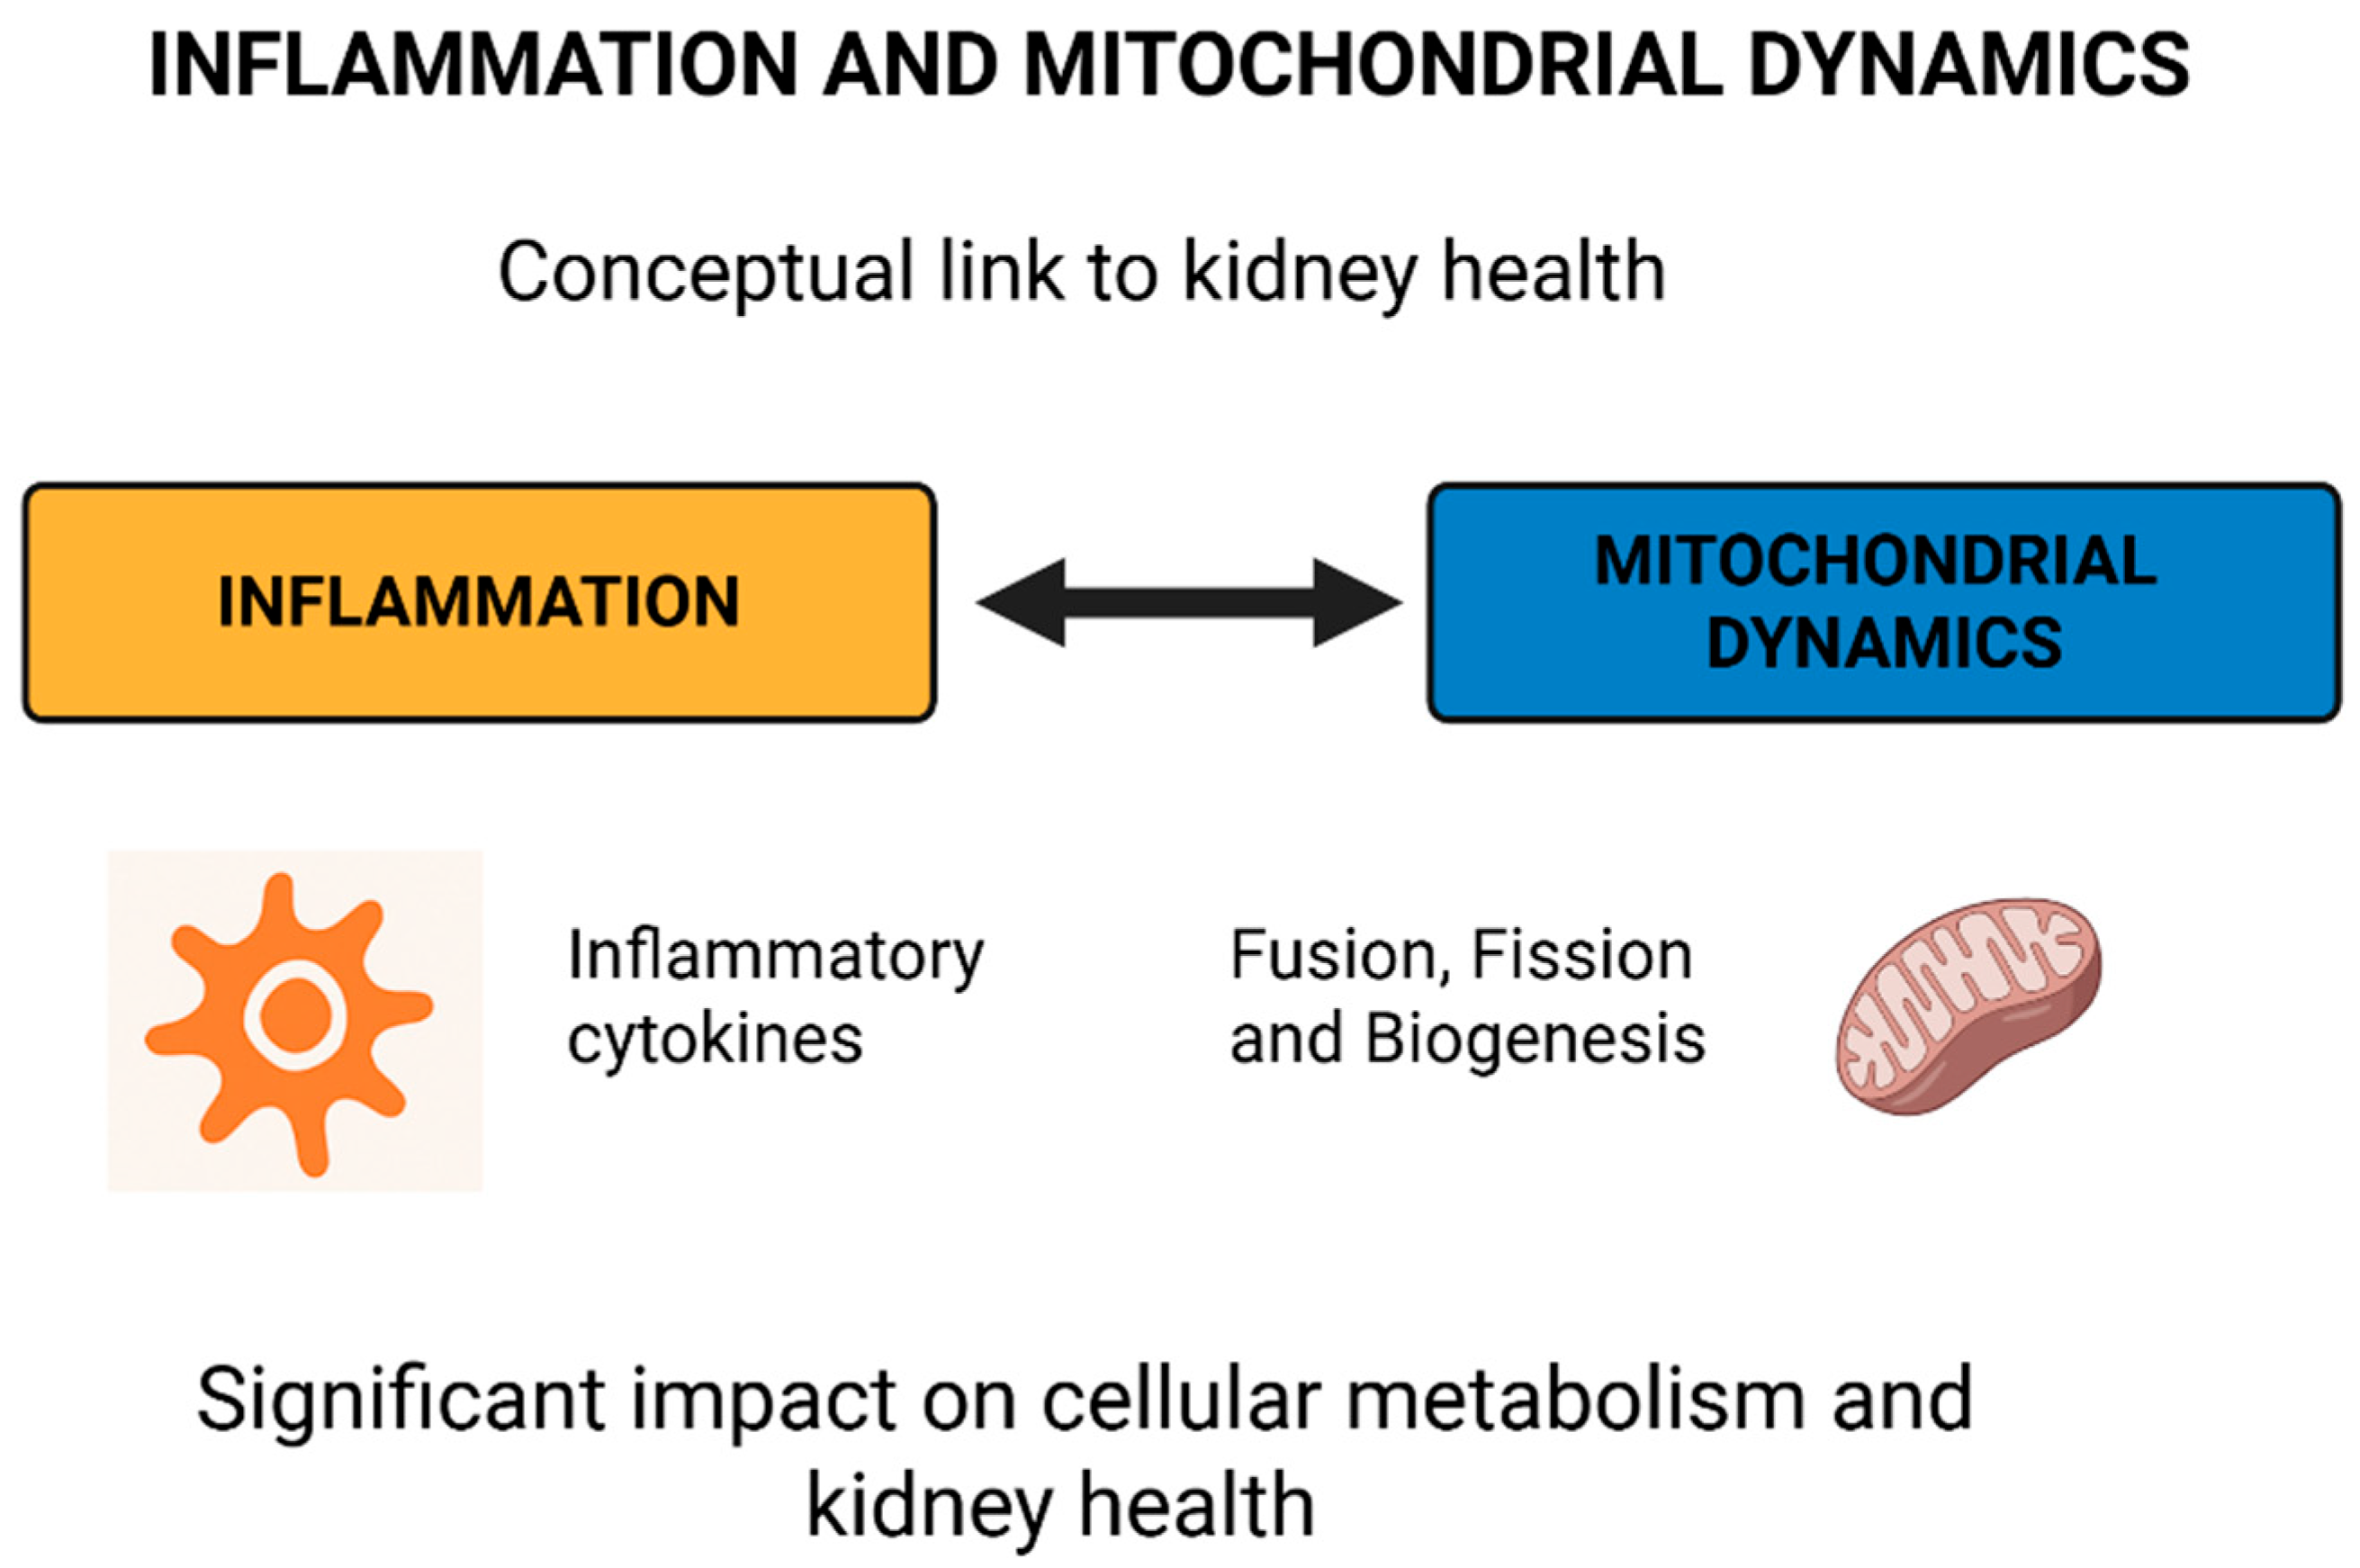
Chronic inflammation and mitochondrial dysfunction are closely interconnected processes that contribute to renal cellular stress and progressive kidney injury [25,26,34,40]. Inflammatory cytokines can impair mitochondrial function, while mitochondrial damage may further amplify inflammatory signaling and damage-associated molecular pathways [41]. Because the kidney has high metabolic demand, maintenance of mitochondrial biogenesis, fusion, and fission is essential for preserving renal cellular metabolism and kidney health [25,26,34]. Therefore, the inflammation–mitochondrial dynamics axis represents an important framework for understanding diet-associated renal stress and the potential renal responses associated with ammonium hydroxide enhancement [42]. This relationship is summarized in Figure 1.
In addition to mitochondrial homeostasis, maintenance of renal ammonia handling is essential for maintaining acid–base balance and preventing tubular injury. The ammonia transporters Rh B glycoprotein (RHBG) and Rh C glycoprotein (RHCG) are critical mediators of renal ammonium transport and urinary acid excretion [43]. Alterations in these transport systems have been associated with impaired acid–base regulation and renal dysfunction [44]. Therefore, changes in ammonia transporter expression may provide insight into renal responses to dietary interventions during chronic metabolic stress [45].
Accordingly, the objective of the present study was to characterize the renal effects of long-term ammonium hydroxide enhancement in mice maintained on high-fat beef- or casein-based diets. We hypothesized that dietary ammonium hydroxide enhancement would be associated with reduced inflammatory and apoptotic signaling, favorable changes in mitochondrial-associated markers, increased ammonia transporter expression, and alterations in renal morphology during prolonged exposure to high-fat diets. To test this hypothesis, we evaluated kidney morphology together with markers of inflammation (TLR4, TNFα, IL6, and NFκB), apoptosis (Caspase-3, p53, and BCL2), mitochondrial biogenesis and dynamics (PGC1α, TFAM, MFN2, OPA1, DRP1, and FIS1), mitophagy (PINK1 and Parkin), and ammonia transport expression (RHBG and RHCG).

2. Materials and Methods

2.1. Animal Study and Experimental Diets

Animal procedures were approved by the Texas Tech University Institutional Animal Care and Use Committee (IACUC protocol #19021-02, Approval date: 12 February 2019) and conducted in accordance with institutional and federal guidelines for the care and use of laboratory animals. The animal study design has been previously described in detail [2,46].
Briefly, C3H/HeJ mice were obtained from Jackson Laboratories (Bar Harbor, ME, USA) at 4 weeks of age and acclimated for one week before dietary intervention. For the present study, kidney tissues were analyzed from mice assigned to six dietary groups: two control casein groups, control casein (CC) and AHE-modified control casein (CCN), and four high-fat diet groups, high-fat casein (HFC), AHE-modified high-fat casein (HFCN), high-fat beef protein (HFB), and AHE-modified high-fat beef protein (HFBN). The high-fat casein and high-fat beef diets provided approximately 46% of total caloric intake from fat and were formulated by Research Diets, Inc. (New Brunswick, NJ, USA). Detailed diet compositions have been previously reported [2,46]. Animals were housed under controlled temperature and humidity conditions with a 12 h light/dark cycle and provided ad libitum access to food and water. Mice were maintained on their respective diets for 18 months. Body weights, food intake, and body composition measurements were monitored throughout the 18-month dietary intervention as previously described [2,46].
For the present investigation, kidney tissues collected at the terminal study endpoint were utilized to evaluate renal morphology, inflammatory signaling, apoptosis, mitochondrial-associated pathways, and ammonia transporter expression. Following euthanasia by CO2 inhalation and cervical dislocation, kidneys were excised, and either fixed in 10% neutral buffered formalin (StatLab Medical Products, McKinney, TX, USA) for histological analyses or snap-frozen in liquid nitrogen and stored at −80 °C for molecular analyses.

2.2. Quantitative Real-Time PCR (qRT-PCR)

Total RNA was extracted from frozen kidney tissue samples using RNAzol RT reagent (Cat. No. RN190; Molecular Research Center Inc., Cincinnati, OH, USA) following the manufacturer’s recommended protocol. RNA quantity and purity were determined with a NanoDrop One spectrophotometer (Thermo Scientific, Waltham, MA, USA). First-strand complementary DNA (cDNA) was generated from total RNA using the Maxima First Strand cDNA Synthesis Kit with dsDNase (Cat. No. K1671; Thermo Scientific, Waltham, MA, USA). Reverse transcription reactions were carried out using a C1000 Touch™ Thermal Cycler (Bio-Rad Laboratories, Hercules, CA, USA).
Gene expression analysis was performed by quantitative real-time PCR (qRT-PCR) using a CFX96 Touch™ Deep Well Real-Time PCR Detection System (Bio-Rad Laboratories, Hercules, CA, USA) together with PowerUp™ SYBR™ Green Master Mix (Applied Biosystems, Thermo Fisher Scientific, Waltham, MA, USA). Transcript levels of inflammatory genes (TLR4, NF-κB, TNFα, and IL-1β) and ammonia transporter genes (RHBG and RHCG) were measured using gene-specific primer pairs. β-Actin served as the internal reference gene for normalization (n = 3–6 animals/group, depending on sample availability). Relative mRNA expression was calculated using the comparative 2−ΔΔCt method and is presented as fold change relative to the corresponding control group [47]. The sequences of all primers used in this study are listed in Table 1.

2.3. Western Blot Analysis

Frozen kidney tissues were lysed in radioimmunoprecipitation assay (RIPA) buffer containing protease and phosphatase inhibitor cocktails. Tissue homogenization was performed on ice using a bead mill homogenizer, followed by centrifugation to remove cellular debris. The resulting supernatants were collected, and total protein concentrations were quantified using a bicinchoninic acid (BCA) protein assay kit (Cat. No. 23227; Thermo Scientific, Rockford, IL, USA).
For immunoblotting, 40 μg of total protein from each sample was denatured, resolved by sodium dodecyl sulfate-polyacrylamide gel electrophoresis (SDS-PAGE), and transferred to polyvinylidene difluoride (PVDF) membranes (Cat. No. 1704273; Bio-Rad Laboratories, Hercules, CA, USA) at 4 °C for 90 min. Membranes were then blocked with 5% bovine serum albumin (BSA) for 1 h at room temperature before incubation overnight at 4 °C with primary antibodies directed against inflammatory proteins (TLR4, NF-κB, TNFα, and IL-6), apoptosis-associated proteins (Caspase-3, p53, and BCL2), mitochondrial biogenesis and dynamics markers (PGC1α, TFAM, MFN2, OPA1, DRP1, and FIS1), mitophagy-related proteins (PINK1 and Parkin), and ammonia transporters (RHBG and RHCG). After washing, membranes were incubated with appropriate horseradish peroxidase (HRP)-conjugated secondary antibodies. Immunoreactive protein bands were detected using SuperSignal™ West Pico PLUS Chemiluminescent Substrate (Cat. No. 34580; Thermo Fisher Scientific, Waltham, MA, USA). Chemiluminescent signals were captured using an LI-COR Odyssey Fc Imaging System (Model 2800; LI-COR Biosciences, Lincoln, NE, USA). Image acquisition and initial processing were performed with Image Studio software (Version 4.0; LI-COR Biosciences, Lincoln, NE, USA). Protein band densities were quantified using ImageJ software (Version 1.54f; Wayne Rasband and contributors, National Institutes of Health, Bethesda, MD, USA). For each biological replicate, the intensity of the target protein band was normalized to the corresponding β-actin band intensity from the same sample, and the resulting target protein/β-actin ratios were used for quantitative and statistical analyses. Representative immunoblot images were presented, whereas densitometric analyses were conducted using all available biological samples (n = 3–4 animals/group, depending upon sample availability). Details of the primary antibodies, including their working dilutions, are summarized in Table 2.

2.4. Histological Analysis of Kidney Tissue

Kidney tissues were fixed in 10% neutral-buffered formalin (Cat. No. 232166; StatLab Medical Products, McKinney, TX, USA), processed using standard histological procedures, and embedded in paraffin with a Leica EG1160 tissue embedding station (Leica, Nussloch, Germany). Paraffin blocks were sectioned at a thickness of 5 µm using a Leica RM2025 rotary microtome (Leica Biosystems, Wetzlar, Germany), and tissue sections were mounted onto charged glass microscope slides (Cat. No. 1358W; Globe Scientific Inc., Mahwah, NJ, USA).
For histopathological examination, kidney sections were stained with hematoxylin and eosin (H&E) according to established protocols [37]. Briefly, paraffin-embedded sections were deparaffinized in xylene (Cat. No. 8400-1; Thermo Fisher Scientific, Waltham, MA, USA), rehydrated through a graded series of ethanol, stained with Mayer’s hematoxylin (Cat. No. 26043-05; Electron Microscopy Sciences, Hatfield, PA, USA), differentiated and blued, followed by counterstaining with eosin Y (Cat. No. 2850-32; Thermo Fisher Scientific, Waltham, MA, USA). Sections were subsequently dehydrated, cleared, and coverslipped for microscopic evaluation.
Quantitative morphometric analysis of kidney sections was performed using QuPath software (Version 0.7). Renal histological structures were manually identified and outlined using the polygon annotation tool based on established morphological criteria. Glomeruli were identified by their rounded morphology and capillary tufts enclosed within Bowman’s capsule, and Bowman’s space was defined as the clear space between the glomerular tuft and Bowman’s capsule. Proximal convoluted tubules were distinguished by their irregular lumens and prominent brush borders, whereas distal convoluted tubules were identified by their more regular profiles, clearer lumens, and absence of a prominent brush border. Multiple non-overlapping cortical fields were evaluated for each animal (n = 3–4 animals/group). The areas (µm2) of proximal tubules, distal tubules, glomeruli, and Bowman’s spaces were measured, and measurements from individual structures were averaged for each morphological parameter per animal. These animal-level averages were subsequently used for statistical analyses.

2.5. Statistical Analysis

Data are presented as mean ± SEM. Statistical analyses were performed using GraphPad Prism software (version 11.0.0 (84); GraphPad Software, San Diego, CA, USA). Differences among experimental groups were analyzed using ordinary one-way analysis of variance (ANOVA) followed by Fisher’s least significant difference (LSD) multiple comparisons test. A p-value ≤ 0.05 was considered statistically significant. Biological replicates ranged from n = 3–6 animals per group, depending on the assay, as indicated in the corresponding method sections.

3. Results

3.1. Dietary Ammonium Hydroxide Enhancement (AHE) Attenuates Renal Inflammatory Signaling

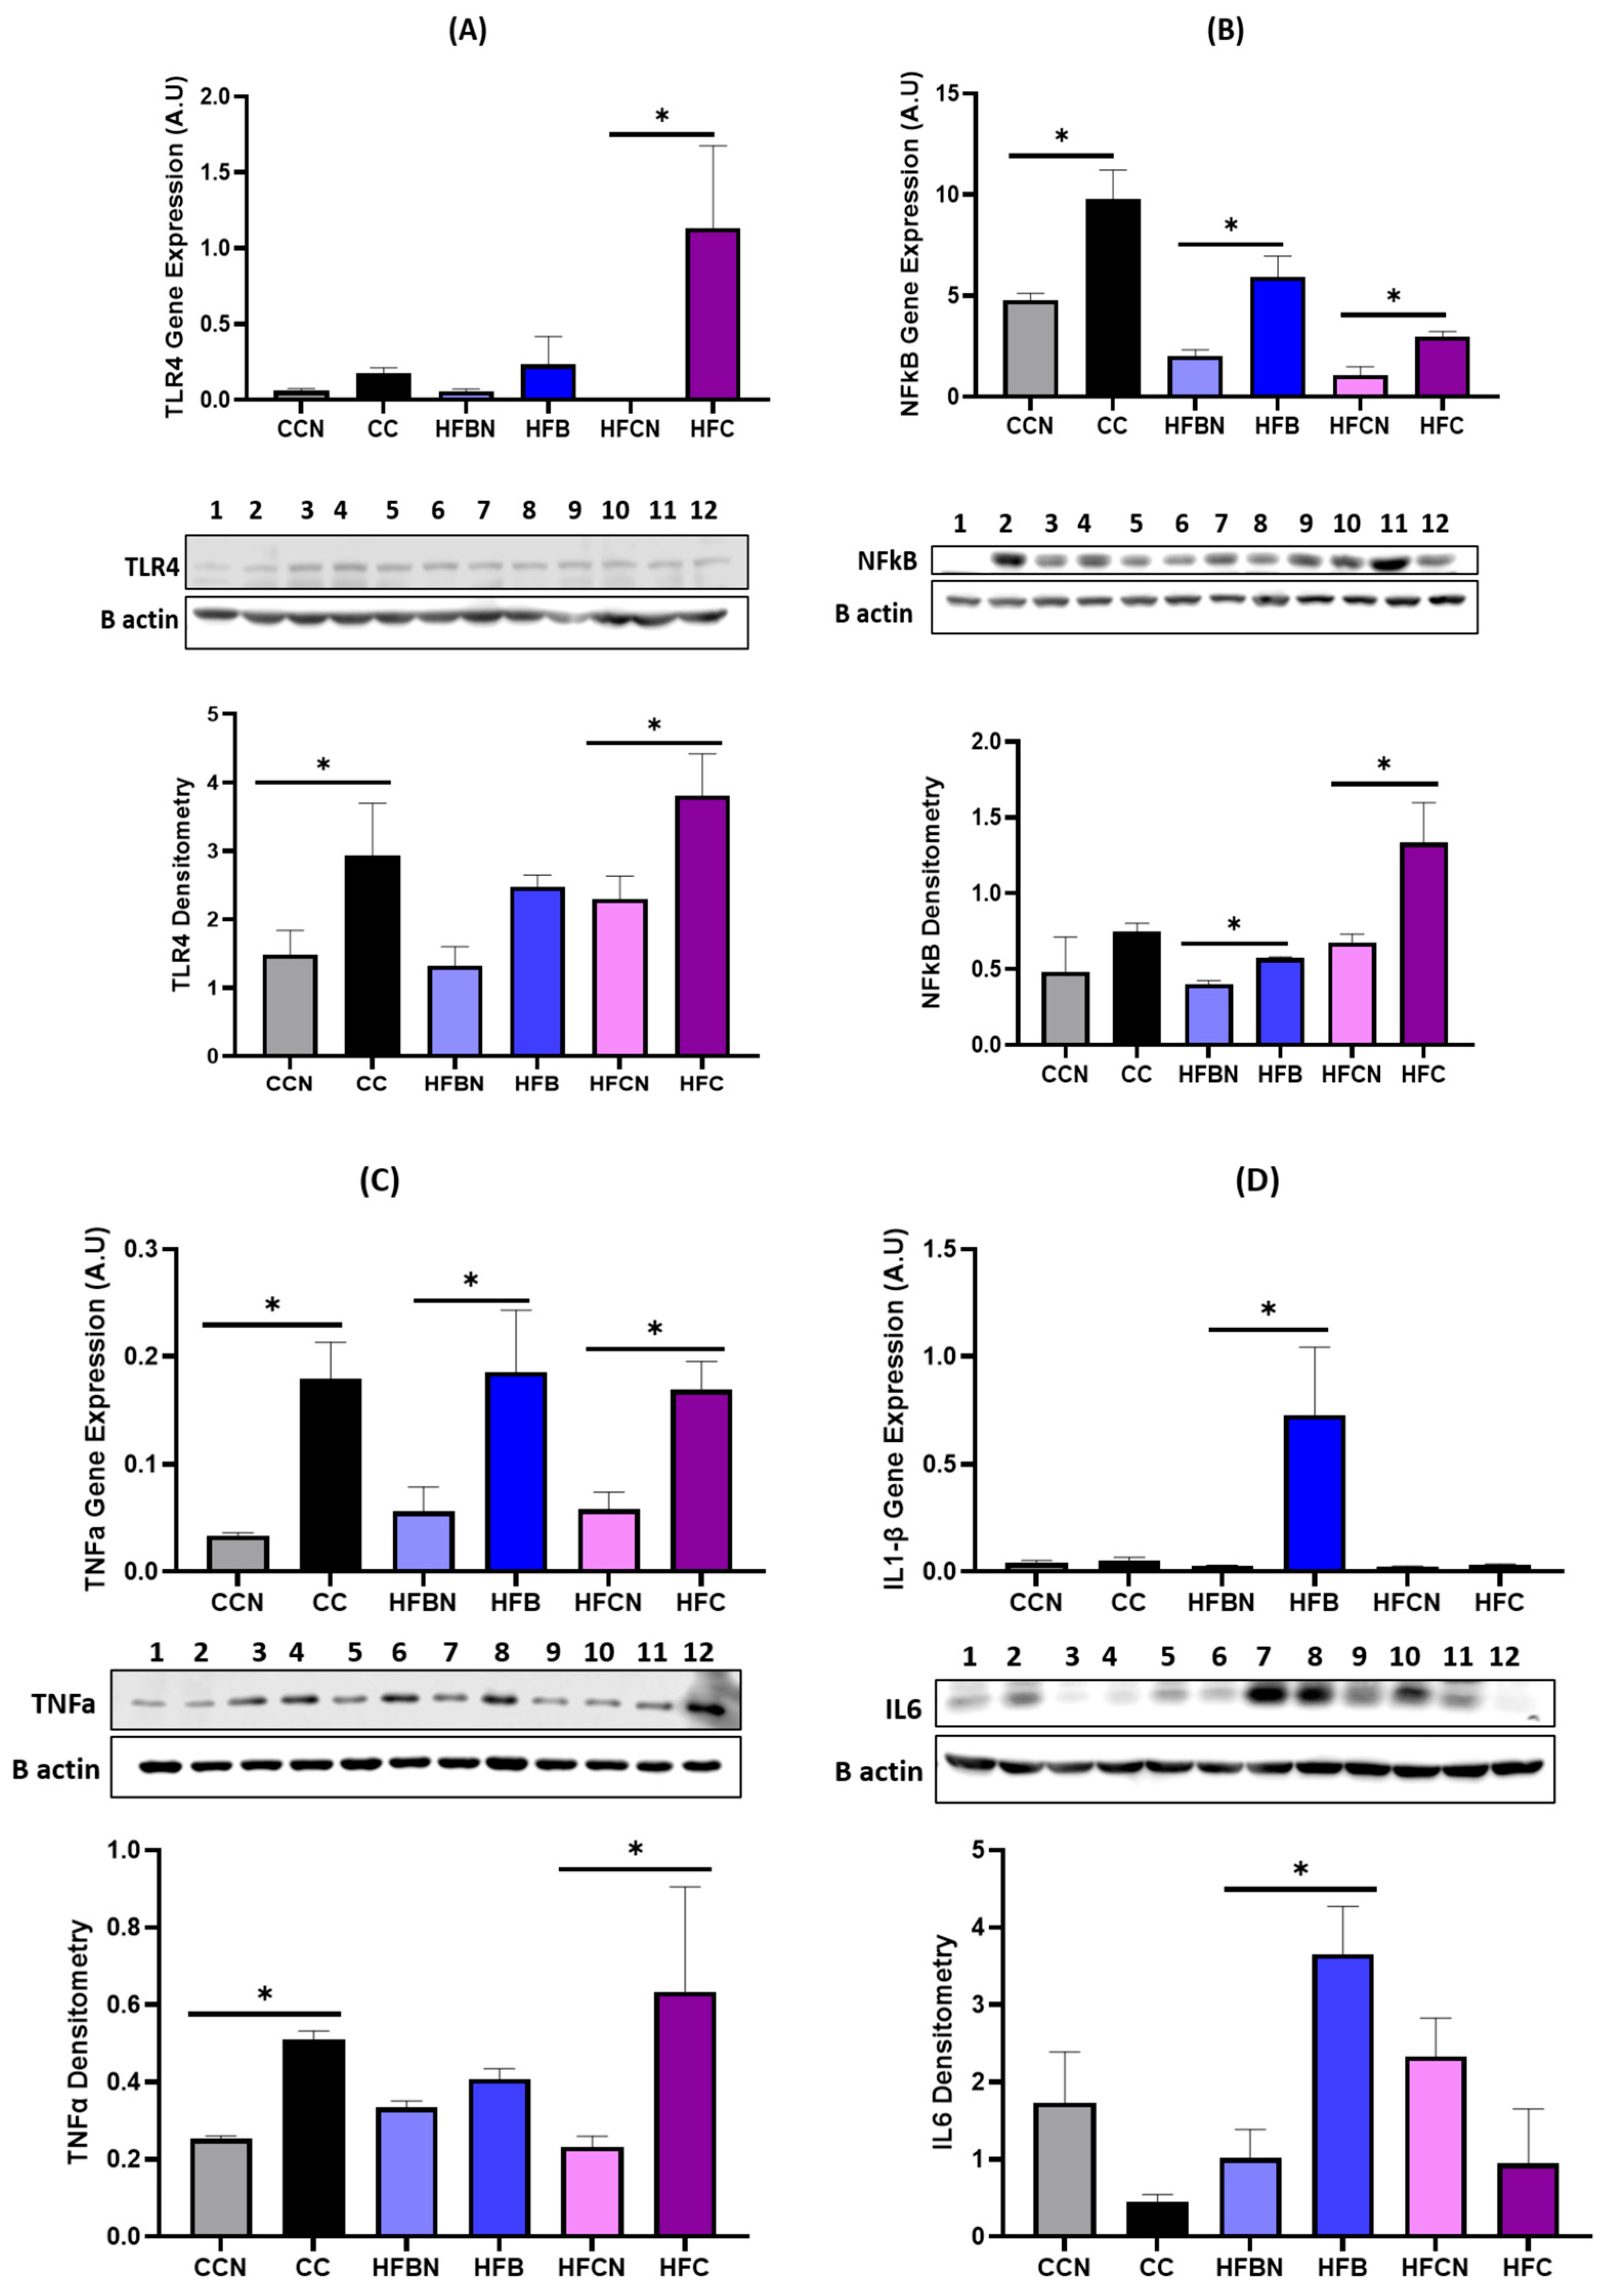
To determine whether dietary ammonium hydroxide enhancement (AHE) modulates renal inflammatory pathways, the expression of TLR4, NF-κB, TNFα, IL-1β and IL-6 was evaluated in kidney tissues by qPCR and Western blot analysis (Figure 2A–D). Overall, non-ammoniated high-fat diets were associated with increased renal inflammatory marker expression, whereas AHE-containing diets showed reduced inflammatory signaling. TLR4 expression was elevated in mice consuming non-ammoniated high-fat diets, particularly in the HFC group. AHE reduced TLR4 expression, with lower TLR4 mRNA and protein abundance observed in HFCN compared with HFC, and reduced TLR4 protein expression in CCN compared with CC (Figure 2A). Consistent with this upstream inflammatory response, NF-κB expression was also decreased in AHE-fed mice. NF-κB mRNA levels were lower in CCN, HFBN, and HFCN groups compared with their corresponding non-ammoniated controls, and Western blot analysis confirmed reduced NF-κB protein abundance in HFBN and HFCN mice compared with HFB and HFC mice, respectively (Figure 2B). A similar pattern was observed for the pro-inflammatory cytokines TNFα, IL-1β and IL-6. TNFα expression was increased in non-ammoniated high-fat diet groups, whereas AHE reduced TNFα mRNA and protein expression, particularly in the high-fat beef and high-fat casein comparisons (Figure 2C). IL-1β and IL-6 expressions were also reduced by AHE, with the most consistent decrease observed in HFBN compared with HFB, suggesting that AHE attenuates cytokine-mediated inflammatory signaling in the kidney (Figure 2D). Collectively, these findings indicate that AHE attenuates renal inflammatory signaling associated with long-term high-fat feeding. The coordinated reductions in TLR4, NF-κB, TNFα, IL-1β and IL-6 are consistent with reduced activation of TLR4/NF-κB-associated inflammatory signaling in kidney tissue.

3.2. Renal Apoptosis-Related Protein Expression Is Modulated by AHE

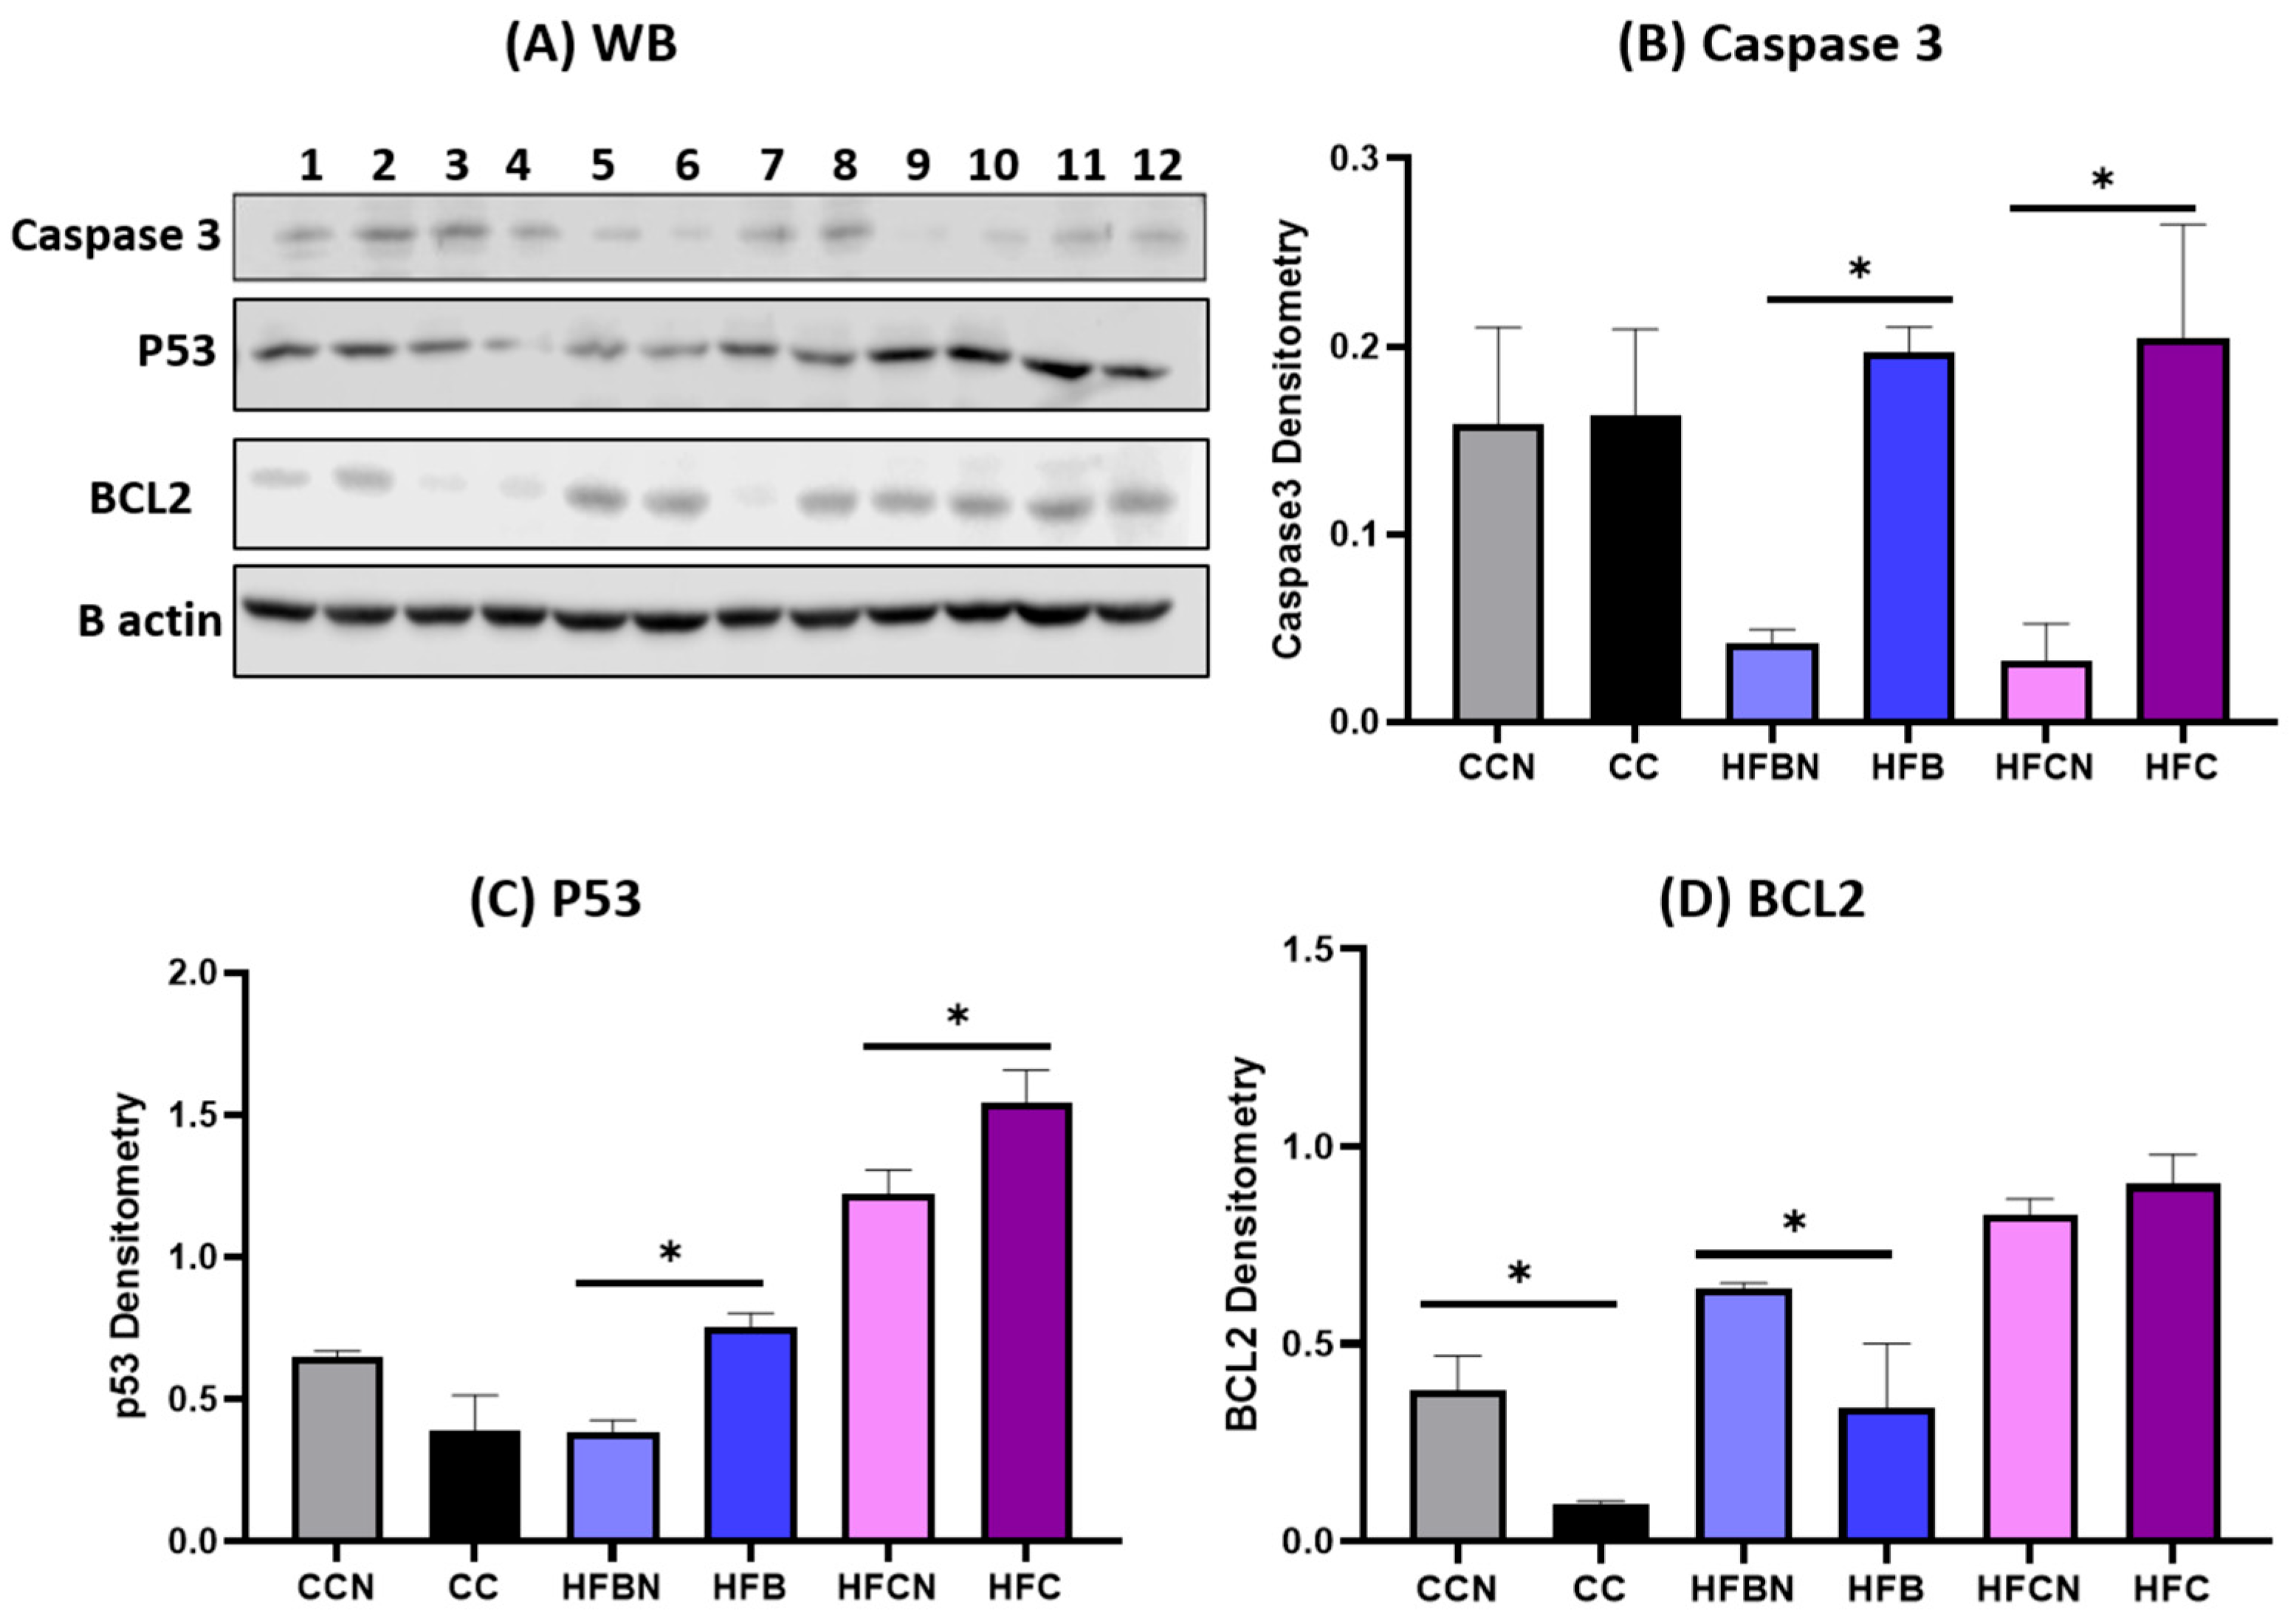
To determine whether dietary ammonium hydroxide enhancement (AHE) influences renal cell apoptosis-related signaling, the expression of apoptosis-related proteins, including Caspase-3, p53, and BCL2, was evaluated in kidney tissues by Western blot analysis (Figure 3).
Figure 2. AHE attenuates renal inflammatory signaling in mice fed high-fat beef- and casein-based diets. Kidney tissues from mice fed control casein with ammonium hydroxide enhancement (CCN), control casein (CC), high-fat beef with ammonium hydroxide enhancement (HFBN), high-fat beef (HFB), high-fat casein with ammonium hydroxide enhancement (HFCN), or high-fat casein (HFC) diets were analyzed by qPCR and Western blotting. Representative gene expression, Western blot images, and densitometric analyses are shown for (A) TLR4, (B) NF-κB, (C) TNFα, and (D) IL-1β and IL-6. Gene expression was normalized to β-actin and expressed as arbitrary units (A.U.). Protein expression was normalized to β-actin and expressed as relative densitometric units. Data are presented as mean ± SEM. Statistical significance was determined by one-way ANOVA followed by Fisher’s least significant difference (LSD) multiple comparisons test. * p ≤ 0.05.
Dietetics 05 00054 g002
Figure 3. AHE modulates renal apoptosis-related signaling. Representative (A) Western blots and densitometric analyses of (B) Caspase-3, (C) p53, and (D) BCL2 protein expression in kidney tissues from mice fed control casein with ammonium hydroxide enhancement (CCN), control casein (CC), high-fat beef with ammonium hydroxide enhancement (HFBN), high-fat beef (HFB), high-fat casein with ammonium hydroxide enhancement (HFCN), or high-fat casein (HFC) diets. Protein expression was normalized to β-actin and expressed as relative densitometric units. Data are presented as mean ± SEM. Statistical significance was determined by one-way ANOVA followed by Fisher’s least significant difference (LSD) multiple comparisons test. * p ≤ 0.05 compared with the corresponding non-AHE diet group.
Dietetics 05 00054 g003
Caspase-3 protein abundance was increased in mice consuming non-ammoniated high-fat diets, whereas AHE-fed groups showed reduced Caspase-3 expression. This reduction was evident in both HFBN and HFCN mice compared with their respective non-ammoniated high-fat controls, HFB and HFC, suggesting attenuation of pro-apoptotic signaling in kidney tissue (Figure 3B).
Renal p53 expression showed a diet-dependent response. p53 protein abundance was significantly reduced in HFBN and HFCN groups compared with HFB and HFC groups, respectively, consistent with reduced p53-associated stress signaling (Figure 3C).
The anti-apoptotic protein BCL2 showed the opposite pattern in selected diet groups. BCL2 protein expression was increased in CCN compared with CC and in HFBN compared with HFB, suggesting increased anti-apoptotic signaling with AHE, particularly in the beef-based diet comparison. However, BCL2 expression was not significantly increased in HFCN compared with HFC, indicating that the BCL2 response may be influenced by dietary protein source (Figure 3D).
Collectively, these findings suggest that AHE modulates renal apoptosis-related signaling in a diet-dependent manner. The reduction in Caspase-3, together with lower p53 and increased BCL2 expression in the HFBN group, is consistent with reduced pro-apoptotic signaling in mice consuming AHE-modified high-fat beef diet.

3.3. AHE Modulates Renal Mitochondrial Dynamics and Associated Markers

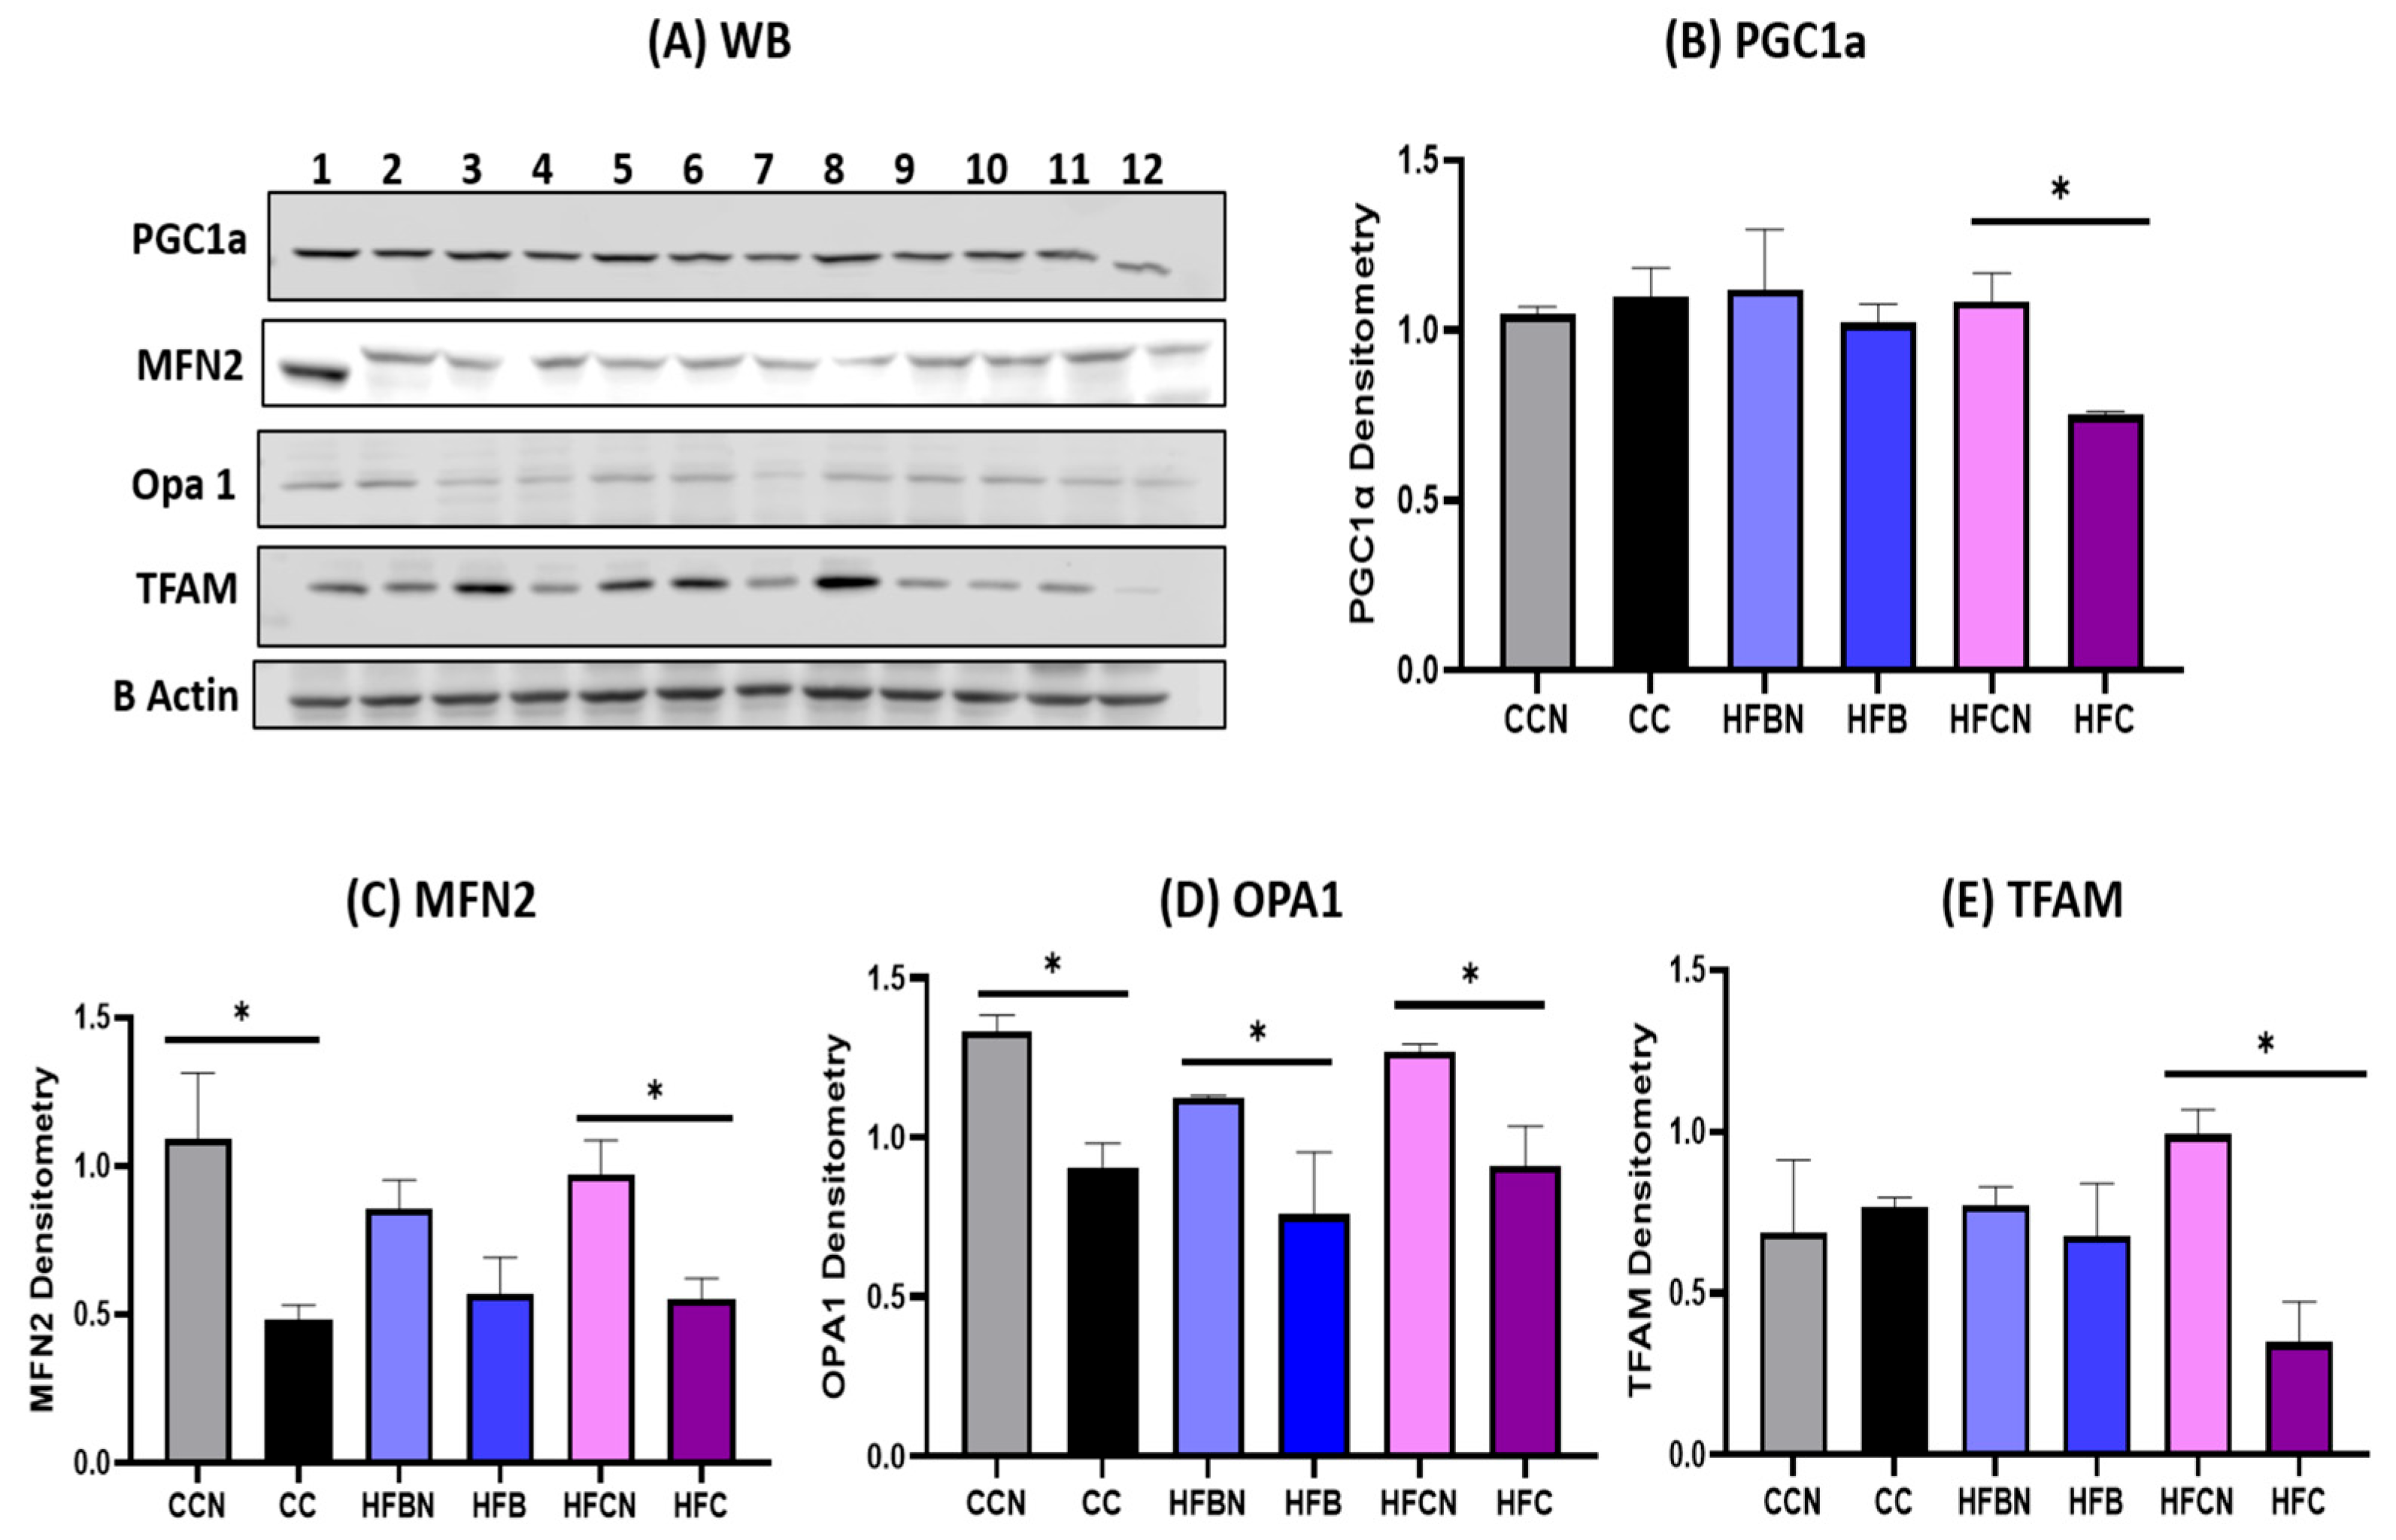
To determine whether dietary ammonium hydroxide enhancement (AHE) was linked to changes in renal mitochondrial-associated pathways, mitochondrial biogenesis, fusion, fission, and mitophagy-related proteins were evaluated in kidney tissues by Western blot analysis (Figure 4, Figure 5 and Figure 6). Markers associated with mitochondrial biogenesis and fusion were generally increased in AHE-fed groups (Figure 4). PGC1α protein expression was significantly higher in HFCN mice compared with HFC mice, suggesting enhanced mitochondrial biogenesis-associated signaling in response to AHE in the high-fat casein group (Figure 4B). MFN2 expression was significantly increased in CCN compared with CC and in HFCN compared with HFC, whereas OPA1 expression was significantly increased in CCN, HFBN, and HFCN groups compared with their corresponding non-AHE controls (Figure 4C,D). TFAM expression was also significantly elevated in HFCN mice compared with HFC mice, consistent with increased expression of a mitochondrial biogenesis-associated marker in the AHE-modified high-fat casein group (Figure 4E).
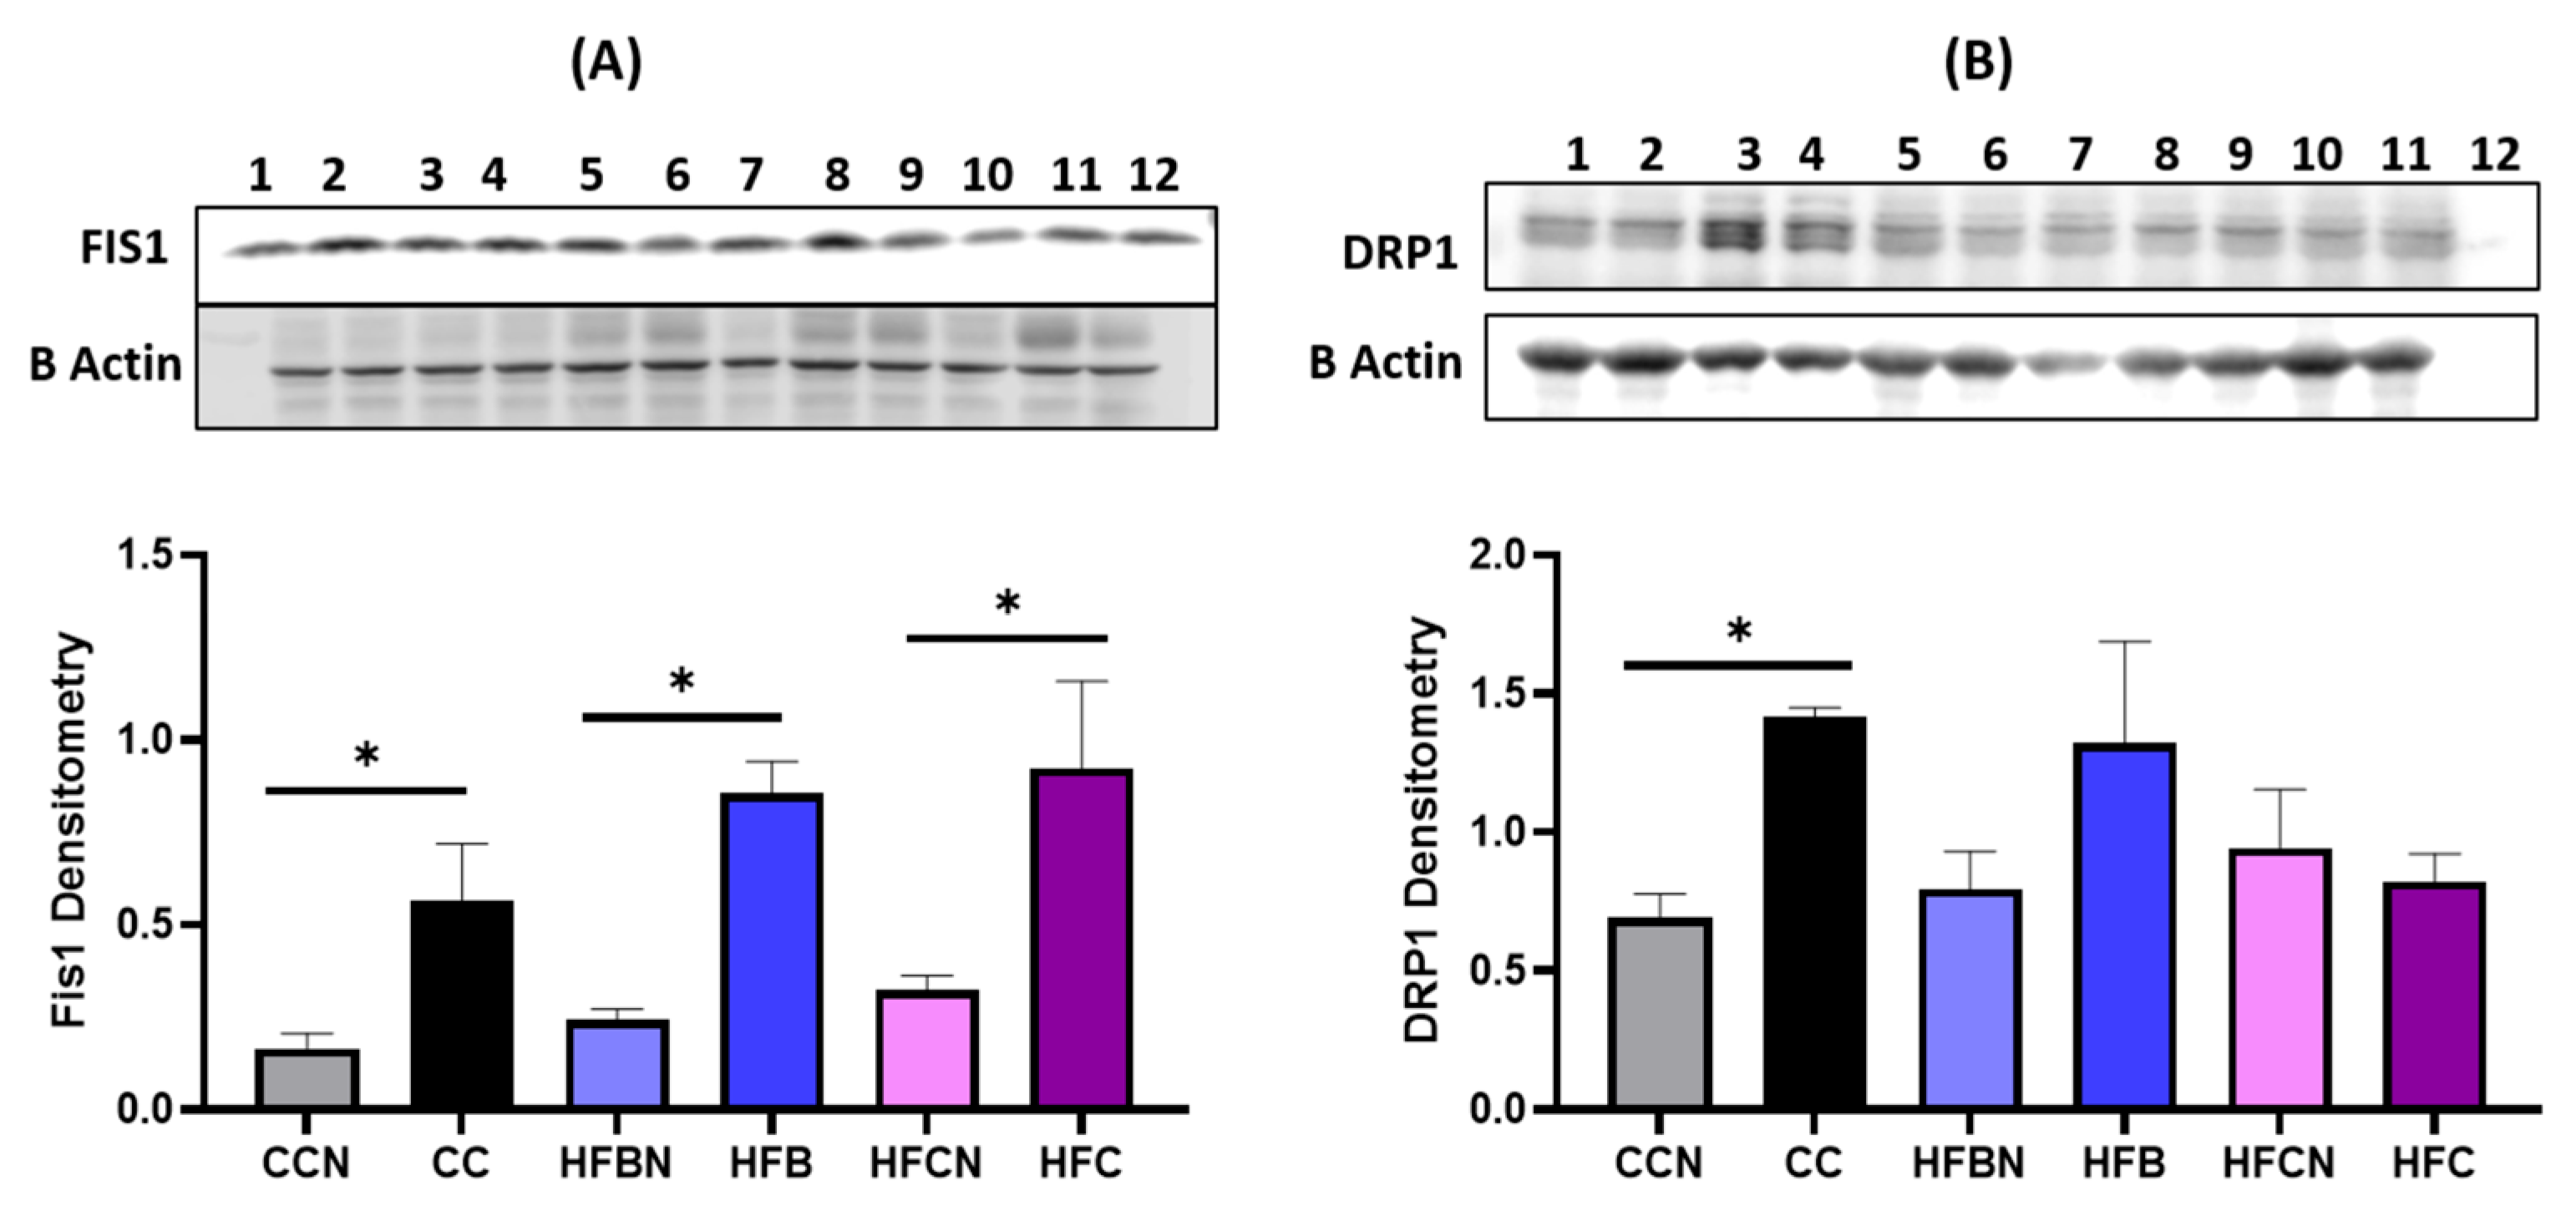
In contrast, mitochondrial fission-associated markers were reduced in AHE-fed groups (Figure 5). FIS1 expression was significantly lower in CCN, HFBN, and HFCN mice compared with their respective non-AHE controls (Figure 5A). DRP1 expression was also significantly reduced in CCN compared with the CC group, whereas no significant differences were observed between HFBN and HFB or between HFCN and HFC (Figure 5B). These findings suggest that AHE may reduce mitochondrial fission-associated signaling, particularly in the control casein and high-fat beef comparisons.
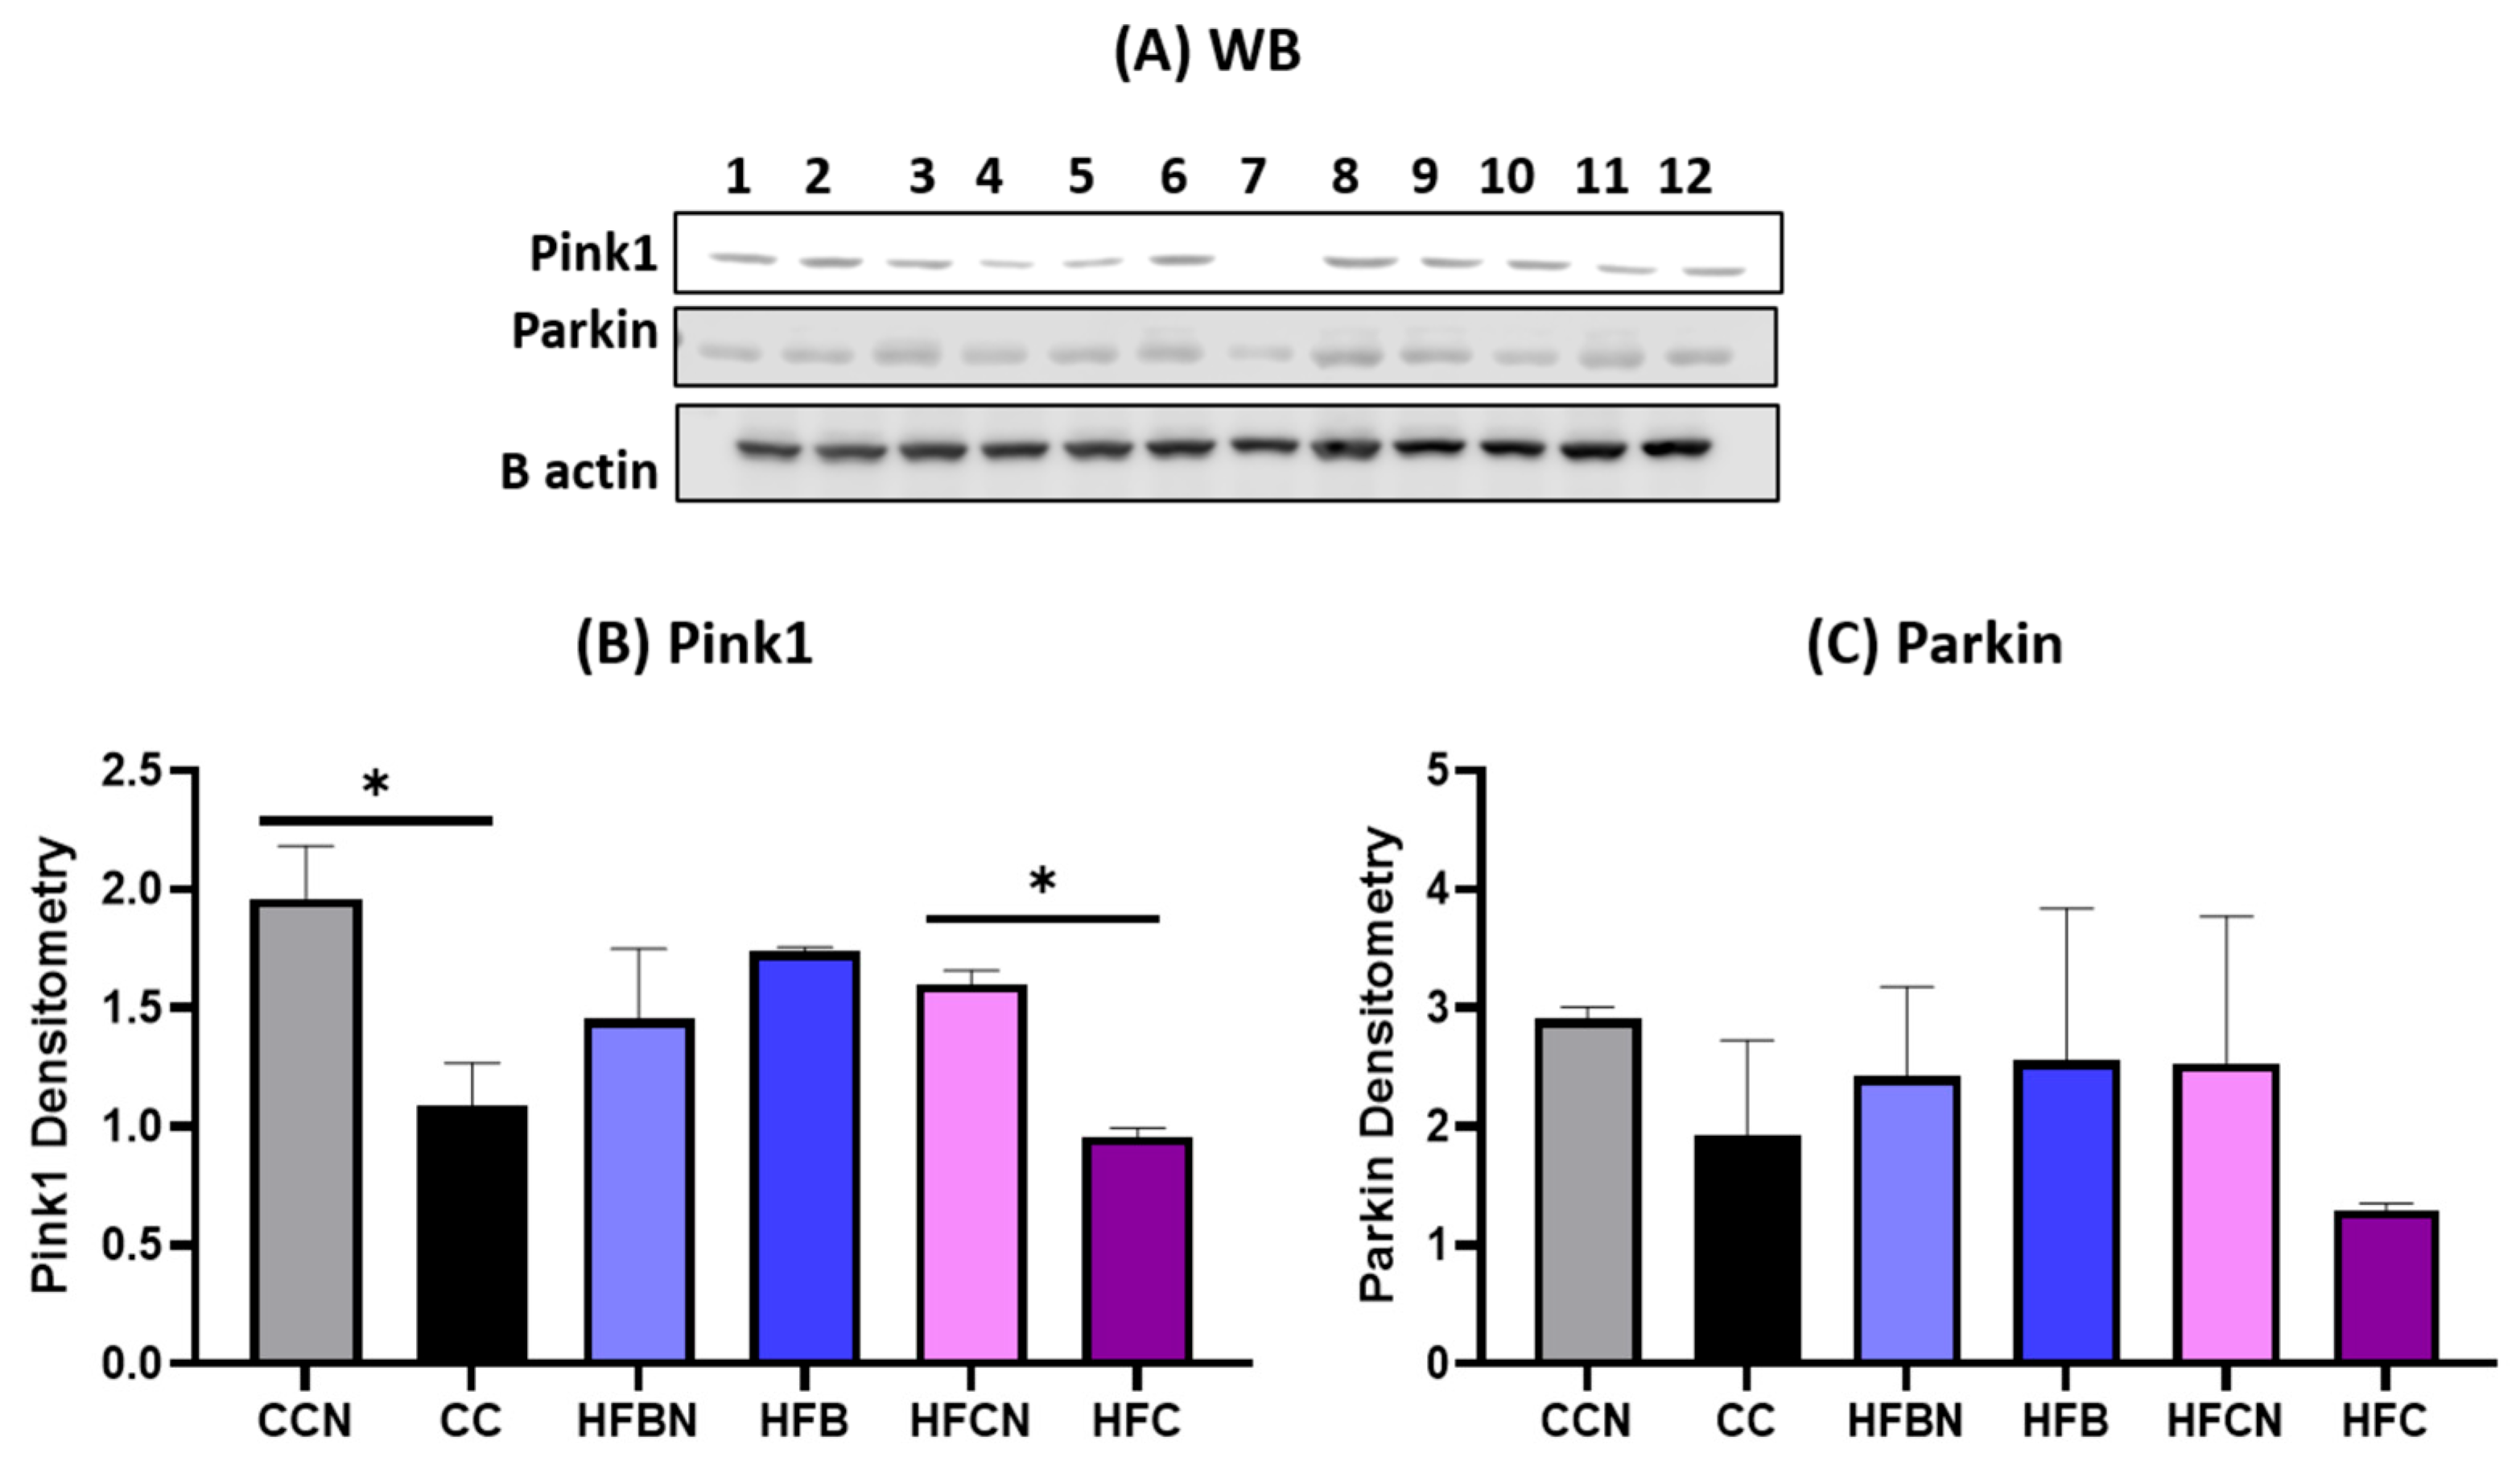
Mitophagy-related proteins were also evaluated as markers of mitophagy-associated signaling (Figure 6). PINK1 expression was significantly increased in CCN compared with CC, and in HFCN compared with HFC, indicating increased PINK1 expression in selected AHE-fed groups (Figure 6B). In contrast, Parkin expression did not show significant differences among diet groups (Figure 6C).
Collectively, these findings indicate that AHE modulates renal mitochondrial-associated protein expression in a diet-dependent manner. Increased expression of mitochondrial biogenesis and fusion-associated proteins, together with reduced fission markers and selective increases in PINK1, demonstrates coordinated changes in proteins associated with mitochondrial biogenesis, dynamics, and mitophagy. These changes were observed alongside reduced inflammatory and apoptosis-related signaling observed in kidney tissues from AHE-fed mice.

3.4. Renal Ammonia Transporter Expression Is Increased by AHE

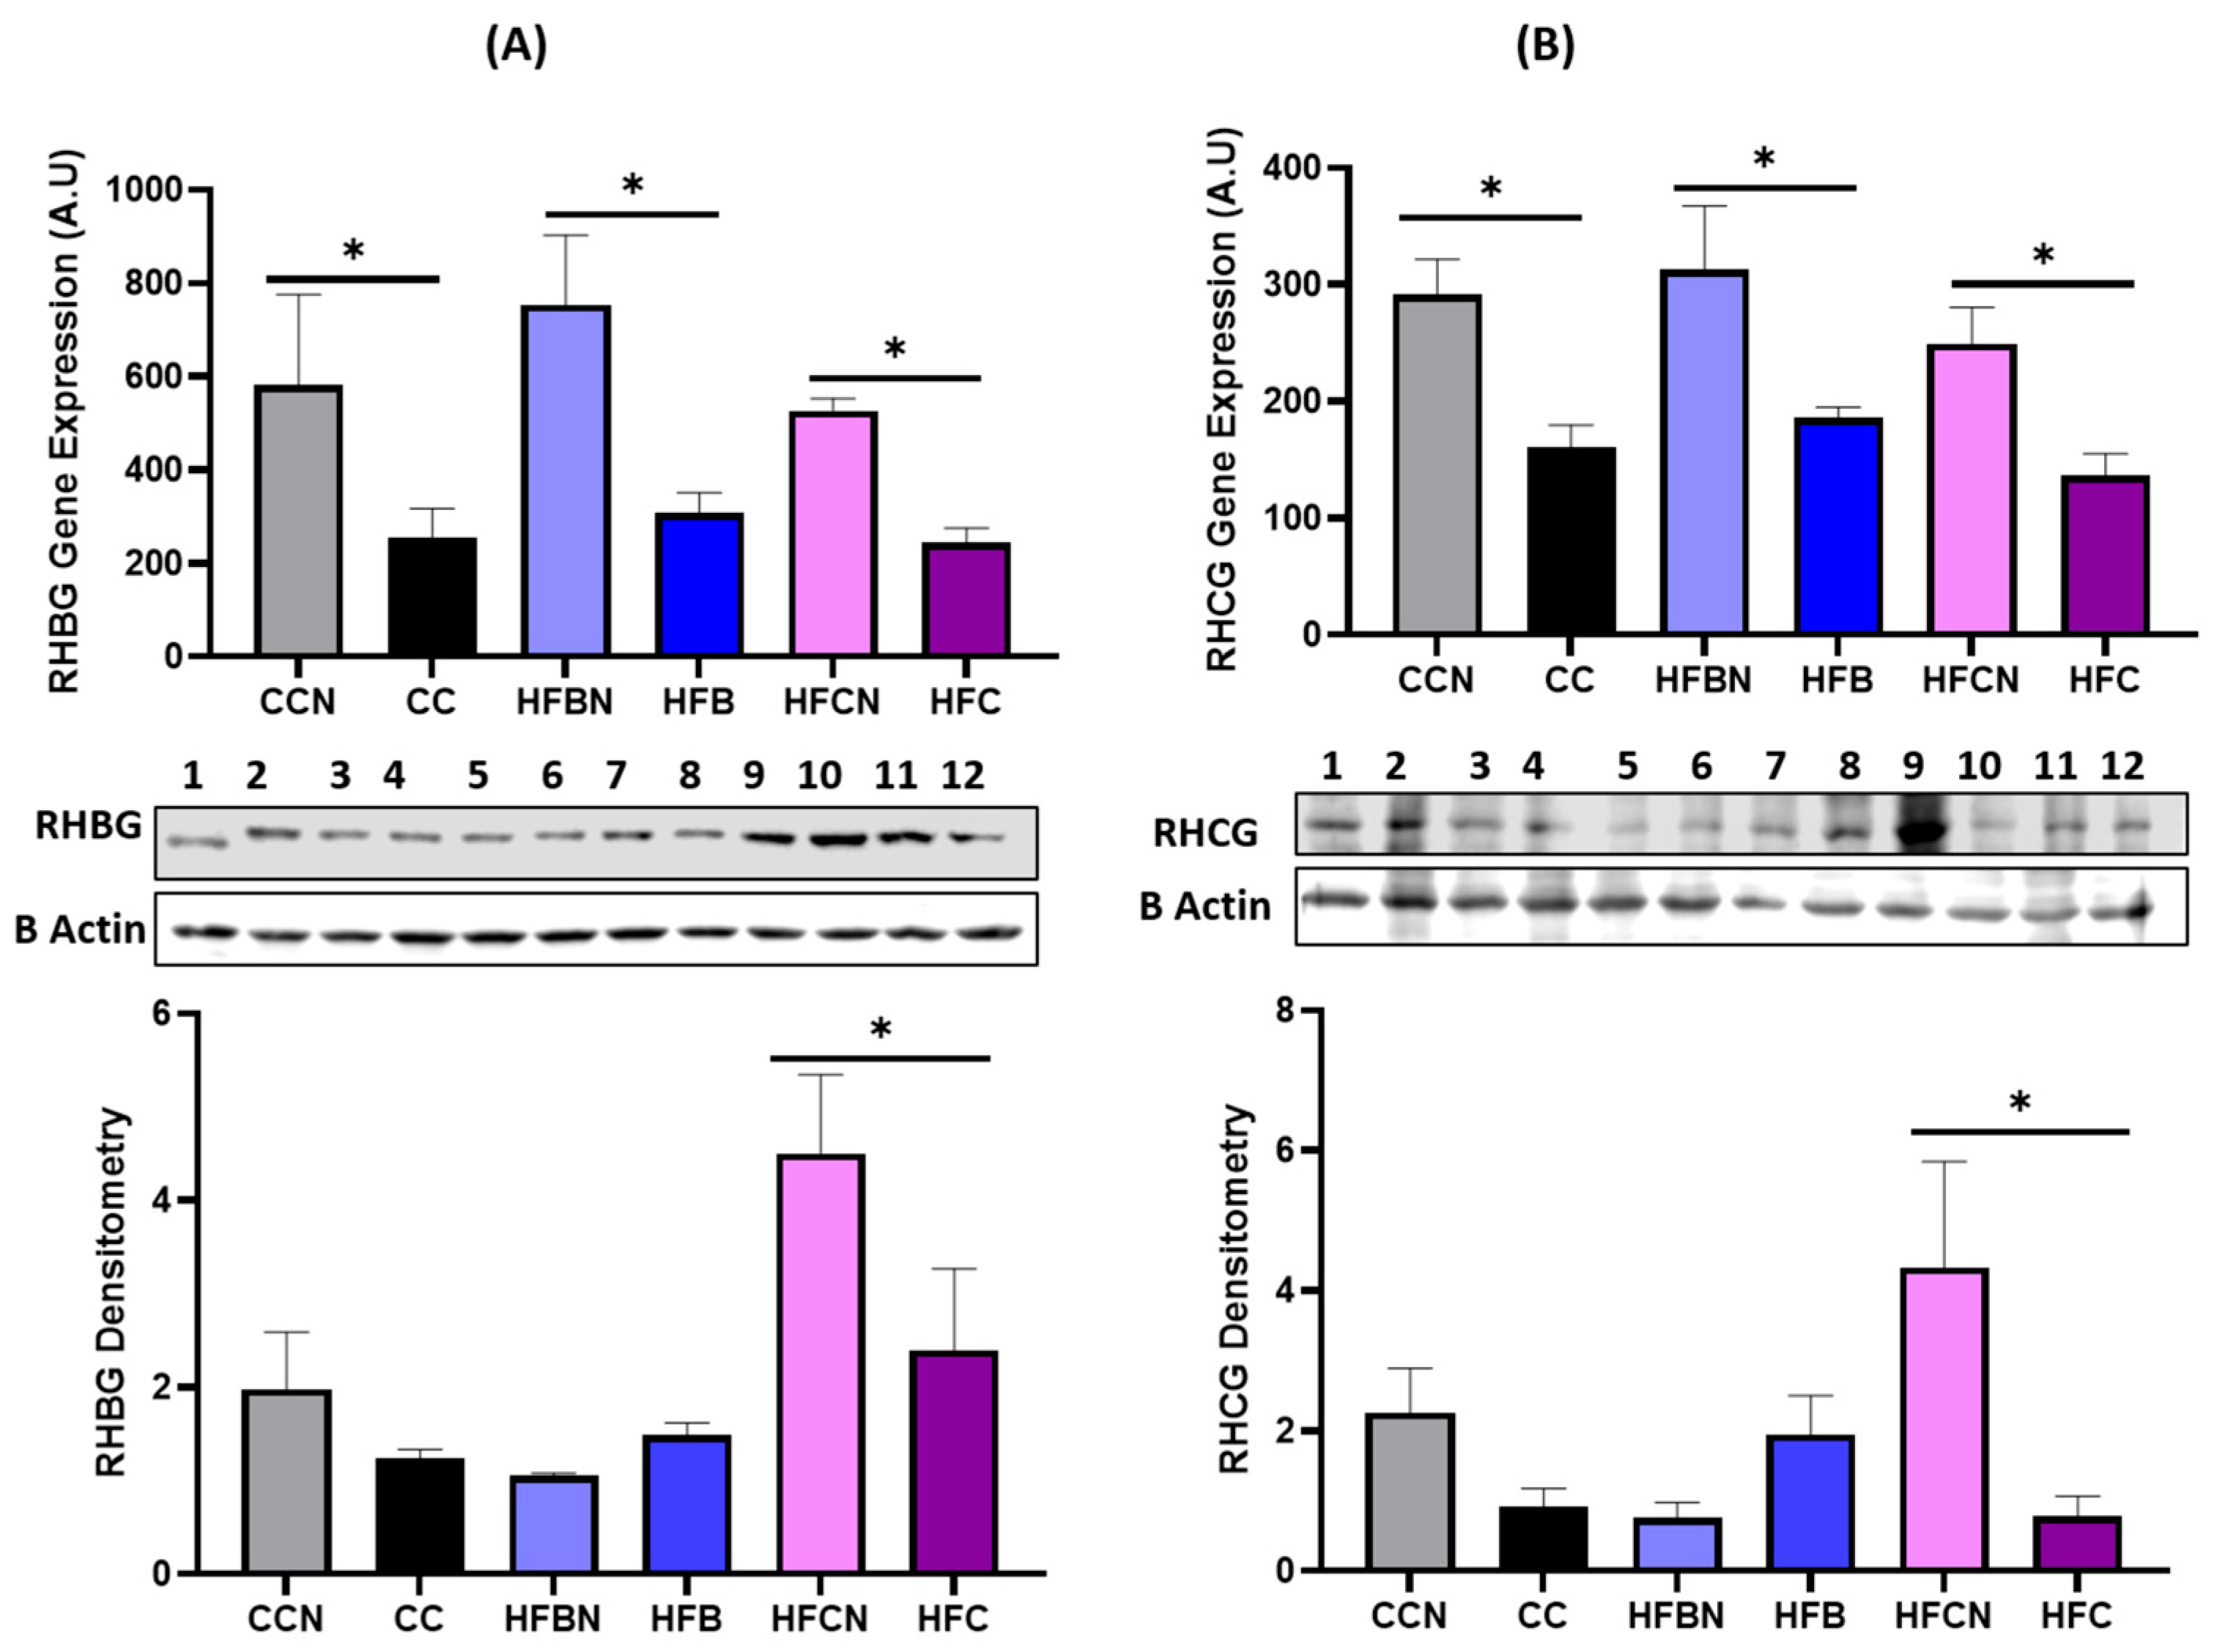
To determine whether dietary ammonium hydroxide enhancement (AHE) influences renal ammonia transporter expression, the expression of the ammonia transporters RHBG and RHCG was evaluated in kidney tissues by qPCR and Western blot analysis (Figure 7). RHBG gene expression was significantly increased in all AHE-fed groups compared with their corresponding non-AHE controls. Specifically, RHBG mRNA levels were elevated in CCN compared with CC, HFBN compared with HFB, and HFCN compared with HFC mice. At the protein level, RHBG abundance showed a diet-dependent response, with the most pronounced and significant increase observed in HFCN mice compared with HFC mice (Figure 7A). A similar pattern was observed for RHCG. RHCG gene expression levels were significantly higher in CCN, HFBN, and HFCN mice compared with their respective non-AHE control groups. Western blot analysis showed that RHCG protein abundance was also increased most prominently in the HFCN group compared with the HFC group, whereas changes in the other diet comparisons were less pronounced (Figure 7B).
Collectively, these findings indicate that AHE upregulates renal RHBG and RHCG gene expression and selectively increases ammonia transporter protein abundance, particularly in the high-fat casein diet comparison. The increased expression of RHBG and RHCG is consistent with modulation of renal ammonia transporter pathways during long-term consumption of AHE-modified diets; however, ammonia transport and acid–base status were not directly assessed.

3.5. Long Term AHE Is Associated with Altered Renal Tubular Morphometric Parameters

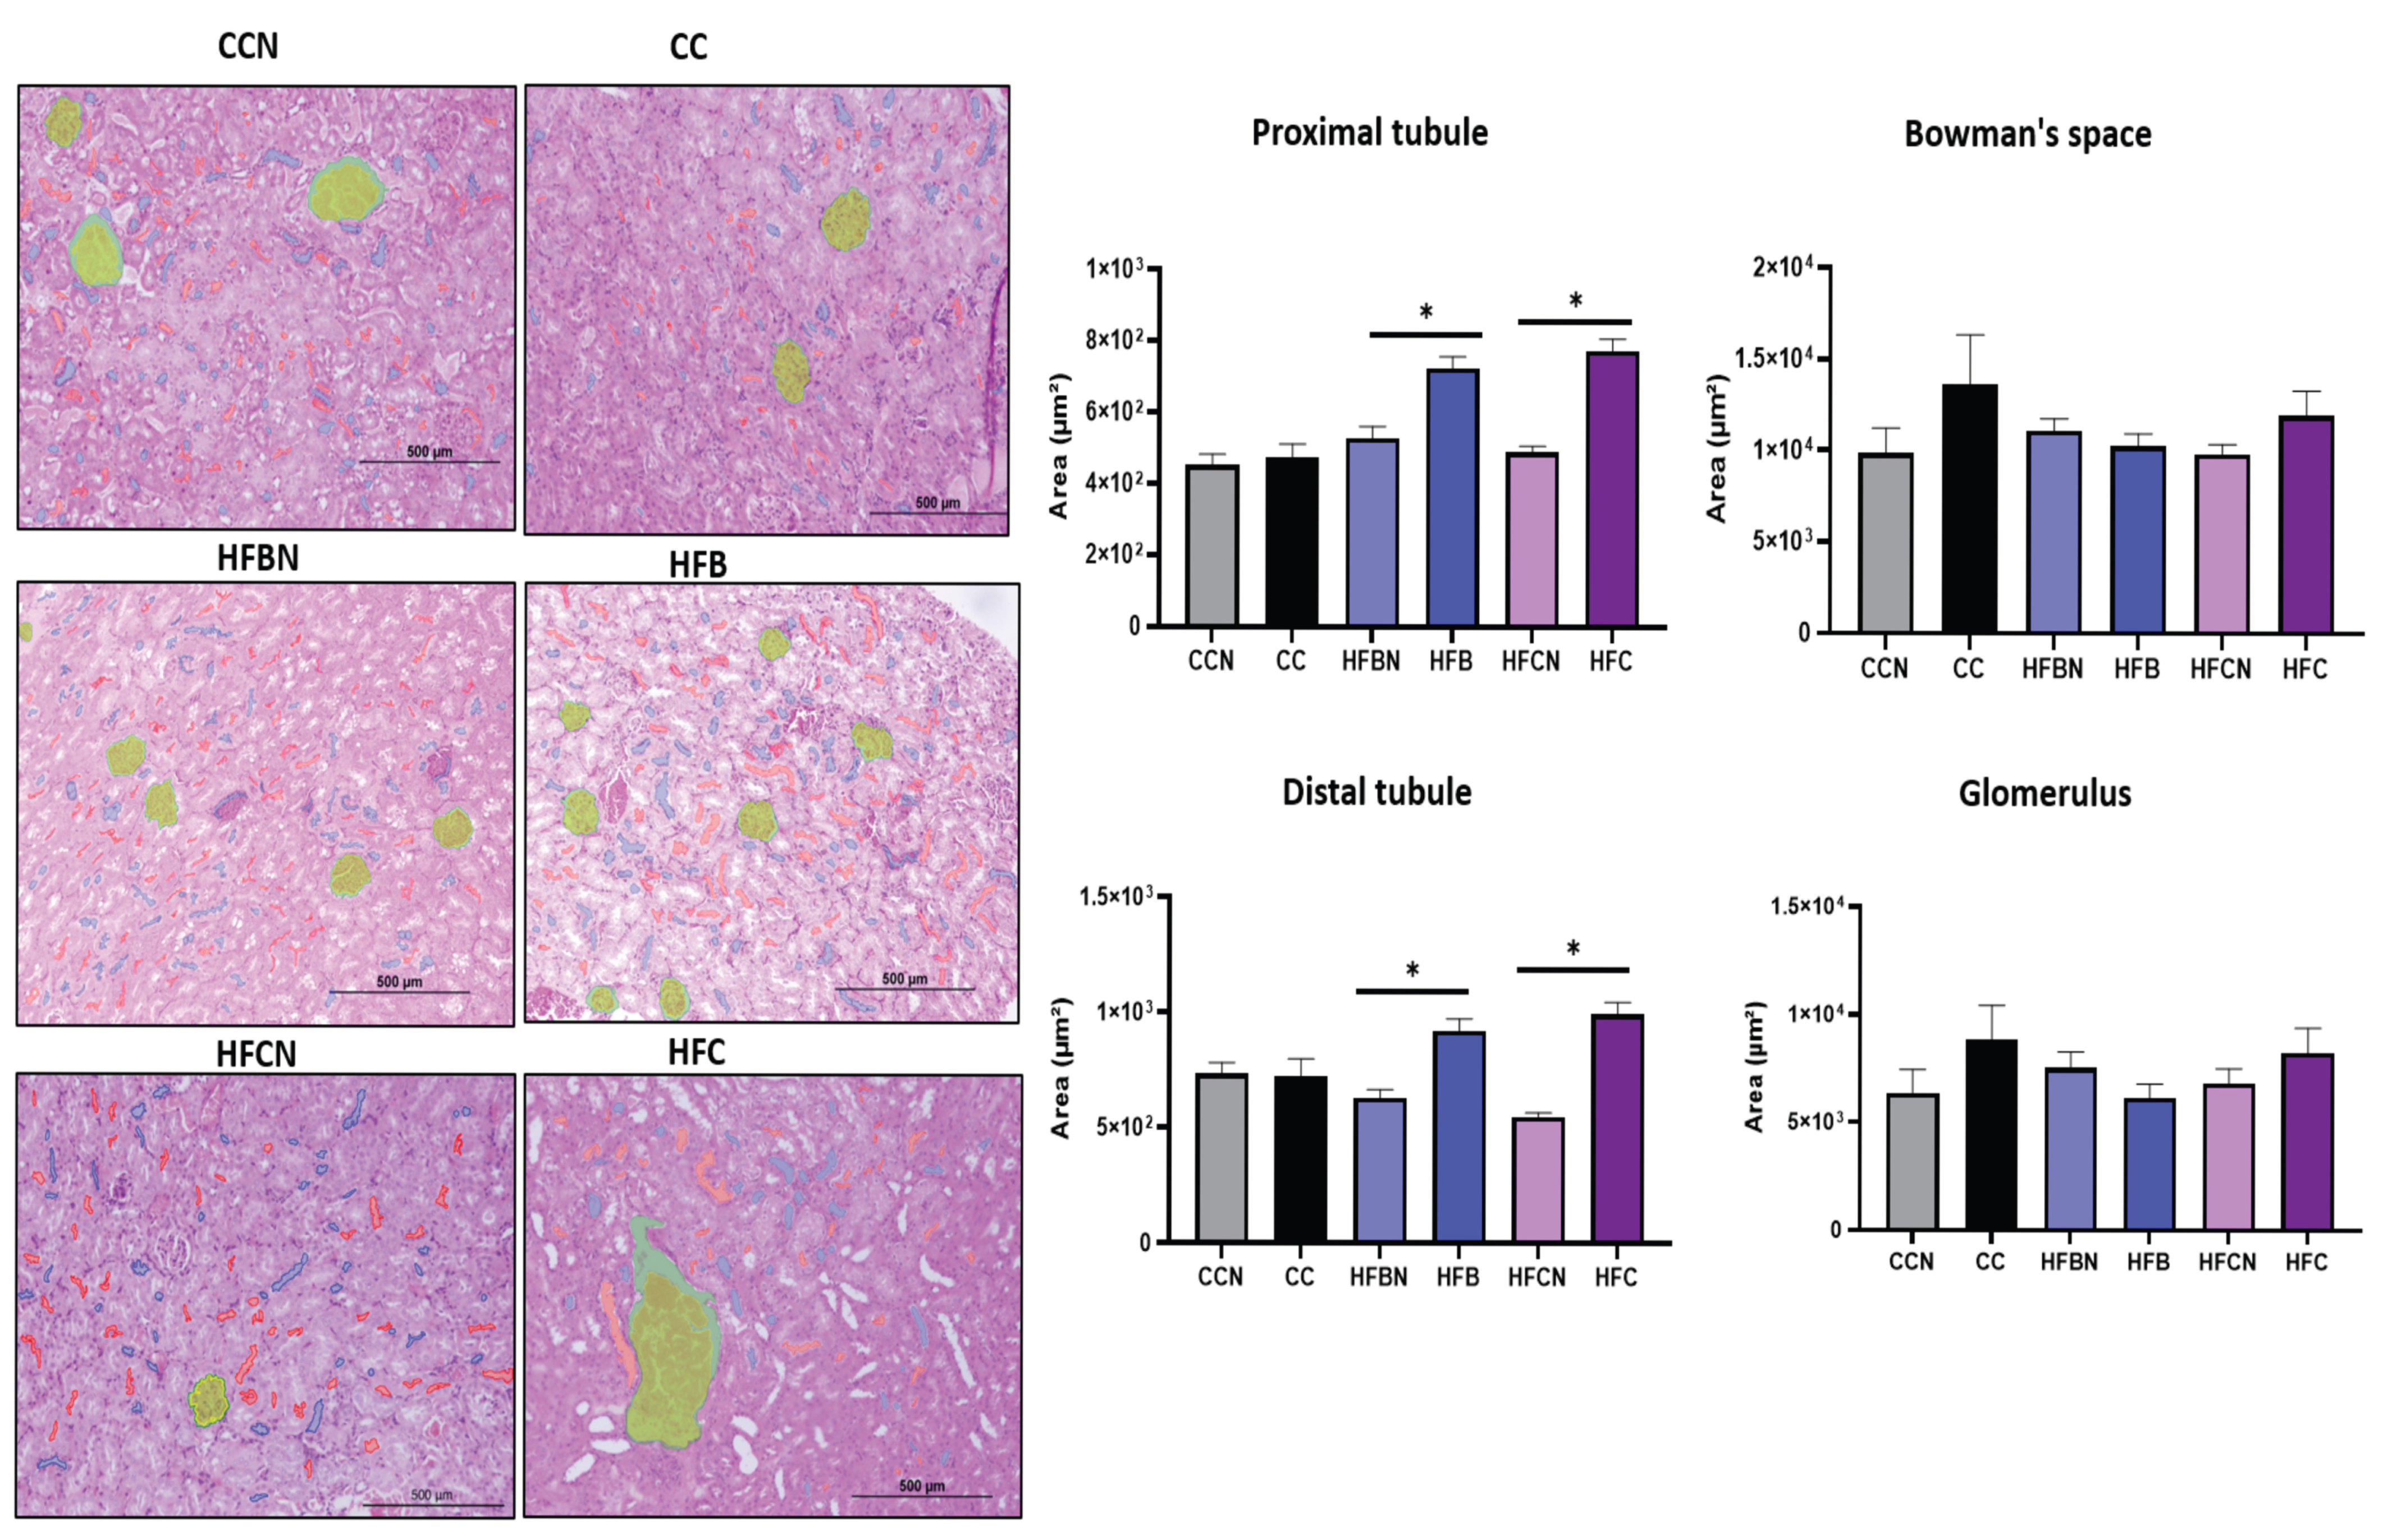
To determine whether long-term dietary ammonium hydroxide enhancement (AHE) influenced renal morphology, hematoxylin and eosin (H&E)-stained kidney sections from male C3H/HeJ mice were examined, and morphometric analysis was performed using QuPath software. Representative kidney sections from mice fed control casein with ammonium hydroxide enhancement (CCN), control casein (CC), high-fat beef with ammonium hydroxide enhancement (HFBN), high-fat beef (HFB), high-fat casein with ammonium hydroxide enhancement (HFCN), or high-fat casein (HFC) diets are shown in Figure 8.
Figure 7. AHE modulates renal ammonia transporter expression. Representative qPCR data, Western blot images, and densitometric analyses of (A) Rh B glycoprotein (RHBG) and (B) Rh C glycoprotein (RHCG) in kidney tissues from mice fed control casein with ammonium hydroxide enhancement (CCN), control casein (CC), high-fat beef with ammonium hydroxide enhancement (HFBN), high-fat beef (HFB), high-fat casein with ammonium hydroxide enhancement (HFCN), or high-fat casein (HFC) diets. Gene expression was normalized to β-actin and expressed as arbitrary units (A.U.). Protein expression was normalized to β-actin and expressed as relative densitometric units. Data are presented as mean ± SEM. Statistical significance was determined using one-way ANOVA followed by Fisher’s least significant difference (LSD) multiple comparisons test. * p ≤ 0.05.
Dietetics 05 00054 g007
Figure 8. Histopathological evaluation and quantitative morphometric analysis of kidney tissue following dietary ammonium hydroxide enhancement. Representative 10× hematoxylin and eosin (H&E)-stained kidney sections from male C3H/HeJ mice fed control casein with ammonium hydroxide enhancement (CCN), control casein (CC), high-fat beef with ammonium hydroxide enhancement (HFBN), high-fat beef (HFB), high-fat casein with ammonium hydroxide enhancement (HFCN), or high-fat casein (HFC) diets. QuPath polygon annotations were used to delineate proximal tubules (red), distal tubules (blue), glomeruli (yellow), and Bowman’s space (green). Areas (µm2) of each renal structure were quantified, and measurements from individual structures were averaged at the animal level for statistical analysis. Data are presented as mean ± SEM (n = 3–4 animals/group). Statistical significance was determined using ordinary one-way ANOVA followed by Fisher’s least significant difference (LSD) multiple-comparisons test. * p ≤ 0.05. Scale bar = 500 µm.
Dietetics 05 00054 g008
Qualitative examination of the representative H&E-stained sections showed no obvious severe alterations in overall renal architecture across the dietary groups. Morphometric analysis showed that proximal tubular area was higher in the non-AHE high-fat diet groups, particularly HFB and HFC, compared with their corresponding AHE groups, HFBN and HFCN. A similar pattern was observed for distal tubular area, where AHE-fed mice showed reduced tubular area relative to the corresponding non-AHE controls. In contrast, glomerular area and Bowman’s space area showed only modest differences among dietary groups.
Collectively, these findings indicate that long-term AHE was associated with reduced renal tubular area in mice fed high-fat beef- and casein-based diets, while glomerular area and Bowman’s capsule area remained largely unchanged. These findings demonstrate AHE-associated differences in renal tubular morphology during long-term, high-fat feeding. However, whether these changes represent attenuation of pathological tubular remodeling, requires further histopathological and functional validation.

4. Discussion

The results from our study demonstrate that long-term dietary ammonium hydroxide enhancement (AHE) is associated with molecular and structural alterations in the kidney during chronic high-fat feeding. The principal findings are that AHE attenuated inflammatory signaling, modulated apoptosis-related protein expression, altered mitochondrial biogenesis-, fusion-, fission-, and mitophagy-associated markers, increased expression of renal ammonia transporters, and was associated with changes in tubular morphometric parameters, while glomerular and Bowman’s space areas remained largely unchanged. Collectively, these results suggest that dietary alkalization through ammonium hydroxide enhancement is associated with coordinated changes in renal inflammatory and apoptosis-related signaling, mitochondrial-associated pathways, ammonia transporter expression, and renal morphology during chronic high-fat feeding.
The present kidney-focused analysis extends previous studies from our laboratory demonstrating that AHE-modified high-fat diets improved longevity, metabolic outcomes, remodeled the microbiota, and altered hepatic metabolic signaling in a sex- and dietary protein source-dependent manner [2,15,16,17,18,19,20,46]. Because the liver and kidney are metabolically interconnected through nutrient handling, nitrogen metabolism, ammonia processing, acid–base regulation, and inflammatory signaling [22,23,24], the previously observed hepatic metabolic responses provided a strong rationale [2,15,46] to investigate whether AHE is associated with corresponding molecular and structural changes in the kidney. The current study focused on male kidney tissues because prior work identified prominent sex-dependent metabolic and hepatic responses to AHE in the males, providing a rationale to examine whether corresponding molecular changes were present in the male kidney. Importantly, previously reported longitudinal data from the same cohort demonstrated that AHE did not simply reduce body weight in male mice. At 18 months, HFBN and HFCN males exhibited slightly higher mean total body mass than their respective HFB and HFC counterparts, and AHE-fed males showed greater maintenance of body mass during later stages of aging [2,15,46]. Thus, the renal molecular alterations observed in the present study are unlikely to be attributable solely to lower body weight in the AHE-fed animals.
Obesity and chronic consumption of high-fat diets are recognized contributors to renal dysfunction and chronic kidney disease [48,49]. Excess nutrient exposure promotes low-grade inflammation, oxidative stress, and cellular injury, ultimately leading to tubular dysfunction and structural remodeling [50]. In the present study, AHE significantly reduced expression of TLR4, NFκB, TNFα, and IL6, consistent with reduced TLR4/NFκB-associated inflammatory signaling. Activation of this pathway is known to amplify cytokine production and contribute to obesity-associated renal injury [51,52]. Therefore, the coordinated reduction in inflammatory mediators observed in AHE-fed animals suggests that dietary alkalization is associated with attenuation of inflammatory signaling during prolonged high-fat feeding. These findings are consistent with previous studies demonstrating that metabolic stress and acidogenic diets promote inflammatory signaling and contribute to renal dysfunction [20,32,36,53].
Chronic inflammation and oxidative stress are closely linked to activation of apoptotic pathways [54]. Excessive apoptosis of tubular epithelial cells contributes to progressive renal injury and loss of functional nephron mass [55]. In the present study, AHE decreased expression of Caspase-3 and p53 while increasing the anti-apoptotic protein BCL2, consistent with reduced pro-apoptotic signaling. Because BCL2 stabilizes mitochondrial membranes and inhibits cytochrome c release, increased BCL2 expression may be consistent with reduced downstream apoptotic signaling [56]. The coordinated reduction in pro-apoptotic markers together with increased BCL2 suggests that AHE is associated with a shift toward reduced apoptosis-related signaling during chronic exposure to nutrient excess.
Mitochondrial dysfunction has emerged as a central mechanism underlying obesity-associated kidney injury [25,34]. Renal tubular epithelial cells possess high metabolic demands and rely heavily on mitochondrial oxidative phosphorylation to maintain active transport and acid–base homeostasis [57]. Consequently, disruption of mitochondrial function results in impaired energy production, increased reactive oxygen species generation, and activation of inflammatory and apoptotic pathways [57,58]. In the present study, AHE increased expression of PGC1α and TFAM, consistent with increased expression of mitochondrial biogenesis-associated markers. In parallel, increased MFN2 and OPA1 expression, together with decreased DRP1 and FIS1 expression suggests modulation of mitochondrial fusion- and fission-associated signaling. Excessive mitochondrial fission has been implicated in obesity-associated renal injury and chronic kidney disease [25]. Therefore, the observed changes in fusion and fission-associated proteins may reflect altered mitochondrial dynamics in AHE-fed mice [59]. These findings demonstrate AHE-associated changes in mitochondrial biogenesis and dynamics related protein expression. However, mitochondrial function was not directly assessed in the present study. Further studies incorporating functional mitochondrial assays are needed to determine the physiological significance of these molecular changes.
Mitophagy constitutes another essential component of mitochondrial homeostasis by facilitating selective removal of damaged mitochondria [60]. Impaired mitophagy contributes to oxidative stress and progression of renal disease [61]. Interestingly, AHE increased PINK1 expression, whereas Parkin expression remained unchanged. Although the PINK1/Parkin pathway is traditionally considered a coordinated system, recent studies suggest that PINK1 can exert protective functions independently of changes in Parkin abundance. Increased PINK1 expression may therefore reflect modulation of PINK1 associated mitochondrial signaling rather than coordinated activation of the PINK1/Parkin pathway. Together with changes in mitochondrial biogenesis- and dynamics-associated proteins, these findings suggest selective modulation of mitophagy-related signaling [62,63] by AHE.
Because the kidney plays a central role in ammonia metabolism and acid–base homeostasis, the effects of AHE on renal ammonia transporter expression represent a particularly relevant finding [44,64]. RHBG and RHCG are essential transport proteins responsible for renal ammonium handling and urinary acid excretion [43,65,66]. In the present study, expression of both RHBG and RHCG was increased in AHE-fed animals, indicating modulation of renal ammonia transporter expression in response to AHE. Increased expression of these transporters may reflect an adaptive molecular response to long-term dietary AHE [4,64,67]. Given that impaired ammonia transport has been associated with tubular dysfunction and progression of kidney disease, the observed increases in RHBG and RHCG expression may be relevant to renal ammonia handling [43,44]. Therefore, further functional studies are needed to determine whether these changes in transporter expression translate into altered renal ammonia handling or acid–base regulation.
Histological examination showed no obvious severe alterations in overall renal cortical architecture across the experimental groups. Although subtle tubular alterations were observed, quantitative morphometric analysis revealed significant reductions in proximal and distal tubular areas in animals consuming ammonia-enhanced high-fat diets compared with their corresponding non-AHE high-fat diet groups, demonstrating AHE-associated differences in tubular morphology [68,69,70]. In contrast, glomerular area and Bowman’s capsule area remained largely unchanged, suggesting that the AHE-associated morphometric differences were more apparent in the tubular structures evaluated. This observation is biologically relevant because renal tubules are the principal sites of ammonia transport, acid–base regulation, and mitochondrial energy metabolism [71,72].Moreover, the morphometric findings were observed alongside reduced inflammatory and apoptosis-related signaling, altered expression of mitochondrial biogenesis, fusion, fission, and mitophagy-associated proteins, and increased expression of RHBG and RHCG. However, the relationships among these molecular and morphometric changes remain associative and do not establish a causal mechanism.
Interestingly, the present findings suggest that long-term dietary ammonium hydroxide enhancement is associated with adaptive renal molecular responses rather than overt, adverse changes in the renal parameters evaluated. These responses included altered mitochondrial-associated protein expression, increased ammonia transporter expression, and changes in tubular morphometric parameters. These observations are consistent with our previous findings demonstrating improved longevity [2], metabolic outcomes [15,20,46], microbiome changes [17,18], and reduced adipocytokine production [16,19], in mice consuming ammonia-enhanced diets, and suggest that dietary AHE may influence multiple molecular and metabolic responses during long-term high-fat feeding [2].
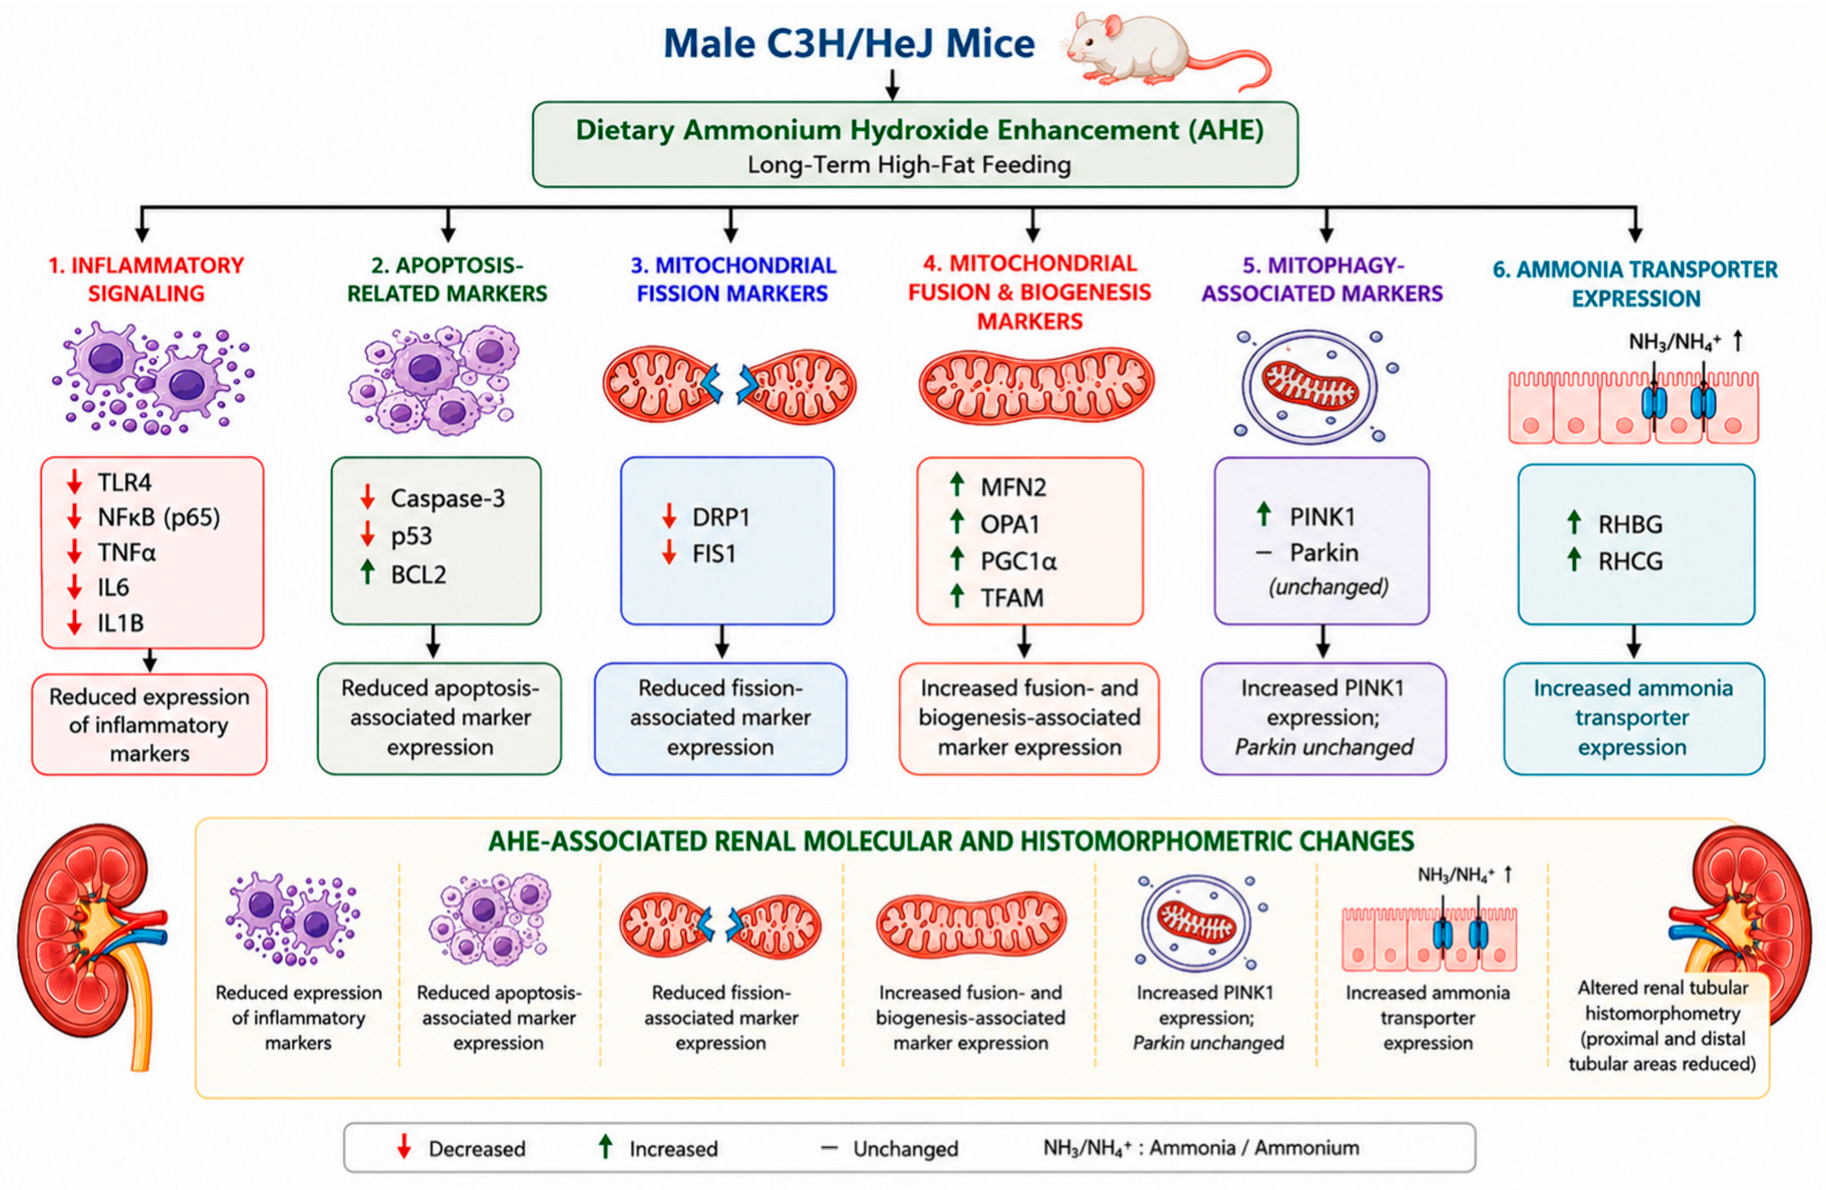
The integrated model shown in Figure 9 summarizes the renal molecular and histomorphometric changes associated with long-term AHE in high-fat diet fed C3H/HeJ male mice. In this model, AHE is associated with reduced inflammatory signaling, lower apoptosis-related stress markers, decreased mitochondrial fission-associated proteins, increased mitochondrial fusion- and biogenesis-associated proteins, increased PINK1 expression, and increased RHBG/RHCG expression. Together, these observed changes indicate that AHE is associated with alterations in multiple renal molecular pathways and tubular morphometric parameters during chronic high-fat diet consumption. However, this model should be interpreted as a conceptual summary of the observed molecular and morphometric findings and does not represent an experimentally established sequential or causal mechanism. Potential interactions among these pathways require further functional and mechanistic validation.

Study Limitations

Several limitations of this study should be acknowledged. First, only male kidney tissues were examined in the present study. This design was based on prior findings from our laboratory showing sex-dependent metabolic and hepatic responses to AHE, including substantial responses in males. However, future studies should evaluate female kidney tissues to determine whether similar or sex-based renal responses occur. Second, functional assessments of renal performance, including serum creatinine, blood urea nitrogen, urinary albumin excretion, and systemic acid–base status, were not evaluated. The present study is a secondary analysis of kidney tissues collected during a previously completed long-term dietary intervention. Serum and urine samples suitable for assessment of serum creatinine, blood urea nitrogen, proteinuria, or related renal functional endpoints were not available for retrospective analysis. In addition, oxidative stress markers and direct measurements of mitochondrial respiration were not examined. Similarly, the archived kidney tissues and protein/RNA preparations used in the present study did not permit direct measurements of mitochondrial respiration or bioenergetic activity, such as Seahorse extracellular flux analysis. Future studies incorporating renal functional analyses, metabolic profiling, and mitochondrial respiration assays will be necessary to determine the physiological significance of the molecular and morphological changes observed in the present study. More detailed histopathological assessments of renal fibrosis, lipid accumulation, inflammatory infiltration, and tubular apoptosis were not performed and warrant investigation in future studies.

5. Conclusions

This study on the effects of AHE in male C3H/HeJ mice fed long-term high-fat diets demonstrated that ammonium hydroxide enhancement attenuated inflammatory signaling, modulated apoptosis-related protein expression, altered mitochondrial biogenesis, fusion, fission, and mitophagy-associated protein expression, increased RHBG and RHCG expression, and was associated with changes in renal tubular morphometric parameters, while glomerular and Bowman’s space areas remained largely unchanged. These findings demonstrate that long-term dietary AHE is associated with coordinated molecular and histomorphometric changes in the kidney and provide a basis for future studies to determine their functional significance and potential relevance to kidney health during chronic high-fat feeding.

Author Contributions

Conceptualization, H.D. and L.G.; methodology, H.D., C.S. and A.R.; software, H.D. and K.Y.; validation, H.D., C.S., A.R. and K.Y.; H.D., C.S., A.R. and K.Y.; investigation, H.D.; resources, L.G.; data curation, L.G.; writing—original draft preparation, H.D., C.S. and K.Y.; writing—review and editing, H.D. and L.G.; visualization, H.D., C.S., A.R. and K.Y.; supervision, H.D. and L.G.; project administration, L.G.; funding acquisition, L.G. All authors have read and agreed to the published version of the manuscript.

Funding

This research was funded by Empirical Foods, Incorporated, Grant # A18-0187-001.

Institutional Review Board Statement

The animal study protocol was approved by the Institutional Animal Care and Use Committee of Texas Tech University (Texas Tech University IACUC protocol 19021-02, Approved 2 December 2019) for studies involving animals.

Informed Consent Statement

Not applicable.

Data Availability Statement

Data is available from the corresponding author upon reasonable request.

Acknowledgments

The authors would like to thank the members of the Gollahon Laboratory for their support and valuable discussions.

Conflicts of Interest

The authors declare no conflicts of interest.

Abbreviations

The following abbreviations are used in this manuscript:
AHEAmmonium hydroxide enhancement
A.U.Arbitrary units
BCL2B-cell lymphoma 2
BUNBlood urea nitrogen
CCControl casein diet
CCNControl casein diet with ammonium hydroxide enhancement
CKDChronic kidney disease
DRP1Dynamin-related protein 1
FDAFood and Drug Administration
FIS1Mitochondrial fission protein 1
H&EHematoxylin and eosin
HFBHigh-fat beef diet
HFBNHigh-fat beef diet with ammonium hydroxide enhancement
HFCHigh-fat casein diet
HFCNHigh-fat casein diet with ammonium hydroxide enhancement
IL-6Interleukin-6
LSDLeast significant difference
MFN2Mitofusin 2
NF-κBNuclear factor kappa B
OPA1Optic atrophy protein 1
PGC1αPeroxisome proliferator-activated receptor gamma coactivator 1-alpha
PINK1PTEN-induced kinase 1
qPCRQuantitative real-time polymerase chain reaction
RHBGRh family B glycoprotein
RHCGRh family C glycoprotein
SEMStandard error of the mean
TFAMMitochondrial transcription factor A
TLR4Toll-like receptor 4
TNFαTumor necrosis factor alpha
WBWestern blot

References

  1. León-Román, J.; López-Martínez, M.; Esteves, A.; Ciudin, A.; Núñez-Delgado, S.; Álvarez, T.; Lecube, A.; Rico-Fontalvo, J.; Soler, M.J. Obesity-Related Kidney Disease: A Growing Threat to Renal Health. Int. J. Mol. Sci. 2025, 26, 6641. [Google Scholar] [CrossRef] [Scilit] [PubMed]
  2. Barr, B.; Gollahon, L. The Modification of Dietary Protein with Ammonium Hydroxide Enhancement Improves Longevity and Metabolic Outcomes in a Sex-Dependent Manner. Nutrients 2024, 16, 2787. [Google Scholar] [CrossRef] [Scilit] [PubMed]
  3. Xu, W.; Zhu, Y.; Wang, S.; Liu, J.; Li, H. From Adipose to Ailing Kidneys: The Role of Lipid Metabolism in Obesity-Related Chronic Kidney Disease. Antioxidants 2024, 13, 1540. [Google Scholar] [CrossRef] [Scilit] [PubMed]
  4. Wieërs, M.; Beynon-Cobb, B.; Visser, W.J.; Attaye, I. Dietary acid load in health and disease. Pflug. Arch. 2024, 476, 427–443. [Google Scholar] [CrossRef] [Scilit] [PubMed]
  5. O’Rourke, R.W. Inflammation in obesity-related diseases. Surgery 2009, 145, 255–259. [Google Scholar] [CrossRef] [Scilit] [PubMed]
  6. Shirsat, P.; Balachandran, M.; Chamarthi, V.S.; Sonavane, K. Obesity and Chronic Kidney Disease: A Comprehensive Review of Mechanisms, Impact, and Management Strategies. J. CardioRenal Med. 2025, 1, 4. [Google Scholar] [CrossRef] [Scilit]
  7. Imenez Silva, P.H.; Mohebbi, N. Kidney metabolism and acid-base control: Back to the basics. Pflug. Arch. 2022, 474, 919–934. [Google Scholar] [CrossRef] [Scilit] [PubMed]
  8. Naber, T.; Purohit, S. Chronic Kidney Disease: Role of Diet for a Reduction in the Severity of the Disease. Nutrients 2021, 13, 3277. [Google Scholar] [CrossRef] [Scilit] [PubMed]
  9. Rico-Fontalvo, J.; Raad-Sarabia, M.; Montejo Hernández, J.; Rodríguez Yánez, T.; Caparroso Ramos, L.R.; Parra Sánchez, P.; Ovalle Gomez, A.A.; Quintero, J.J.; Daza-Arnedo, R. Inflammatory and lipotoxicity mechanisms in obesity related CKD. Front. Nephrol. 2025, 5, 1684004. [Google Scholar] [CrossRef] [Scilit] [PubMed]
  10. Castro, B.B.A.; Reno, P.F.; Pereira, B.F.; Arriel, K.; Bonato, F.B.; Colugnati, F.A.B.; Cenedeze, M.A.; Saraiva-Camara, N.O.; Sanders-Pinheiro, H. Fenofibrate attenuates renal lipotoxicity in uninephrectomized mice with high-fat diet-induced obesity. J. Bras. Nefrol. 2024, 46, e20230148. [Google Scholar] [CrossRef] [Scilit] [PubMed]
  11. Rebholz, C.M.; Coresh, J.; Grams, M.E.; Steffen, L.M.; Anderson, C.A.; Appel, L.J.; Crews, D.C. Dietary Acid Load and Incident Chronic Kidney Disease: Results from the ARIC Study. Am. J. Nephrol. 2015, 42, 427–435. [Google Scholar] [CrossRef] [Scilit] [PubMed]
  12. Scialla, J.J.; Anderson, C.A. Dietary acid load: A novel nutritional target in chronic kidney disease? Adv. Chronic Kidney Dis. 2013, 20, 141–149. [Google Scholar] [CrossRef] [Scilit] [PubMed]
  13. Williamson, M.; Moustaid-Moussa, N.; Gollahon, L. The Molecular Effects of Dietary Acid Load on Metabolic Disease (The Cellular PasaDoble: The Fast-Paced Dance of pH Regulation). Front. Mol. Med. 2021, 1, 777088. [Google Scholar] [CrossRef] [Scilit] [PubMed]
  14. Goraya, N.; Madias, N.E.; Simoni, J.; Kahlon, M.; Aksan, N.; Wesson, D.E. Randomized Trial of Dietary Acid Reduction and Acid-Base Status of Patients with CKD and Normal Estimated GFR. Kidney Int. Rep. 2025, 10, 355–374. [Google Scholar] [CrossRef] [Scilit] [PubMed]
  15. Barr, B.R.; Subramaniyan, I.; Li, L.; Levitt, D.E.; Gollahon, L.S. Ammonium Hydroxide Enhancement of Dietary Protein in High-Fat Diets Modulates Liver Metabolism Signaling in a Sex- and Age-Dependent Manner in C3H/HeJ Mice. Int. J. Mol. Sci. 2025, 27, 403. [Google Scholar] [CrossRef] [Scilit] [PubMed]
  16. Boren, C.; Barr, B.; Mubtasim, N.; Gollahon, L. Adipocytokine Protein Expression from Visceral Fat Differs Significantly Based on Diet, Sex, and Age in C3H/HeJ Mice Fed Long-Term, High-Fat Diets, ± Ammonium-Hydroxide-Supplemented Dietary Protein. Curr. Issues Mol. Biol. 2025, 47, 218. [Google Scholar] [CrossRef] [Scilit] [PubMed]
  17. Garrison, E.C.; Brown, A.M.V.; Salazar, M.M.; Barr, B.; Moustaid-Moussa, N.; Gollahon, L.S. Microbiome Taxonomic and Functional Differences in C3H/HeJ Mice Fed a Long-Term High-Fat Diet with Beef Protein ± Ammonium Hydroxide Supplementation. Nutrients 2024, 16, 1613. [Google Scholar] [CrossRef] [Scilit] [PubMed]
  18. Montoya-Torres, B.; Kaur, A.; Barr, B.; Garrison, E.; Brashears, M.M.; Brown, A.M.V.; Gollahon, L.S. Microbiome Taxonomic and Functional Differences in C3H/HeJ Mice Fed a Long-Term High-Fat Diet with Casein Protein ± Ammonium Hydroxide Supplementation. Dietetics 2026, 5, 13. [Google Scholar] [CrossRef] [Scilit]
  19. Mubtasim, N.; Barr, B.; Boren, C.; Gollahon, L. Effects of Aging on Secreted Adipocytokines in Visceral Fat of Female C3H/HeJ Mice Consuming a Long-Term High-Fat Diet. Dietetics 2024, 3, 191–213. [Google Scholar] [CrossRef] [Scilit]
  20. Menikdiwela, K.R.; Guimarães, J.P.T.; Scoggin, S.; Gollahon, L.S.; Moustaid-Moussa, N. Dietary pH Enhancement Improves Metabolic Outcomes in Diet-Induced Obese Male and Female Mice: Effects of Beef vs. Casein Proteins. Nutrients 2022, 14, 2583. [Google Scholar] [CrossRef] [Scilit] [PubMed]
  21. Roth, E. Method for Modifying pH Within Meat Products. U.S. Patent No. 7,022,361, 4 April 2006. [Google Scholar]
  22. Clementi, A.; Virzì, G.M.; Sorbello, M.; Marzano, N.; Monciino, P.; Cabrera-Aguilar, J.S.; Battaglia, G.G.; Ronco, C.; Zanella, M. Hepato-Renal Crosstalk in Acute and Chronic Disease: From Shared Pathways to Therapeutic Targets. Biomedicines 2025, 13, 1618. [Google Scholar] [CrossRef] [Scilit] [PubMed]
  23. Capalbo, O.; Giuliani, S.; Ferrero-Fernández, A.; Casciato, P.; Musso, C.G. Kidney-liver pathophysiological crosstalk: Its characteristics and importance. Int. Urol. Nephrol. 2019, 51, 2203–2207. [Google Scholar] [CrossRef] [Scilit] [PubMed]
  24. Weiner, I.D.; Verlander, J.W. Renal ammonia metabolism and transport. Compr. Physiol. 2013, 3, 201–220. [Google Scholar] [CrossRef] [Scilit] [PubMed]
  25. Bhargava, P.; Schnellmann, R.G. Mitochondrial energetics in the kidney. Nat. Rev. Nephrol. 2017, 13, 629–646. [Google Scholar] [CrossRef] [Scilit] [PubMed]
  26. Forbes, J.M.; Thorburn, D.R. Mitochondrial dysfunction in diabetic kidney disease. Nat. Rev. Nephrol. 2018, 14, 291–312. [Google Scholar] [CrossRef] [Scilit] [PubMed]
  27. Arabi, T.; Shafqat, A.; Sabbah, B.N.; Ashraf, N.; Shah, H.; Abdulkader, H.; Razak, A.; Sabbah, A.N.; Arabi, Z. Obesity-related kidney disease: Beyond hypertension and insulin-resistance. Front. Endocrinol. 2022, 13, 1095211. [Google Scholar] [CrossRef] [Scilit] [PubMed]
  28. Kadatane, S.P.; Satariano, M.; Massey, M.; Mongan, K.; Raina, R. The Role of Inflammation in CKD. Cells 2023, 12, 1581. [Google Scholar] [CrossRef] [Scilit] [PubMed]
  29. Liu, T.; Zhang, L.; Joo, D.; Sun, S.-C. NF-κB signaling in inflammation. Signal Transduct. Target. Ther. 2017, 2, 17023. [Google Scholar] [CrossRef] [Scilit] [PubMed]
  30. Alhamar, G.; Razafiarison, J.; Alzaid, F.; Al-Mulla, F.; Ahmad, R. Toll Like Receptor 4: A Potential Link Between Obesity and Metabolic Diseases. Obes. Rev. 2026, 27, e70107. [Google Scholar] [CrossRef] [Scilit] [PubMed]
  31. Grande, M.T.; Pérez-Barriocanal, F.; López-Novoa, J.M. Role of inflammation in túbulo-interstitial damage associated to obstructive nephropathy. J. Inflamm. 2010, 7, 19. [Google Scholar] [CrossRef] [Scilit] [PubMed]
  32. Petruliene, K.; Zilinskiene, A.; Vaiciuniene, R.; Vaiciunas, K.; Bumblyte, I.A.; Dalinkeviciene, E. Obesity and Its Clinical Implications in End-Stage Kidney Disease. Medicina 2026, 62, 211. [Google Scholar] [CrossRef] [Scilit] [PubMed]
  33. Andres-Hernando, A.; Lanaspa, M.A.; Kuwabara, M.; Orlicky, D.J.; Cicerchi, C.; Bales, E.; Garcia, G.E.; Roncal-Jimenez, C.A.; Sato, Y.; Johnson, R.J. Obesity causes renal mitochondrial dysfunction and energy imbalance and accelerates chronic kidney disease in mice. Am. J. Physiol.-Ren. Physiol. 2019, 317, F941–F948. [Google Scholar] [CrossRef] [Scilit] [PubMed]
  34. Galvan, D.L.; Green, N.H.; Danesh, F.R. The hallmarks of mitochondrial dysfunction in chronic kidney disease. Kidney Int. 2017, 92, 1051–1057. [Google Scholar] [CrossRef] [Scilit] [PubMed]
  35. Rovira-Llopis, S.; Bañuls, C.; Diaz-Morales, N.; Hernandez-Mijares, A.; Rocha, M.; Victor, V.M. Mitochondrial dynamics in type 2 diabetes: Pathophysiological implications. Redox Biol. 2017, 11, 637–645. [Google Scholar] [CrossRef] [Scilit] [PubMed]
  36. Sun, Y.; Ge, X.; Li, X.; He, J.; Wei, X.; Du, J.; Sun, J.; Li, X.; Xun, Z.; Liu, W.; et al. High-fat diet promotes renal injury by inducing oxidative stress and mitochondrial dysfunction. Cell Death Dis. 2020, 11, 914. [Google Scholar] [CrossRef] [Scilit] [PubMed]
  37. Tang, C.; Cai, J.; Yin, X.M.; Weinberg, J.M.; Venkatachalam, M.A.; Dong, Z. Mitochondrial quality control in kidney injury and repair. Nat. Rev. Nephrol. 2021, 17, 299–318. [Google Scholar] [CrossRef] [Scilit] [PubMed]
  38. Shao, N.; Wang, J.; Liu, J.; Zhang, J.; Zhang, B.; Sun, X.; Liu, X. Mitochondrial Dynamics in Diabetic Kidney Disease: Underlying Mechanisms and Novel Therapeutics. Int. J. Mol. Sci. 2026, 27, 2429. [Google Scholar] [CrossRef] [Scilit] [PubMed]
  39. Fontecha-Barriuso, M.; Martin-Sanchez, D.; Martinez-Moreno, J.M.; Monsalve, M.; Ramos, A.M.; Sanchez-Niño, M.D.; Ruiz-Ortega, M.; Ortiz, A.; Sanz, A.B. The Role of PGC-1α and Mitochondrial Biogenesis in Kidney Diseases. Biomolecules 2020, 10, 347. [Google Scholar] [CrossRef] [Scilit] [PubMed]
  40. Zhang, X.; Agborbesong, E.; Li, X. The Role of Mitochondria in Acute Kidney Injury and Chronic Kidney Disease and Its Therapeutic Potential. Int. J. Mol. Sci. 2021, 22, 11253. [Google Scholar] [CrossRef] [Scilit] [PubMed]
  41. Xie, J.H.; Li, Y.Y.; Jin, J. The essential functions of mitochondrial dynamics in immune cells. Cell. Mol. Immunol. 2020, 17, 712–721. [Google Scholar] [CrossRef] [Scilit] [PubMed]
  42. Bhatia, D.; Capili, A.; Choi, M.E. Mitochondrial dysfunction in kidney injury, inflammation, and disease: Potential therapeutic approaches. Kidney Res. Clin. Pr. 2020, 39, 244–258. [Google Scholar] [CrossRef] [Scilit] [PubMed]
  43. Weiner, I.D.; Verlander, J.W. Role of NH3 and NH4+ transporters in renal acid-base transport. Am. J. Physiol. Ren. Physiol. 2011, 300, F11–F23. [Google Scholar] [CrossRef] [Scilit] [PubMed]
  44. Weiner, I.D.; Verlander, J.W. Ammonia Transporters and Their Role in Acid-Base Balance. Physiol. Rev. 2017, 97, 465–494. [Google Scholar] [CrossRef] [Scilit] [PubMed]
  45. Harris, A.N.; Skankar, M.; Melanmed, M.; Batlle, D. An Update on Kidney Ammonium Transport Along the Nephron. Adv. Kidney Dis. Health 2023, 30, 189–196. [Google Scholar] [CrossRef] [Scilit] [PubMed]
  46. Barr, B.; Gollahon, L. The Effects of Obesity on Sex, Aging, and Cancer Development in a Longitudinal Study of High-Fat-Diet-Fed C3H/HeJ Mice. Obesities 2024, 4, 314–328. [Google Scholar] [CrossRef] [Scilit]
  47. Rao, X.; Huang, X.; Zhou, Z.; Lin, X. An improvement of the 2ˆ(-delta delta CT) method for quantitative real-time polymerase chain reaction data analysis. Biostat. Bioinforma Biomath. 2013, 3, 71–85. [Google Scholar] [PubMed]
  48. Furth, S.L.; Colhoun, H.M.; Kanbay, M.; Kukla, A.; Lim, L.-L.; MacLaughlin, H.L.; Navaneethan, S.D.; Shroff, R.; Stenvinkel, P.; Cheung, M.; et al. The relationship between obesity and chronic kidney disease: Conclusions from a Kidney Disease: Improving Global Outcomes (KDIGO) Controversies Conference. Kidney Int. 2026, 109, 442–464. [Google Scholar] [CrossRef] [Scilit] [PubMed]
  49. Prasad, R.; Jha, R.K.; Keerti, A. Chronic Kidney Disease: Its Relationship with Obesity. Cureus 2022, 14, e30535. [Google Scholar] [CrossRef] [Scilit] [PubMed]
  50. Papier, K.; Hartman, L.; Tong, T.Y.N.; Key, T.J.; Knuppel, A. Higher Meat Intake Is Associated with Higher Inflammatory Markers, Mostly Due to Adiposity: Results from UK Biobank. J. Nutr. 2022, 152, 183–189. [Google Scholar] [CrossRef] [Scilit] [PubMed]
  51. Kounatidis, D.C.; Evangelopoulos, A.; Dimitriou, K.; Vallianou, N.G. Ultra-Processed Foods and Chronic Kidney Disease: Is Inflammaging the Missing Link? Biomolecules 2026, 16, 660. [Google Scholar] [CrossRef] [Scilit] [PubMed]
  52. Owens, E.P.; Vesey, D.A.; Kassianos, A.J.; Healy, H.; Hoy, W.E.; Gobe, G.C. Biomarkers and the role of mast cells as facilitators of inflammation and fibrosis in chronic kidney disease. Transl. Androl. Urol. 2019, 8, S175–S183. [Google Scholar] [CrossRef] [Scilit] [PubMed]
  53. Goraya, N.; Wesson, D.E. Pathophysiology of Diet-Induced Acid Stress. Int. J. Mol. Sci. 2024, 25, 2336. [Google Scholar] [CrossRef] [Scilit] [PubMed]
  54. Reuter, S.; Gupta, S.C.; Chaturvedi, M.M.; Aggarwal, B.B. Oxidative stress, inflammation, and cancer: How are they linked? Free Radic. Biol. Med. 2010, 49, 1603–1616. [Google Scholar] [CrossRef] [Scilit] [PubMed]
  55. Priante, G.; Gianesello, L.; Ceol, M.; Del Prete, D.; Anglani, F. Cell Death in the Kidney. Int. J. Mol. Sci. 2019, 20, 3598. [Google Scholar] [CrossRef] [Scilit] [PubMed]
  56. Burlaka, I.; Nilsson, L.M.; Scott, L.; Holtbäck, U.; Eklöf, A.-C.; Fogo, A.B.; Brismar, H.; Aperia, A. Prevention of apoptosis averts glomerular tubular disconnection and podocyte loss in proteinuric kidney disease. Kidney Int. 2016, 90, 135–148. [Google Scholar] [CrossRef] [Scilit] [PubMed]
  57. Gooz, M. Mitochondria—An old-new link in the progression of renal disease. Ren. Fail. 2025, 47, 2602986. [Google Scholar] [CrossRef] [Scilit] [PubMed]
  58. Zhang, Y.; Lv, L.; Zhou, Z.; Zhang, H.; Li, Q.; Yang, S.; Wen, Y.; Wang, Q.; Feng, J.; Lu, W.; et al. Piezo1 facilitates the initiation and progression of renal fibrosis by mediating cell apoptosis and mitochondrial dysfunction. Ren. Fail. 2024, 46, 2415519. [Google Scholar] [CrossRef] [Scilit] [PubMed]
  59. Silva Ramos, E.; Larsson, N.G.; Mourier, A. Bioenergetic roles of mitochondrial fusion. Biochim. Biophys. Acta 2016, 1857, 1277–1283. [Google Scholar] [CrossRef] [Scilit] [PubMed]
  60. Doblado, L.; Lueck, C.; Rey, C.; Samhan-Arias, A.K.; Prieto, I.; Stacchiotti, A.; Monsalve, M. Mitophagy in Human Diseases. Int. J. Mol. Sci. 2021, 22, 3903. [Google Scholar] [CrossRef] [Scilit] [PubMed]
  61. Saxena, S.; Mathur, A.; Kakkar, P. Critical role of mitochondrial dysfunction and impaired mitophagy in diabetic nephropathy. J. Cell. Physiol. 2019, 234, 19223–19236. [Google Scholar] [CrossRef] [Scilit] [PubMed]
  62. Ishihara, M.; Urushido, M.; Hamada, K.; Matsumoto, T.; Shimamura, Y.; Ogata, K.; Inoue, K.; Taniguchi, Y.; Horino, T.; Fujieda, M.; et al. Sestrin-2 and BNIP3 regulate autophagy and mitophagy in renal tubular cells in acute kidney injury. Am. J. Physiol. Ren. Physiol. 2013, 305, F495–F509. [Google Scholar] [CrossRef] [Scilit] [PubMed]
  63. Duan, P.; Tan, J.; Miao, Y.; Zhang, Q. PINK1/Parkin-Mediated Mitophagy Plays a Protective Role in Albumin Overload-Induced Renal Tubular Cell Injury. Front. Biosci. 2022, 27, 184. [Google Scholar] [CrossRef] [Scilit] [PubMed]
  64. Wesson, D.E.; Buysse, J.M.; Bushinsky, D.A. Mechanisms of Metabolic Acidosis–Induced Kidney Injury in Chronic Kidney Disease. J. Am. Soc. Nephrol. 2020, 31, 469–482. [Google Scholar] [CrossRef] [Scilit] [PubMed]
  65. Kim, H.-Y. Renal Handling of Ammonium and Acid Base Regulation. Electrolyte Blood Press. 2009, 7, 9–13. [Google Scholar] [CrossRef] [Scilit] [PubMed]
  66. Lee, H.W.; Verlander, J.W.; Bishop, J.M.; Nelson, R.D.; Handlogten, M.E.; Weiner, I.D. Effect of intercalated cell-specific Rh C glycoprotein deletion on basal and metabolic acidosis-stimulated renal ammonia excretion. Am. J. Physiol. Ren. Physiol. 2010, 299, F369–F379. [Google Scholar] [CrossRef] [Scilit] [PubMed]
  67. Banerjee, T.; Crews, D.C.; Wesson, D.E.; Tilea, A.M.; Saran, R.; Ríos-Burrows, N.; Williams, D.E.; Powe, N.R. High Dietary Acid Load Predicts ESRD among Adults with CKD. J. Am. Soc. Nephrol. 2015, 26, 1693–1700. [Google Scholar] [CrossRef] [Scilit] [PubMed]
  68. Hall, M.E.; do Carmo, J.M.; da Silva, A.A.; Juncos, L.A.; Wang, Z.; Hall, J.E. Obesity, hypertension, and chronic kidney disease. Int. J. Nephrol. Renov. Dis. 2014, 7, 75–88. [Google Scholar] [CrossRef] [Scilit] [PubMed]
  69. Mashayekhi, M.; Zuckerman, J.E.; Koubar, S.H.; Wu, J.; Qing, J.; Abdipour, A.; Lerma, E.; Peters, W.; Norouzi, S. Obesity-related glomerulopathy, A growing kidney burden in the obesity pandemic. Clin. Exp. Nephrol. 2026, 30, 363–372. [Google Scholar] [CrossRef] [Scilit] [PubMed]
  70. Declèves, A.E.; Sharma, K. Obesity and kidney disease: Differential effects of obesity on adipose tissue and kidney inflammation and fibrosis. Curr. Opin. Nephrol. Hypertens. 2015, 24, 28–36. [Google Scholar] [CrossRef] [Scilit] [PubMed]
  71. Chevalier, R.L. The proximal tubule is the primary target of injury and progression of kidney disease: Role of the glomerulotubular junction. Am. J. Physiol. Ren. Physiol. 2016, 311, F145–F161. [Google Scholar] [CrossRef] [Scilit] [PubMed]
  72. Bourgeois, S.; Houillier, P. State of knowledge on ammonia handling by the kidney. Pflüg. Arch.-Eur. J. Physiol. 2024, 476, 517–531. [Google Scholar] [CrossRef] [Scilit] [PubMed]
Figure 1. Conceptual relationship between inflammation, mitochondrial dynamics, cellular metabolism, and kidney health. Inflammatory signaling and mitochondrial dynamics are bidirectionally connected processes that influence renal cellular metabolism. Increased inflammatory cytokines may impair mitochondrial homeostasis, while altered mitochondrial fusion, fission, and biogenesis may contribute to cellular dysfunction and kidney injury. This schematic highlights the relevance of the inflammation–mitochondrial dynamics axis as a conceptual framework for the renal molecular pathways evaluated in the present study. Image Created in BioRender. Deshmukh, H. (2026) https://BioRender.com/jt18cgp (accessed on 18 August 2026).
Dietetics 05 00054 g001
Figure 4. AHE modulates renal mitochondrial biogenesis and fusion-associated protein expression. Representative (A) Western blots and densitometric analyses of mitochondrial biogenesis- and fusion-related proteins in kidney tissues from mice fed control casein with ammonium hydroxide enhancement (CCN), control casein (CC), high-fat beef with ammonium hydroxide enhancement (HFBN), high-fat beef (HFB), high-fat casein with ammonium hydroxide enhancement (HFCN), or high-fat casein (HFC) diets. Protein expression is shown for (B) peroxisome proliferator-activated receptor gamma coactivator 1-alpha (PGC1α), (C) mitofusin-2 (MFN2), (D) optic atrophy protein 1 (OPA1), and (E) mitochondrial transcription factor A (TFAM). Protein expression was normalized to β-actin and expressed as relative densitometric units. Data are presented as mean ± SEM. Statistical significance was determined using one-way ANOVA followed by Fisher’s least significant difference (LSD) multiple comparisons test. * p ≤ 0.05.
Dietetics 05 00054 g004
Figure 5. AHE modulates renal mitochondrial fission-associated protein expression. Representative Western blots and densitometric analyses of mitochondrial fission-related proteins in kidney tissues from mice fed control casein with ammonium hydroxide enhancement (CCN), control casein (CC), high-fat beef with ammonium hydroxide enhancement (HFBN), high-fat beef (HFB), high-fat casein with ammonium hydroxide enhancement (HFCN), or high-fat casein (HFC) diets. Protein expression is shown for (A) mitochondrial fission protein 1 (FIS1) and (B) dynamin-related protein 1 (DRP1). Protein expression was normalized to β-actin and expressed as relative densitometric units. Data are presented as mean ± SEM. Statistical significance was determined using one-way ANOVA followed by Fisher’s least significant difference (LSD) multiple comparisons test. * p ≤ 0.05.
Dietetics 05 00054 g005
Figure 6. AHE modulates renal mitophagy-associated protein expression. Representative (A) Western blots and densitometric analyses of mitophagy-related proteins in kidney tissues from mice fed control casein with ammonium hydroxide enhancement (CCN), control casein (CC), high-fat beef with ammonium hydroxide enhancement (HFBN), high-fat beef (HFB), high-fat casein with ammonium hydroxide enhancement (HFCN), or high-fat casein (HFC) diets. Protein expression is shown for (B) PTEN-induced kinase 1 (PINK1) and (C) Parkin. Protein expression was normalized to β-actin and expressed as relative densitometric units. Data are presented as mean ± SEM. Statistical significance was determined using one-way ANOVA followed by Fisher’s least significant difference (LSD) multiple comparisons test. * p ≤ 0.05.
Dietetics 05 00054 g006
Figure 9. Conceptual summary of renal molecular and histomorphometric changes associated with dietary ammonium hydroxide enhancement (AHE) in male C3H/HeJ mice. Dietary AHE was associated with changes in the expression of renal inflammatory and apoptosis-associated markers, mitochondrial biogenesis-, fusion-, fission-, and mitophagy-associated markers, and the ammonia transporters RHBG and RHCG. Histomorphometric analyses further demonstrated AHE-associated alterations in renal tubular morphology. The schematic integrates the observed molecular and histological findings and does not represent an experimentally established sequential or causal mechanism. Figure 9 was created in BioRender. Deshmukh, H. (2026) https://BioRender.com/jt18cgp (accessed on 18 August 2026).
Dietetics 05 00054 g009
Table 1. List of primers for mRNA analysis of genes of interest.
GeneForwardReverse
TLR45′-TTG CAT CTG GCT GGG ACT CTG-3′5′-TTC AGG GGG TTG AAG CTC AGA T-3′
NFkB5′-CCT CCA CCC CGA CGT ATT GC-3′5′-GCC AAG GCC TGG TTT GAG AT-3′
TNFα5′-GAA CTC CAG GCG GTG TCT GT-3′5′-CTG AGT GTG AGG GTC TGG GC-3′
IL1β5′-ATG TCT TGC CCG TGG AGC TT-3′5′-ATG GGT CAG ACA GCA CGA GG-3′
RHBG5′-GCCGTGTATCAGCTCTTCGGAA-3′5′-AACCTGGTCCTCGAAGCATTGG-3′
RHCG5′-CAGTTCCTTCCACGGAGATGCC-3′5′-AAGCGTGGCATTCTGGATGTGC-3′
B-actin5′-ACA ACC TTC TTG CAG CTC CTC C-3′5′-TGA CCC ATA CCC ACC ATC ACA-3′
Table 2. Summary of antibody dilutions and conditions used in western blot analysis.
Primary AntibodySpeciesDilutionVendorSecondary AntibodyDilutionVendor
NFkBRabbit polyclonal1:1000Cell Signaling Technology, Inc., Danvers, MA, USAGoat anti-rabbit HRP1:2000Cell Signaling Technology, Inc., Danvers, MA, USA
TNFαRabbit polyclonal1:1000Abcam, Cambridge, MA, USAGoat anti-rabbit HRP1:2000Cell Signaling Technology, Inc., Danvers, MA, USA
TLR4Mouse Monoclonal1:1000Novus Biological, Littleton, CO, USARabbit anti mouse HRP1:10,000Abcam, Cambridge, MA, USA
IL6Mouse Monoclonal1:1000Invitrogen, Carlsbad, CA, USARabbit anti mouse HRP1:10,000Abcam, Cambridge, MA, USA
Caspase 3Rabbit polyclonal1:1000Bioss Antibodies, Woburn, MA, USAGoat anti-rabbit HRP1:2000Cell Signaling Technology, Inc., Danvers, MA, USA
P53Rabbit polyclonal1:1000Abcam, Cambridge, MA, USAGoat anti-rabbit HRP1:2000Cell Signaling Technology, Inc., Danvers, MA, USA
BCL2Rabbit Monoclonal1:1000Cell Signaling Technology, Inc., Danvers, MA, USAGoat anti-rabbit HRP1:2000Cell Signaling Technology, Inc., Danvers, MA, USA
MFN2Rabbit polyclonal1:1000Cell Signaling Technology, Inc., Danvers, MA, USAGoat anti-rabbit HRP1:2000Cell Signaling Technology, Inc., Danvers, MA, USA
Opa1Rabbit polyclonal1:1000Novus Biological, Littleton, CO, USAGoat anti-rabbit HRP1:2000Cell Signaling Technology, Inc., Danvers, MA, USA
TFAMRabbit polyclonal1:1000Novus Biological, Littleton, CO, USAGoat anti-rabbit HRP1:2000Cell Signaling Technology, Inc., Danvers, MA, USA
FIS 1Rabbit polyclonal1:1000Protein Tech Group, Inc., Chicago, IL, USAGoat anti-rabbit HRP1:2000Cell Signaling Technology, Inc., Danvers, MA, USA
Drp 1Rabbit polyclonal1:1000Novus Biological, Littleton, CO, USAGoat anti-rabbit HRP1:2000Cell Signaling Technology, Inc., Danvers, MA, USA
Pink 1Rabbit polyclonal1:500Novus Biological, Littleton, CO, USAGoat anti-rabbit HRP1:2000Cell Signaling Technology, Inc., Danvers, MA, USA
Parkin 1Mouse polyclonal 1:500Novus Biological, Littleton, CO, USAGoat anti-rabbit HRP1:2000Cell Signaling Technology, Inc., Danvers, MA, USA
RHBGRabbit polyclonal1:1000Thermo Fisher Scientific, Inc., Waltham, MA, USAGoat anti-rabbit HRP1:2000Cell Signaling Technology, Inc., Danvers, MA, USA
RHCGRabbit polyclonal1:1000Bioss Antibodies, Woburn, MA, USAGoat anti-rabbit HRP1:2000Cell Signaling Technology, Inc., Danvers, MA, USA
B-actinMouse Monoclonal1:2000Millipore Sigma
(Burlington, MA, USA)
Horse anti-mouse HRP1:2000Cell Signaling Technology, Inc., Danvers, MA, USA
Disclaimer/Publisher’s Note: The statements, opinions and data contained in all publications are solely those of the individual author(s) and contributor(s) and not of MDPI and/or the editor(s). MDPI and/or the editor(s) disclaim responsibility for any injury to people or property resulting from any ideas, methods, instructions or products referred to in the content.