
Monitoring the Mineral Content of Plant Foods in Food Composition Databases


Abstract
1. Introduction
2. Materials and Methods
2.1. Food Composition Databases
2.2. Food Matching
2.3. Data Analysis
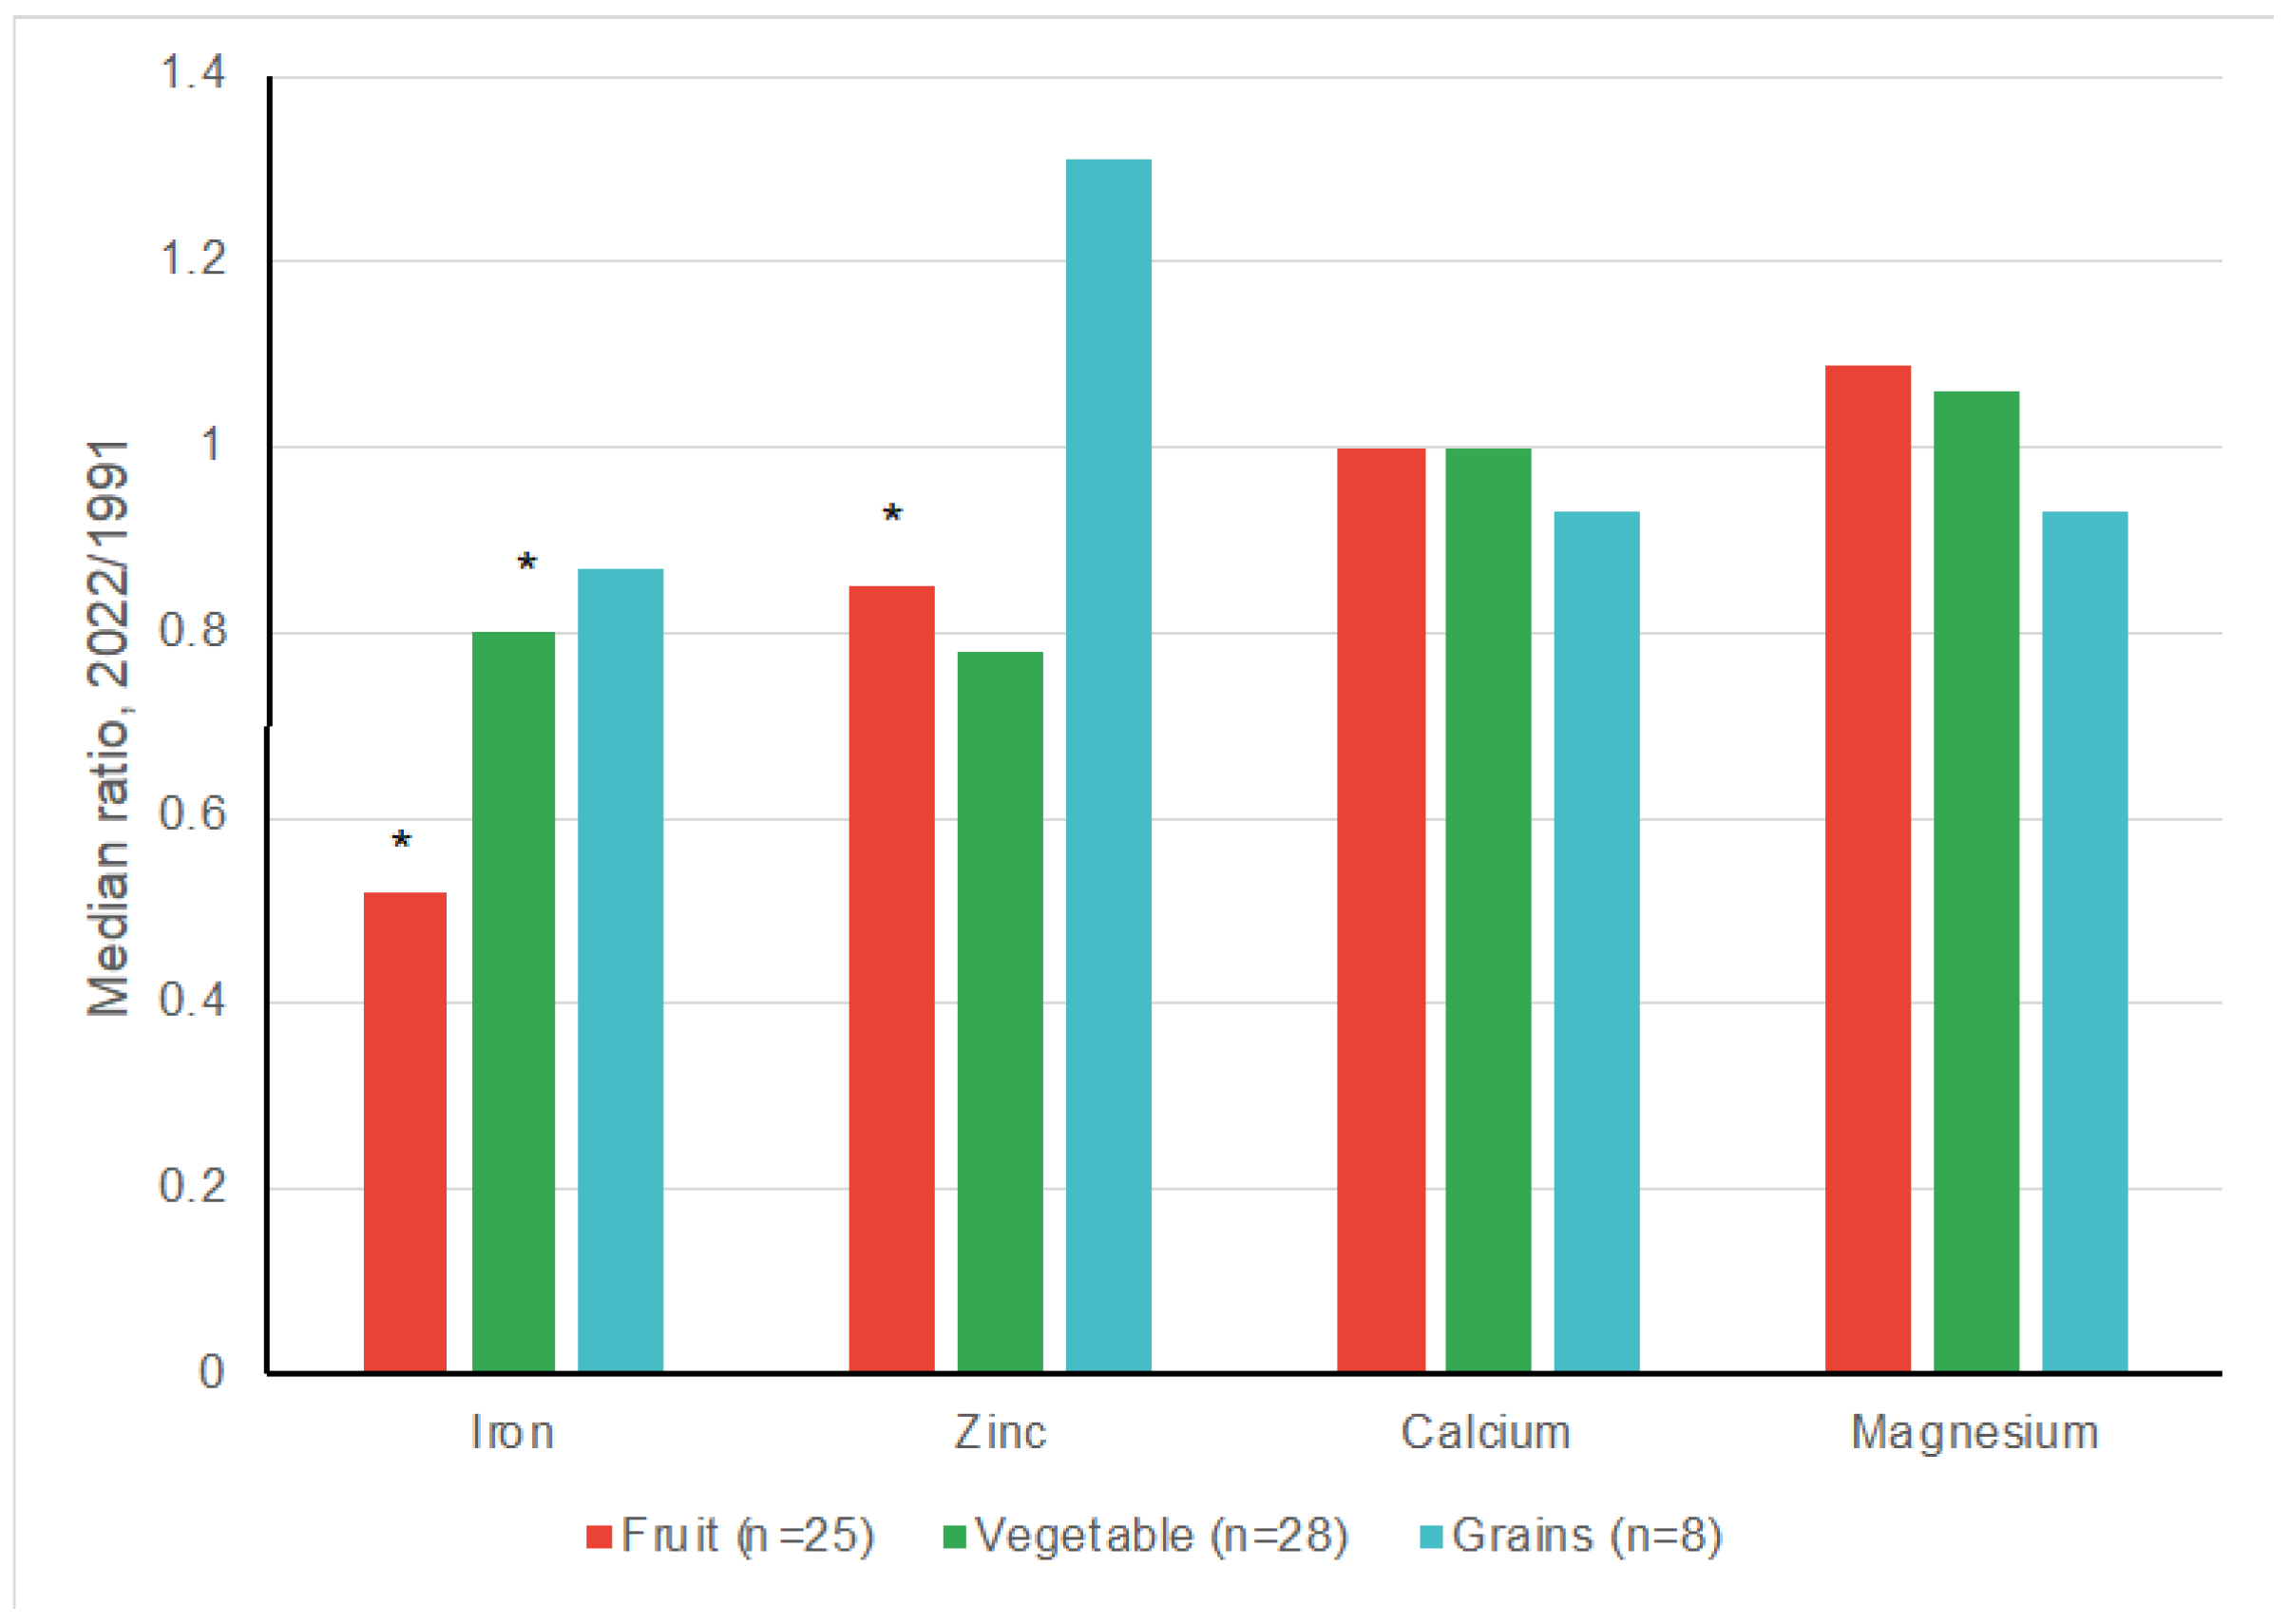
3. Results
3.1. Iron Content

| Iron Content, mg/100 g | Ratio | Difference | |||
|---|---|---|---|---|---|
| 1991 | 2010 | 2022 | 2022/1991 | 2022-1991 | |
| Fruit | |||||
| Apple, Unspec, Red Skin, Raw, Unpeeled | 0.2 | 0.03 | 0.03 | 0.15 | −0.17 |
| Apple, Granny Smith, Raw, Unpeeled | 0.2 | 0.16 | 0.16 | 0.80 | −0.04 |
| Apricot, Raw, Unpeeled | 0.3 | 0.3 | 0.28 | 0.93 | −0.02 |
| Banana, Cavendish, Raw, Peeled | 0.5 | 0.29 | 0.29 | 0.58 | −0.21 |
| Cherry, Raw | 0.3 | 0.28 | 0.28 | 0.93 | −0.02 |
| Grape, Black/Red Unspec (Red Globe) | 0.2 | 0.42 | 0.42 | 2.10 | 0.22 |
| Grape, Green, Unspec (Thompson) | 0.2 | 0.28 | 0.36 | 1.80 | 0.16 |
| Grapefruit, Raw, Peeled | 0.2 | 0.2 | 0.2 | 1.00 | 0.00 |
| Kiwifruit, Green (Hayward), Peeled, Raw | 0.5 | 0.26 | 0.26 | 0.52 | −0.24 |
| Mandarin, Unspec, Raw, Peeled | 0.3 | 0 | 0 | 0.00 | −0.30 |
| Mango, Raw, Peeled | 0.5 | 0.17 | 0.17 | 0.34 | −0.33 |
| Nectarine, Raw | 0.1 | 0.13 | 0 | 0.00 | −0.10 |
| Orange, Navel, Raw, Peeled | 0.4 | 0 | 0 | 0.00 | −0.40 |
| Orange, Valencia, Raw, Peeled | 0.4 | 0 | 0 | 0.00 | −0.40 |
| Orange, Unspec | 0.4 | 0 | 0 | 0.00 | −0.40 |
| Peach, Raw | 0.2 | 0.26 | 0 | 0.00 | −0.20 |
| Pear, Packhams Triumph, Raw, Unpeeled | 0.2 | 0.06 | 0.06 | 0.30 | −0.14 |
| Pear, Williams Bartlett, Raw | 0.2 | 0.15 | 0.15 | 0.75 | −0.05 |
| Pear, Unspec, (Green Skin) | 0.2 | 0 | 0 | 0.00 | −0.20 |
| Pineapple, Raw, Peeled | 0.3 | 0.25 | 0 | 0.00 | −0.30 |
| Plum, Red Flesh, Raw | 0.3 | 0.22 | 0.22 | 0.73 | −0.08 |
| Rockmelon, Raw, Peeled | 0.3 | 0.24 | 0.24 | 0.80 | −0.06 |
| Strawberry, Raw | 0.6 | 0.55 | 0.55 | 0.92 | −0.05 |
| Tangerine, Raw, Peeled | 0.3 | 0.2 | 0.2 | 0.67 | −0.10 |
| Watermelon, Raw, Peeled | 0.4 | 0.1 | 0.1 | 0.25 | −0.30 |
| All fruit, median | 0.3 | 0.2 | 0.16 | 0.52 | −0.14 |
| Vegetable | |||||
| Avocado, Hass, Raw * | 0.7 | 0.49 | 0.49 | 0.70 | −0.21 |
| Bean, Green, Raw | 1.0 | 0.69 | 0.69 | 0.69 | −0.31 |
| Broccoli, Raw | 1.0 | 0.84 | 0.84 | 0.84 | −0.16 |
| Cabbage, White | 0.6 | 0.46 | 0.46 | 0.77 | −0.14 |
| Capsicum, Green * | 0.7 | 0.53 | 0.23 | 0.33 | −0.47 |
| Capsicum, Red | 0.3 | 0.3 | 0.28 | 0.93 | −0.02 |
| Carrot, Mature, Peeled, Fresh, Raw | 0.3 | 0.24 | 0.24 | 0.80 | −0.06 |
| Cauliflower, Fresh, Raw | 0.6 | 0.32 | 0.32 | 0.53 | −0.28 |
| Celery, Raw | 0.2 | 0.25 | 0.25 | 1.25 | 0.05 |
| Cucumber, Common, Raw, Unpeeled | 0.1 | 0.22 | 0.22 | 2.20 | 0.12 |
| Cucumber, Lebanese, Raw, Unpeeled | 0.3 | 0.27 | 0.27 | 0.90 | −0.03 |
| Leek, Fresh, Raw | 0.7 | 0.7 | 0.7 | 1.00 | 0.00 |
| Lettuce, Cos, Raw | 0.7 | 0.7 | 0.7 | 1.00 | 0.00 |
| Lettuce, Iceberg | 0.6 | 0.55 | 0.26 | 0.43 | −0.34 |
| Lettuce, Mignonette, Raw | 1.1 | 1.1 | 1.1 | 1.00 | 0.00 |
| Mushroom, Common, Raw | 0.2 | 0.45 | 0.45 | 2.25 | 0.25 |
| Parsnip, Raw, Peeled | 0.3 | 0.3 | 0.3 | 1.00 | 0.00 |
| Pea, Green, Raw | 1.8 | 1.8 | 1.8 | 1.00 | 0.00 |
| Potato, Pale Skin, Raw, Peeled | 0.6 | 0.45 | 0.45 | 0.75 | −0.15 |
| Potato, Red Skin, Raw, Peeled | 0.5 | 0.24 | 0.24 | 0.48 | −0.26 |
| Pumpkin, Butternut, Raw, Peele | 0.4 | 0.32 | 0.32 | 0.80 | −0.08 |
| Pumpkin, Unspec, Raw, Peeled | 0.5 | 0.39 | 0.27 | 0.54 | −0.23 |
| Onion, Mature, Brown Skin, Raw, Peeled | 0.4 | 0.24 | 0.24 | 0.60 | −0.16 |
| Onion, Mature, White Skin, Raw, Peeled | 0.4 | 0.29 | 0.29 | 0.73 | −0.11 |
| Sweet Corn, On Cob | 2.1 | 1.2 | 1.2 | 0.57 | −0.90 |
| Tomato, Cherry, Raw | 0.5 | 0.5 | 0.63 | 1.26 | 0.13 |
| Tomato, Common, Raw | 0.3 | 0.23 | 0.23 | 0.77 | −0.07 |
| Zucchini, Green Skin, Unpeeled, Raw | 0.6 | 0.5 | 0.5 | 0.83 | −0.10 |
| All vegetables, medians | 0.55 | 0.45 | 0.32 | 0.80 | −0.09 |
| Grains | |||||
| Barley, Pearl, Raw | 2.7 | 2.2 | 2.2 | 0.81 | −0.50 |
| Bulgur, Dry | 3.1 | 2.5 | 2.5 | 0.81 | −0.60 |
| Flour, Rice | 0.2 | 0.5 | 0.5 | 2.50 | 0.30 |
| Flour, Wheat, White, Plain | 1.3 | 1.2 | 1.2 | 0.92 | −0.10 |
| Flour, Wheat, Wholemeal, Plain | 3.0 | 3.0 | 2.8 | 0.93 | −0.20 |
| Oats, Rolled, Raw | 3.7 | 3.5 | 3.5 | 0.95 | −0.20 |
| Rice, White, Raw | 0.7 | 0.2 | 0.2 | 0.29 | −0.50 |
| Rice, Brown, Raw | 1.2 | 0.8 | 0.8 | 0.67 | −0.40 |
| All grains, median | 2.0 | 1.7 | 1.7 | 0.87 | −0.30 |
| Nuts | |||||
| Almond, With Skin Raw | 3.9 | 3.75 | 3.75 | 0.96 | −0.15 |
3.2. Zinc Content
| Zinc Content, mg/100 g | Ratio | Difference | |||
|---|---|---|---|---|---|
| 1991 | 2010 | 2022 | 2022/1991 | 2022-1991 | |
| Fruit | |||||
| Apple, Unspec, Red Skin, Raw, Unpeeled | 0.1 | 0.03 | 0.03 | 0.30 | −0.07 |
| Apple, Granny Smith, Raw, Unpeeled | 0.1 | 0.07 | 0.07 | 0.70 | −0.03 |
| Apricot, Raw, Unpeeled | 0.2 | 0.15 | 0.14 | 0.70 | −0.06 |
| Banana, Cavendish, Raw, Peeled | 0.2 | 0.16 | 0.1 | 0.50 | −0.10 |
| Cherry, Raw | 0.1 | 0.1 | 0.1 | 1.00 | 0.00 |
| Grape, Black/Red Unspec (Red Globe) | 0.1 | 0.22 | 0.22 | 2.20 | 0.12 |
| Grape, Green, Unspec (Thompson) | 0.1 | 0.08 | 0.04 | 0.40 | −0.06 |
| Grapefruit, Raw, Peeled | 0.1 | 0.1 | 0.1 | 1.00 | 0.00 |
| Kiwifruit, Green (Hayward), Peeled, Raw | 0.2 | 0.11 | 0.1 | 0.50 | −0.10 |
| Mandarin, Unspec, Raw, Peeled | 0.1 | 0.06 | 0.06 | 0.60 | −0.04 |
| Mango, Raw, Peeled | 0.3 | 0.07 | 0.07 | 0.23 | −0.23 |
| Nectarine, Raw | 0.1 | 0.11 | 0.13 | 1.30 | 0.03 |
| Orange, Navel, Raw, Peeled | 0.2 | 0.07 | 0.07 | 0.35 | −0.13 |
| Orange, Valencia, Raw, Peeled | 0.2 | 0.07 | 0.07 | 0.35 | −0.13 |
| Orange, Unspec | 0.2 | 0.07 | 0.07 | 0.35 | −0.13 |
| Peach, Raw | 0.1 | 0.11 | 0.1 | 1.00 | 0.00 |
| Pear, Packhams Triumph, Raw, Unpeeled | 0.1 | 0.09 | 0.09 | 0.90 | −0.01 |
| Pear, Williams Bartlett, Raw | 0.1 | 0.1 | 0.1 | 1.00 | 0.00 |
| Pear, Unspec, (Green Skin) | 0.1 | 0.09 | 0.09 | 0.90 | −0.01 |
| Pineapple, Raw, Peeled | 0.2 | 0.1 | 0.17 | 0.85 | −0.03 |
| Plum, Red Flesh, Raw | 0.1 | 0.1 | 0.1 | 1.00 | 0.00 |
| Rockmelon, Raw, Peeled | 0.1 | 0.12 | 0.12 | 1.20 | 0.02 |
| Strawberry, Raw | 0.2 | 0.18 | 0.18 | 0.90 | −0.02 |
| Tangerine, Raw, Peeled | 0.1 | 0.1 | 0.1 | 1.00 | 0.00 |
| Watermelon, Raw, Peeled | 0.4 | 0.06 | 0.06 | 0.15 | −0.34 |
| All fruit, median | 0.1 | 0.1 | 0.10 | 0.85 | −0.03 |
| Vegetable | |||||
| Avocado, Hass, Raw * | 0.5 | 0.53 | 0.53 | 1.06 | 0.03 |
| Bean, Green, Raw | 0.7 | 0.27 | 0.27 | 0.39 | −0.43 |
| Broccoli, Raw | 0.7 | 0.6 | 0.6 | 0.86 | −0.10 |
| Cabbage, White | 0.3 | 0.23 | 0.23 | 0.77 | −0.07 |
| Capsicum, Green * | 0.3 | 0.18 | 0.11 | 0.37 | −0.19 |
| Capsicum, Red | 0.4 | 0.2 | 0.13 | 0.33 | −0.27 |
| Carrot, Mature, Peeled, Fresh, Raw | 0.2 | 0.17 | 0.17 | 0.85 | −0.03 |
| Cauliflower, Fresh, Raw | 0.3 | 0.2 | 0.2 | 0.67 | −0.10 |
| Celery, Raw | 0.3 | 0.21 | 0.21 | 0.70 | −0.09 |
| Cucumber, Common, Raw, Unpeeled | 0.2 | 0.18 | 0.18 | 0.90 | −0.02 |
| Cucumber, Lebanese, Raw, Unpeeled | 0.2 | 0.16 | 0.16 | 0.80 | −0.04 |
| Leek, Fresh, Raw | 0.3 | 0.3 | 0.3 | 1.00 | 0.00 |
| Lettuce, Cos, Raw | 0.5 | 0.31 | 0.31 | 0.62 | −0.19 |
| Lettuce, Iceberg | 0.2 | 0.2 | 0.21 | 1.05 | 0.01 |
| Lettuce, Mignonette, Raw | 0.4 | 0.28 | 0.28 | 0.70 | −0.12 |
| Mushroom, Common, Raw | 0.2 | 0.06 | 0.06 | 0.30 | −0.14 |
| Parsnip, Raw, Peeled | 0.4 | 0.4 | 0.4 | 1.00 | 0.00 |
| Pea, Green, Raw | 1 | 1.05 | 1.05 | 1.05 | 0.05 |
| Potato, Pale Skin, Raw, Peeled | 0.4 | 0.21 | 0.21 | 0.53 | −0.19 |
| Potato, Red Skin, Raw, Peeled | 0.4 | 0.28 | 0.28 | 0.70 | −0.12 |
| Pumpkin, Butternut, Raw, Peele | 0.1 | 0.16 | 0.16 | 1.60 | 0.06 |
| Pumpkin, Unspec, Raw, Peeled | 0.2 | 0.21 | 0.16 | 0.80 | −0.04 |
| Onion, Mature, Brown Skin, Raw, Peeled | 0.1 | 0.2 | 0.2 | 2.00 | 0.10 |
| Onion, Mature, White Skin, Raw, Peeled | 0.3 | 0.22 | 0.22 | 0.73 | −0.08 |
| Sweet Corn, On Cob | 0.8 | 0.45 | 0.45 | 0.56 | −0.35 |
| Tomato, Cherry, Raw | 0.2 | 0.15 | 0.16 | 0.80 | −0.04 |
| Tomato, Common, Raw | 0.2 | 0.12 | 0.12 | 0.60 | −0.08 |
| Zucchini, Green Skin, Unpeeled, Raw | 0.3 | 0.33 | 0.33 | 1.10 | 0.03 |
| All vegetables, median | 0.30 | 0.21 | 0.21 | 0.78 | −0.08 |
| Grains | |||||
| Barley, Pearl, Raw | 0.9 | 1.2 | 1.2 | 1.33 | 0.30 |
| Bulgur, Dry | 1.6 | 3 | 3 | 1.88 | 1.40 |
| Flour, Rice | 1.1 | 1.45 | 1.45 | 1.32 | 0.35 |
| Flour, Wheat, White, Plain | 0.5 | 0.84 | 0.84 | 1.68 | 0.34 |
| Flour, Wheat, Wholemeal, Plain | 1.3 | 1.3 | 1.7 | 1.31 | 0.40 |
| Oats, Rolled, Raw | 1.9 | 2.35 | 2.35 | 1.24 | 0.45 |
| Rice, White, Raw | 1.1 | 1.2 | 1.2 | 1.09 | 0.10 |
| Rice, Brown, Raw | 2.1 | 1.7 | 1.7 | 0.81 | −0.40 |
| All grains, median | 1.20 | 1.38 | 1.58 | 1.31 | 0.35 |
| Nuts | |||||
| Almond, With Skin Raw | 3.8 | 3.63 | 3.63 | 0.96 | −0.17 |
3.3. Calcium Content
| Calcium Content, mg/100 g | Ratio | Difference | |||
|---|---|---|---|---|---|
| 1991 | 2010 | 2022 | 2022/1991 | 2022-1991 | |
| Fruit | |||||
| Apple, Unspec, Red Skin, Raw, Unpeeled | 5 | 5 | 5 | 1.00 | 0 |
| Apple, Granny Smith, Raw, Unpeeled | 5 | 5 | 5 | 1.00 | 0 |
| Apricot, Raw, Unpeeled | 16 | 16 | 13 | 0.81 | −3 |
| Banana, Cavendish, Raw, Peeled | 5 | 5 | 5 | 1.00 | 0 |
| Cherry, Raw | 26 | 22 | 22 | 0.85 | −4 |
| Grape, Black/Red Unspec (Red Globe) | 9 | 10 | 10 | 1.11 | 1 |
| Grape, Green, Unspec (Thompson) | 12 | 13 | 10 | 0.83 | −2 |
| Grapefruit, Raw, Peeled | 21 | 21 | 21 | 1.00 | 0 |
| Kiwifruit, Green (Hayward), Peeled, Raw | 24 | 28 | 28 | 1.17 | 4 |
| Mandarin, Unspec, Raw, Peeled | 26 | 29 | 29 | 1.12 | 3 |
| Mango, Raw, Peeled | 7 | 9 | 9 | 1.29 | 2 |
| Nectarine, Raw | 8 | 9 | 9 | 1.13 | 1 |
| Orange, Navel, Raw, Peeled | 25 | 23 | 23 | 0.92 | −2 |
| Orange, Valencia, Raw, Peeled | 32 | 23 | 23 | 0.72 | −9 |
| Orange, Unspec | 29 | 23 | 23 | 0.79 | −6 |
| Peach, Raw | 6 | 5 | 5 | 0.83 | −1 |
| Pear, Packhams Triumph, Raw, Unpeeled | 4 | 8 | 8 | 2.00 | 4 |
| Pear, Williams Bartlett, Raw | 6 | 6 | 6 | 1.00 | 0 |
| Pear, Unspec, (Green Skin) | 5 | 8 | 8 | 1.60 | 3 |
| Pineapple, Raw, Peeled | 27 | 20 | 9 | 0.33 | −18 |
| Plum, Red Flesh, Raw | 7 | 7 | 7 | 1.00 | 0 |
| Rockmelon, Raw, Peeled | 7 | 7 | 7 | 1.00 | 0 |
| Strawberry, Raw | 13 | 22 | 22 | 1.69 | 9 |
| Tangerine, Raw, Peeled | 42 | 26 | 26 | 0.62 | −16 |
| Watermelon, Raw, Peeled | 6 | 5 | 5 | 0.83 | −1 |
| All fruit, median | 9.0 | 10.0 | 9.0 | 1.00 | 0 |
| Vegetable | |||||
| Avocado, Hass, Raw * | 20 | 10 | 10 | 0.50 | −10 |
| Bean, Green, Raw | 42 | 45 | 45 | 1.07 | 3 |
| Broccoli, Raw | 31 | 32 | 32 | 1.03 | 1 |
| Cabbage, White | 33 | 32 | 32 | 0.97 | −1 |
| Capsicum, Green * | 8 | 8 | 6 | 0.75 | −2 |
| Capsicum, Red | 2 | 4 | 7 | 3.50 | 5 |
| Carrot, Mature, Peeled, Fresh, Raw | 31 | 26 | 26 | 0.84 | −5 |
| Cauliflower, Fresh, Raw | 14 | 18 | 18 | 1.29 | 4 |
| Celery, Raw | 36 | 44 | 44 | 1.22 | 8 |
| Cucumber, Common, Raw, Unpeeled | 12 | 18 | 18 | 1.50 | 6 |
| Cucumber, Lebanese, Raw, Unpeeled | 63 | 42 | 42 | 0.67 | −21 |
| Leek, Fresh, Raw | 33 | 33 | 33 | 1.00 | 0 |
| Lettuce, Cos, Raw | 20 | 20 | 20 | 1.00 | 0 |
| Lettuce, Iceberg | 16 | 18 | 18 | 1.13 | 2 |
| Lettuce, Mignonette, Raw | 20 | 20 | 20 | 1.00 | 0 |
| Mushroom, Common, Raw | 2 | 3 | 3 | 1.50 | 1 |
| Parsnip, Raw, Peeled | 38 | 38 | 38 | 1.00 | 0 |
| Pea, Green, Raw | 31 | 30 | 30 | 0.97 | −1 |
| Potato, Pale Skin, Raw, Peeled | 3 | 3 | 3 | 1.00 | 0 |
| Potato, Red Skin, Raw, Peeled | 4 | 6 | 6 | 1.50 | 2 |
| Pumpkin, Butternut, Raw, Peele | 23 | 18 | 18 | 0.78 | −5 |
| Pumpkin, Unspec, Raw, Peeled | 29 | 24 | 19 | 0.66 | −10 |
| Onion, Mature, Brown Skin, Raw, Peeled | 18 | 23 | 23 | 1.28 | 5 |
| Onion, Mature, White Skin, Raw, Peeled | 19 | 26 | 26 | 1.37 | 7 |
| Sweet Corn, On Cob | 22 | 16 | 16 | 0.73 | −6 |
| Tomato, Cherry, Raw | 11 | 11 | 14 | 1.27 | 3 |
| Tomato, Common, Raw | 8 | 11 | 11 | 1.38 | 3 |
| Zucchini, Green Skin, Unpeeled, Raw | 19 | 18 | 18 | 0.95 | −1 |
| All vegetables, median | 20.0 | 19.0 | 18.5 | 1.00 | 0 |
| Grains | |||||
| Barley, Pearl, Raw | 22 | 28 | 28 | 1.27 | 6 |
| Bulgur, Dry | 24 | 30 | 30 | 1.25 | 6 |
| Flour, Rice | 7 | 6 | 6 | 0.86 | −1 |
| Flour, Wheat, White, Plain | 18 | 21 | 21 | 1.17 | 3 |
| Flour, Wheat, Wholemeal, Plain | 30 | 30 | 29 | 0.97 | −1 |
| Oats, Rolled, Raw | 45 | 40 | 40 | 0.89 | −5 |
| Rice, White, Raw | 7 | 4 | 4 | 0.57 | −3 |
| Rice, Brown, Raw | 11 | 7 | 7 | 0.64 | −4 |
| All grains, median | 20.0 | 24.5 | 24.5 | 0.93 | −1 |
| Nuts | |||||
| Almond, With Skin Raw | 250 | 265 | 265 | 1.06 | 15 |
3.4. Magnesium Content
| Magnesium Content, mg/100 g | Ratio | Difference | |||
|---|---|---|---|---|---|
| 1991 | 2010 | 2022 | 2022/1991 | 2022-1991 | |
| Fruit | |||||
| Apple, Unspec, Red Skin, Raw, Unpeeled | 4 | 4 | 5 | 1.25 | 1 |
| Apple, Granny Smith, Raw, Unpeeled | 4 | 4 | 4 | 1.00 | 0 |
| Apricot, Raw, Unpeeled | 9 | 9 | 12 | 1.33 | 3 |
| Banana, Cavendish, Raw, Peeled | 19 | 31 | 31 | 1.63 | 12 |
| Cherry, Raw | 10 | 8 | 6 | 0.60 | −4 |
| Grape, Black/Red Unspec (Red Globe) | 9 | 8 | 8 | 0.89 | −1 |
| Grape, Green, Unspec (Thompson) | 12 | 12 | 8 | 0.67 | −4 |
| Grapefruit, Raw, Peeled | 8 | 8 | 8 | 1.00 | 0 |
| Kiwifruit, Green (Hayward), Peeled, Raw | 17 | 15 | 15 | 0.88 | −2 |
| Mandarin, Unspec, Raw, Peeled | 11 | 13 | 13 | 1.18 | 2 |
| Mango, Raw, Peeled | 7 | 10 | 10 | 1.43 | 3 |
| Nectarine, Raw | 7 | 7 | 9 | 1.29 | 2 |
| Orange, Navel, Raw, Peeled | 11 | 12 | 12 | 1.09 | 1 |
| Orange, Valencia, Raw, Peeled | 11 | 12 | 12 | 1.09 | 1 |
| Orange, Unspec | 11 | 12 | 12 | 1.09 | 1 |
| Peach, Raw | 6 | 8 | 8 | 1.33 | 2 |
| Pear, Packhams Triumph, Raw, Unpeeled | 6 | 7 | 7 | 1.17 | 1 |
| Pear, Williams Bartlett, Raw | 7 | 7 | 7 | 1.00 | 0 |
| Pear, Unspec, (Green Skin) | 6 | 7 | 7 | 1.17 | 1 |
| Pineapple, Raw, Peeled | 11 | 16 | 15 | 1.36 | 4 |
| Plum, Red Flesh, Raw | 6 | 6 | 6 | 1.00 | 0 |
| Rockmelon, Raw, Peeled | 4 | 8 | 8 | 2.00 | 4 |
| Strawberry, Raw | 8 | 8 | 8 | 1.00 | 0 |
| Tangerine, Raw, Peeled | 11 | 9 | 9 | 0.82 | −2 |
| Watermelon, Raw, Peeled | 4 | 12 | 12 | 3.00 | 8 |
| All (median) | 8 | 8 | 8 | 1.09 | 1 |
| Vegetable | |||||
| Avocado, Hass, Raw * | 23 | 26 | 26 | 1.13 | 3 |
| Bean, Green, Raw | 25 | 24 | 24 | 0.96 | −1 |
| Broccoli, Raw | 22 | 21 | 21 | 0.95 | −1 |
| Cabbage, White | 15 | 14 | 14 | 0.93 | −1 |
| Capsicum, Green * | 9 | 10 | 10 | 1.11 | 1 |
| Capsicum, Red | 2 | 6 | 10 | 5.00 | 8 |
| Carrot, Mature, Peeled, Fresh, Raw | 10 | 12 | 12 | 1.20 | 2 |
| Cauliflower, Fresh, Raw | 13 | 16 | 16 | 1.23 | 3 |
| Celery, Raw | 7 | 10 | 10 | 1.43 | 3 |
| Cucumber, Common, Raw, Unpeeled | 13 | 14 | 14 | 1.08 | 1 |
| Cucumber, Lebanese, Raw, Unpeeled | 11 | 10 | 10 | 0.91 | −1 |
| Leek, Fresh, Raw | 14 | 14 | 14 | 1.00 | 0 |
| Lettuce, Cos, Raw | 13 | 13 | 13 | 1.00 | 0 |
| Lettuce, Iceberg | 8 | 10 | 9 | 1.13 | 1 |
| Lettuce, Mignonette, Raw | 13 | 13 | 13 | 1.00 | 0 |
| Mushroom, Common, Raw | 9 | 11 | 11 | 1.22 | 2 |
| Parsnip, Raw, Peeled | 24 | 24 | 24 | 1.00 | 0 |
| Pea, Green, Raw | 30 | 33 | 33 | 1.10 | 3 |
| Potato, Pale Skin, Raw, Peeled | 19 | 19 | 19 | 1.00 | 0 |
| Potato, Red Skin, Raw, Peeled | 19 | 20 | 20 | 1.05 | 1 |
| Pumpkin, Butternut, Raw, Peele | 16 | 17 | 17 | 1.06 | 1 |
| Pumpkin, Unspec, Raw, Peeled | 12 | 11 | 16 | 1.33 | 4 |
| Onion, Mature, Brown Skin, Raw, Peeled | 4 | 12 | 12 | 3.00 | 8 |
| Onion, Mature, White Skin, Raw, Peeled | 12 | 12 | 12 | 1.00 | 0 |
| Sweet Corn, On Cob | 13 | 12 | 12 | 0.92 | −1 |
| Tomato, Cherry, Raw | 12 | 12 | 14 | 1.17 | 2 |
| Tomato, Common, Raw | 10 | 10 | 10 | 1.00 | 0 |
| Zucchini, Green Skin, Unpeeled, Raw | 15 | 16 | 16 | 1.07 | 1 |
| All vegetables, median | 13 | 13 | 14 | 1.06 | 1 |
| Grains | |||||
| Barley, Pearl, Raw | 90 | 95 | 95 | 1.06 | 5 |
| Bulgur, Dry | 108 | 83 | 83 | 0.77 | −25 |
| Flour, Rice | 52 | 70 | 70 | 1.35 | 18 |
| Flour, Wheat, White, Plain | 34 | 36 | 36 | 1.06 | 2 |
| Flour, Wheat, Wholemeal, Plain | 102 | 102 | 89 | 0.87 | −13 |
| Oats, Rolled, Raw | 130 | 104 | 104 | 0.80 | −26 |
| Rice, White, Raw | 34 | 20 | 20 | 0.59 | −14 |
| Rice, Brown, Raw | 120 | 119 | 119 | 0.99 | −1 |
| All grains, median | 96 | 89 | 86 | 0.92 | −7 |
| Nuts | |||||
| Almond, With Skin Raw | 260 | 266 | 266 | 1.02 | −1 |
4. Discussion
5. Conclusions
Author Contributions
Funding
Institutional Review Board Statement
Informed Consent Statement
Data Availability Statement
Conflicts of Interest
References
- Craig, W.J.; Mangels, A.R.; Fresán, U.; Marsh, K.; Miles, F.L.; Saunders, A.V.; Haddad, E.H.; Heskey, C.E.; Johnston, P.; Larson-Meyer, E.; et al. The Safe and Effective Use of Plant-Based Diets with Guidelines for Health Professionals. Nutrients 2021, 13, 4144. [Google Scholar] [CrossRef]
- Miki, A.J.; Livingston, K.A.; Karlsen, M.C.; Folta, S.C.; McKeown, N.M. Using Evidence Mapping to Examine Motivations for Following Plant-Based Diets. Curr. Dev. Nutr. 2020, 4, nzaa013. [Google Scholar] [CrossRef] [PubMed]
- Neilsen, I.Q. Plant-Based Food Options Are Sprouting Growth for Retailers. Available online: https://nielseniq.com/global/en/insights/analysis/2018/plant-based-food-options-are-sprouting-growth-for-retailers/ (accessed on 20 September 2023).
- Sanders, T.A.B. Vegan/vegetarian diet. In Human Nutrition, 14th ed.; Geissler, C., Powers, H., Eds.; Oxford University Press: Oxford, UK, 2023; pp. 375–386. [Google Scholar]
- Roy Morgan Research. Rise in Vegetarianism Not Halting the March of Obesity. Available online: https://www.roymorgan.com (accessed on 20 August 2023).
- United Nations. Sustainable Development Goals. Take Action for the Sustainable Development Goals. Available online: https://www.un.org/sustainabledevelopment/sustainable-development-goals/ (accessed on 15 April 2023).
- FAO/WHO. Sustainable Healthy Diets—Guiding Principles. Available online: https://www.who.int/publications/i/item/9789241516648 (accessed on 15 April 2023).
- Willett, W.; Rockström, J.; Loken, B.; Springmann, M.; Lang, T.; Vermeulen, S.; Garnett, T.; Tilman, D.; DeClerck, F.; Wood, A.; et al. Food in the Anthropocene: The EAT–Lancet Commission on healthy diets from sustainable food systems. Lancet 2019, 393, 447–492. [Google Scholar] [CrossRef]
- Australian Bureau of Statistics; Food Standards Australia New Zealand. Australian Health Survey: Usual Nutrient Intakes, 2011–2012; 4364.0.55.008; Australian Bureau of Statistics: Canberra, Australia, 2015.
- Gibbs, J.; Cappuccio, F.P. Common Nutritional Shortcomings in Vegetarians and Vegans. Dietetics 2024, 3, 114–128. [Google Scholar] [CrossRef]
- Neufingerl, N.; Eilander, A. Nutrient Intake and Status in Adults Consuming Plant-Based Diets Compared to Meat-Eaters: A Systematic Review. Nutrients 2021, 14, 29. [Google Scholar] [CrossRef]
- Hunt, J.R. Moving toward a plant-based diet: Are iron and zinc at risk? Nutr. Rev. 2002, 60, 127–134. [Google Scholar] [CrossRef]
- Foster, M.; Samman, S. Vegetarian diets across the lifecycle: Impact on zinc intake and status. Adv. Food Nutr. Res. 2015, 74, 93–131. [Google Scholar] [CrossRef]
- Gibson, R.S.; Heath, A.L.; Szymlek-Gay, E.A. Is iron and zinc nutrition a concern for vegetarian infants and young children in industrialized countries? Am. J. Clin. Nutr. 2014, 100 (Suppl. S1), 459s–468s. [Google Scholar] [CrossRef] [PubMed]
- Rangan, A.M.; Aitkin, I.; Blight, G.D.; Binns, C.W. Factors affecting iron status in 15-30 year old female students. Asia Pac. J. Clin. Nutr. 1997, 6, 291–295. [Google Scholar]
- Mayer, A.-M. Historical changes in the mineral content of fruits and vegetables. Br. Food J. 1997, 99, 5. [Google Scholar] [CrossRef]
- Mayer, A.B.; Trenchard, L.; Rayns, F. Historical changes in the mineral content of fruit and vegetables in the UK from 1940 to 2019: A concern for human nutrition and agriculture. Int. J. Food Sci. Nutr. 2022, 73, 315–326. [Google Scholar] [CrossRef] [PubMed]
- Davis, D.R. Declining Fruit and Vegetable Nutrient Composition: What Is the Evidence? HortScience 2009, 44, 15–19. [Google Scholar] [CrossRef]
- Davis, D.R.; Epp, M.D.; Riordan, H.D. Changes in USDA Food Composition Data for 43 Garden Crops, 1950 to 1999. J. Am. Coll. Nutr. 2004, 23, 669–682. [Google Scholar] [CrossRef] [PubMed]
- Davis, D. Impact of breeding and yield on fruit, vegetable, and grain nutrient content. In Breeding for Fruit Quality; Jenks, M., Bebeli, P., Eds.; Wiley-Blackwell: New York, NY, USA, 2011; pp. 127–150. [Google Scholar]
- Fan, M.-S.; Zhao, F.-J.; Fairweather-Tait, S.J.; Poulton, P.R.; Dunham, S.J.; McGrath, S.P. Evidence of decreasing mineral density in wheat grain over the last 160 years. J. Trace Elem. Med. Biol. 2008, 22, 315–324. [Google Scholar] [CrossRef]
- Fan, M.S.; Zhao, F.J.; Poulton, P.R.; McGrath, S.P. Historical changes in the concentrations of selenium in soil and wheat grain from the Broadbalk experiment of the last 160 years. Sci. Total. Environ. 2008, 389, 532–538. [Google Scholar] [CrossRef]
- Marles, R.J. Mineral nutrient composition of vegetables, fruits and grains: The context of reports of apparent historical declines. J. Food Compos. Anal. 2017, 56, 93–103. [Google Scholar] [CrossRef]
- Semba, R.D.; Askari, S.; Gibson, S.; Bloem, M.W.; Kraemer, K. The Potential Impact of Climate Change on the Micronutrient-Rich Food Supply. Adv. Nutr. 2022, 13, 80–100. [Google Scholar] [CrossRef] [PubMed]
- Cunningham, J.H.; Milligan, G.; Trevisan, L. Minerals in Australian Fruits and Vegetables–A Comparison of Levels between the 1980s and 2000; Food Standards Australia New Zealand: Canberra, Australia, 2002; p. 16.
- Eberl, E.; Li, A.S.; Zheng, Z.Y.J.; Cunningham, J.; Rangan, A. Temporal Change in Iron Content of Vegetables and Legumes in Australia: A Scoping Review. Foods 2021, 11, 56. [Google Scholar] [CrossRef]
- Cheung, Y.L.; Zheng, B.; Rehman, Y.; Zheng, Z.Y.J.; Rangan, A. Iron Content of Wheat and Rice in Australia: A Scoping Review. Foods 2024, 13, 547. [Google Scholar] [CrossRef]
- Southgate, D.A.T. Data Quality in Sampling, Analysis, and Compilation. J. Food Compos. Anal. 2002, 15, 507–513. [Google Scholar] [CrossRef]
- National Food Authority. Nutrient Data Table for Use in Australia: NUTTAB91-92; Australian Government Publishing Service: Canberra, Australia, 1991. [Google Scholar]
- Food Standards Australia New Zealand. NUTTAB 2010-Food Composition Tables; Food Standards Australia New Zealand: Canberra, Australia, 2011.
- Food Standards Australia New Zealand. Australian Food Composition Database–Release 2; FSANZ: Canberra, Australia, 2022.
- Commonwealth Department of Community Services and Health. Composition of Foods, Australia; Australian Government Publishing Service: Canberra, Australia, 1990. [Google Scholar]
- National Food Authority. NUTTAB91-92 Manual; Australian Government Publishing Service: Canberra, Australia, 1991. [Google Scholar]
- Department of Agriculture Fisheries and Forestry. Food. Available online: https://www.agriculture.gov.au/agriculture-land/farm-food-drought/food#:~:text=The%20overwhelming%20majority%20of%20food,and%20supplied%20by%20Australian%20farmers (accessed on 20 September 2023).
- Pennington, J.A.T. Applications of food composition data: Data sources and considerations for use. J. Food Compos. Anal. 2008, 21, S3–S12. [Google Scholar] [CrossRef]
- Wills, R.B.H.; Lim, J.S.K.; Greenfield, H. Composition of Australian foods. 22. Tomato. Food Technol. Aust. 1984, 36, 78–80. [Google Scholar]
- Wills, R.B.H.; Scriven, F.M.; Greenfield, H. Nutrient composition of stone fruit (Prunus spp.) cultivars: Apricot, cherry, nectarine, peach and plum. J. Sci. Food Agric. 1983, 34, 1383–1389. [Google Scholar] [CrossRef] [PubMed]
- Dwivedi, S.L.; Garcia-Oliveira, A.L.; Govindaraj, M.; Ortiz, R. Biofortification to avoid malnutrition in humans in a changing climate: Enhancing micronutrient bioavailability in seed, tuber, and storage roots. Front. Plant Sci. 2023, 14, 1119148. [Google Scholar] [CrossRef] [PubMed]
- Sun, H.; Weaver, C.M. Decreased Iron Intake Parallels Rising Iron Deficiency Anemia and Related Mortality Rates in the US Population. J. Nutr. 2021, 151, 1947–1955. [Google Scholar] [CrossRef]
- Rangan, A.M. Challenges in meeting nutritional requirements. Nutr. Diet. 2016, 73, 401–404. [Google Scholar] [CrossRef]
- Australian Bureau of Statistics. Australian Health Survey: Nutrition First Results-Foods and Nutrients; Australian Bureau of Statistics: Canberra, Australia, 2014.
- Australian Bureau of Statistics. Australian Health Survey: Consumption of Food Groups from the Australian Dietary Guidelines, 2011–2012; 4364.0.55.012; Australian Bureau of Statistics: Canberra, Australia, 2016.
- National Health and Medical Research Council; New Zealand Ministry of Health. Nutrient Reference Values for Australia and New Zealand; NHMRC: Canberra, Australia, 2006.
- National Health and Medical Research Council. Australian Dietary Guidelines Educator Guide; NHMRC: Canberra, Australia, 2013.
- Sui, Z.; Wong, W.K.; Louie, J.C.; Rangan, A. Discretionary food and beverage consumption and its association with demographic characteristics, weight status, and fruit and vegetable intakes in Australian adults. Public Health Nutr. 2017, 20, 274–281. [Google Scholar] [CrossRef]
- National Research Council (US) Subcommittee on Criteria for Dietary Evaluation. Nutrient Adequacy: Assessment Using Food Consumption Surveys. Errors in Nutrient Intake Measurement; National Academies Press: Washington, DC, USA, 1986. [Google Scholar]
Disclaimer/Publisher’s Note: The statements, opinions and data contained in all publications are solely those of the individual author(s) and contributor(s) and not of MDPI and/or the editor(s). MDPI and/or the editor(s) disclaim responsibility for any injury to people or property resulting from any ideas, methods, instructions or products referred to in the content. |
© 2024 by the authors. Licensee MDPI, Basel, Switzerland. This article is an open access article distributed under the terms and conditions of the Creative Commons Attribution (CC BY) license (https://creativecommons.org/licenses/by/4.0/).
Share and Cite
Jenkins, A.; Murthy, D.; Rangan, A. Monitoring the Mineral Content of Plant Foods in Food Composition Databases. Dietetics 2024, 3, 235-248. https://doi.org/10.3390/dietetics3030019
Jenkins A, Murthy D, Rangan A. Monitoring the Mineral Content of Plant Foods in Food Composition Databases. Dietetics. 2024; 3(3):235-248. https://doi.org/10.3390/dietetics3030019
Chicago/Turabian StyleJenkins, Amanda, Diva Murthy, and Anna Rangan. 2024. "Monitoring the Mineral Content of Plant Foods in Food Composition Databases" Dietetics 3, no. 3: 235-248. https://doi.org/10.3390/dietetics3030019
APA StyleJenkins, A., Murthy, D., & Rangan, A. (2024). Monitoring the Mineral Content of Plant Foods in Food Composition Databases. Dietetics, 3(3), 235-248. https://doi.org/10.3390/dietetics3030019