Abstract
Gluten-free products present huge advantages for individuals with gluten intolerance or celiac disease. The most influential strategy to develop a product comparable to wheat-containing gluten products is to promote its nutritional and sensorial attributes. Recently, rice flour and teosinte flour were used to develop gluten-free bread. As a result, this work aimed to compare the physical/technological attributes of bread made with rice flour and teosinte flour with corn fiber fortification and examine consumer acceptance and purchase intent. An extreme vertices mixture design decided that a teosinte flour (43.4%), high protein white rice flour (55%), and high protein brown rice flour (1.6%) ratio of gluten-free flour mixture for bread was best based on the sensory attributes utilized for the desirability function methodology. After optimizing the gluten-free flour mixture, the bread was fortified with corn fiber under 1.7 g and 3.8 g per serving, and it was evaluated to examine its physical/technological attributes, consumer perception, liking, emotions, and purchase intent. Incorporating fiber into gluten-free bread impacted the color and texture, giving lighter and yellower colors with a firmer texture. Likewise, concerning health benefit claims, gluten-free bread with fiber claims only improves the purchase intent and overall liking of bread containing 1.7 g per serving of fiber. The flavor attribute was the main driver for consumers’ purchase decisions. This product could be beneficial for consumers who are seeking fiber in their diet.
Keywords:
teosinte; rice; gluten free; bread; mixture design; fiber; consumer perception; purchase intent 1. Introduction
Celiac disease (CD) is a well-known condition that impacts roughly 1% of the world’s population [1]. As a result, diet and health concerns the development of gluten-free products [2]. A gluten-free diet’s benefits include progressively improving the nutrient content of gluten-free flours and supporting the absorption of nutrients [3]. Celiac disease has no cure, and avoiding gluten is the only solution. Celiac disease consists of activating T-cells in the intestine’s mucosa, which can cause stomachaches when consuming gluten [4]. Every year, the percentage of people on a gluten-free diet who seek quality in texture and flavor like wheat bread increases [5]. Nevertheless, gluten-free bread is a challenge for developers because it does not have a gluten network, which controls the bread’s physical and sensory attributes [6]. The lack of gluten considerably reduces the retention of carbon dioxide that the yeast generates, obtaining a gluten-free bread with low volume and a firm and rough texture [7]. Gluten is beneficial in bread making because it produces an elastic, sticky, and stretchable dough that helps form structures and gas retention [8]. As a result, different ingredients have been used in gluten-free bakery products, such as dairy products, legume proteins, hydrocolloids, gum, prebiotics, starches, and many combinations [9]. Starch is commonly used in food to give visual and texture features. Gelling, texturizing, thickening, adhesion, and moisture retention are some of these qualities [10]. Hydrocolloids can improve the texture, starch retrogradation, moisture retention, and product quality. Among bakery products, wheat bread (WB) is the most consumed staple food for many people worldwide. WB contains gluten protein, including glutenin and gliadin, which are responsible for the dough’s viscoelastic and water absorption properties and fixing fermentation gas in the liquid phase through the fermentation process. Moreover, WB is not rich in lysine, vitamins, and minerals. The higher glycemic index of wheat causes problems for cardiovascular and diabetes patients [11,12]. The replacement of part of gluten flour (WF) with gluten-free flour with a nutritional profile and corn fiber (CF) results in an increase in the nutritional content of bread. As a result, the objective of this work was to obtain gluten-free bread with different types of gluten flours, such as teosinte, brown rice, and white rice, and add corn fiber to analyze and compare its physicochemical and sensory attributes to develop a gluten-free bread that meets similar standards as gluten bread, determining purchase intent and its acceptability through the application of a survey and consumer study.
2. Material and Method
2.1. Experimental Design
The investigation consisted of two phases, where two sensory studies were carried out. In the first sensory study, the bread was prepared, as illustrated in Table 1. The objective of the first sensory study was to optimize the ratios of brown rice flour with a high protein content, white rice with a high protein content, and teosinte flour. For the optimization, Table 1 shows how the experimental design and bread production were conducted based on a simplex centroid mixture design (CSMD). The independent variables were the ratios of brown rice flour with high protein (Frontière), white rice with high protein (Cahokia), and teosinte flour, while the dependent variables included the sensory attributes (overall liking, flavor, texture, aroma, and color) adjusted to the cubic model. The optimization was performed utilizing the desirability function methodology (DOM). The optimization considered the prioritization of sensory characteristics as follows: d (Y1 (Overall Liking), d (Y2 (Flavor), d (Y3 (Texture), d (Y4 (Aroma)), d (Y5 (Color)) where Y = the score (hedonic scale) and d = the desirability. After optimization, the optimized formulation was used considering the corn soluble fiber addition levels (0 g [Control], 1.7 g [T1], and 3.8 g [T2]; Table 2). The objective of the second sensory study was to investigate the physicochemical/technological, liking, emotions, and purchase of the optimized gluten-free bread affected by corn fiber.

Table 1.
Experimental design for bread making with a simplex centroid design.
Table 2.
Preparation of gluten-free bread with corn fiber.
2.2. Preparing the Bread
Gluten-free breads were made with tesosinte flour, high-protein brown rice flour, and white rice flour from the ‘Frontière ‘variety provided by Cahokia Rice (Mc-Clure, IL, USA). The control wheat flour bread (WF) was made with all-purpose and whole wheat flour purchased at a local grocery store. Tapioca flour, xanthan gum, and corn fiber were purchased when shopping at a local store. All other ingredients were obtained at a local supermarket, including yeast, water, sugar, baking powder, salt, eggs, vegetable oil, apple cider vinegar, and lactose-free milk. For gluten-free bread, high-protein brown rice flour (BRF) and white rice flour (WRF) alongside each of the ingredients were weighed. The two types of gluten-free bread had the same formulation except for the rice flour ingredient. The proportion of ingredients was yeast (1.35 g), warm distilled water (49.38 g), sugar (4.11 g), flour mixed with corn fiber (50 g) (Table 1 and Table 2), tapioca flour (22.44 g), baking powder (0.75 g), xanthan gum (1.20 g), salt (2.25 g), eggs (14.97 g), oil (2.25 g) and apple cider vinegar (0.45 g). Sugar was mixed with yeast and water and set aside to activate the yeast until bubbly. In a bowl, vegetable oil, apple cider vinegar, and egg were first mixed by hand and then whisked at speed 2 for 1 min. The dry ingredients were whisked in a mixer (a kitchen aid) and stirred for 30 s at speed 2. Then, the previously prepared yeast and egg blends were added to the dry ingredients. This mixture was then whisked, and the speed was slowly increased to a high speed for 7 min until the ingredients were homogenized to form the dough. Mini loaf pans (15.4 × 8.6 × 4.7 cm) were greased with vegetable oil using a small rubber spatula; the dough with an approximate weight of 150 g was added to each pan, making sure to level the top. The loaf pans were placed in a full-sized Metro proofing cabinet (C599-SDS-U Intermetro Industries Corporation Wilkes-Barre, PA, USA) set at 100 °F and 90% relative humidity for 35 min. After this time, the pans were carefully placed in the center of the rack of a Baxter oven (model OV310 G) and baked for 20 min at 345 °F. Once the breads were cooked, they were removed from the oven and left in the pan for 5 min at room temperature. Then, the bread was removed from the pan and cooled for an hour.
2.3. Physicochemical Characteristics of Bread Optimized Bread
The crust and crumb color of the bread samples were measured with a BC-10 Baking Contrast Meter (Konica Minolta) calibrated using a white calibration tile. The analysis was carried out on three slices of each batch (three loaves) taken from the center of each slice and on the top in three areas. The experiments were performed in triplicates. In each experiment, 3 breads were used for each analysis in 3 regions of the bread (right, center, and left). The texture profile analysis of the crumb was carried out on three slices per loaf taken from the center of each slice—triplicate samples of each treatment were made and cut into three slices. The bread was left to cool for an hour and then cut. Each slice was obtained by cutting the bread transversely with a bread knife and ruler to obtain 2.5 cm thick slices. Texture profile analysis was performed using a TA.XTplusC Texture Analyser equipped with a 50 kg load cell and a 20 cm diameter aluminum cylindrical probe was used in conjunction with the exponent test method for the bread. Height was calibrated for a load cell of 50 Kg. The test parameters were a probe speed of 1.7 mm/s and a time of 5 s to compress the center of the bread crumb to 40% of its original height following the AACC method 74-09-0.1 [13] for the firmness of the bread. TPA (texture profile analysis) was obtained with the following parameters: pre-test speed 2 mm/s, test speed 1.7 mm/s, post-test speed 5 mm/s, and a time of 5 s. The parameters included hardness. Loaf volume was calculated in triplicates, according to the AACC method 10-05.0 [13]. The bread volume was measured using a seed displacement that was allowed to cool for an hour before weighing. The bread loaves were placed in a container, and seeds were poured in until the container was filled. The loaf volume was determined by the amount of seeds displaced by the loaf. The loaf-specific volume (LSV) of bread was then calculated as Equation (1):
LSV = loaf volume (cm3)/Loaf weight (g)
2.4. Consumer Study
The Honduran Association of Physicians-Nutritionists (ASOHMENU) approved the sensory studies with form # AS-ASHOMENU-010-2023. In the first sensory study, 200 novice consumers were gathered. The 9-point hedonic sensory assessment was performed at Universidad Nacional de Agricultura (Honduras); participants were students, faculty, and staff. After 1 day of bread baking, indicators including the color, aroma, taste, texture, and overall linking were evaluated. The sensory study (t = 8, k = 3, r = 7, b = 25) was conducted using a balanced incomplete block design (BIB). In the second sensory study, 120 untrained consumers participated in the consumer, including students, staff, and professors. Each treatment had 120 loave replications. The loaves of bread were cut into 4 slices of 2.5 cm. The attributes evaluated were crumb color, texture, aroma, softness, moistness, flavor, and overall acceptance. Each panelist evaluated the three samples. A 9-hedonic scale was performed to measure the sensory properties of the bread. Purchase intent was evaluated using a yes/no binomial scale. The esSense (calm, happy, good, healthy, pleased, satisfied, wellness, unsafe, and worried) and wellSense term (wellness) terms were obtained from the review [14]. All emotional terms were evaluated using a 5-point hedonic scale [15] (1 = extremely dislike and 5 = extremely like).
Consumers were presented and introduced to the following beneficial information (HBI) statement(s) in Table 2. Once more, consumers evaluated their overall liking, emotion intensities, and purchases after obtaining HBI. For both sensory studies, each panelist received half a slice of each sample, a cup of water, and an unsalted cracker. Panelists were asked to evaluate each sample by visual and physical appearance, overall acceptance, and purchase intent via an online Qualtrics survey. Random three-digit numbers were used for coding.
2.5. Statistical Analysis
The DOM optimization, contour plots, and coefficients of the special cubic model were performed in the Minitab 17 program (2014, Minitab LLC, State College, PA, USA) using the centroid simplex design to check the sensory characteristics of bread. A one-way analysis of variance (ANOVA) and Tukey’s test were used in optimized gluten-free bread to compare fiber treatments with the control samples (bread with no fiber added) on the loaf volume, color (L*, a*, b*), and firmness. The two-sided Cochran’s Q test and the Marascuilo and McSweeney method were used to analyze purchase intent (PI) differences among the formulations. McNemar tests were conducted to compare purchase intent (PI) before and after the HBI was given to consumers. Logistic regression was used to predict the odds of purchase intent based on hedonic responses, formulations, and emotions before and after HBI. Data were examined using the Statistical Analysis Software (SAS) version 9.4 (Statistical Analysis System, Cary, NC, USA).
3. Results and Discussion
3.1. Optimization of Gluten-Free Bread with Sensory Properties
Figure 1 indicates the sensory attribute contour plot according to the 9-point hedonic scale. The highest score of aromas, texture, color, liking, and flavor (Figure 1A–E, respectively) was collected from WRF bread (T3), and the lowest score was recorded for TF (T1). It seems that TF leads to a decrease in the final acceptability for bread, and WRF was the most acceptable treatment (Figure 1). Sensory evaluation in gluten-free bread with 10% freeze-dried rice sourdough had the highest score for taste, and with the addition of the higher content of the rice sourdough texture, acceptability increased [16].
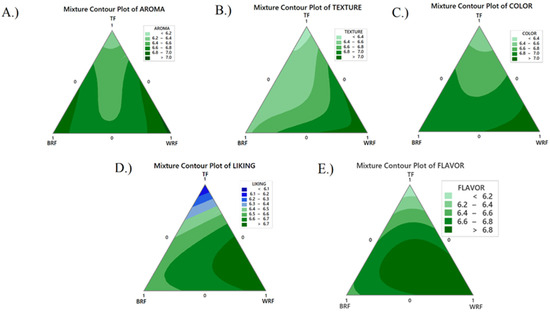
Figure 1.
Effects of ingredients (BRF—high protein brown rice flour, TF—teosinte flour, and WRF—high protein white rice) on sensory properties. Contour plot of sensory attributes (A) aroma, (B) texture, (C) color, (D) liking, and (E) flavor with BRF, TF, and WRF.
Table 3 indicates the significant differences in the sensory evaluation. T3 (7.04 ± 1.44) and T2 (6.95 ± 1.28) had no significant differences with the control sample (regular wheat bread) in the aroma. T7 had no meaningful difference with the control in flavor as well as overall liking. The lowest score in all attributes belonged to T1. T3 (WRF) had the highest score (7.16 ± 1.15) for color among the treatments.
Table 3.
Sensory attributes from the CSMD formulations.
The evaluation of the sensory attributes is shown as a graphic illustration in Figure 2, and the percentage of three sources (TF, BRF, WRF) were optimized for bread using a desirable function, including 43 g/100 g TF, 1.5 g/100 g BRF, and 55 g/100 g WRF. These amounts from each ingredient are close to T5, which was made from 50% TF and 50% WRF with an overall liking of (6.71 ± 1.36). The centroid simplex mixture design (CSM) combination with ANOVA determined the FD values, which predicted that bread with a 50%:50% formulation from TF and WRF had the highest score in overall liking experience for consumers. The TF addition resulted in lower overall linking scores. Nevertheless, when TF was used at 43.4 g/100 g with HPBRF (1.6 g/100 g) and HPWRF (55 g/100 g), it predicted similar overall liking scores to that of wheat flour bread (control) (6.74 vs. 6.84) with a FD value of 0.88.
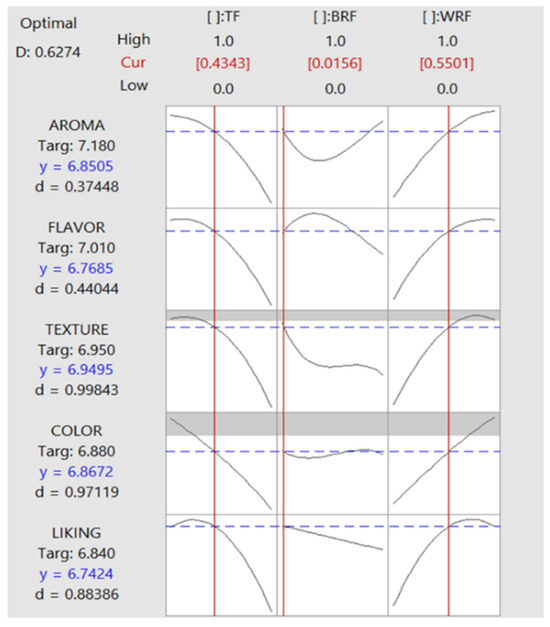
Figure 2.
Desirability optimization (DOM) graph based on sensory attributes. According to DOM, the optimal formulation is 43 g/100 g TF, 1.5 g/100 g BRF, and 55 g/100 g WRF (BRF—high protein brown rice flour, TF—teosinte flour, and WRF—high protein white rice).
3.2. Physico-Chemical of Optimized of Gluten-Free Bread with Fiber
Color is essential for baked products because it indicates texture and aroma. Color depends on the dough’s physicochemical characterization from the interaction of ingredients and baking conditions [17]. The color (on the top) of bread made with fiber was a lighter yellow with lower L* and a* values and higher b* values when compared to the control samples. Typically, a lower L* value indicates a darker crust, whereas a higher b* value correlates to higher crust yellowness. On the other hand, the color at the center of bread made with fiber did not differ from the control samples except for a* values, which were lower. The lighter and yellower color of bread made from fiber could be attributable to the impact of fiber on water distribution, which affects Maillard and caramelization reactions [18]. In this case, for firmness and loaf volume, the results in Table 4 show significant differences among the formulations. The firmness of bread made with fiber was slightly greater, whereas the loaf volume was slightly lower compared to the control samples. In most cases, it is known that the specific volume and moisture content of bread is inversely proportional to the rate of crumb firming [19,20]. Even though the bread with fiber showed a lower loaf volume and higher harness; however, the difference was minimal, and the panelist could not identify the texture difference when the sensory analysis was conducted.
Table 4.
Color and texture properties * of gluten-free (GF) bread made with different corn fiber.
3.3. Sensory Properties and Emotions of Optimized Gluten-Free Bread with Fiber
One of the biggest struggles in the development of gluten-free products is to provide good sensory attributes, especially texture [20]. Table 5 illustrates the consumer liking scores of bread with fiber, which were significantly lower (p < 0.05) than the control bread samples. However, sensory characteristics stood as satisfactory, with likeness scores greater than 5.0. Liking scores for the gluten-free product greater than 6.0 could be considered acceptable [21,22]. Compared to the control samples, the lower color-liking scores for bread with fiber could be due to the lighter yellow color (higher L* and b*). Mahmoud et al. (2013) [23] found similar results where it was concluded that the visual bread characteristics of gluten-free bread affected overall liking [24]. Table 5 shows that purchase intent increased only in bread with a fiber content of 1.7 g per serving after the health benefits were given to the customers. Similarly, liking scores increased in bread with a fiber content of 1.7 g per serving when HBI was given. These results are substantiated by Wardy et al. (2018) [25], who showed that HBI increased the purchase intent with HBI. Petrun et al. (2015) [26] and De Magistris (2020) [27] concluded that customers are willing to pay for health claims rather than nutrition claims.
Table 5.
Mean consumer acceptability scores, overall liking (OL) and purchase intent (PI) A for gluten-free bread.
The effect of bread with fiber and HBI on panelist emotional terms is illustrated in Table 5. Positive emotion scores such as good, happy, pleased, and satisfied and wellness terms decreased after giving health claims. These results indicate that the possible effects of the bread made with claims were compromised due to their less desirable sensory quality (Table 6). Wardy et al. (2018) [25] found that HBI did not affect emotions like unsafe and worried, and emotions could be affected by the product’s liking.
Table 6.
Mean consumer emotion scores A of gluten-free (GF) bread made with corn fiber.
3.4. Purchase Intent Optimized of Gluten-Free Bread with Fiber
Based on the LRA results, purchase intent before (PIB) was meaningful based on moistness and flavor (Table 7). Other studies show that consumers also sensed taste as an essential attribute for purchase intent [22]. After HBI, the emotions “healthy” and “guilty” became meaningful predictors. Hartmann et al. (2018) [28] noted a willingness to spend additionally “free-from” products among those who examined the statement and had a more decisive choice for natural products. Furthermore, Carabante et al. (2018) [29] and Asioli et al. (2017) [30] concluded that the acceptability of the product was improved when customers received health benefit information (HBI). Studies have shown that health consciousness can influence purchase intent [31], and products with less health consciousness can be driven predominantly by flavor or other sensory-related characteristics [32]. For this reason, it is recommended that consumers understand the health benefit information to evade misconceptions. A prior study illustrates a cognitive relationship between guilt and pleasure; consequently, pleasure-related cognitions can be stimulated when the guilt emotion is triggered [33]. This study corroborates that the consumer perception of healthy products is critical to improving acceptance or purchase intent, and it is recommended to fortify gluten-free bread with new food sources and good nutritional profiles.
Table 7.
Combined odds ratio estimates for predicting the purchase intent of gluten-free (GF) bread with fiber after providing health benefit information (HBI).
4. Conclusions
Acceptance among consumers was evaluated in the development of gluten-free bread. After adding fiber, the instrumental color and texture of the gluten-free/natural bread were significantly influenced by lighter and yellower colors and firmer textures. Furthermore, regarding health benefit claims, gluten-free bread with fiber claims only improves the purchase intent in bread containing 1.7 g per serving of fiber. However, positive emotion scores were not improved after the health claims of bread made with fiber were given. Based on the logistic regression analysis (LRA), taste is one of the main drivers for consumers’ purchase decisions. Because this new product is accepted by consumers according to sensory analysis and presents good nutritional characteristics, further progress can be made in marketing it as a new bioproduct with high nutritional importance in the gluten-intolerant population.
Author Contributions
Conceptualization, R.S.A.; methodology, R.S.A.; software, R.S.A.; formal analysis, R.S.A. (Most of the research), S.K., F.D., M.S., M.H.-A., J.A.M.F. and A.Y.; resources, R.S.A. and J.A.M.F.; data curation, R.S.A. and I.M.-F.;writing—original draft preparation, R.S.A. and I.M.-F.; writing—review and editing, R.S.A. and I.M.-F.; project administration, R.S.A. and J.A.M.F.; funding acquisition, R.S.A. and J.A.M.F. All authors have read and agreed to the published version of the manuscript.
Funding
This research was funded by the University National of Agriculture (Honduras) with the International Development Research Center of Canada (IDRC) and the General Secretariat of the Council Central American University Superior (CSUCA) (Ref. C-DSIP-008-2023-UNAG).
Data Availability Statement
Data are contained within the article.
Conflicts of Interest
The authors declare no conflict of interest.
References
- Gujral, N.; Freeman, H.J.; Thomson, A.B. Celiac disease: Prevalence, diagnosis, pathogenesis and treatment. World J. Gastroenterol. 2012, 18, 6036–6059. [Google Scholar] [CrossRef] [PubMed]
- Jnawali, P.; Kumar, V.; Tanwar, B. Celiac disease: Overview and considerations for development of gluten-free foods. Food Sci. Hum. Wellness 2016, 5, 169–176. [Google Scholar] [CrossRef]
- Kulushtayeva, B.; Rebezov, M.; Igenbayev, A.; Kichko, Y.; Burakovskaya, N.; Kulakov, V.; Khayrullin, M. Gluten-free diet: Positive and negative effect on human health. Indian J. Public Health Res. Dev. 2019, 10, 889. [Google Scholar] [CrossRef]
- Sapone, A.; Bai, J.C.; Ciacci, C.; Dolinsek, J.; Green, P.H.; Hadjivassiliou, M.; Fasano, A. Spectrum of gluten-related disorders: Consensus on new nomenclature and classification. BMC Med. 2012, 10, 13. [Google Scholar] [CrossRef] [PubMed]
- Roman, L.; Belorio, M.; Gomez, M. Gluten-Free Breads: The Gap between Research and Commercial Reality. Compr. Rev. Food Sci. Food Saf. 2019, 18, 690–702. [Google Scholar] [CrossRef] [PubMed]
- Milde, L.B.; Ramallo, L.A.; Puppo, M.C. Gluten-free bread based on tapioca starch: Texture and sensory studies. Food Bioprocess Technol. 2012, 5, 888–896. [Google Scholar] [CrossRef]
- Skendi, A.; Mouselemidou, P.; Papageorgiou, M.; Papastergiadis, E. Effect of acorn meal-water combinations on technological properties and fine structure of gluten-free bread. Food Chem. 2018, 253, 119–126. [Google Scholar] [CrossRef]
- de la Hera, E.; Martinez, M.; Gómez, M. Influence of flour particle size on quality of gluten-free rice bread. LWT-Food Sci. Technol. 2013, 54, 199–206. [Google Scholar] [CrossRef]
- McCarthy, D.; Gallagher, E.; Gormley, T.; Schober, T.; Arendt, E. Formulation of Gluten Free Bread using Response Surface Methodology. In The Gluten Proteins; The Royal Chemistry Society: London, UK, 2004; pp. 379–382. [Google Scholar]
- Abdel-Aal, E.-S.M.; Gallagher, E. Functionality of Starches and Hydrocolloids in Gluten-Free Foods. In Gluten-Free Food Science and Technology; Wiley-Blackwell: Hoboken, NJ, USA, 2009; p. 200. [Google Scholar]
- Paz, G.M.; King, J.M.; Prinyawiwatkul, W. High Protein Rice Flour in the Development of Gluten-Free Bread. J. Culin. Sci. Technol. 2021, 19, 315–330. [Google Scholar] [CrossRef]
- Anderson, J.W.; Bridges, S.R. Hypocholesterolemic effects of oat bran in humans. In Oat Bran; Wood, P.J., Ed.; American Association of Cereal Chemists: St. Paul, MN, USA, 1993; pp. 139–157. [Google Scholar]
- AACC. American Association of Cereal Chemists, Approved Methods of the AACC, 10th ed.; American Association of Cereal Chemists: St. Paul, MN, USA, 2010. [Google Scholar]
- Chicaiza, V. Evaluating Consumers’ Perception of Gluten-Free/Clean-Label Muffins. Master’s Thesis, Louisiana State University, Baton Rouge, LA, USA, 2021; p. 5468. Available online: https://repository.lsu.edu/gradschool_theses/5468/ (accessed on 11 November 2023).
- Aleman, R.S.; Marcía, J.A.; Montero-Fernández, I.; King, J.; Pournaki, S.K.; Hoskin, R.T.; Moncada, M. Novel Liquor-Based Hot Sauce: Physicochemical Attributes, Volatile Compounds, Sensory Evaluation, Consumer Perception, Emotions, and Purchase Intent. Foods 2023, 12, 369. [Google Scholar] [CrossRef]
- Różyło, R.; Rudy, S.; Krzykowski, A.; Dziki, D.; Siastała, M.; Polak, R. Gluten-Free Bread Prepared with Fresh and Freeze-Dried Rice Sourdough-Texture and Sensory Evaluation. J. Texture Stud. 2016, 47, 443–453. [Google Scholar] [CrossRef]
- Sabanis, D.; Lebesi, D.; Tzia, C. Effect of dietary fibre enrichment on selected properties of gluten-free bread. LWT-Food Sci. Technol. 2009, 42, 1380–1389. [Google Scholar] [CrossRef]
- Gómez, M.; Ronda, F.; Caballero, P.A.; Blanco, C.A.; Rosell, C.M. Functionality of different hydrocolloids on the quality and shelf-life of yellow layer cakes. Food Hydrocoll. 2007, 21, 167–173. [Google Scholar] [CrossRef]
- Aleman, R.S.; Paz, G.; Morris, A.; Prinyawiwatkul, W.; Moncada, M.; King, J.M. High protein brown rice flour, tapioca starch & potato starch in the development of gluten-free cupcakes. LWT 2021, 152, 112326. [Google Scholar]
- Aleman, R.S.; Morris, A.; Prinyawiwatkul, W.; Moncada, M.; King, J.M. Physicochemical properties of Frontière rice flour and its application in a gluten-free cupcake. Cereal Chem. 2022, 99, 303–315. [Google Scholar] [CrossRef]
- Sae-Eaw, A.; Chompreeda, P.; Prinyawiwatkul, W.; Haruthaithanasan, V.; Suwonsichon, T.; Saidu, J.E.; Xu, Z. Acceptance and purchase intent of US consumers for nonwheat rice butter cakes. J. Food Sci. 2007, 72, S92–S97. [Google Scholar] [CrossRef] [PubMed]
- Singh, J.P.; Kaur, A.; Shevkani, K.; Singh, N. Influence of jambolana (Syzygium cumini) and xanthan gum incorporation on the physicochemical, antioxidant and sensory properties of gluten-free eggless rice muffins. Int. J. Food Sci. Technol. 2015, 50, 1190–1197. [Google Scholar] [CrossRef]
- Mahmoud, R.M.; Yousif, E.I.; Gadallah, M.G.E.; Alawneh, A.R. Formulations and quality characterization of gluten-free Egyptian balady flat bread. Ann. Agric. Sci. 2013, 58, 19–25. [Google Scholar] [CrossRef][Green Version]
- Wardy, W.; Jack, A.R.; Chonpracha, P.; Alonso, J.R.; King, J.M.; Prinyawiwatkul, W. Gluten-free muffins: Effects of sugar reduction and health benefit information on consumer liking, emotion, and purchase intent. Int. J. Food Sci. Technol. 2018, 53, 262–269. [Google Scholar] [CrossRef]
- Petrun, E.; Flood, A.; Sellnow, T.; Edge, M.S.; Burns, K. Shaping health perceptions: Communicating effectively about chemicals in food. Food Prot. Trends 2015, 35, 24–35. [Google Scholar]
- de-Magistris, T. Nutrition, Choice and Health-Related Claims. Nutrients 2020, 12, 650. [Google Scholar] [CrossRef] [PubMed]
- Hartmann, C.; Hieke, S.; Taper, C.; Siegrist, M. European consumer healthiness evaluation of ‘Free-from’ labelled food products. Food Qual. Prefer. 2018, 68, 377–388. [Google Scholar] [CrossRef]
- Carabante, K.M.; Ardoin, R.; Scaglia, G.; Malekian, F.; Khachaturyan, M.; Janes, M.E.; Prinyawiwatkul, W. Consumer Acceptance, Emotional Response, and Purchase Intent of Rib-Eye Steaks from Grass-Fed Steers, and Effects of Health Benefit Information on Consumer Perception. J. Food Sci. 2018, 83, 2560–2570. [Google Scholar] [CrossRef] [PubMed]
- Asioli, D.; Aschemann-Witzel, J.; Caputo, V.; Vecchio, R.; Annunziata, A.; Naes, T.; Varela, P. Making sense of the “clean label” trends: A review of consumer food choice behavior and discussion of industry implications. Food Res Int. 2017, 99, 58–71. [Google Scholar] [CrossRef] [PubMed]
- Mai, R.; Hoffmann, S. How to Combat the Unhealthy = Tasty Intuition: The Influencing Role of Health Consciousness. J. Public Policy Mark. 2015, 34, 63–83. [Google Scholar] [CrossRef]
- Mai, R.; Hoffmann, S. Taste lovers versus nutrition fact seekers: How health consciousness and self-efficacy determine the way consumers choose food products. J. Consum. Behav. 2012, 11, 316–328. [Google Scholar] [CrossRef]
- Hipp, J.A.; Becker, H.V.; Marx, C.M.; Tabak, R.G.; Brownson, R.C.; Yang, L. Worksite nutrition supports and sugar-sweetened beverage consumption. Obes. Sci. Pract. 2016, 2, 144–153. [Google Scholar] [CrossRef]
- Goldsmith, K.; Cho, E.K.; Dhar, R. When Guilt Begets Pleasure: The Positive Effect of a Negative Emotion. J. Mark. Res. 2012, 49, 872–881. [Google Scholar] [CrossRef]
Disclaimer/Publisher’s Note: The statements, opinions and data contained in all publications are solely those of the individual author(s) and contributor(s) and not of MDPI and/or the editor(s). MDPI and/or the editor(s) disclaim responsibility for any injury to people or property resulting from any ideas, methods, instructions or products referred to in the content. |
© 2023 by the authors. Licensee MDPI, Basel, Switzerland. This article is an open access article distributed under the terms and conditions of the Creative Commons Attribution (CC BY) license (https://creativecommons.org/licenses/by/4.0/).