Proceeding Paper

Efficient Representations of Spatially Variant Point Spread Functions with Butterfly Transforms in Bayesian Imaging Algorithms †

1
Max Planck Institute for Astrophysics, Karl-Schwarzschild-Straße 1, 85748 Garching, Germany
2
Faculty of Physics, Ludwig-Maximilians-Universität München (LMU), Geschwister-Scholl-Platz 1, 80539 München, Germany
3
Fraunhofer Institute for Applied and Integrated Security AISEC, Lichtenbergstraße 11, 85748 Garching, Germany
*
Author to whom correspondence should be addressed.
Presented at the 41st International Workshop on Bayesian Inference and Maximum Entropy Methods in Science and Engineering, Paris, France, 18–22 July 2022.
Phys. Sci. Forum 2022, 5(1), 33; https://doi.org/10.3390/psf2022005033
Published: 14 December 2022

Abstract

:
Bayesian imaging algorithms are becoming increasingly important in, e.g., astronomy, medicine and biology. Given that many of these algorithms compute iterative solutions to high-dimensional inverse problems, the efficiency and accuracy of the instrument response representation are of high importance for the imaging process. For this reason, point spread functions, which make up a large fraction of the response functions of telescopes and microscopes, are usually assumed to be spatially invariant in a given field of view and can thus be represented by a convolution. For many instruments, this assumption does not hold and degrades the accuracy of the instrument representation. Here, we discuss the application of butterfly transforms, which are linear neural network structures whose sizes scale subquadratically with the number of data points. Butterfly transforms are efficient by design, since they are inspired by the structure of the Cooley–Tukey Fast Fourier transform. In this work, we combine them in several ways into butterfly networks, compare the different architectures with respect to their performance and identify a representation that is suitable for the efficient respresentation of a synthetic spatially variant point spread function up to a 1 % error.

1. Introduction

Images of astronomical objects are the result of measurements by physical instruments and intricate postprocessing. In this procedure, instrument responses play an important role as they build the connection between the signal, i.e., the quantity of interest and the observables. Unfortunately, instrument responses are often non-trivial and hard to model in a simple and numerically efficient form. Examples for such instruments are the X-ray Observatories eROSITA [1] and Chandra [2]. Both are challenging to compute due to their inhomogeneous behavior in terms of space and energy. In order to efficiently make statistical field inferences, for example, by using NIFTy [3,4,5], a Python software package for Numerical Information Field Theory [6,7,8,9], these responses need to be fast and differentiable. One promising candidate for the efficient representation of instrument responses are butterfly transforms, a linear neural network structure inspired by the structure of the Fast Fourier Transform (FFT) algorithm, whose size scales with O ( N log N ) .
In many cases, the measurement equation for some data d, taken with an instrument response R of the signal s assuming additive noise n, can be formulated as d = R ( s ) + n . Regarding photographic instruments this response R is a linear map that can be separated into two operations D and O. Here, D is describing the measurement process of the detector, while O represents the optical properties of the instrument. The latter is also referred to as point spread function (PSF). Since computers are used for the analysis of the experiments performed, the continuous signal space is approximated by a discrete pixelation and thus all operators can be represented as matrices.
If O can be approximated by a circulant matrix, a matrix consisting of cyclic permutations of the same row vector a, its matrix multiplication with any vector simplifies to a discrete convolution with a, meaning that it is spatially invariant and homogeneous, respectively. In many physically relevant cases, this homogeneity can approximately be assumed for a given observed area of the instrument. Additionally, the convolution theorem states that a convolution corresponds to a point-wise multiplication in Fourier space. Consequently, convolutional responses can be represented in an efficient way, due to the fact that one only has to store one N-entry vector instead of a N 2 matrix, as well as due to the efficiency one gains by replacing a discrete Fourier transformation by the Fast Fourier Transformation (FFT).
Often this assumption only holds up to a certain degree and in a limited field of view. For spatially variant PSFs and thus non-circulant responses efficient representations are urgently needed. In their paper about learning fast linear transforms algorithms [10], Dao et al. proposed a way to learn fast linear transformation algorithms using so-called butterfly factorizations, which are closely related to the butterfly transforms introduced in this paper. They were able to learn several fast linear transformations, e.g., FFT, discrete sine transform, etc., and showed that their approach can be applied as an efficient replacement of generic matrices in machine learning pipelines. We propose using butterfly transforms to represent spatially variant PSFs in order to build likelihoods for instruments such as eROSITA, Chandra, and many more.
In this paper, we present a way to parameterize butterfly transforms, combine them into networks and compare different network architectures in terms of their efficiency and accuracy. Section 2 describes how butterfly transformations are parameterized and how they are inspired by the structure of the Cooley–Tukey–FFT algorithm. Section 3 gives a short introduction to information field theory and Section 4 describes different designs of likelihoods. In Section 5, we define a metric in order to compare different butterfly network architectures with respect to their capability to represent the synthetic response defined in Section 6. The final results can be found in Section 7.

2. Methods

2.1. Fast Fourier Transformation

Due to the convolution theorem, Fourier transformation is one of the key elements of convolutional processes and thus the algorithm of FFT is highly relevant for the representation of instrument responses on regular grids. The main idea of the FFT is to split the sum in the discrete Fourier transform (DFT) into two sums, over even and odd indices [11]. By using the mathematical properties of the N-th primitive root ω N = e 2 π i N , it can be shown that
f ^ k = 1 2 f ^ k even + 1 2 ω N k f ^ k odd and f ^ k + N 2 = 1 2 f ^ k even 1 2 ω N k f ^ k odd .
This means that an N-sized Fourier transform can be separated into two N / 2 -sized Fourier transforms along the even and odd indices [12]. The components f ^ k even and f ^ k odd can then be used to calculate f k and f k + N 2 . Putting together the relations in Equation (1) yields.
f ^ k f ^ k + N / 2 = 1 2 1 1 1 1 f ^ k even ω N k f ^ k odd .
The two smaller Fourier transforms can be separated in the same way, resulting in a divide and conquer algorithm. Assuming that the initial value of N is a power of 2, this splitting can be applied log 2 ( N ) times. Inspired by machine learning language, these iterations are called layers in the following. With N additions in each of these layers, the total computational complexity is about O ( N log 2 N ) . Comparing this to a regular DFT with its computational complexity of O ( N 2 ) (N components with N summands ) the amount of saved time in the FFT algorithm is significant.

2.2. Butterfly Transform and Convolution

The data-flow diagram visualizing the algorithm of Equation (2) is often called a butterfly diagram, due to its appearance (see Figure 1). Therefore, the abstraction of the FFT algorithm, resulting in a similar data-flow diagram, is called butterfly transform in the following. As the butterfly diagrams always connect to two components, most of the descriptions used in the following concerning their parameterization are 2-dimensional, to keep the notation simple.
In order to generalize the FFT while preserving its efficient structure, we decompose the operations in Equation (2) into a diagonal operator Φ and a mixing operator Θ as given in the following.
Φ = 1 0 0 ω N , Θ = 1 2 1 1 1 1 , and thus f ^ k f ^ k + N / 2 = Θ Φ f ^ k even f ^ k odd .
For each component, we introduce free parameters that control how the operation deviates from an ordinary FFT. A general representation of Θ is obtained by parameterizing it by the sine and cosine of an angle θ ,
Θ θ = cos θ sin θ sin θ cos θ .
To preserve the generality of the transformation within one layer, the θ s for different connected pairs, denoted by the index k in Equation (3), are independent. That means that for an N-size transformation there are N / 2 θ s, in each layer, regulating the interaction between two connected data points. Considering this parameterization, we get the Θ from Equation (3), i.e., the one for an FFT, by inserting θ = π 4 . The operator Φ and an additional operator Γ are parameterized as
Φ ϕ = e i ϕ 1 0 0 e i ϕ 2 , ϕ j R and Γ γ = e γ 1 0 0 e γ 2 , γ j R .
This parameterization of Φ makes it possible to recover the correct phases for an FFT, but also to change them in an arbitrary way. The combination of Θ and Φ is sufficient to represent an entire FFT transform. To obtain an even more general transformation, the diagonal operator Γ is introduced, which accounts for the real-valued amplitudes. This leads to a loss of unitarity for γ 1 , γ 2 0 in the combined transformation of Γ , Φ and Θ .
Now, we can build a generic butterfly-structured transformation B, using the layered structure of an FFT as a guiding example. The subscript of the operators refers to the layer in the FFT algorithm and thus implies that the correct components are connected.
B = Γ 0 Φ 0 Θ 0 Γ j Φ j Θ j Γ n 1 Φ n 1 Θ n 1 .
Given this butterfly transformation and the structure of a convolution operation, based on the convolutional theorem, a butterfly convolution-like operator O can be formulated as
O = B Λ B .
In this equation the Λ operator corresponds to the Fourier transformed PSF. Usually physically reasonable PSFs are real valued in position space and thus complex-valued in harmonic space. Therefore, the Λ operator is defined as a diagonal operator, with complex values,
Λ λ = e λ 1 0 0 e λ 2 , λ j C .
B , in Equation (7), denotes the adjoint of B. For some experiments, the parameters of B and B were strictly coupled, called mirrored architecture in the following. For others, the parameters were independent, denoted by different indices, resulting in a non-mirrored architecture:
O = B 1 Λ B 2 .
Since the butterfly structure is strongly related to the FFT, it would make sense to treat multidimensional butterfly transformations in the same way as multidimensional Fourier transformations. Therefore, butterfly transformations can be applied to each dimension separately. However, in this work the 2D application is slightly modified, in a way that the mixing operator Θ is applied to each axis separately (For the first axis all columns are transformed with the same θ s, whereas for the second axis all rows transformations share the same θ s.), but after this axis-wise Θ transformation the operators Φ and Γ are applied as diagonal operators. Another approach is to reduce the number of dimensions to one (in this case, as we are dealing with images, from 2D to 1D) and just perform one butterfly transform to this one dimension. For the case of 2-dimensional inputs the dimensionality reduction can be easily done by concatenating all the column vectors to one long vector, which will be called flattening from now on. These two different approaches differ in the number of layers needed by the butterfly algorithm as well as in the number of parameters per layer.

3. Information Field Theory

To reach a better understanding for the area of use for the efficient responses, a brief introduction to information field theory (IFT) [9] will be given. Information field theory is the application of information theory to physical fields. Probably the most important relation within information theory is Bayes’ Theorem,
P ( s | d ) = P ( d , s ) P ( d ) = P ( d | s ) P ( s ) P ( d ) ,
which connects a posterior with the likelihood, the prior, and the evidence. The likelihood can be computed from the noise statistic P ( n | s ) and the measurement equation, here in the form P ( d | s , n ) = δ ( d R ( s ) n ) . Thus, the likelihood is
P ( d | s ) = d n P ( d | s , n ) P ( n | s ) = d n δ ( d R ( s ) n ) P ( n | s ) = P ( n = d R ( s ) | s ) .
The prior P ( s ) is chosen with respect to the physical knowledge one has about the observed quantity or situation. The evidence P ( d ) = d s P ( d | s ) P ( s ) is needed for the proper normalization of the posterior P ( s | d ) . The information Hamiltonian is defined as the negative logarithm of the probability, H ( d , s ) = ln [ P ( d , s ) ] . Due to the properties of the logarithm and the product rule of probabilities the information Hamiltonian, H is an additive quantity H ( d , s ) = H ( d | s ) + H ( s ) . Assuming Gaussian priors for signal, G ( s , S ) , and noise, G ( n , N ) , and using Equation (11) the Hamiltonians simplify to
H ( s ) = ln [ G ( s , S ) ] = ln 1 2 π S exp ( 1 2 s S 1 s ) = 1 2 ln | 2 π S | + 1 2 s S 1 s , H ( d | s ) = ln [ G ( n , N ) ] = 1 2 ln | 2 π N | + 1 2 ( d R ( s ) ) N 1 ( d R ( s ) ) .
One way to find an estimate for the signal s is to maximize the probability P ( s | d ) . This can be achieved by minimizing the joint Hamiltonian H ( d , s ) , with respect to the signal s. This is the maximum a posteriori (MAP) approximation. There are also ways to find an estimate for a signal with uncertainty quantification like metric Gaussian variational inference (MGVI) [13] or geometric variation inference (geoVI) [14]. As a minimization algorithm, Newton-CG [15] was used throughout all experiments. If the measurement process follows Poisson statistics, which is the case for realistic photographic measurements, a Poissonian likelihood model has to be used instead of a Gaussian likelihood model.

4. Parallel and Serial Likelihoods

Models for inference processes in NIFTy are built in a forward way, as so-called generative models. This means that a model of the physical signal is created first, followed by the instrument response, and finally by synthetic data. Applying the IFT formalism, described in Section 3, to a generative model with a butterfly convolution operator as a response yields a likelihood with dependencies on the signal s and the response parameters θ , ϕ , γ , and λ .
In addition to being able to use butterfly convolution operators with mirrored, non-mirrored, flat, and 2D configurations, they can be combined into a network built in parallel or in series. For the case of n multiple butterfly convolution operators in series, the response operator in Equation (12) is
R ( s , θ , ϕ , γ , λ ) = O 1 O n s ,
while in the case of n butterfly convolution operators applied in a parallel architecture
R ( s , θ , ϕ , γ , λ ) = ( O 1 + + O n ) s .
Before using a butterfly network in an imaging application, the response R needs to be trained on signal-data pairs of the instrument. Using these signal-data pairs, the joint Hamiltonian H ( d , s , θ , ϕ , γ , λ ) is minimized with respect to the response parameters θ , ϕ , γ , and λ , resulting in a MAP approximation of the instrument. The initial values for these parameters, θ ˜ , ϕ ˜ , γ ˜ , and λ ˜ , are chosen such that all O i correspond to a convolution with a delta peak ( θ ˜ = π / 4 , γ ˜ = 0 , λ ˜ = 1 , and ϕ ˜ according to the needed phases, see Section 2.1). The prior distribution of the parameters is assumed to be Gaussian, with means at the initial values and unit variance. The final goal of the minimization is to obtain an efficient digital twin of the real physical instrument.
Once a butterfly response is trained, it can be used for imaging with the corresponding instrument. For this, the response parameters are fixed to the inferred values θ ̲ , ϕ ̲ , γ ̲ , and λ ̲ , resulting in a response operator, which is linear in the signal s. The selection of a suitable generative model for s depends on the observation of interest. In order to obtain an estimate for the physical signal s, the inference algorithms MGVI or geoVI can be used.

5. Evaluation of the Response Approximation

Before using a trained butterfly response in an inference algorithm, it must be certified that the mapping done by the response representation is sufficiently accurate. Therefore, we compare the action caused by a signal, here a point source at position z, s ( x ) = δ ( x z ) , of the to-be-learned or simulated response with the butterfly response by their absolute difference. This will be called response approximation error
E ( s ) = abs R sim . ( s ) R but . ( s ) .
To keep the evaluation simple, unit brightness point sources at all signal domain locations z Ω are considered. In order to quantify the total error with respect to all mapping errors, we calculate the 2-norm ( s 2 = x Ω | s x | 2 ) of the 4D matrix E z = E [ δ ( x z ) ] , containing the error images for all posible z-values and normalize it by dividing with the 2-norm of the matrix R z = R sim . [ δ ( x z ) ] , containing all true simulated responses resulting in the the total error ζ ^ :
ζ ^ = E 2 R sim . 2 .

6. Synthetic Response

In order to investigate whether and to which degree butterfly networks are capable of approximating spatially variant PSFs, they were trained to approximate a synthetic response. This synthetic response can be regarded as the convolution of the signal s, which is a point source located at the position z, s ( x ) = δ ( x z ) , with a rotational symmetric PSF with a position dependent shape,
( R s ) y = Ω PSF ( y x , x ) s ( x ) d x .
For the PSF a zero centered Gaussian was chosen,
PSF ( x , z ) = G ( ρ , σ 2 ) = 1 2 π σ 2 exp ρ 2 2 σ 2 ( z ) ,
with ρ = x 2 , where x is the coordinate vector of the image plane and x 2 = x 1 2 + x 2 2 is its length. The dependence on the position z of the point source is encoded in the variance σ 2 ( z ) of the Gaussian. To keep this spatial dependency simple, only the distance from the center of the image c to the point source z, r = c z 2 , influences the shape of the PSF. As this absolute value depends on the image resolution, r will be normalized by the maximal distance within the image, r ^ = r / r max , to get a relative measure for the distance being in the interval [ 0 , 1 ] . As indicated, the variance σ 2 is a function of this relative distance r ^ between the point source at z and the image center c,
σ 2 ( r ^ ) = a · r ^ 2 + ϵ .
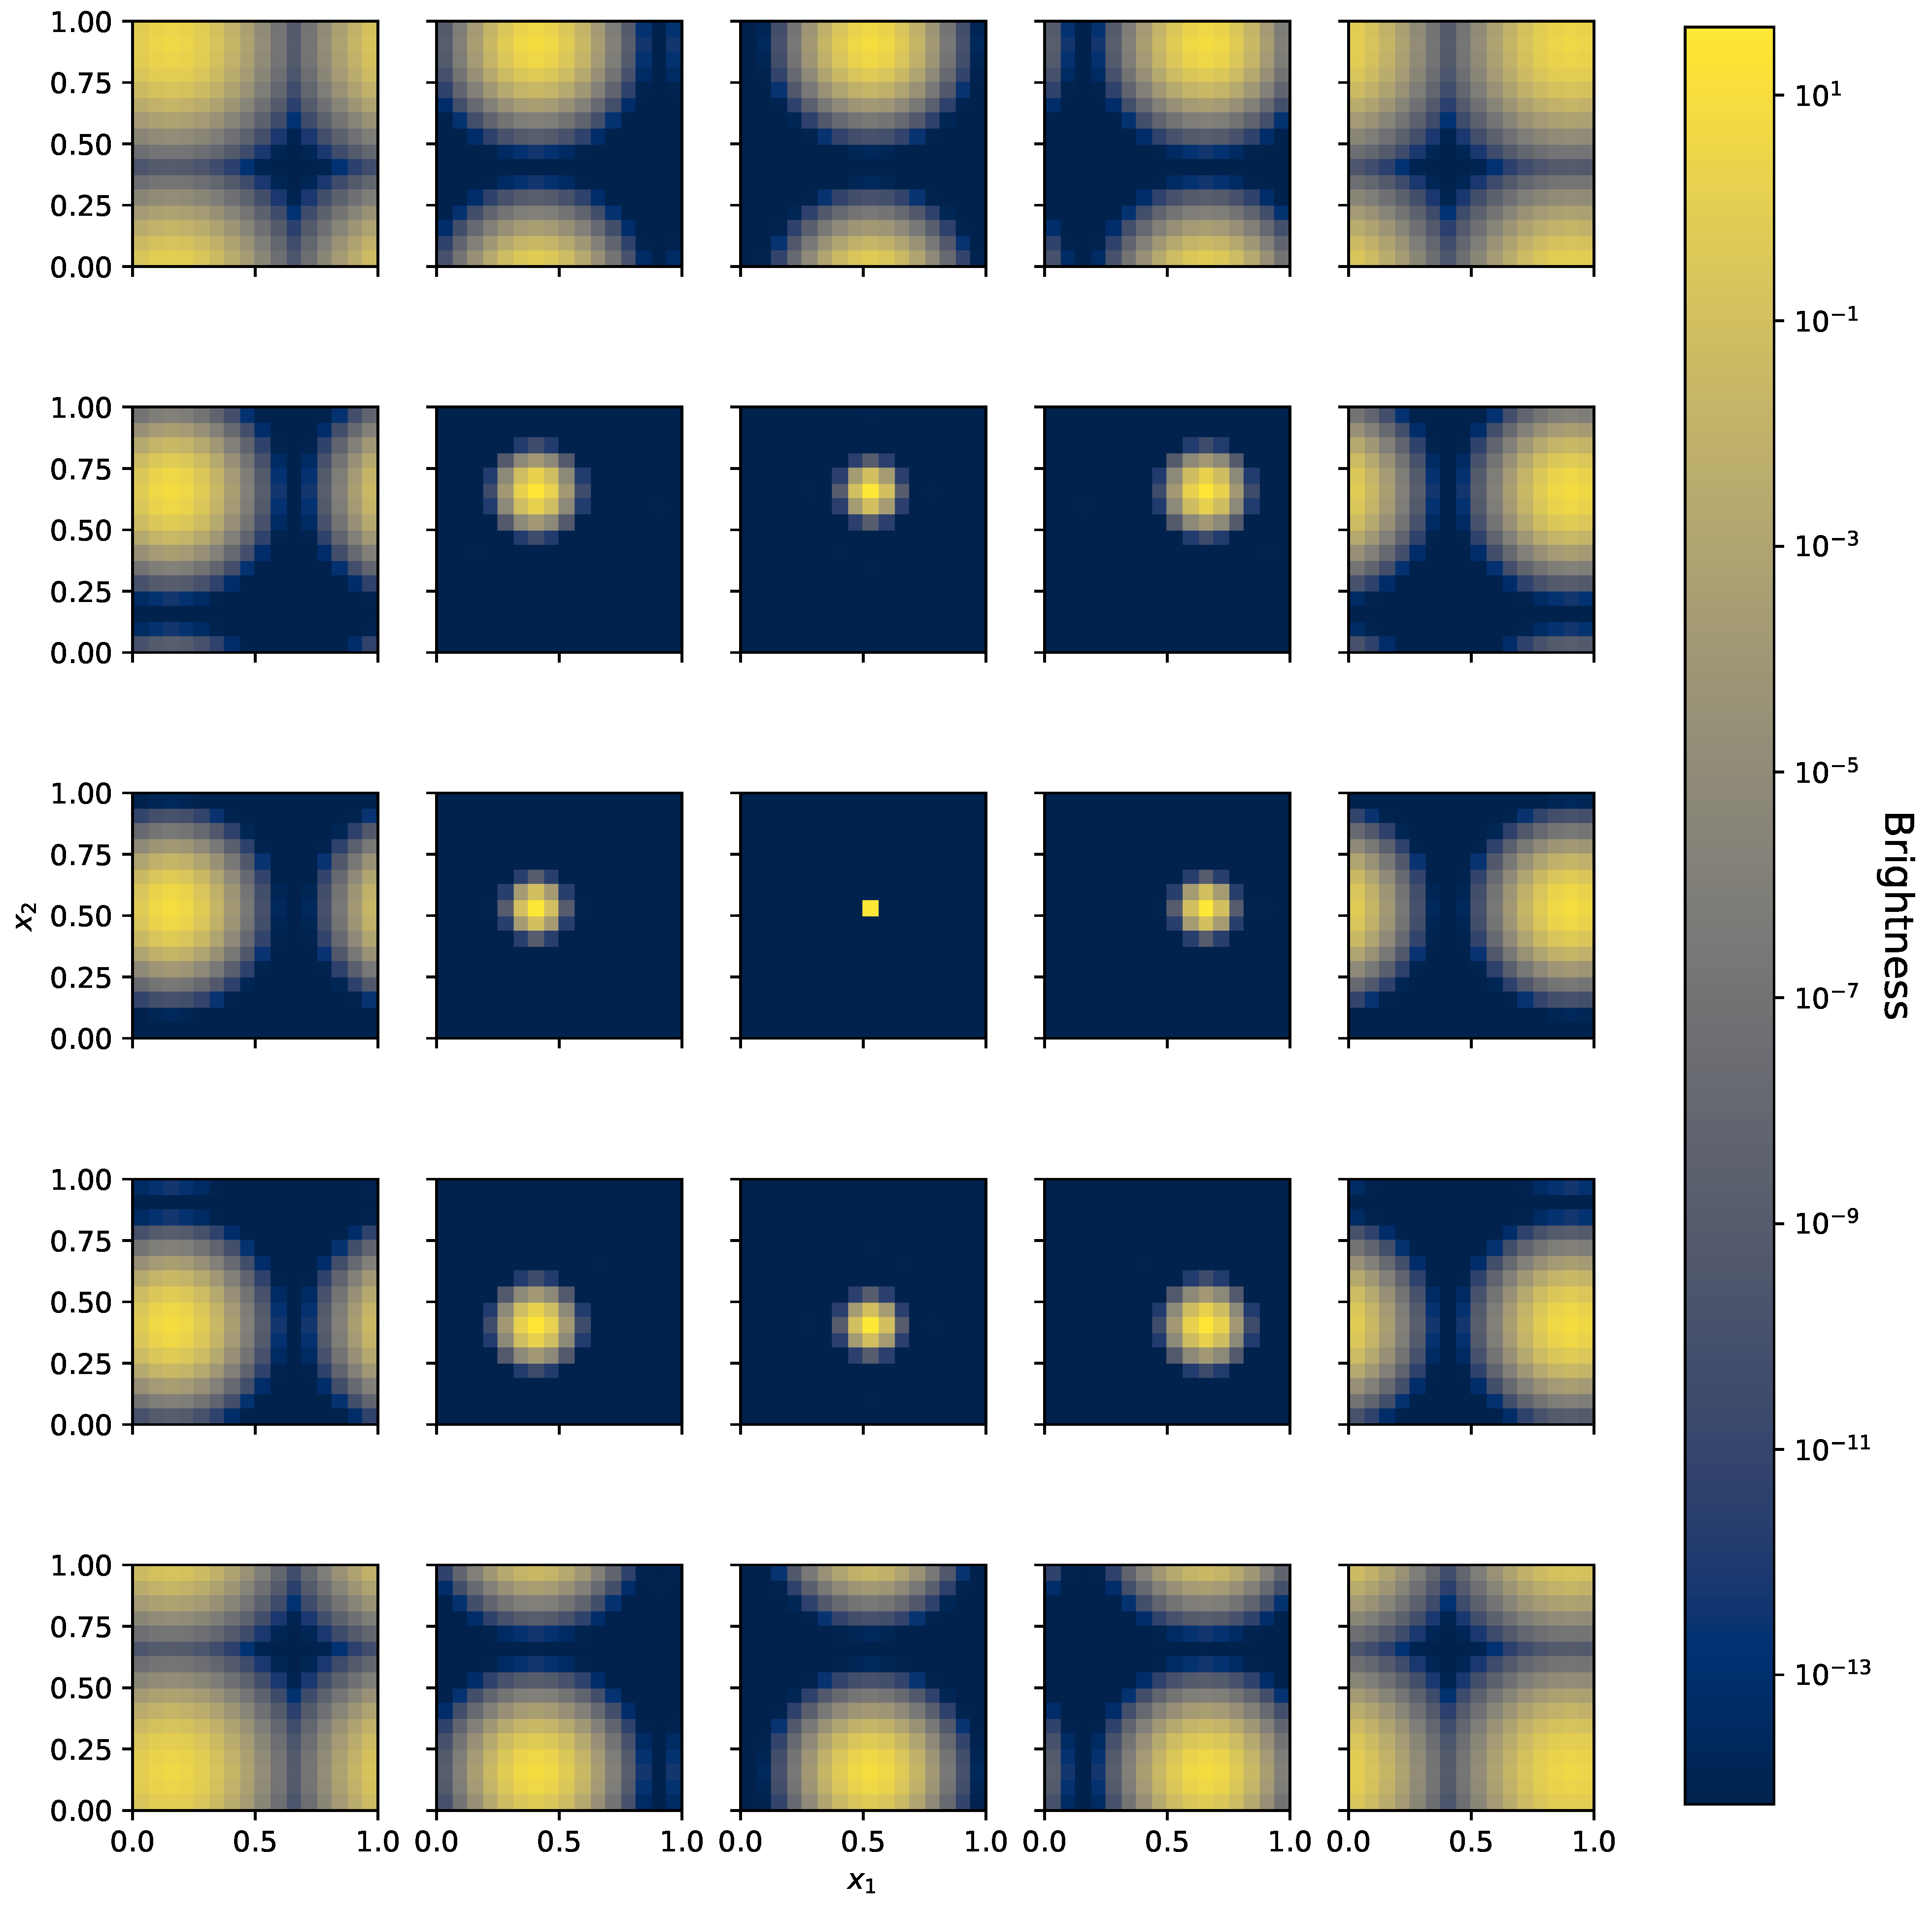
The two parameters are set to a = 0.01 and ϵ = 10 5 . Following the Equation (19), larger distances r ^ lead to larger values of the variance σ 2 . This means that point sources with smaller values of r ^ are convolved with a sharper Gaussian, while point sources being at far distance from the center are convolved with broader Gaussians (see Figure 2). This results in an spatially variant PSF, which can be used to examine the expressiveness of the butterfly architecture.

7. Results

In search of a butterfly network capable of representing spatially variant point spread functions, various architectures were compared, in terms of their ability to represent the synthetic response, differing in their number of butterfly convolution operators (BCOs), mirrored (mr) or non-mirrored (nmr) architecture, flat or 2D network design, serial or parallel built likelihood (see Table 1). All of these networks were trained to approximate the synthetic response described in Section 6 until the optimization was sufficiently converged (300 Newton steps). As training data, a set of all possible PSFs within the given pixelation of 16 × 16 was used. The signals were fixed to be point sources with brightness values 40 at the corresponding positions and the noise covariance N was set to be diagonal with entries of 10 6 . In order to get a better understanding of the influence of some of these properties on the total approximation behaviour, the networks are regarded separately and with respect to their final total approximation error ζ ^ in Table 1.
The comparison of the ζ ^ value of Net 1 , Net 2 , and Net 3 with 1, 2, and 3 BCOs, but otherwise the same properties, shows that a higher number of BCOs lowers the total error and thus increases the approximation capability. The second property of interest is the kind of architecture used, mirrored or non-mirrored. Therefore the ζ ^ value of Net 3 , with its mirrored architecture, is compared to the one of Net 4 , with its non-mirrored architecture, while their other properties are equivalent. This shows that the non-mirrored architecture is performing better than the mirrored one. The same conclusion can be drawn by comparing ζ ^ of Net 5 and Net 6 , which also only differ in their state of mirroring. In a similar way the flattened and the 2D application can be examined. Since Net 3 and Net 5 only differ in this property, their error values suggest that the flat application is superior to the 2D application with respect to reconstruction capability. This is confirmed by regarding the error of Net 4 and Net 6 , which are in a similar relationship.
Since more BCOs, flattening, and a non-mirrored architecture increase the number of parameters and thus lead to more degrees of freedom, it is assumed that these architectures are more flexible and can approximate the true response in a better way.
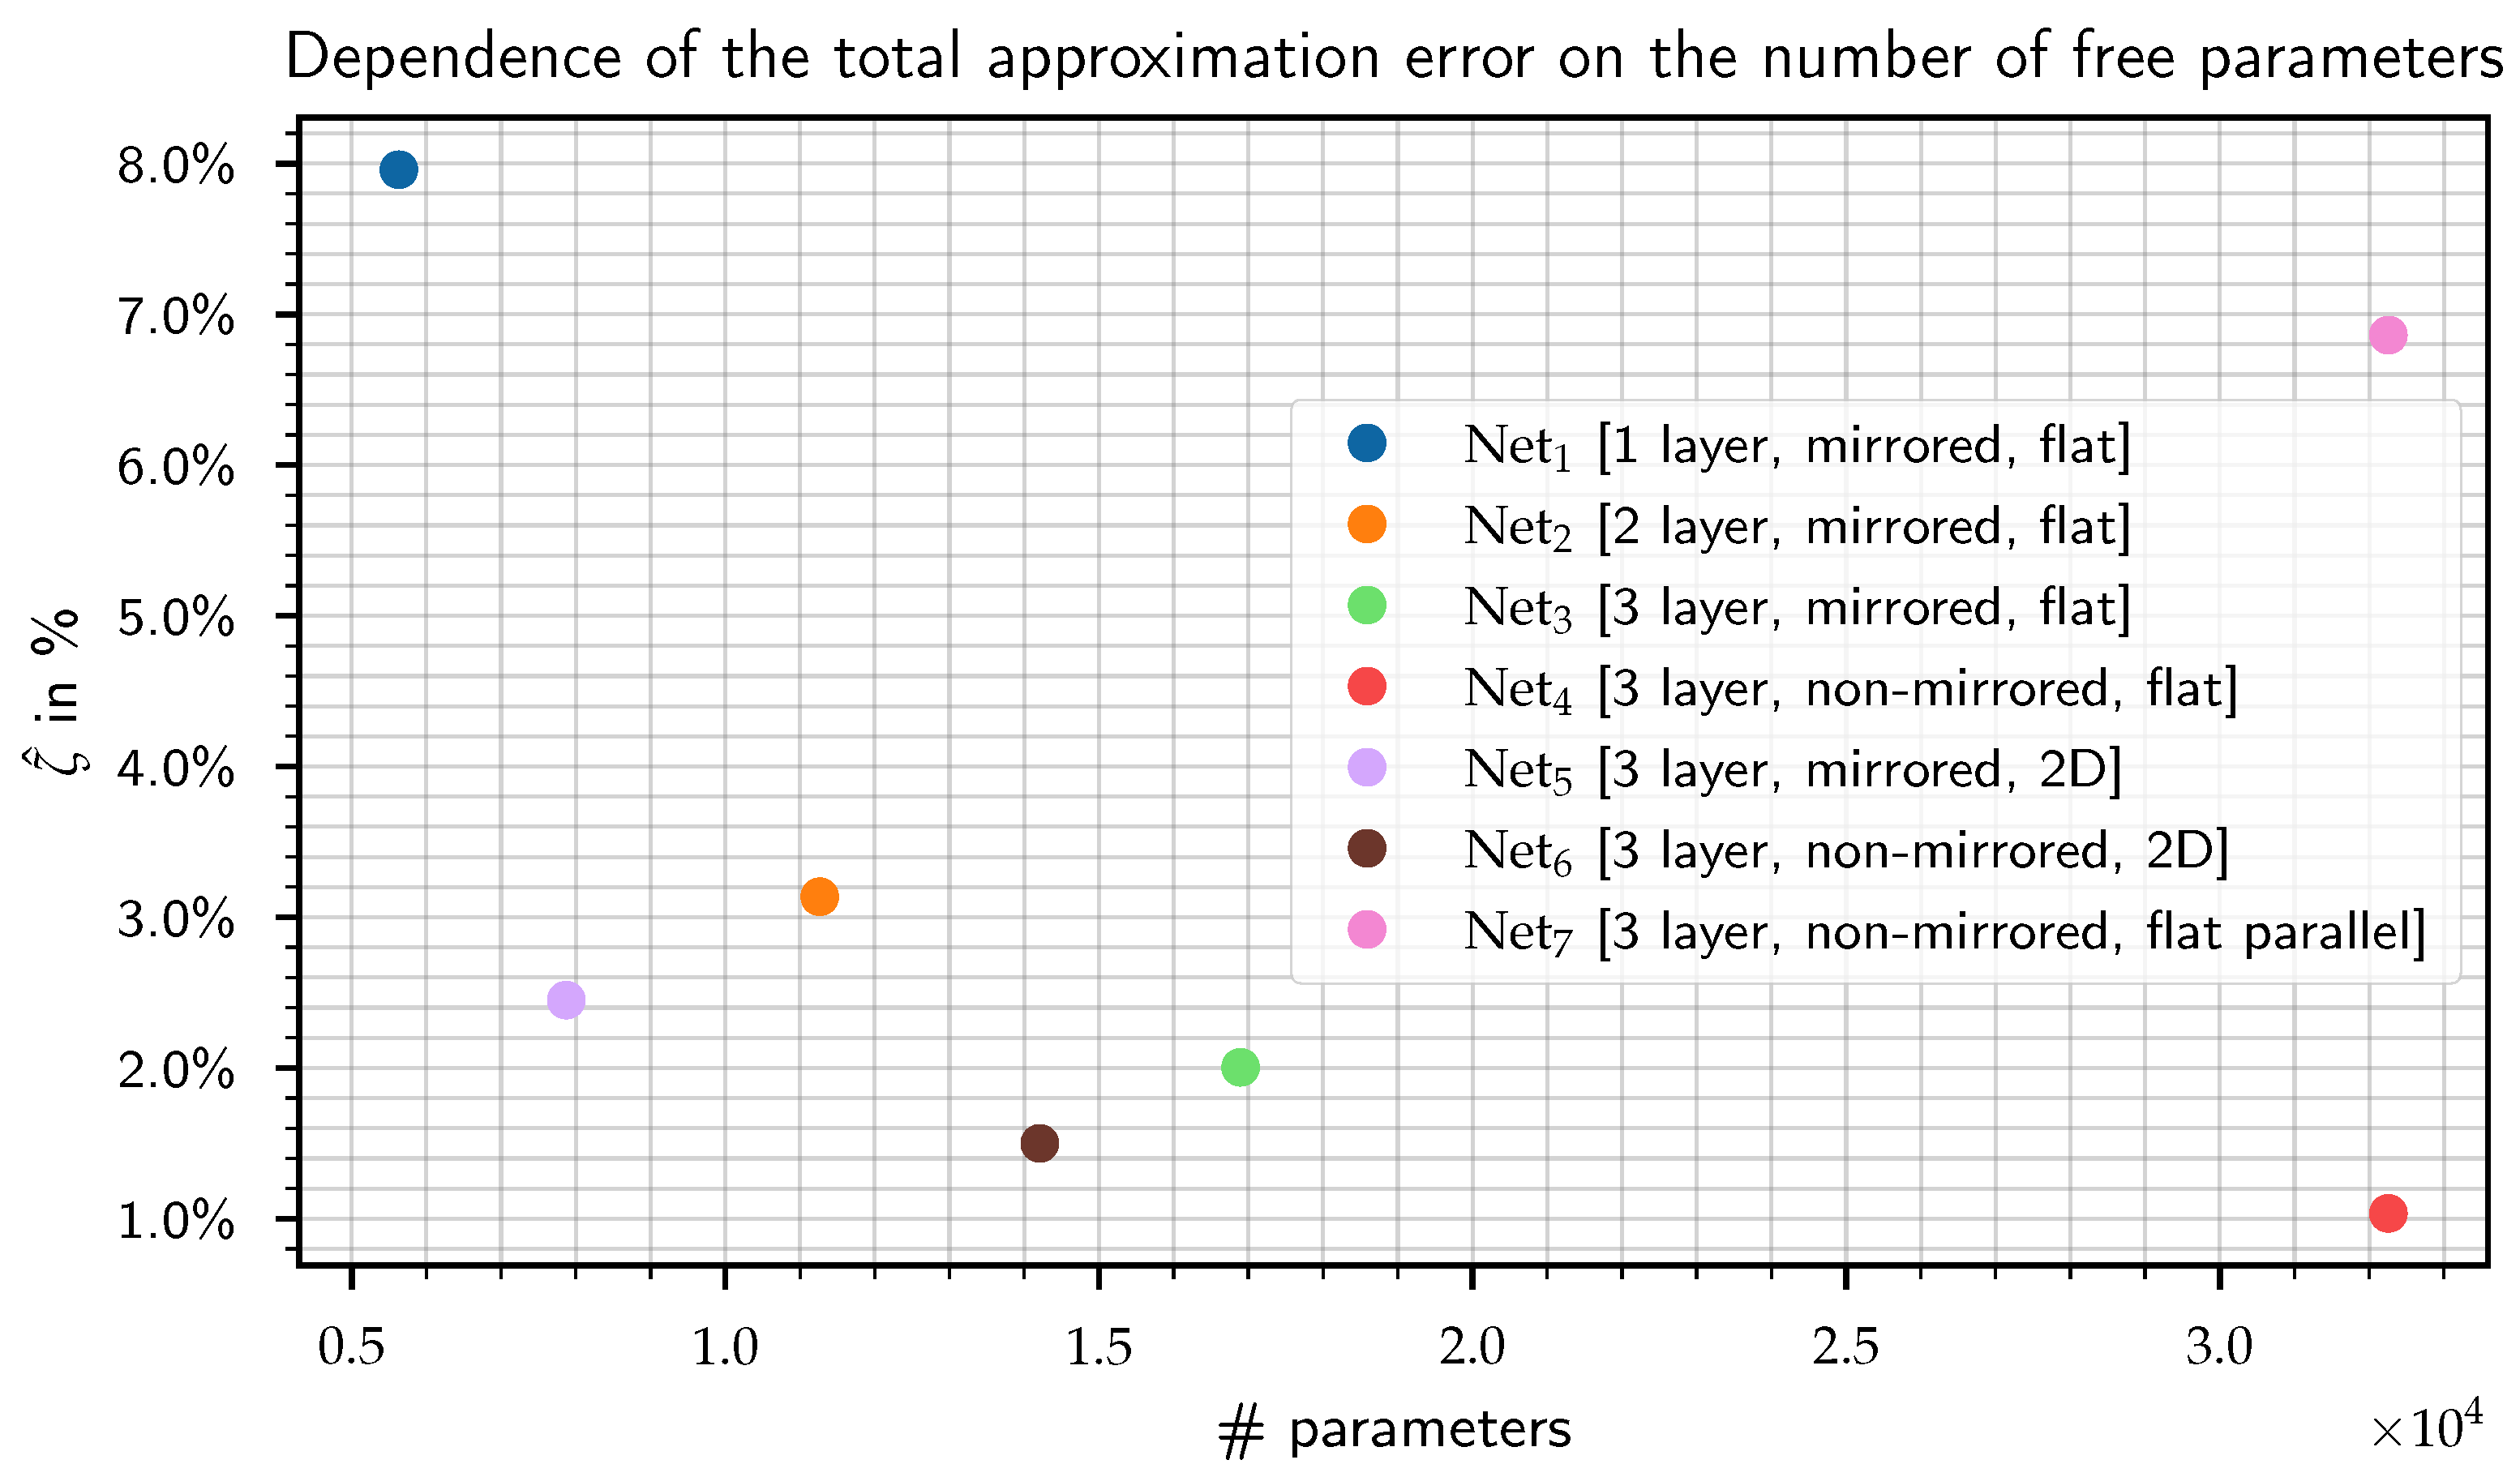
For the overall efficiency of the various networks it is not only important to approximate the synthetic response in a optimal way, but also to keep the number of parameters, and thus the network density (Network density is here defined as the ratio of network parameters and number of entries in a full matrix representation.), as low as possible (see Figure 3). In the examined cases, sparser architectures tend to perform worse in comparison to architectures with more parameters. Overall Net 4 approximates the synthetic reponse best with an 1 % error. Net 6 , however, has only 44 % of the parameters of Net 4 and is therefore less dense. This goes hand in hand with a slightly increased approximation error by an absolute value of 0.46 % (see Table 1). In the end, the number of parameters of butterfly networks still scales with O ( N log N ) . This means that they become less dense with increasing resolution.

8. Discussion

The need for efficient response representations in imaging led to the development of the models presented in this work, which were inspired by earlier research on butterfly matrices [10]. The efficient structure of butterfly matrices, inherited of Fast Fourier Transforms (FFT), results in a subquadratic algorithm scaling with O ( N log N ) that is capable of representing an expensively simulated synthetic response up to 1 % error. To this end, Net 4 , a butterfly convolutional network with three butterfly convolution operators (BCOs) in series, non-mirrored architecture, and flat application is used, which is differentiable and thus suitable for the application as a response in generative models for measurement data. In order to improve the computational performance regarding support of GPUs and parallelization, more advanced machine learning platforms such as TensorFlow [16] or PyTorch [17] could be considered. After sufficient training, the corresponding butterfly network can be used to perform high-fidelity imaging using information field theory. Additonally, other fields of application with a connection to slightly inhomogeneous processes are imaginable. All in all, the method to represent instrument response functions introduced in this work is promising to improve imaging with complex photographic instruments and thus should be considered in further research.

Author Contributions

Conceptualization, V.E., P.F., J.S., S.S. and T.E.; methodology, V.E., S.S. and P.F.; software, V.E. and S.S.; validation, V.E. and S.S.; formal analysis, V.E. and T.E.; investigation, V.E.; resources, V.E.; data curation, V.E.; writing—original draft preparation, V.E.; writing—review and editing, V.E.; visualization, V.E.; supervision, T.E. and P.F.; project administration, T.E.; funding acquisition, T.E. All authors have read and agreed to the published version of the manuscript.

Funding

This research was supported by the German Aerospace Center and the Federal Ministry of Education and Research through the project “Universal Bayesian Imaging Kit—Information Field Theory for Space Instrumentation” (Förderkennzeichen 50OO2103).

Institutional Review Board Statement

Not applicable.

Informed Consent Statement

Not applicable.

Data Availability Statement

Not applicable.

Acknowledgments

We thank Philipp Arras for detailed feedback on the manuscript.

Conflicts of Interest

The authors declare no conflict of interest.

References

  1. Predehl, P.; Andritschke, R.; Arefiev, V.; Babyshkin, V.; Batanov, O.; Becker, W.; Böhringer, H.; Bogomolov, A.; Boller, T.; Borm, K.; et al. The eROSITA X-ray telescope on SRG. arXiv 2020, arXiv:2010.03477. [Google Scholar] [CrossRef]
  2. Weisskopf, M.C.; Tananbaum, H.D.; Van Speybroeck, L.P.; O’Dell, S.L. Chandra X-ray Observatory (CXO): Overview. In Proceedings of the X-ray Optics, Instruments, and Missions III; SPIE: Bellingham, DC, USA, 2000; Volume 4012, pp. 2–16. [Google Scholar]
  3. Selig, M.; Bell, M.R.; Junklewitz, H.; Oppermann, N.; Reinecke, M.; Greiner, M.; Pachajoa, C.; Enßlin, T.A. NIFTY—Numerical Information Field Theory—A versatile PYTHON library for signal inference. Astron. Astrophys. 2013, 554, A26. [Google Scholar] [CrossRef]
  4. Steininger, T.; Dixit, J.; Frank, P.; Greiner, M.; Hutschenreuter, S.; Knollmüller, J.; Leike, R.; Porqueres, N.; Pumpe, D.; Reinecke, M.; et al. NIFTy 3—Numerical Information Field Theory: A Python Framework for Multicomponent Signal Inference on HPC Clusters. Ann. Phys. 2019, 531, 1800290. [Google Scholar] [CrossRef] [Green Version]
  5. Arras, P.; Baltac, M.; Ensslin, T.A.; Frank, P.; Hutschenreuter, S.; Knollmueller, J.; Leike, R.; Newrzella, M.N.; Platz, L.; Reinecke, M.; et al. Nifty5: Numerical Information Field Theory v5; record ascl:1903.008; Astrophysics Source Code Library: College Park, MD, USA, 2019. [Google Scholar]
  6. Enßlin, T.A.; Frommert, M.; Kitaura, F.S. Information field theory for cosmological perturbation reconstruction and nonlinear signal analysis. Phys. Rev. D 2009, 80, 105005. [Google Scholar] [CrossRef] [Green Version]
  7. Enßlin, T. Astrophysical data analysis with information field theory. In Proceedings of the AIP Conference Proceedings, Canberra, ACT, Australia, 15–20 December 2013; American Institute of Physics: College Park, MD, USA, 2014; Volume 1636, pp. 49–54. [Google Scholar]
  8. Enßlin, T. Information field theory. In Proceedings of the AIP Conference Proceedings, Garching, Germany, 15–20 July 2012; American Institute of Physics: College Park, MD, USA, 2013; Volume 1553, pp. 184–191. [Google Scholar]
  9. Enßlin, T.A. Information theory for fields. Ann. Phys. 2019, 531, 1800127. [Google Scholar] [CrossRef] [Green Version]
  10. Dao, T.; Gu, A.; Eichhorn, M.; Rudra, A.; Ré, C. Learning fast algorithms for linear transforms using butterfly factorizations. In Proceedings of the International Conference on Machine Learning, Long Beach, CA, USA, 9–15 June 2019; Volume 97, pp. 1517–1527. [Google Scholar]
  11. Cooley, J.W.; Tukey, J.W. An algorithm for the machine calculation of complex Fourier series. Math. Comput. 1965, 19, 297–301. [Google Scholar] [CrossRef]
  12. Wolberg, G. Fast Fourier Transforms: A Review; Department of Computer Science, Columbia University: New York, NY, USA, 1988. [Google Scholar]
  13. Knollmüller, J.; Enßlin, T.A. Metric Gaussian Variational Inference. arXiv 2019, arXiv:1901.11033. [Google Scholar]
  14. Frank, P.; Leike, R.; Enßlin, T.A. Geometric variational inference. Entropy 2021, 23, 853. [Google Scholar] [CrossRef] [PubMed]
  15. Nocedal, J.; Wright, S. Numerical Optimization; Springer Science & Business Media: Berlin/Heidelberg, Germany, 2006; pp. 168–170. [Google Scholar]
  16. Abadi, M.; Agarwal, A.; Barham, P.; Brevdo, E.; Chen, Z.; Citro, C.; Corrado, G.S.; Davis, A.; Dean, J.; Devin, M.; et al. TensorFlow: Large-Scale Machine Learning on Heterogeneous Systems. 2015. Available online: tensorflow.org (accessed on 8 December 2022).
  17. Paszke, A.; Gross, S.; Massa, F.; Lerer, A.; Bradbury, J.; Chanan, G.; Killeen, T.; Lin, Z.; Gimelshein, N.; Antiga, L.; et al. PyTorch: An Imperative Style, High-Performance Deep Learning Library. In Advances in Neural Information Processing Systems 32; Wallach, H., Larochelle, H., Beygelzimer, A., d’Alché-Buc, F., Fox, E., Garnett, R., Eds.; Curran Associates, Inc.: Red Hook, NY, USA, 2019; pp. 8024–8035. [Google Scholar]
Figure 1. Comparison of: (a) butterfly diagram—blue lines indicate an addition, the orange line indicates subtraction; (b) pictogram of a butterfly with similar appearance.
Psf 05 00033 g001
Figure 2. 25 signal responses R ( s ) for point sources at different positions. For simplicity we used periodic boundaries for the kernels, which will be properly adressed in the future. The colors show the resulting brightness values.
Psf 05 00033 g002
Figure 3. Total approximation error ζ ^ with respect to the number of parameters in the network. A combination of low error and low number of parameters is important for a good efficiency of the corresponding network.
Psf 05 00033 g003
Table 1. Parameters and results for all seven network architectures. The density is here defined as the ratio of the number of parameters and the number of entries in a full matrix representation (16 4 = 65,536). A lower density indicates a higher efficiency of the representation.
Network Name Net 1 Net 2 Net 3 Net 4 Net 5 Net 6 Net 7
# BCOs1233333
architecturemrmrmrnmrmrnmrnmr
designflatflatflatflat2D2Dflat
likelihoodserialserialserialserialserialserialparallel
ζ ^ in % 7.96 3.14 2.00 1.04 2.45 1.50 6.86
# parameters5632 11,264 16,896 32,256 7872 14,208 32,256
Density in % 8.59 17.19 25.78 49.22 12.01 21.68 49.22
Publisher’s Note: MDPI stays neutral with regard to jurisdictional claims in published maps and institutional affiliations.