Proceeding Paper

Study of Bond Length and Its Effect on Guided Waves Using Fiber Optic Sensors †

by
Kaleeswaran Balasubramaniam
*,
Rohan Soman
and
Paweł Malinowski
Institute of Fluid Flow Machinery, Polish Academy of Sciences, 80-231 Gdansk, Poland
*
Author to whom correspondence should be addressed.
Presented at 19th International Conference on Experimental Mechanics, Kraków, Poland, 17–21 July 2022.
Phys. Sci. Forum 2022, 4(1), 8; https://doi.org/10.3390/psf2022004008
Published: 1 August 2022
(This article belongs to the Proceedings of The 19th International Conference on Experimental Mechanics)

Abstract

:
Fiber Bragg grating (FBG) based structural health monitoring applications are used in various engineering types of damage prediction and detection analysis. FBG can serve as an effective sensor for data monitoring applications as they are more robust in harsh environmental conditions and can be embedded directly into the structure. The paper aims to study the effect of the guided wave (GW) relative magnitude based on the bond and bond length with different piezoelectric lead zirconate transducer (PZT actuator) connections. The paper compares the signal amplitudes between the directly bonded and remotely bonded FBG in the structure. A parametric study was also conducted based on signal attenuation to show the changes in the bond lengths affecting the GW. The study is conducted on the subsystem-level aluminum structure. The bond length wave attenuation-based studies were done by applying glue at various distances from the FBG sensor and glue of various spread lengths to facilitate the concept of remote and direct bonding configurations. The paper tends to predict Lamb wave modes based on the arrival time and check effective bonding type in producing quality signal amplitude with different PZT connections.

1. Introduction

Fiber Bragg grating (FBG) sensors are largely used in structural health monitoring (SHM) studies of aerospace, automotive, and civil structures. Major advantages of utilizing FBGs are their ability to embed easily, highly sensitive, low electromagnetic noises, lightweight, high directionality in sensing guided waves (GW), etc. [1,2]. Bonding the FBG directly to the structure (direct bonding) helps to receive a better signal amplitude [1], and it is a proven technique. This direct bonding setup produces axial strain along the length of the FBG. Researchers showed that the remote bonding type setup could sense the GW [3]. Remotely bonded FBG in structures enhances the signal amplitude compared to directly bonded FBGs [3,4]. Direct bonding of the FBG sensor to a structure helps to sense both the forward and backward propagating waves in general [5], and researchers used such a technique in many SHM [6] applications.
In this research paper, the magnitudes of the GW signals are compared by keeping the FBG experimental setup in direct, remote bonding with different actuator connections (PZT based). In this paper, we check the signal amplitudes with a remote bonding setup as shown in [3] but with an elongated remote bonding type (explained briefly in the experimental analysis section). The research compares the bonding configurations with different connections as an improvement to the proposed moving remote bonding configuration [3,4].

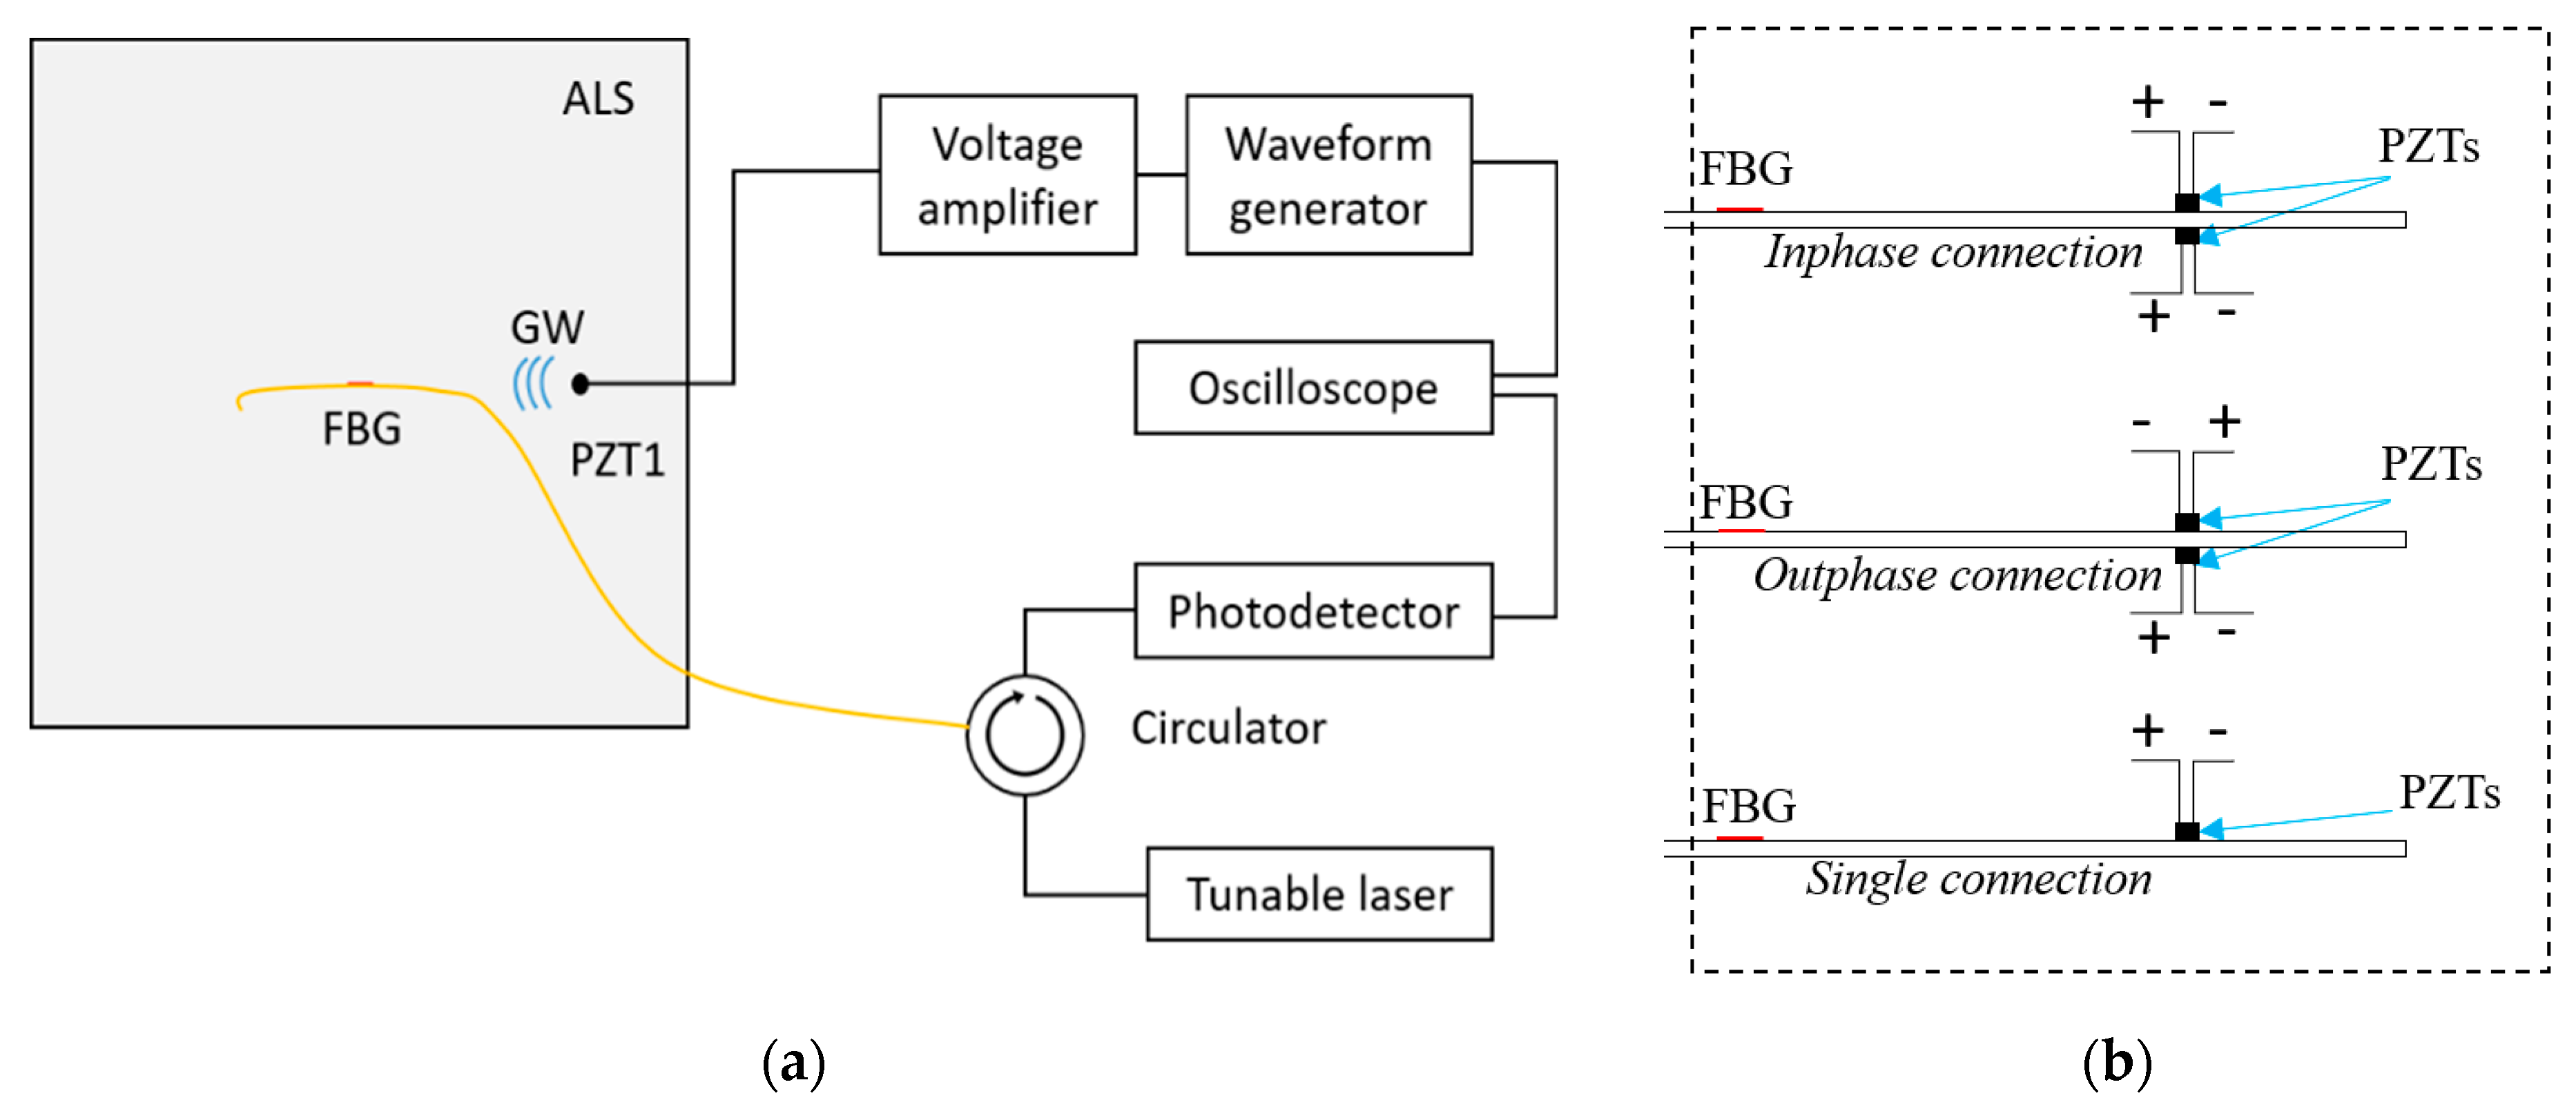
2. Experimental Analysis

The experimental analysis was performed on an isotropic aluminum specimen (ALS) of dimensions 50 cm × 50 cm × 0.1 cm. The schematic setup of the experiment is shown in Figure 1a. The experimental setup is explained in brief in [6]. Two PZTs were attached to the top and bottom surface of the structure in a parallel fashion using cyanoacrylate glue. Three different connection types were made by changing the polarity of the PZTs, as shown in Figure 1b and explained briefly in [7]. A 5-cycle continuous sine tone burst is supplied to the PZT via waveform generator after applying a modulated Hann window. A frequency of 50:50:250 kHz was used as the input excitation frequency and was supplied to the glued PZT to excite GW signals.
The FBG (used as a sensor of center wavelength 1550.04 nm) is placed at the center of the structure (25 cm × 25 cm) to sense the GW. The PZT was placed parallel to the FBGs as it is sensitive to unidirectional signals and generally senses low electromagnetic noises compared to PZT as a sensor. In-phase, out-of-phase and direct PZT arrangements were analyzed (three connection types) on the structure to identify different GW modes, as shown in Figure 2. Both the direct bonding and remote bonding configurations were checked using the mentioned connections. The output GW signals were measured using the edge reflection [8] technique, wherein the laser’s wavelength is fixed to the midpoint of the ascending reflectivity slope. FBG measures the changes in the wavelength (wavelength shift) due to the axial strain induced by the excited waves. The output is the change in the reflection from the laser light, which is then directly proportional to the photodetector’s measured power.
The length of the adhesive was changed precisely to study the GW effects and its propagation through the fiber. The change in the amplitude parameters was analyzed to verify the changes caused due to adhesive spread. The adhesive was applied on a length scale of H (1 cm) from the side of PZTs (acting as an actuator) to 4H (4 cm), as shown in Figure 2a for the remote bonding arrangement. For the direct bonding, the glue spread was increased on both sides with a scale of H cm till it reached 4H cm, as shown in Figure 2b. Three connection types, five frequencies, and four bond length types were studied (shown in Table 1). The GW signals were obtained after averaging them 50 times.
The challenging part of the experiment is to measure the GW as the configuration has to be measured every time after carefully cleaning the structure with hot water. The reflectivity spectrum was checked throughout the experiment to set the laser’s wavelength at the proper interval.

3. Results and Discussion

The results obtained from the mentioned different connections (Table 1) for remote bonding configuration are shown in Figure 3. Similar signals are also obtained in the direct bonding configuration too. The GW signals (voltage) obtained from the photodetector with PZT excitation as input are plotted in Figure 4 and Figure 5 at different adhesive lengths. The first wave packet is chosen to study the varying amplitude parameter and is elaborated in Figure 4. Figure 4 shows how the signal zoomed wave packet is selected for studying at different bonding length configurations. The highest peak is picked up to study the changes to the signals caused due to varying values of H.
It was found that the amplitude value increases with increasing the value of H as H moves closer to the FBG location, making the connection a more direct bonding type. The trend is realized in all the remote bonding PZT connections, as shown in Figure 5. A 200 kHz excitation frequency is chosen for showing the results as the GW signals showed better quality between 150–250 kHz, respectively.
The remote bonding study showed that the amplitude values of the S0 mode peak values drop when the bonding length increases. Similarly, the direct bonding was tested at all three connections, and the values obtained are plotted as shown in Figure 6 (amplitude vs. bonding length).
Figure 6 describes that peak amplitude values increase with increasing the glue length in remote bonding configuration. The trend is more or less visible in all three PZT connections, as shown in Figure 6a–c. The direct bonding PZT connections Figure 6d–f shows the values in decreasing trend. The reason for the decrease in the amplitude value could be a higher strain that is applied due to the spread area/length of the adhesive (higher bond length), which masks the signal leading to an amplitude drop (Table 2).

4. Conclusions

  • FBG-based remote, direct bonding with different PZT connections was analyzed to understand the bond length and its effects on GW signals.
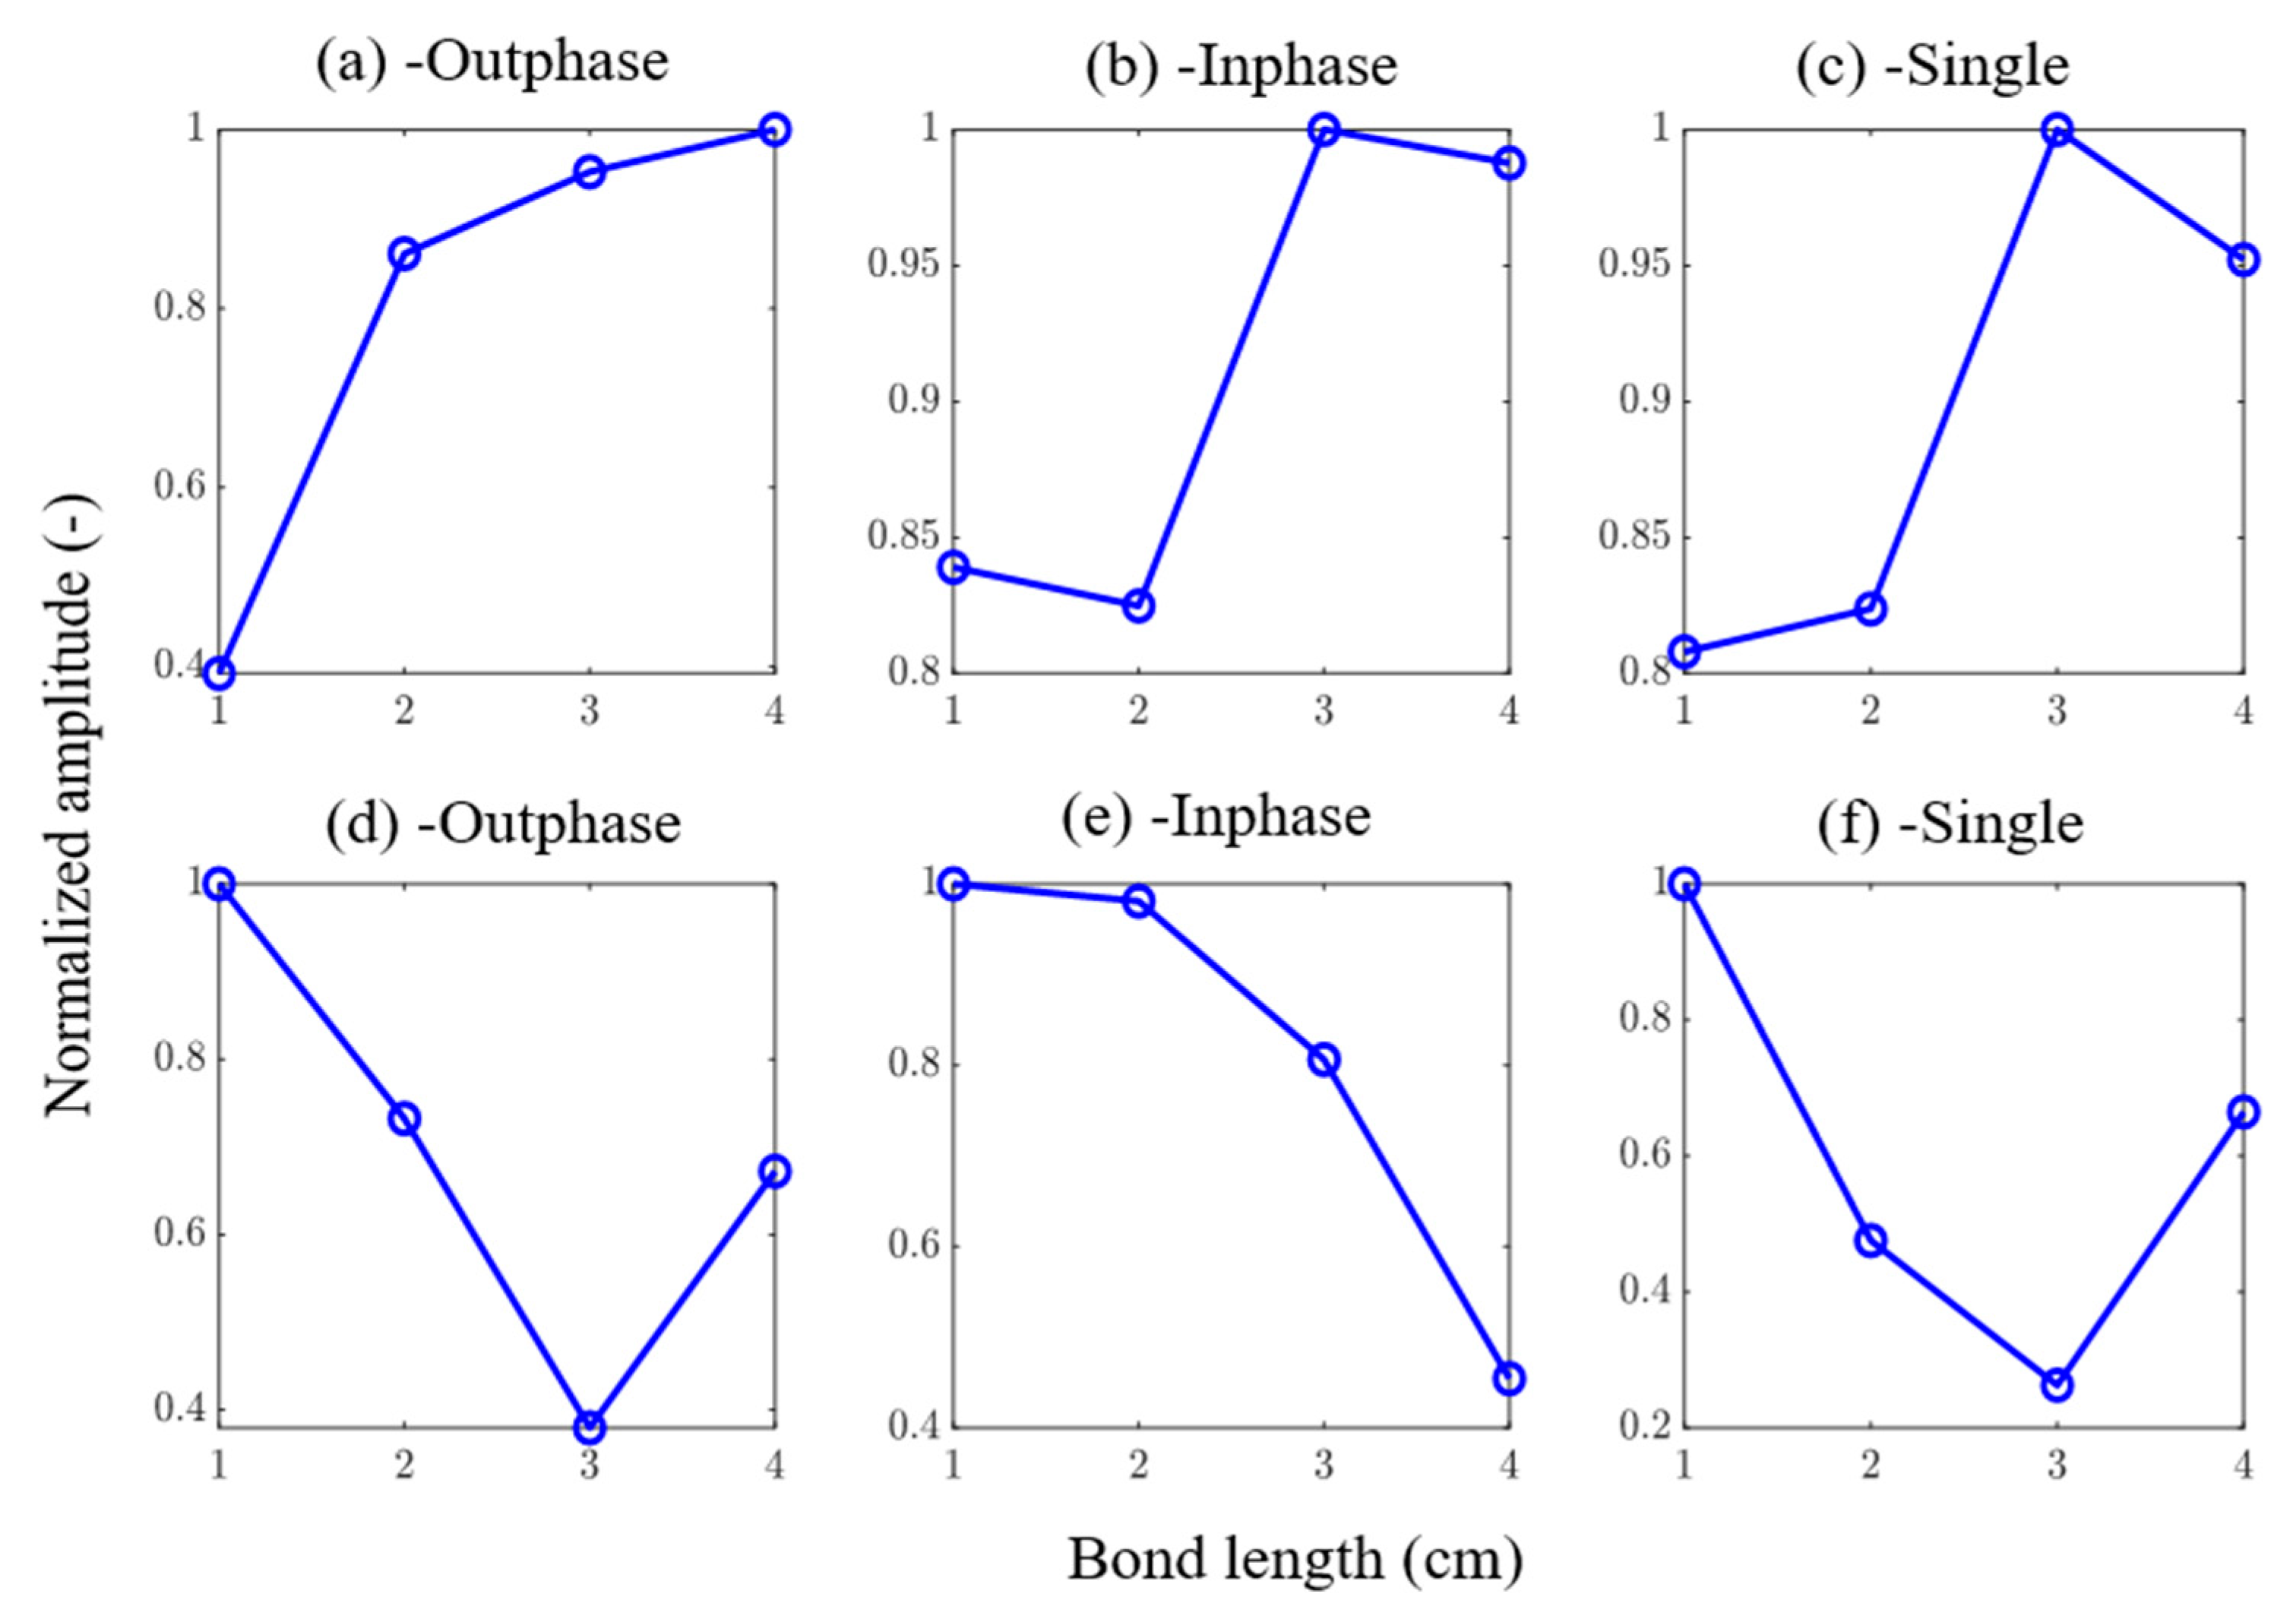
  • It was observed that the GW signals showed changes in the amplitude at the varying length of the adhesive spread.
  • The outcomes of using different PZT connections were also supported by the obtained signal plots from the experiments, matching the reasoning.
  • The remote bonding studies showed a linear positive increase trend of values while direct bonding shows mostly a decrease.
  • Further studies involve performing numerical studies to support the experimental verifications and a mode separation analysis to check other parametric values of other available modes.

Author Contributions

Conceptualization, K.B. and R.S.; methodology, K.B. and R.S.; software, K.B.; validation, K.B., formal analysis, K.B., R.S. and P.M.; investigation, K.B. and R.S.; resources, R.S. and P.M.; data curation, K.B.; writing—original draft preparation, K.B.; writing—review and editing, K.B., R.S. and P.M. visualization, K.B. and R.S.; supervision, R.S. and P.M.; project administration, R.S. and P.M.; funding acquisition, R.S. and P.M. All authors have read and agreed to the published version of the manuscript.

Funding

OPUS project grant no: 2019/33/B/ST8/01699 provided by National Science Center, Poland.

Data Availability Statement

Not applicable.

Acknowledgments

The authors acknowledge TASK-CI for allowing the use of their computational resources, Paweł Kudela for the equipment loan, Piotr Fiborek for the discussions, and Sultan Ahamad for helping with the experiments.

Conflicts of Interest

The authors declare no conflict of interest.

References

  1. Soman, R.; Wee, J.; Peters, K. Optical fiber sensors for ultrasonic structural health monitoring: A review. Sensors 2021, 21, 7345. [Google Scholar] [CrossRef] [PubMed]
  2. Balasubramaniam, K.; Soman, R.; Malinowski, P. Development of GUI Based Tool for the Visualization of the FBG Spectrum Subjected to Guided Waves. In European Workshop on Structural Health Monitoring; Springer International Publishing: Cham, Switzerland, 2023. [Google Scholar]
  3. Wee, J.; Wells, B.; Hackney, D.; Bradford, P.; Peters, K. Increasing signal amplitude in fiber Bragg grating detection of Lamb waves using remote bonding. Appl. Opt. 2016, 55, 5564–5569. [Google Scholar] [CrossRef] [PubMed]
  4. Wee, J.; Hackney, D.; Bradford, P.; Peters, K. Experimental study on directionality of ultrasonic wave coupling using surface-bonded fiber Bragg grating sensors. J. Lightwave Technol. 2017, 36, 932–938. [Google Scholar] [CrossRef]
  5. Huang, H.; Balusu, K. A Theoretical/Numerical Study on Ultrasound Wave Coupling From Structure to Remotely Bonded Fiber Bragg Grating Ultrasound Sensor. J. Nondestruct. Eval. Diagn. Progn. Eng. Syst. 2021, 4, 021007. [Google Scholar] [CrossRef]
  6. Balasubramaniam, K.; Soman, R.; Malinowski, P. Guided waves based damage detection based on quadrant area using optical fiber sensors. In Health Monitoring of Structural and Biological Systems XVI; SPIE: Bellingham, WA, USA, 2022; Volume 12048, pp. 44–51. [Google Scholar]
  7. Haider, M.F.; Bhuiyan, M.Y.; Poddar, B.; Lin, B.; Giurgiutiu, V. Analytical and experimental investigation of the interaction of Lamb waves in a stiffened aluminum plate with a horizontal crack at the root of the stiffener. J. Sound Vib. 2018, 431, 212–225. [Google Scholar] [CrossRef]
  8. Goossens, S.; De Pauw, B.; Geernaert, T.; Salmanpour, M.S.; Khodaei, Z.S.; Karachalios, E.; Saenz-Castillo, D.; Thienpont, H.; Berghmans, F. Aerospace-grade surface mounted optical fibre strain sensor for structural health monitoring on composite structures evaluated against in-flight conditions. Smart Mater. Struct. 2019, 28, 065008. [Google Scholar] [CrossRef]
Figure 1. (a) Schematic experimental setup, (b) PZT connection types.
Psf 04 00008 g001
Figure 2. Schematic cross-sectional ALS with: (a) remote bonding and (b) direct bonding and zoomed-in configuration [red rectangle denotes adhesive spread (i.e.,) the bond length].
Psf 04 00008 g002
Figure 3. Various modes in remote bonding with different PZT connections.
Psf 04 00008 g003
Figure 4. Zoomed picture of S0 mode GW signal (example).
Psf 04 00008 g004
Figure 5. S0 mode at 200 kHz with different PZT connections at (ac) remote bonding, and (df) direct bonding.
Psf 04 00008 g005
Figure 6. Attenuation trend patterns (ac): remote bonding, (df): direct bonding.
Psf 04 00008 g006
Table 1. Connection types and their expected outcomes.
S.NoConnection TypeOutcomesReason
1Outphase (+,−)amplifies A0 modeIn-plane S0 mode gets canceled due to negative polarity, and A0 GW mode amplifies.
2Inphase (+,+)amplifies S0 modeA0 mode is out-of-plane; the out-of-plane motion gets canceled, making S0 mode amplified.
3Normal (+,0)A0, S0 modeSignal with A0, S0 modes.
Table 2. Attenuation trend pattern at different configurations and connections.
S.NoConfiguration and ConnectionPeak Amplitude at HPeak Amplitude at 4HPercentage Increase/Decrease
1Remote-outphase0.4160% Increase
2Remote-inphase0.84116% Increase
3Remote-single0.820.9514% Increase
4Direct-outphase10.6535% Decrease
5Direct-inphase10.4555% Decrease
6Direct-single10.730% Decrease
Publisher’s Note: MDPI stays neutral with regard to jurisdictional claims in published maps and institutional affiliations.

