
Specimen Setup for Lifetime Investigations of Rubber Materials in the Compression Range †


Abstract
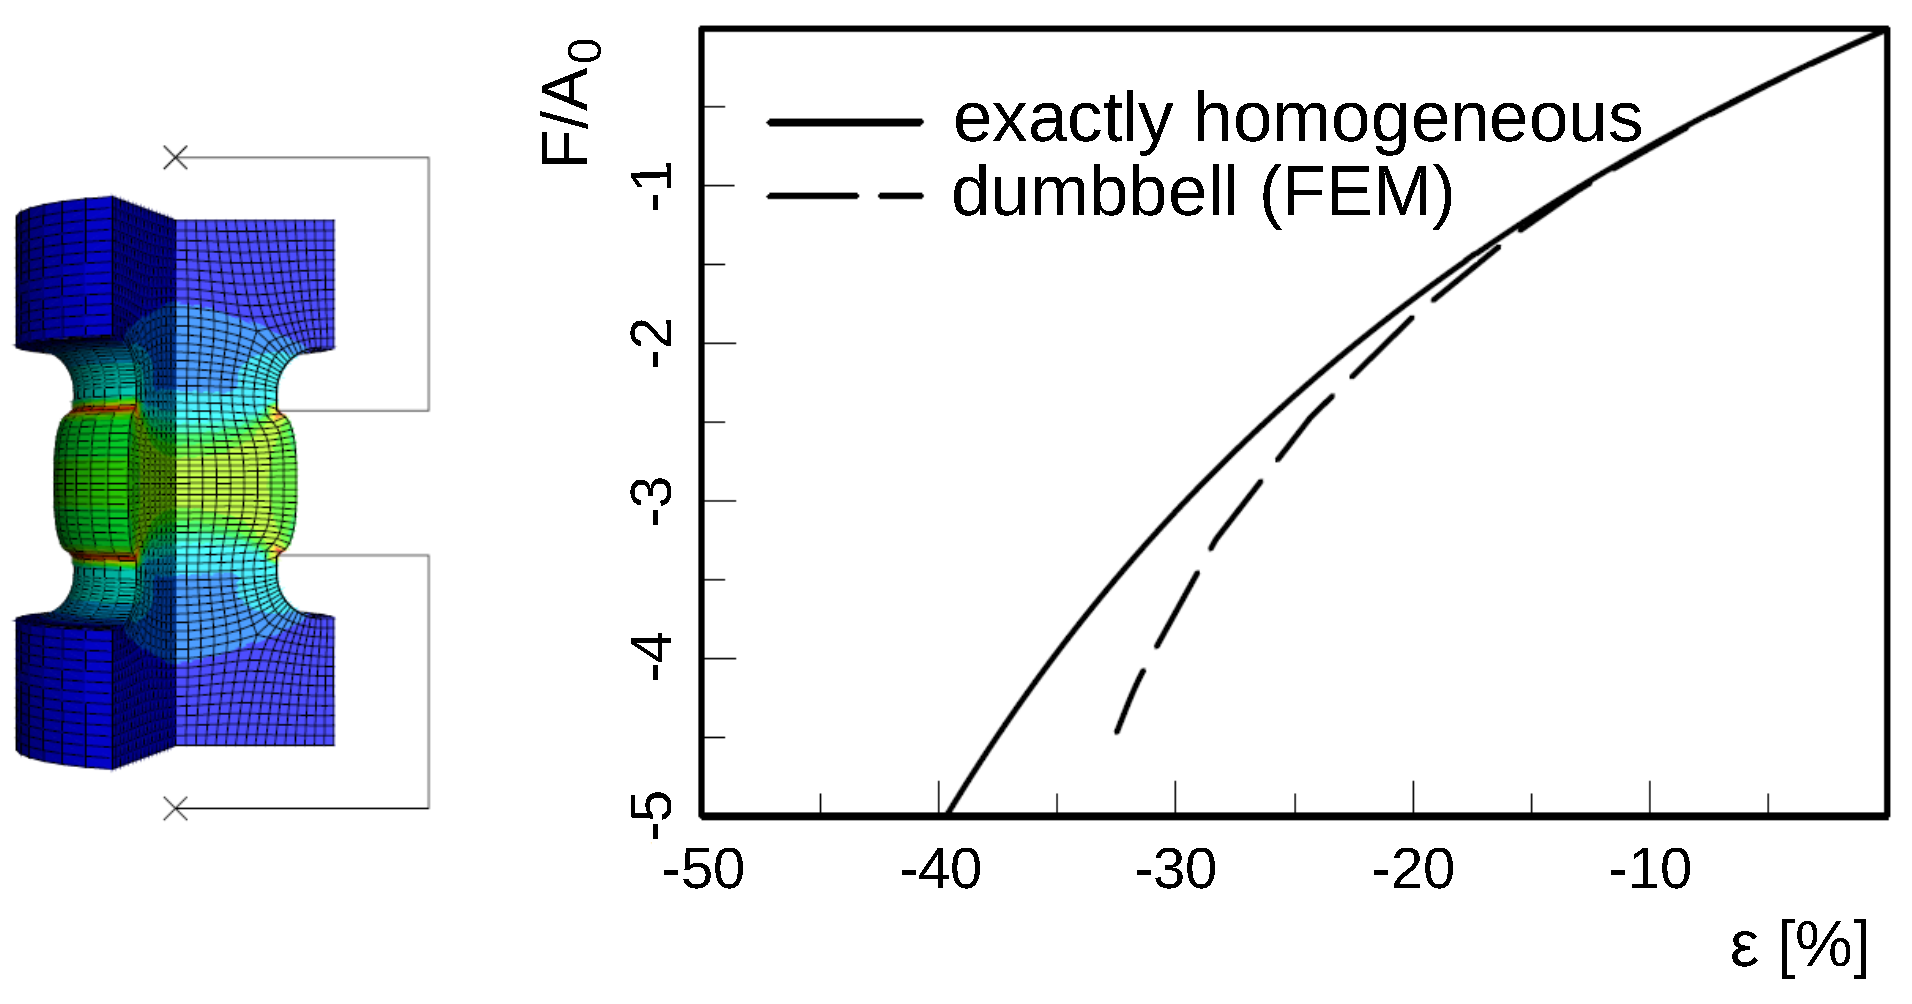
:1. Introduction of Fatigue Specimens
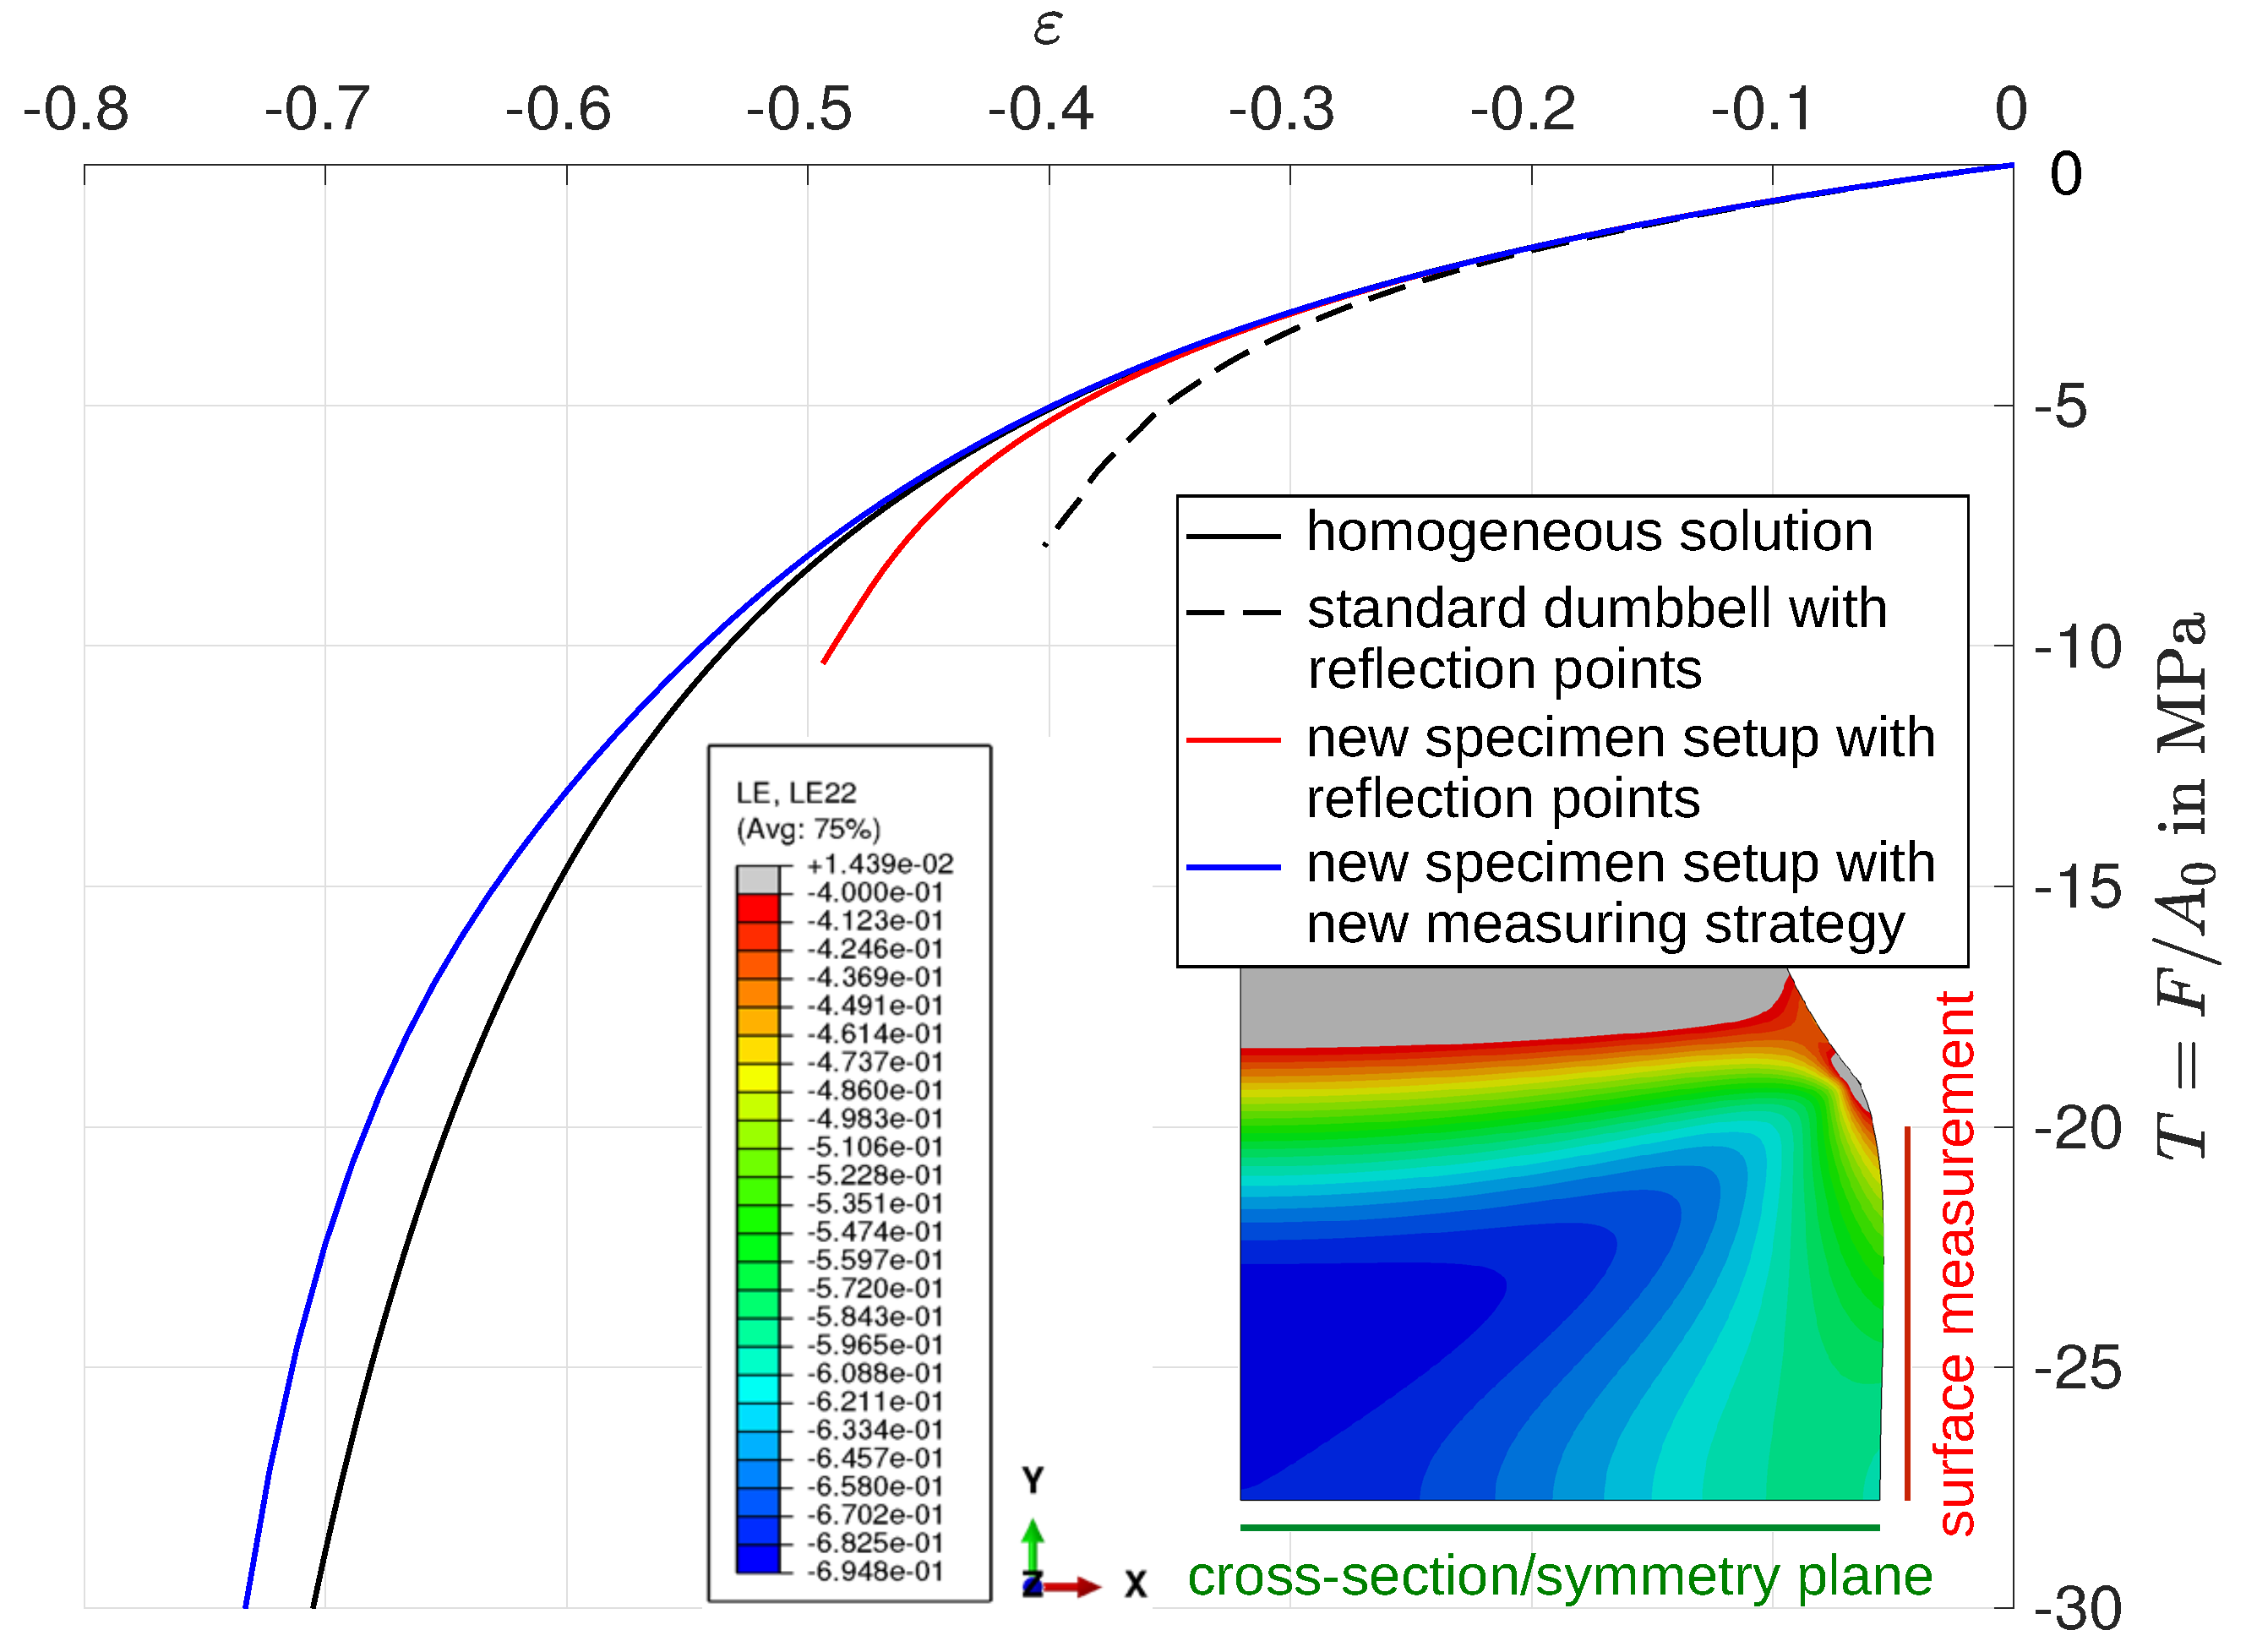
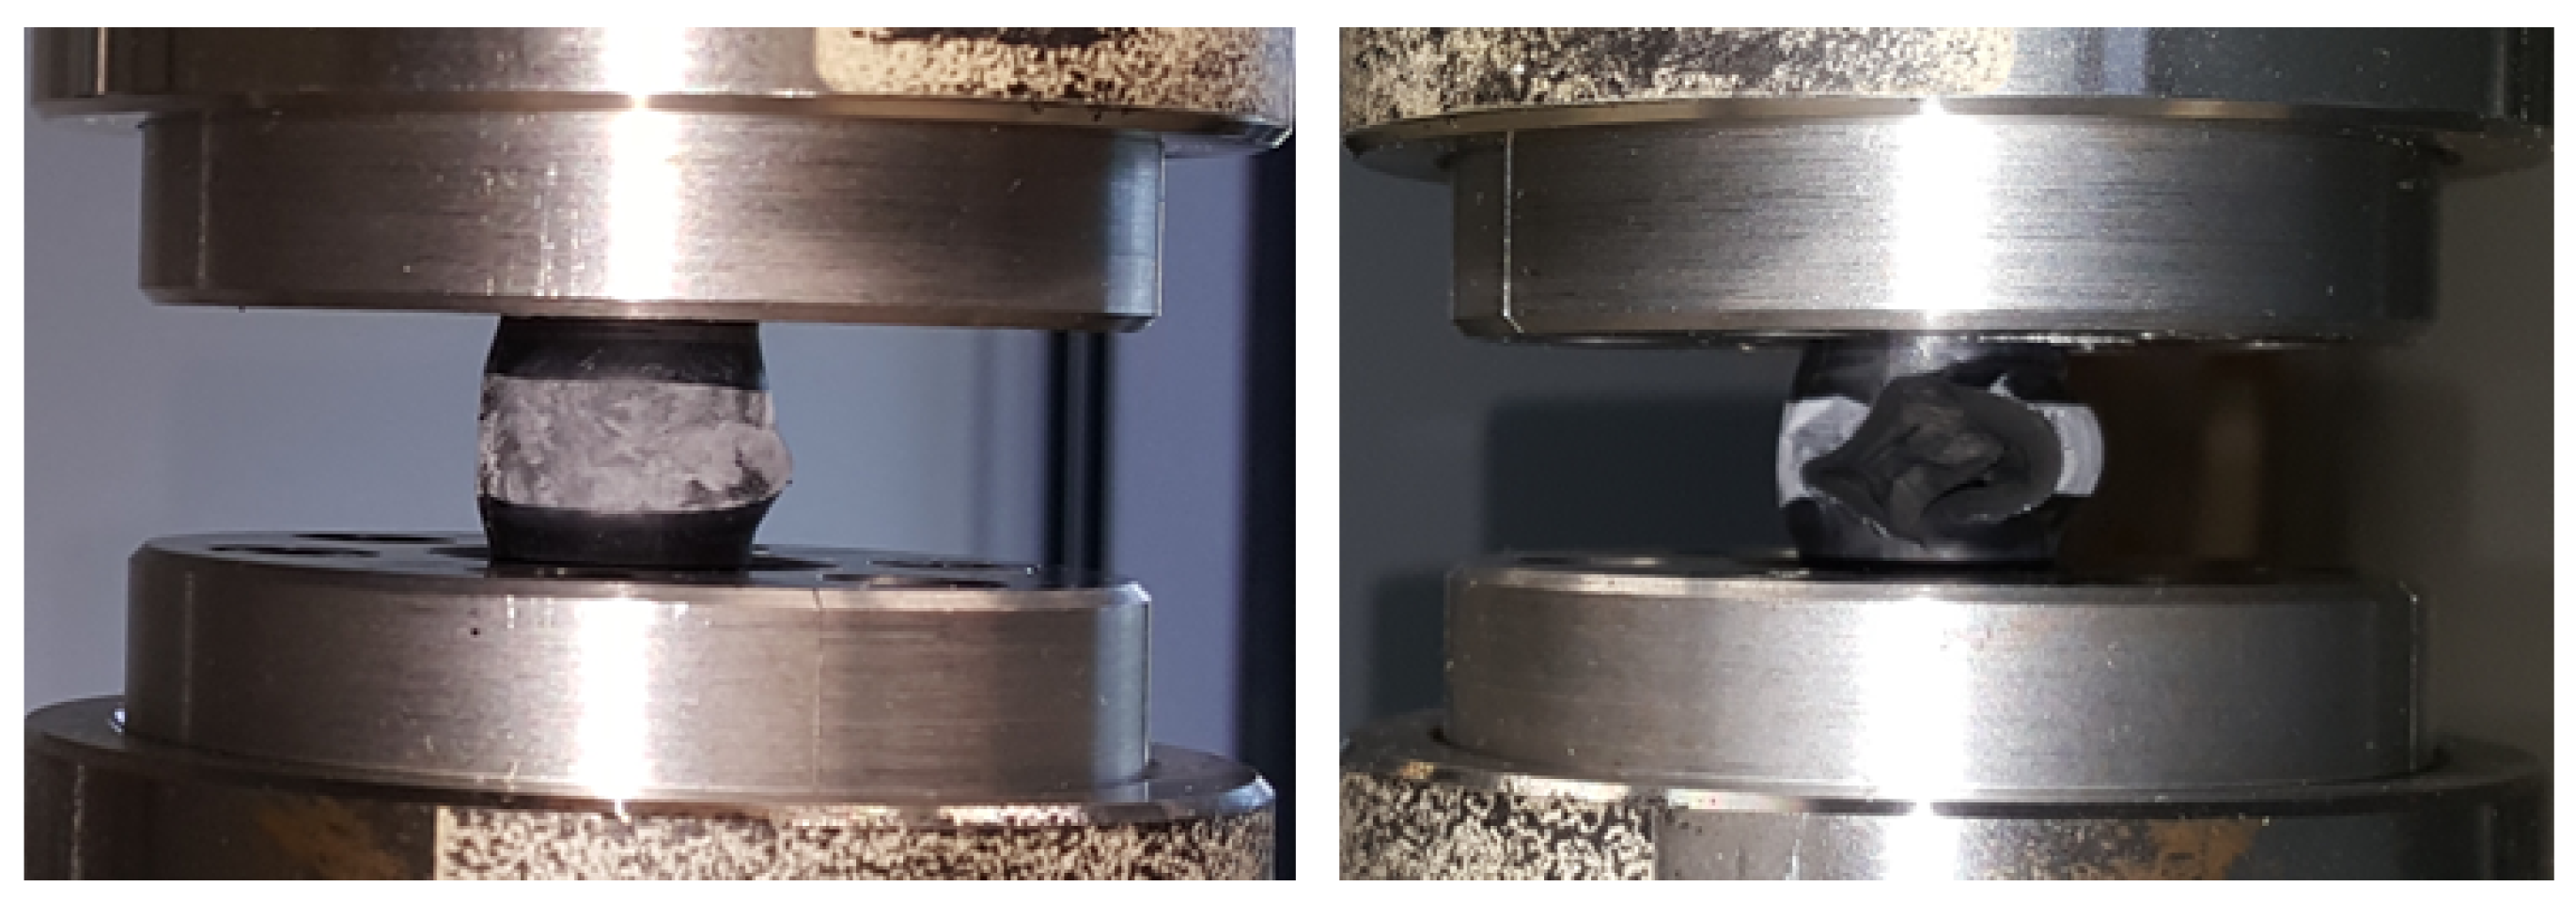
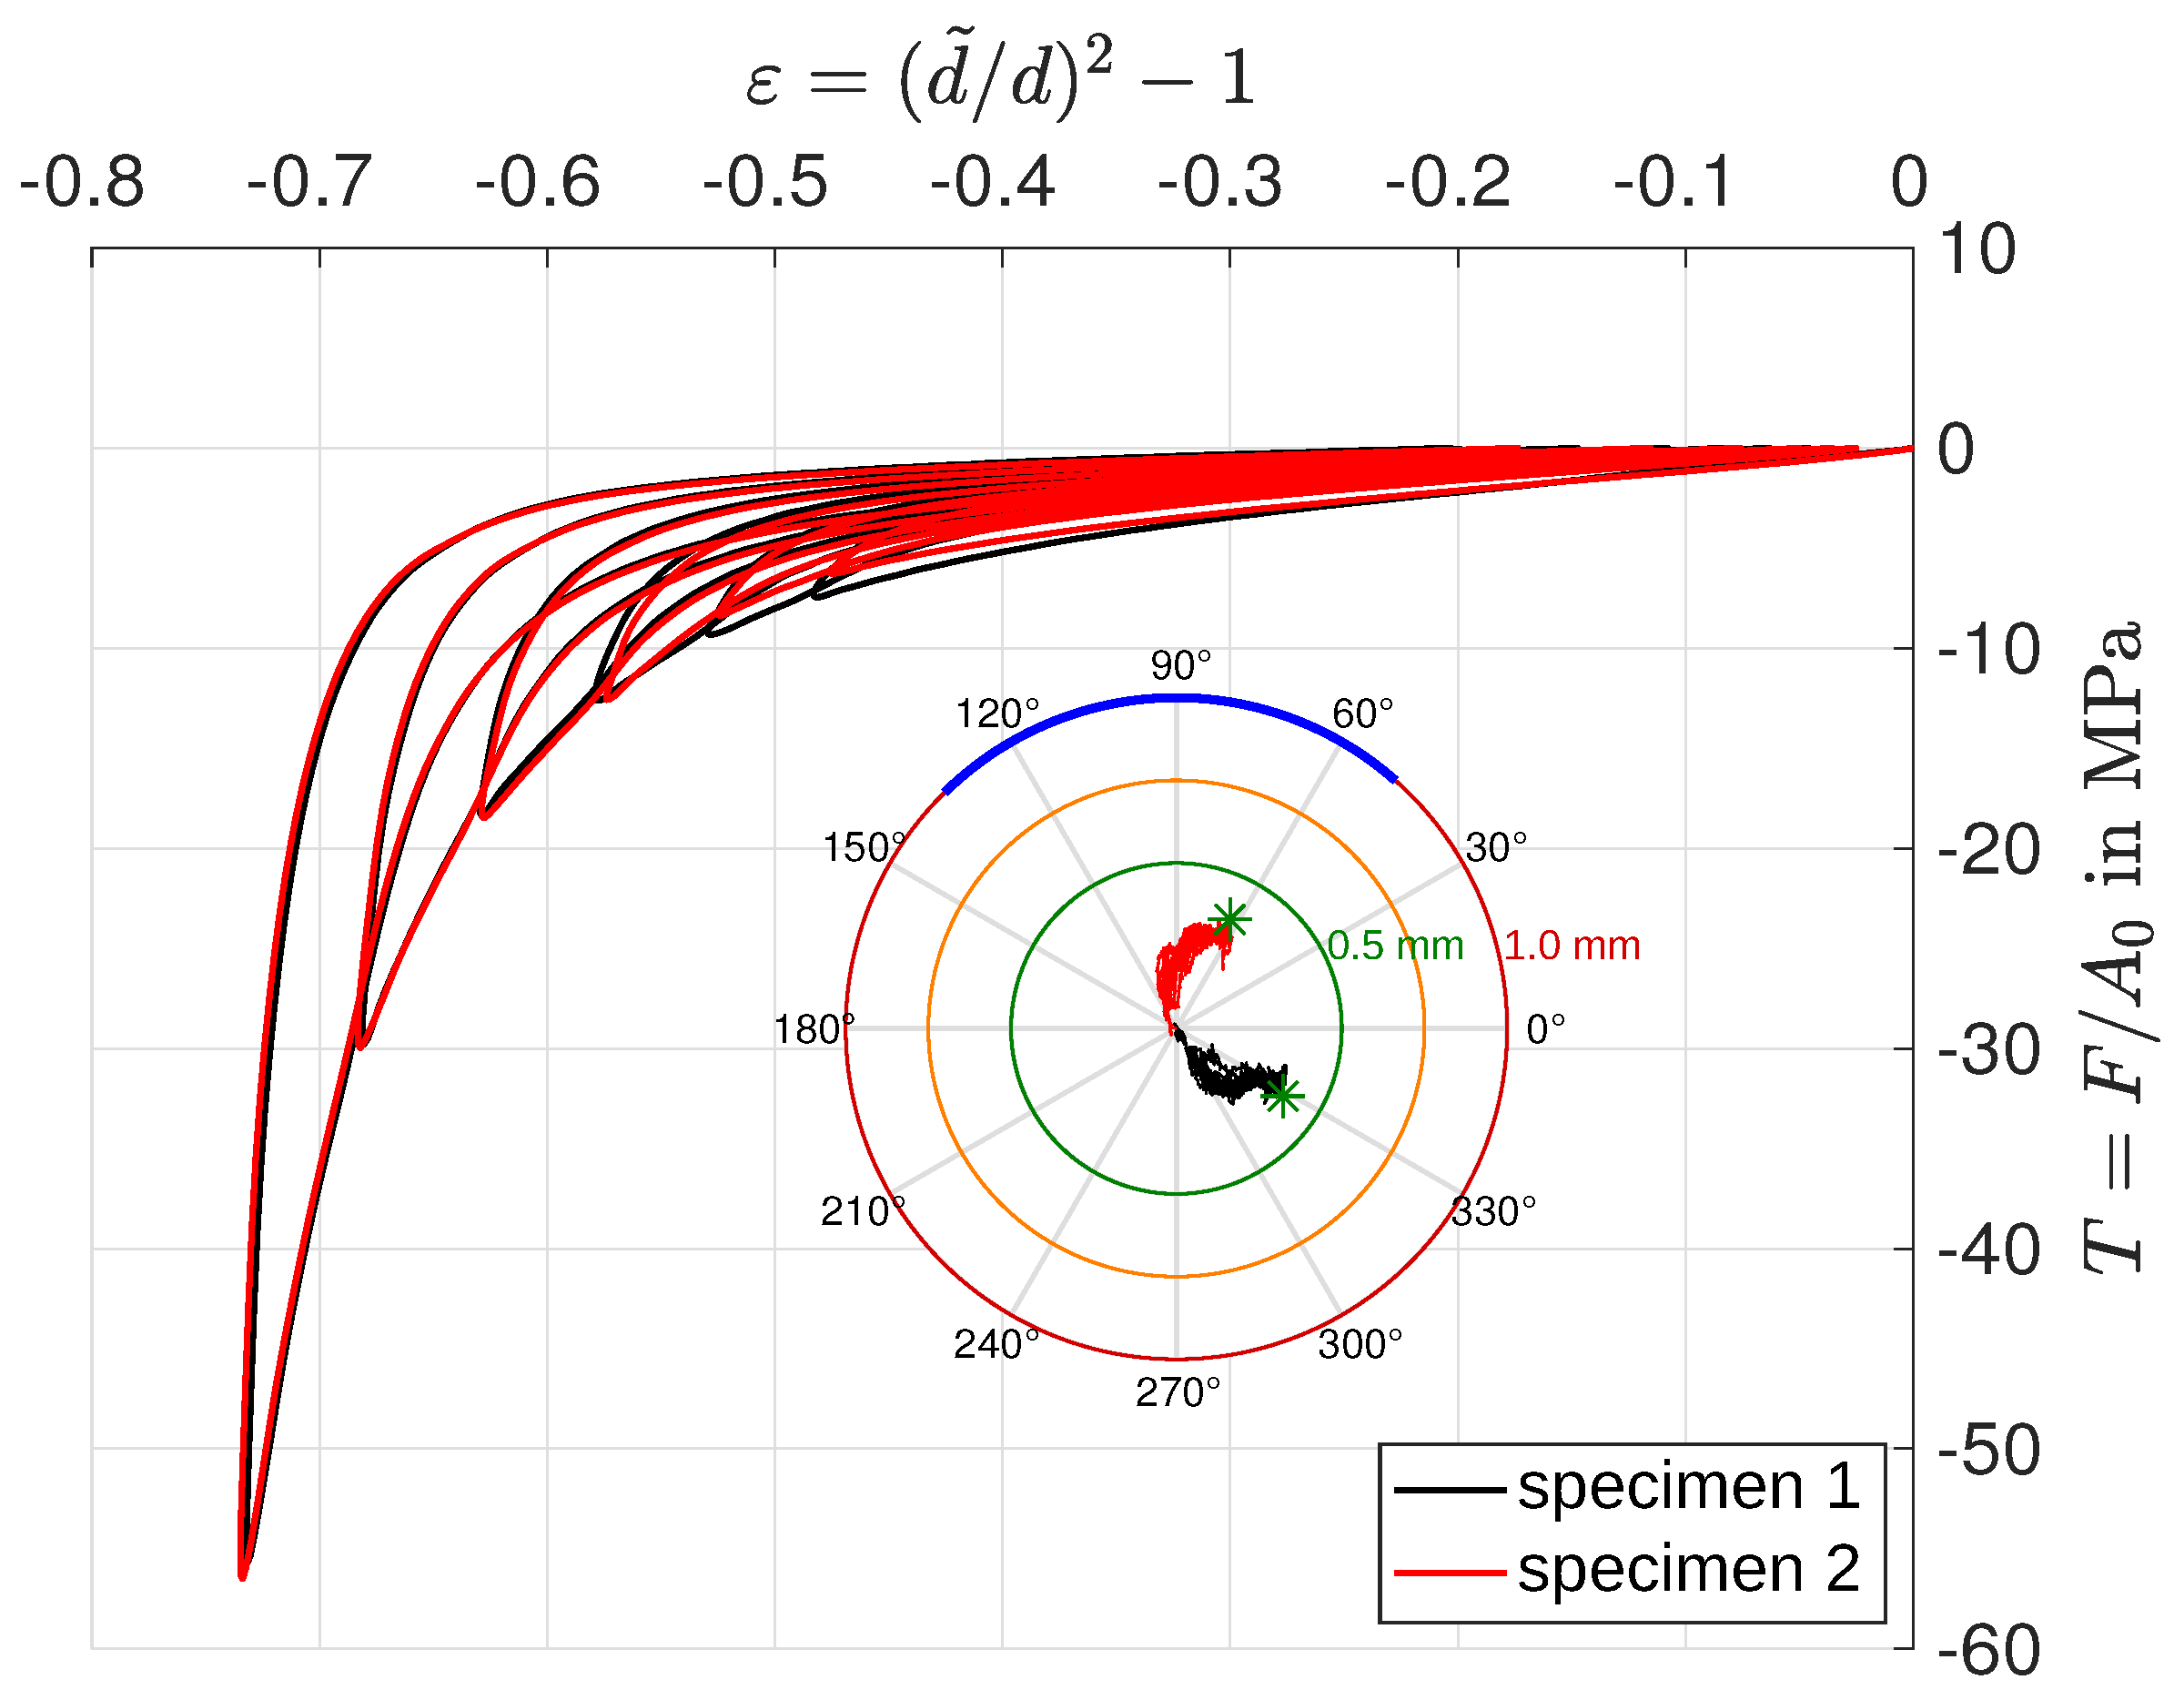
2. Experimental Setup and Measuring Device
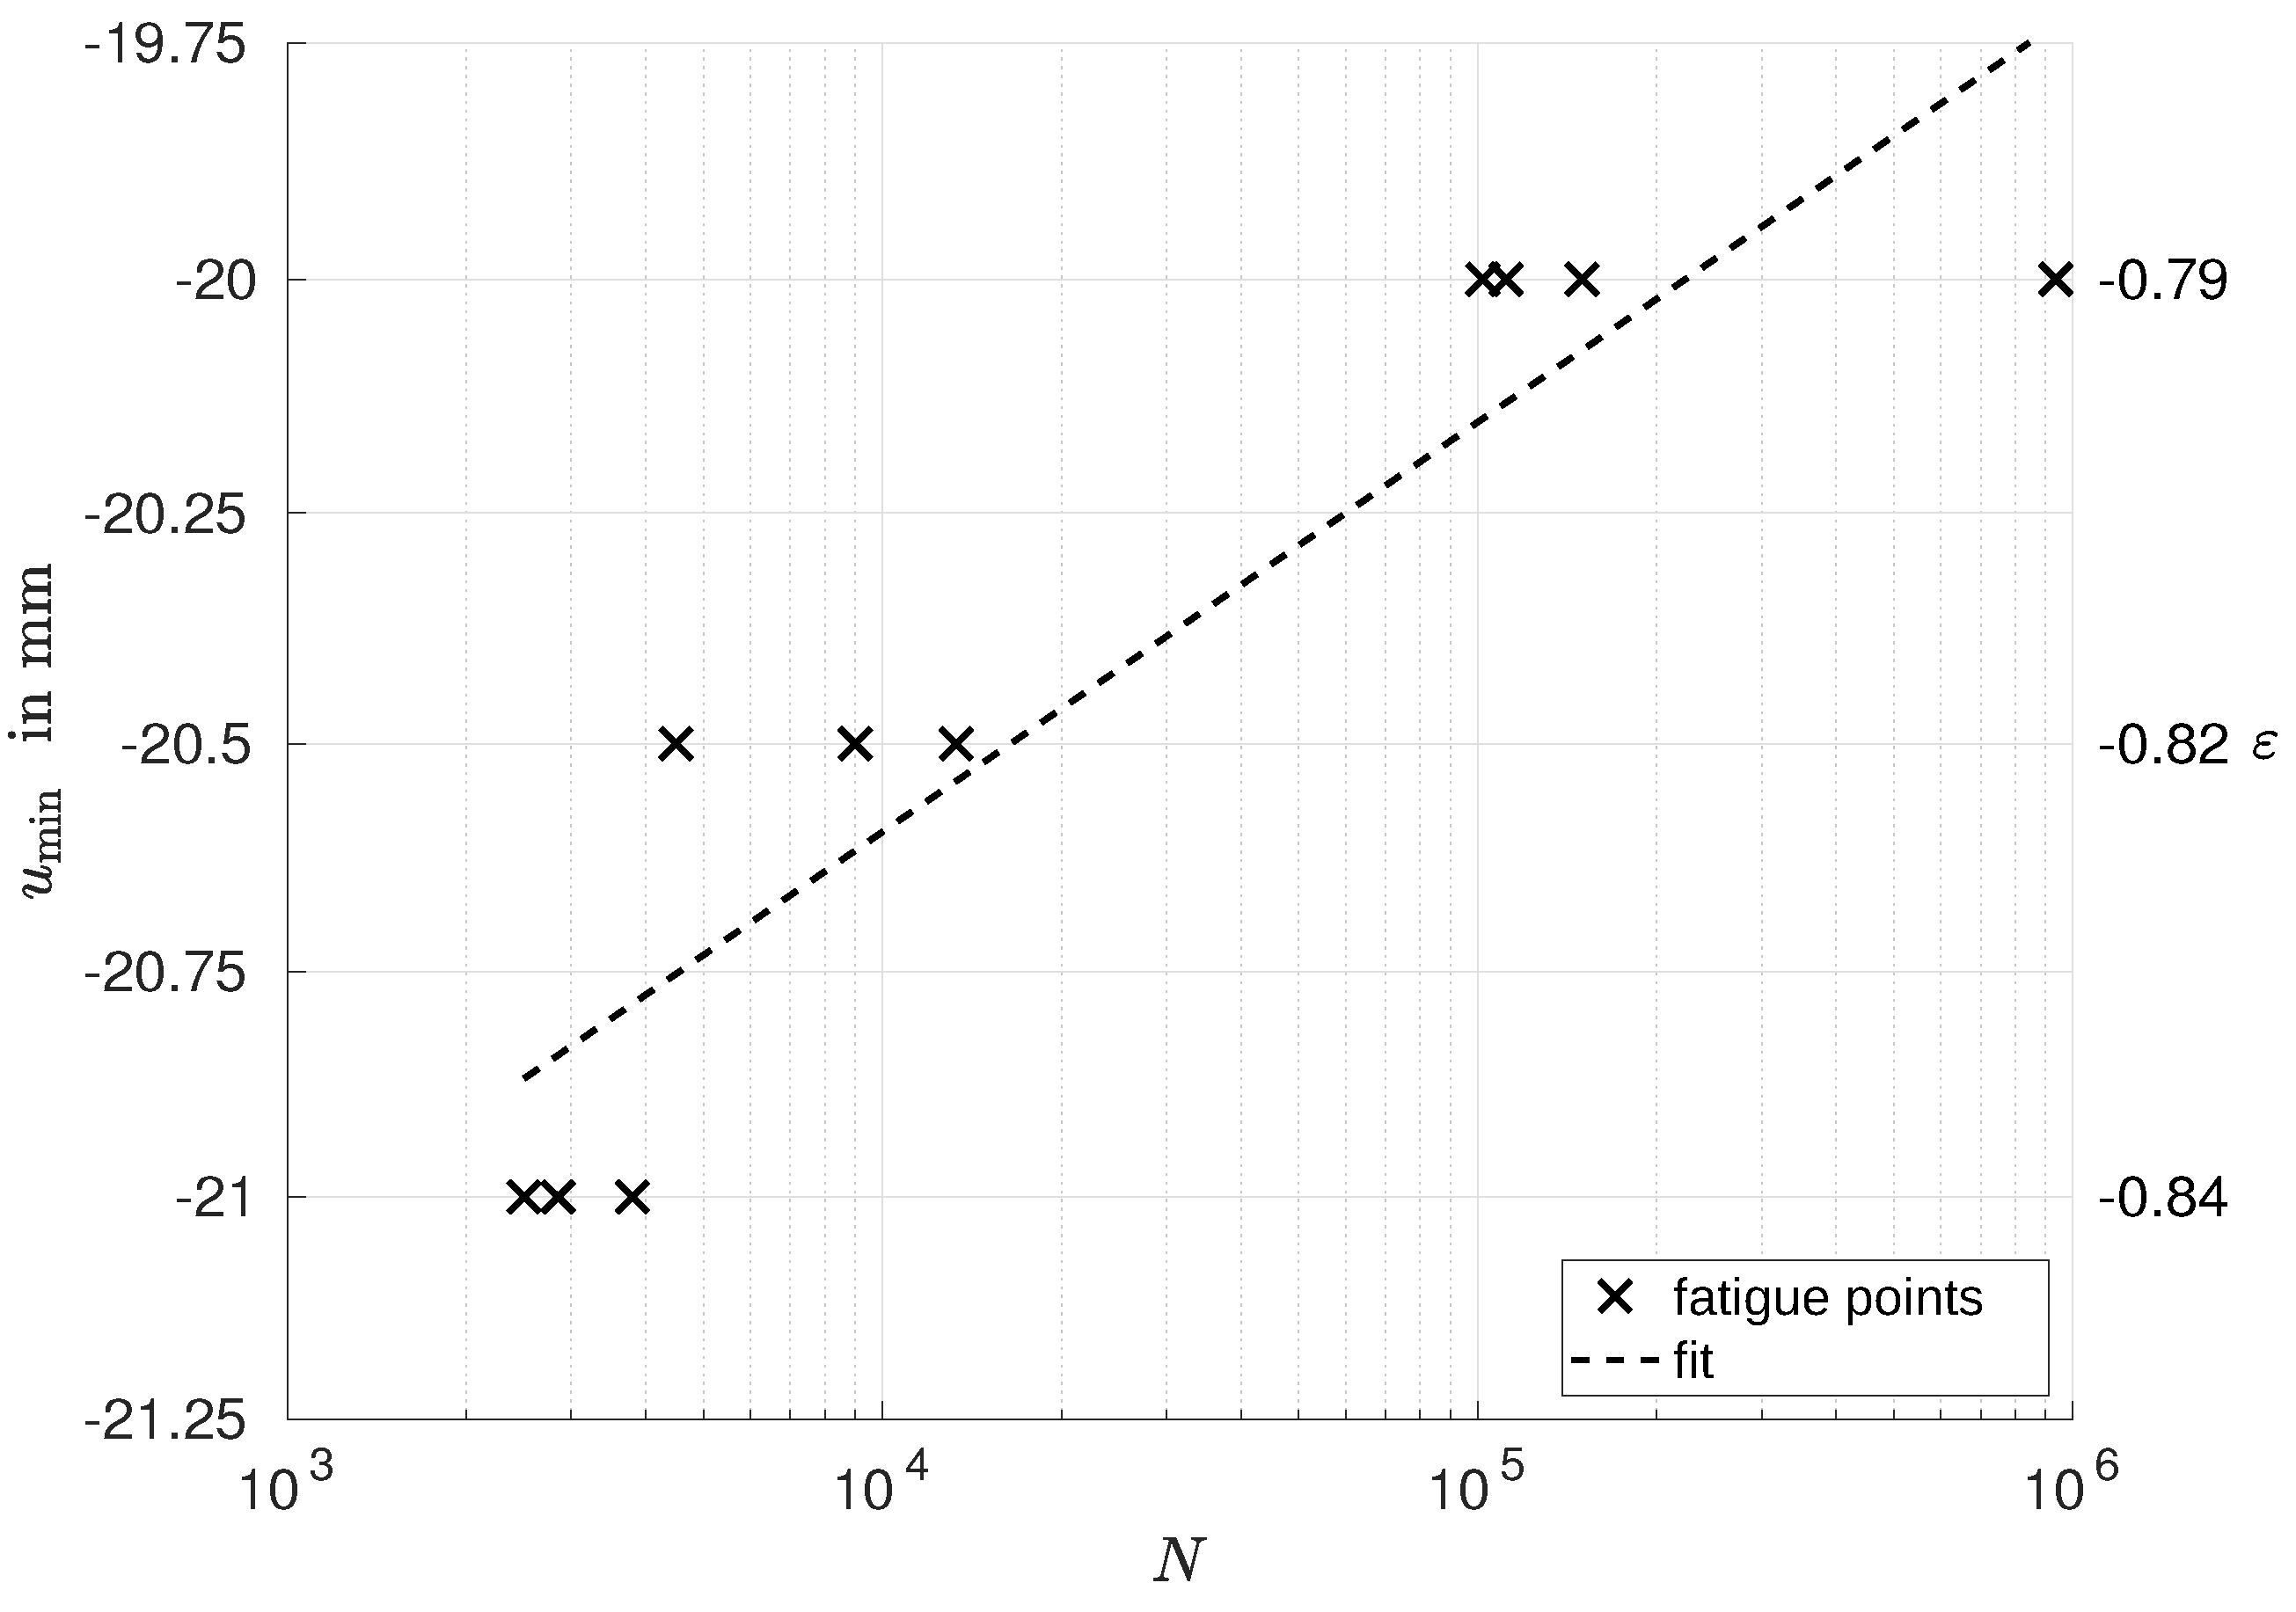
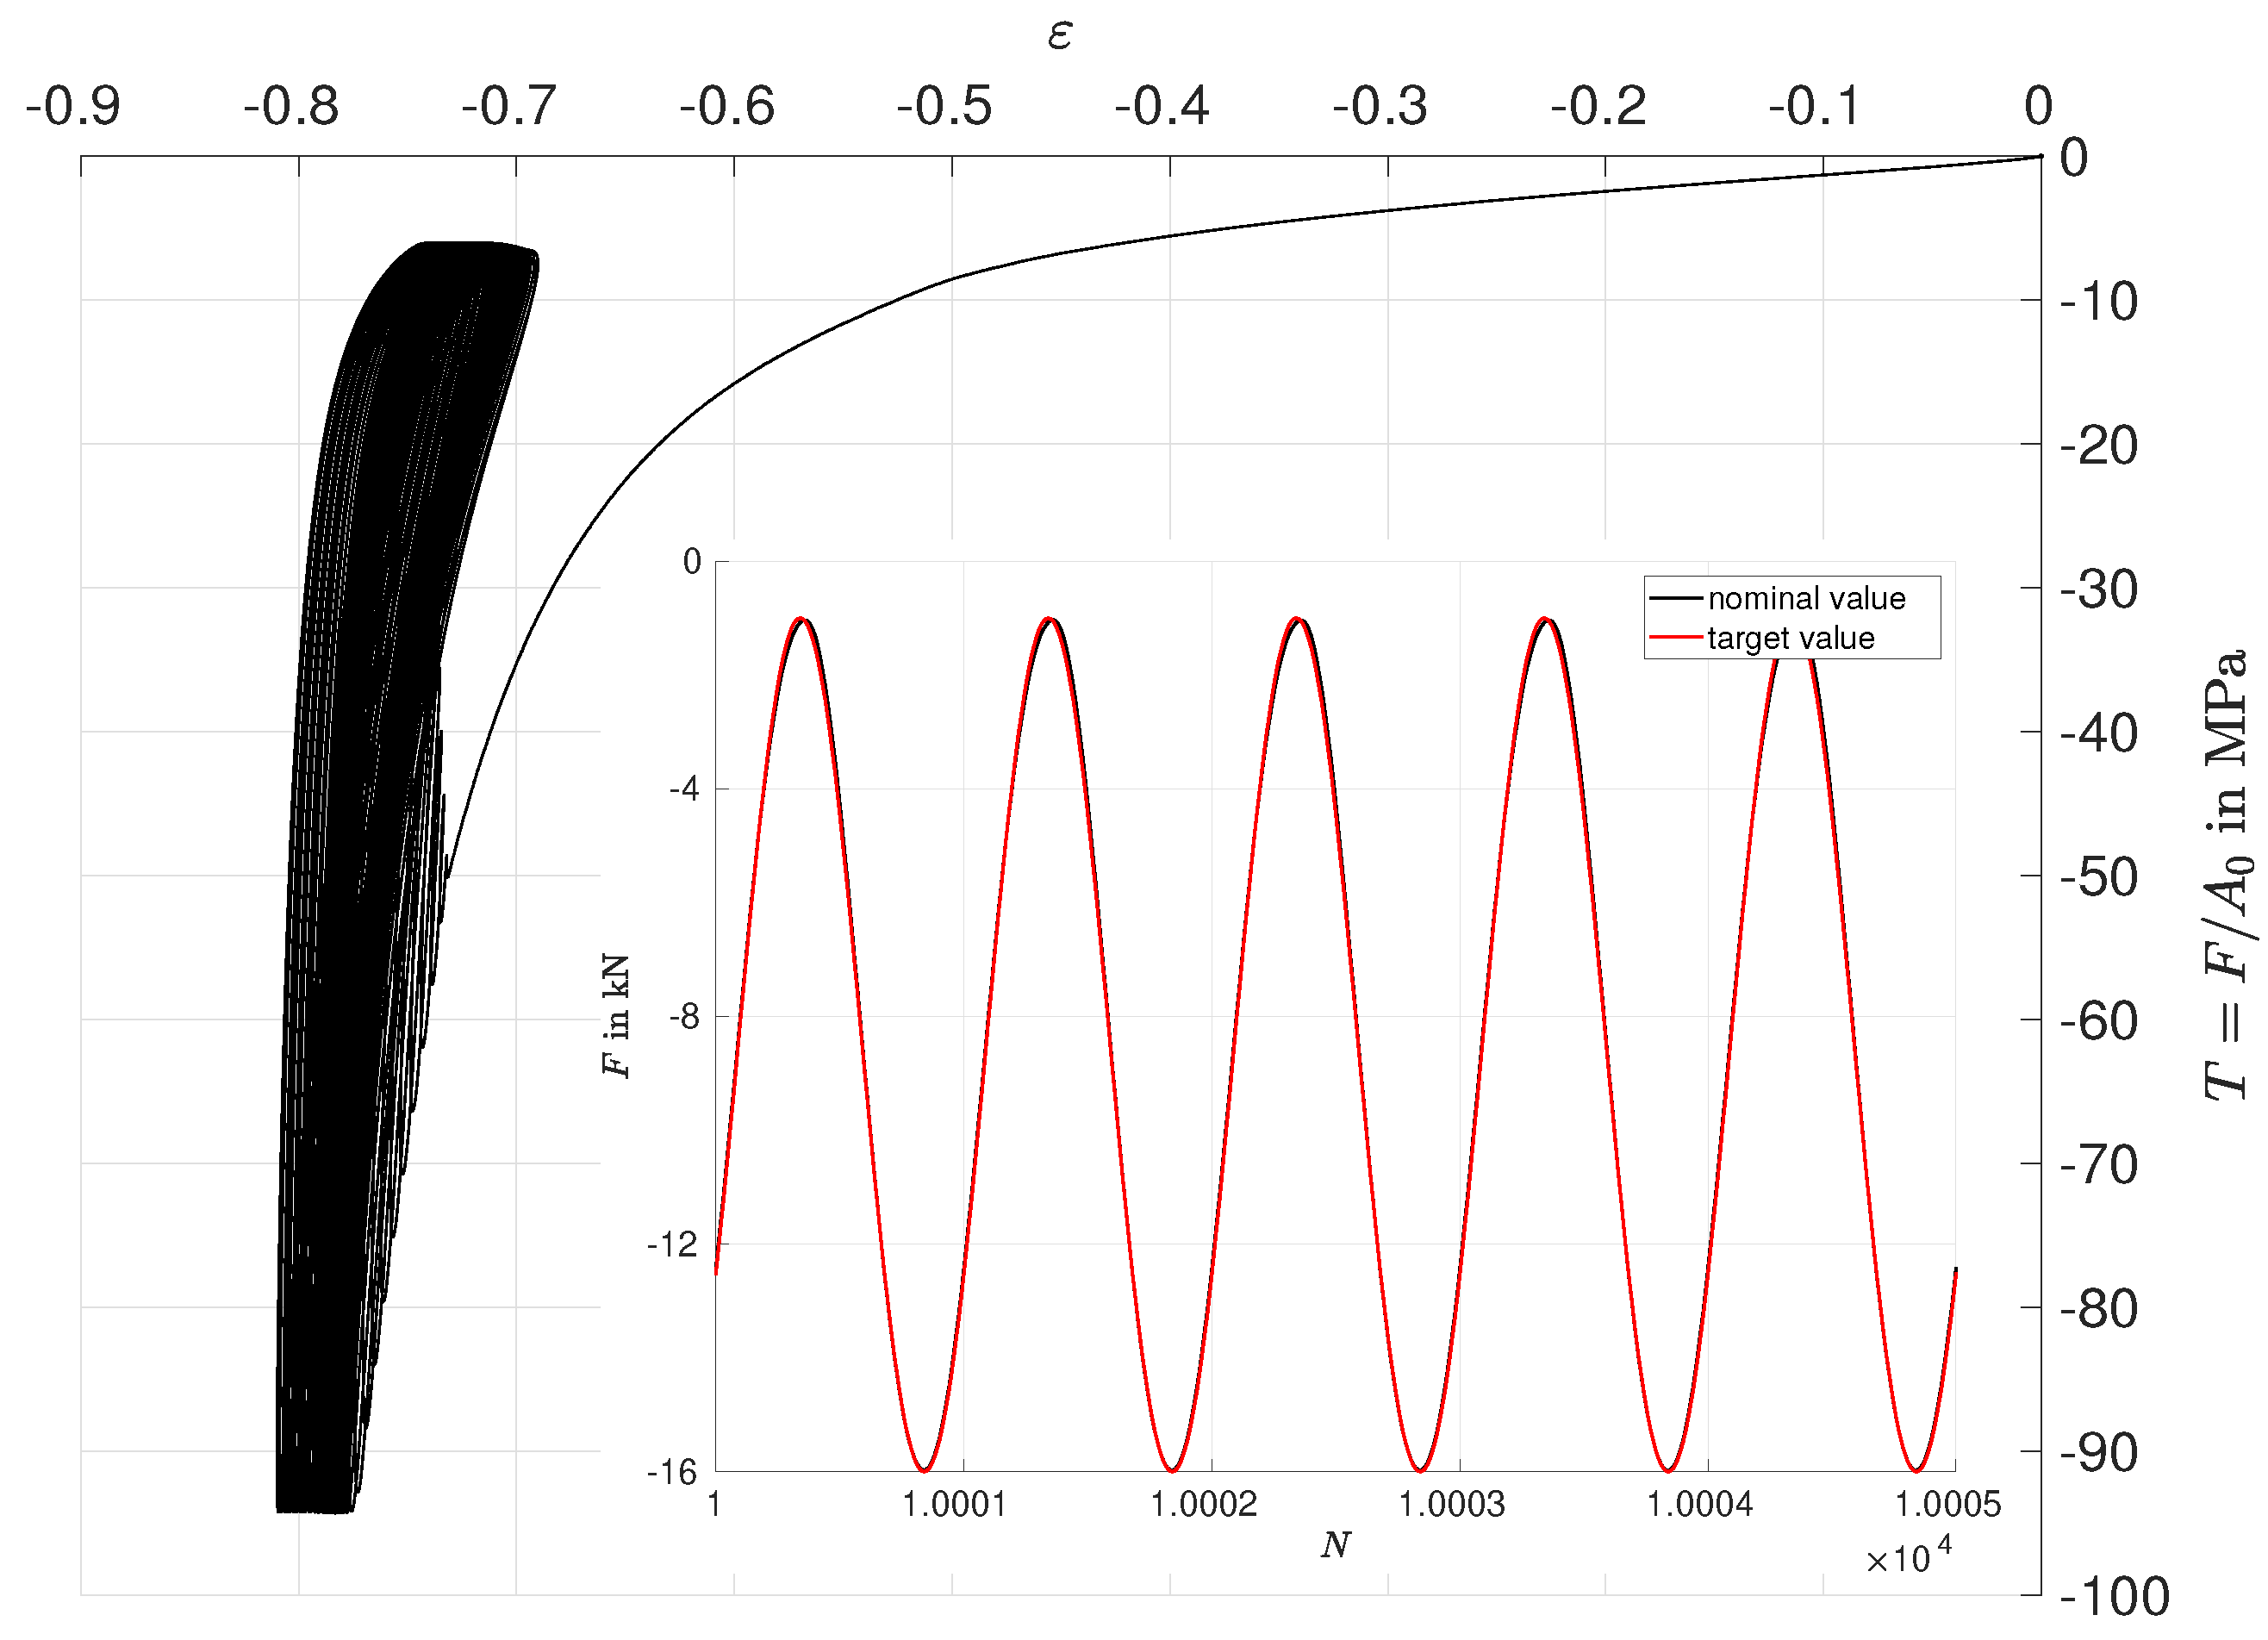
3. Fatigue Studies in the Compression Range
4. Conclusions
Author Contributions
Funding
Institutional Review Board Statement
Informed Consent Statement
Data Availability Statement
Acknowledgments
Conflicts of Interest
Abbreviations
| EPDM | Ethylene-propylene-diene monomer |
| DIC | Digital image correlation |
| PID | Proportional-integral-derivative |
References
- Cadwell, S.M.; Merrill, R.A.; Sloman, C.M.; Yost, F.L. Dynamic fatigue life of rubber. Rubber Chem. Technol. 1940, 13, 304–315. [Google Scholar] [CrossRef]
- Gent, A.N. Simple rotary dynamic testing machine. Br. J. Appl. Phys. 1960, 11, 165–167. [Google Scholar] [CrossRef]
- Klauke, R. Lebensdauervorhersage mehrachsig belasteter Elastomerbauteile unter besonderer Berücksichtigung Rotierender Beanspruchungsrichtungen. Ph.D. Thesis, Technische Universität Chemnitz, Chemnitz, Germany, 2015. [Google Scholar]
- Stevenson, A. A fracture mechanics study of the fatigue of rubber in compression. Int. J. Fract. 1983, 23, 47–59. [Google Scholar] [CrossRef]
- Abraham, F.; Alshuth, T.; Jerrams, S. Ermüdungsbeständigkeit von Elastomeren: Einfluss der Spannungsamplitude und der Unterspannung Teil 2. KGK Kautsch. Gummi Kunstst. 2002, 55, 674–678. [Google Scholar]
- Flamm, M. Ein Beitrag zur Betriebsfestigkeitsvorhersage mehraxial belasteter Elastomerbauteile; VDI-Verlag: Düsseldorf, Germany, 2003. [Google Scholar]
- Flamm, M.; Steinweger, T.; Weltin, U. Festigkeitshypothesen in der rechnerischen Lebensdauervorhersage von Elastomeren. KGK Kautsch. Gummi Kunstst. 2003, 56, 582–586. [Google Scholar]
- Saintier, N.; Cailletaud, G.; Piques, R. Crack initiation and propagation under multiaxial fatigue in a natural rubber. Int. J. Fatigue 2006, 28, 61–72. [Google Scholar] [CrossRef]
- Le Cam, J.-B.; Huneau, B.; Verron, E. Description of fatigue damage in carbon black filled natural rubber. Fatigue Fract. Eng. Mater. Struct. 2008, 31, 1031–1038. [Google Scholar] [CrossRef]
- Kim, H.J.; Song, M.W.; Moon, H.I.; Kim, H.; Kim, H.Y. Fatigue life prediction of a rubber material based on dynamic crack growth considering shear effect. Int. J. Automot. Technol. 2014, 15, 317–324. [Google Scholar] [CrossRef]
- Juhre, D.; Krause, M. A study on the influence of mechanical preconditioning on the fatigue behavior of rubber materials. In Constitutive Models for Rubber IX; Marvalová, B., Petríková, I., Eds.; Balkema: Leiden, The Netherlands, 2015; pp. 439–444. [Google Scholar]
- Kaindl, S. Simulation der Schwingfestigkeit von Elastomerbauteilen; Cuvillier Verlag: Göttingen, Germany, 2015. [Google Scholar]
- Ludwig, M. Entwicklung eines Lebensdauer-Vorhersagekonzepts für Elastomerwerkstoffe unter Berücksichtigung der Fehlstellenstatistik. Ph.D. Thesis, Gottfried Wilhelm Leibniz Universität Hannover, Hannover, Germany, 2017. [Google Scholar]
- Yaagoubi, M.E. Vorhersage der charakteristischen Lebensdauer von Elastomeren im Rahmen der probabilistischen Bruchmechanik. Ph.D. Thesis, Otto-von-Guericke-Universität Magdeburg, Magdeburg, Germany, 2018. [Google Scholar]
- Belkhiria, S.; Hamdi, A.; Fathallah, R. Strain-based criterion for uniaxial fatigue life prediction for an SBR rubber: Comparative study and development. Proc. Inst. Mech. Eng. L J. Mater. Des. Appl. 2020, 234, 897–909. [Google Scholar] [CrossRef]
- Yaagoubi, M.E.; Maanaoui, H.E.; Meier, J. New fatigue test sample: Lifetime prediction of carbon black filled elastomers based on the probability distribution of particles. Polymer 2020, 208, 122973. [Google Scholar] [CrossRef]
- Alshuth, T.; Hohl, C.; Ihlemann, J. Vergleichende Messungen und Simulationen annähernd homogener Belastungsverteilungen. PAMM: Proc. Appl. Math. Mech. 2007, 7, 53–54. [Google Scholar] [CrossRef]
- Kanzenbach, L.; Naumann, C.; Ihlemann, J. Specimen design for high precision tension–compression tests. PAMM: Proc. Appl. Math. Mech. 2016, 16, 207–208. [Google Scholar] [CrossRef] [Green Version]
- Kanzenbach, L.; Schlomka, C.; Gelke, S.; Ihlemann, J. Specimen design for extreme uniaxial tension–compression tests of rubber materials. PAMM: Proc. Appl. Math. Mech. 2019, 19, e201900371. [Google Scholar] [CrossRef]
- Kanzenbach, L. Experimentell-numerische Vorgehensweise zur Entwicklung von Probekörper-Setups für die Charakterisierung technischer Elastomere; VDI-Verlag: Düsseldorf, Germany, 2021. [Google Scholar]


| No.: | 1 | 2 | 3 | 4 | 5 | 6 | 7 | 8 | 9 | 10 |
|---|---|---|---|---|---|---|---|---|---|---|
| in mm: | ||||||||||
| in mm: | 5 | 5 | 5 | 5 | 5 | 5 | 5 | 5 | 5 | 5 |
| Cycles to failure N: | 102,000 | 149,700 | 936,000 | 111,600 | 13,300 | 4500 | 9000 | 2850 | 2500 | 3800 |
| No.: | 1 | 2 | 3 | 4 | 5 |
|---|---|---|---|---|---|
| in kN: | |||||
| in kN: | 6.5 | 6.5 | 6.5 | 7.5 | 7.5 |
| Cycles to failure N: | 220,000 | 335,000 | 419,000 | 137,000 | 94,000 |
Publisher’s Note: MDPI stays neutral with regard to jurisdictional claims in published maps and institutional affiliations. |
© 2022 by the authors. Licensee MDPI, Basel, Switzerland. This article is an open access article distributed under the terms and conditions of the Creative Commons Attribution (CC BY) license (https://creativecommons.org/licenses/by/4.0/).
Share and Cite
Kanzenbach, L.; Ihlemann, J. Specimen Setup for Lifetime Investigations of Rubber Materials in the Compression Range. Phys. Sci. Forum 2022, 4, 4. https://doi.org/10.3390/psf2022004004
Kanzenbach L, Ihlemann J. Specimen Setup for Lifetime Investigations of Rubber Materials in the Compression Range. Physical Sciences Forum. 2022; 4(1):4. https://doi.org/10.3390/psf2022004004
Chicago/Turabian StyleKanzenbach, Lars, and Jörn Ihlemann. 2022. "Specimen Setup for Lifetime Investigations of Rubber Materials in the Compression Range" Physical Sciences Forum 4, no. 1: 4. https://doi.org/10.3390/psf2022004004
APA StyleKanzenbach, L., & Ihlemann, J. (2022). Specimen Setup for Lifetime Investigations of Rubber Materials in the Compression Range. Physical Sciences Forum, 4(1), 4. https://doi.org/10.3390/psf2022004004