1. Introduction
In recent years, the use of composite materials in automotive applications has become noticeable [
1]. This is due to their high specific strength and the flexibility to develop certain material properties in preferential directions. Therefore, composites can be found in various car components, from body panels and bumpers to frames, spoilers, and chassis [
2,
3,
4,
5]. It is nevertheless known that the development of stresses and the damage process in such layered configurations is much more complicated compared to, for instance, more traditional metal parts. This indicates the need for the testing of demonstrator parts in order to examine their response under complex static and, especially, fatigue loads with the final target being to develop reliable predictive failure tools.
A characteristic example of the use of composites in the automotive sector could be in the form of beams. Considering the anisotropy of the material together with the geometrical nonuniformity of such geometries, it is evident that complex damage modes and sequences can occur during loading, showing the need to perform thorough experimental campaigns and corresponding damage analyses. Therefore, in this research, a carbon/epoxy beam component is experimentally analysed (see
Figure 1). The current paper deals with the initial analysis of V-shape specimens to mimic the corner of the beam component, and further research has been performed to the whole beam structure in order to study the damage behaviour in a progressive manner. Digital Image Correlation (DIC) and Acoustic Emission (AE) are applied during the tests to determine the benefits of such methods during damage characterization, compared to more traditional measurement techniques [
6,
7,
8,
9].
2. Materials and Methods
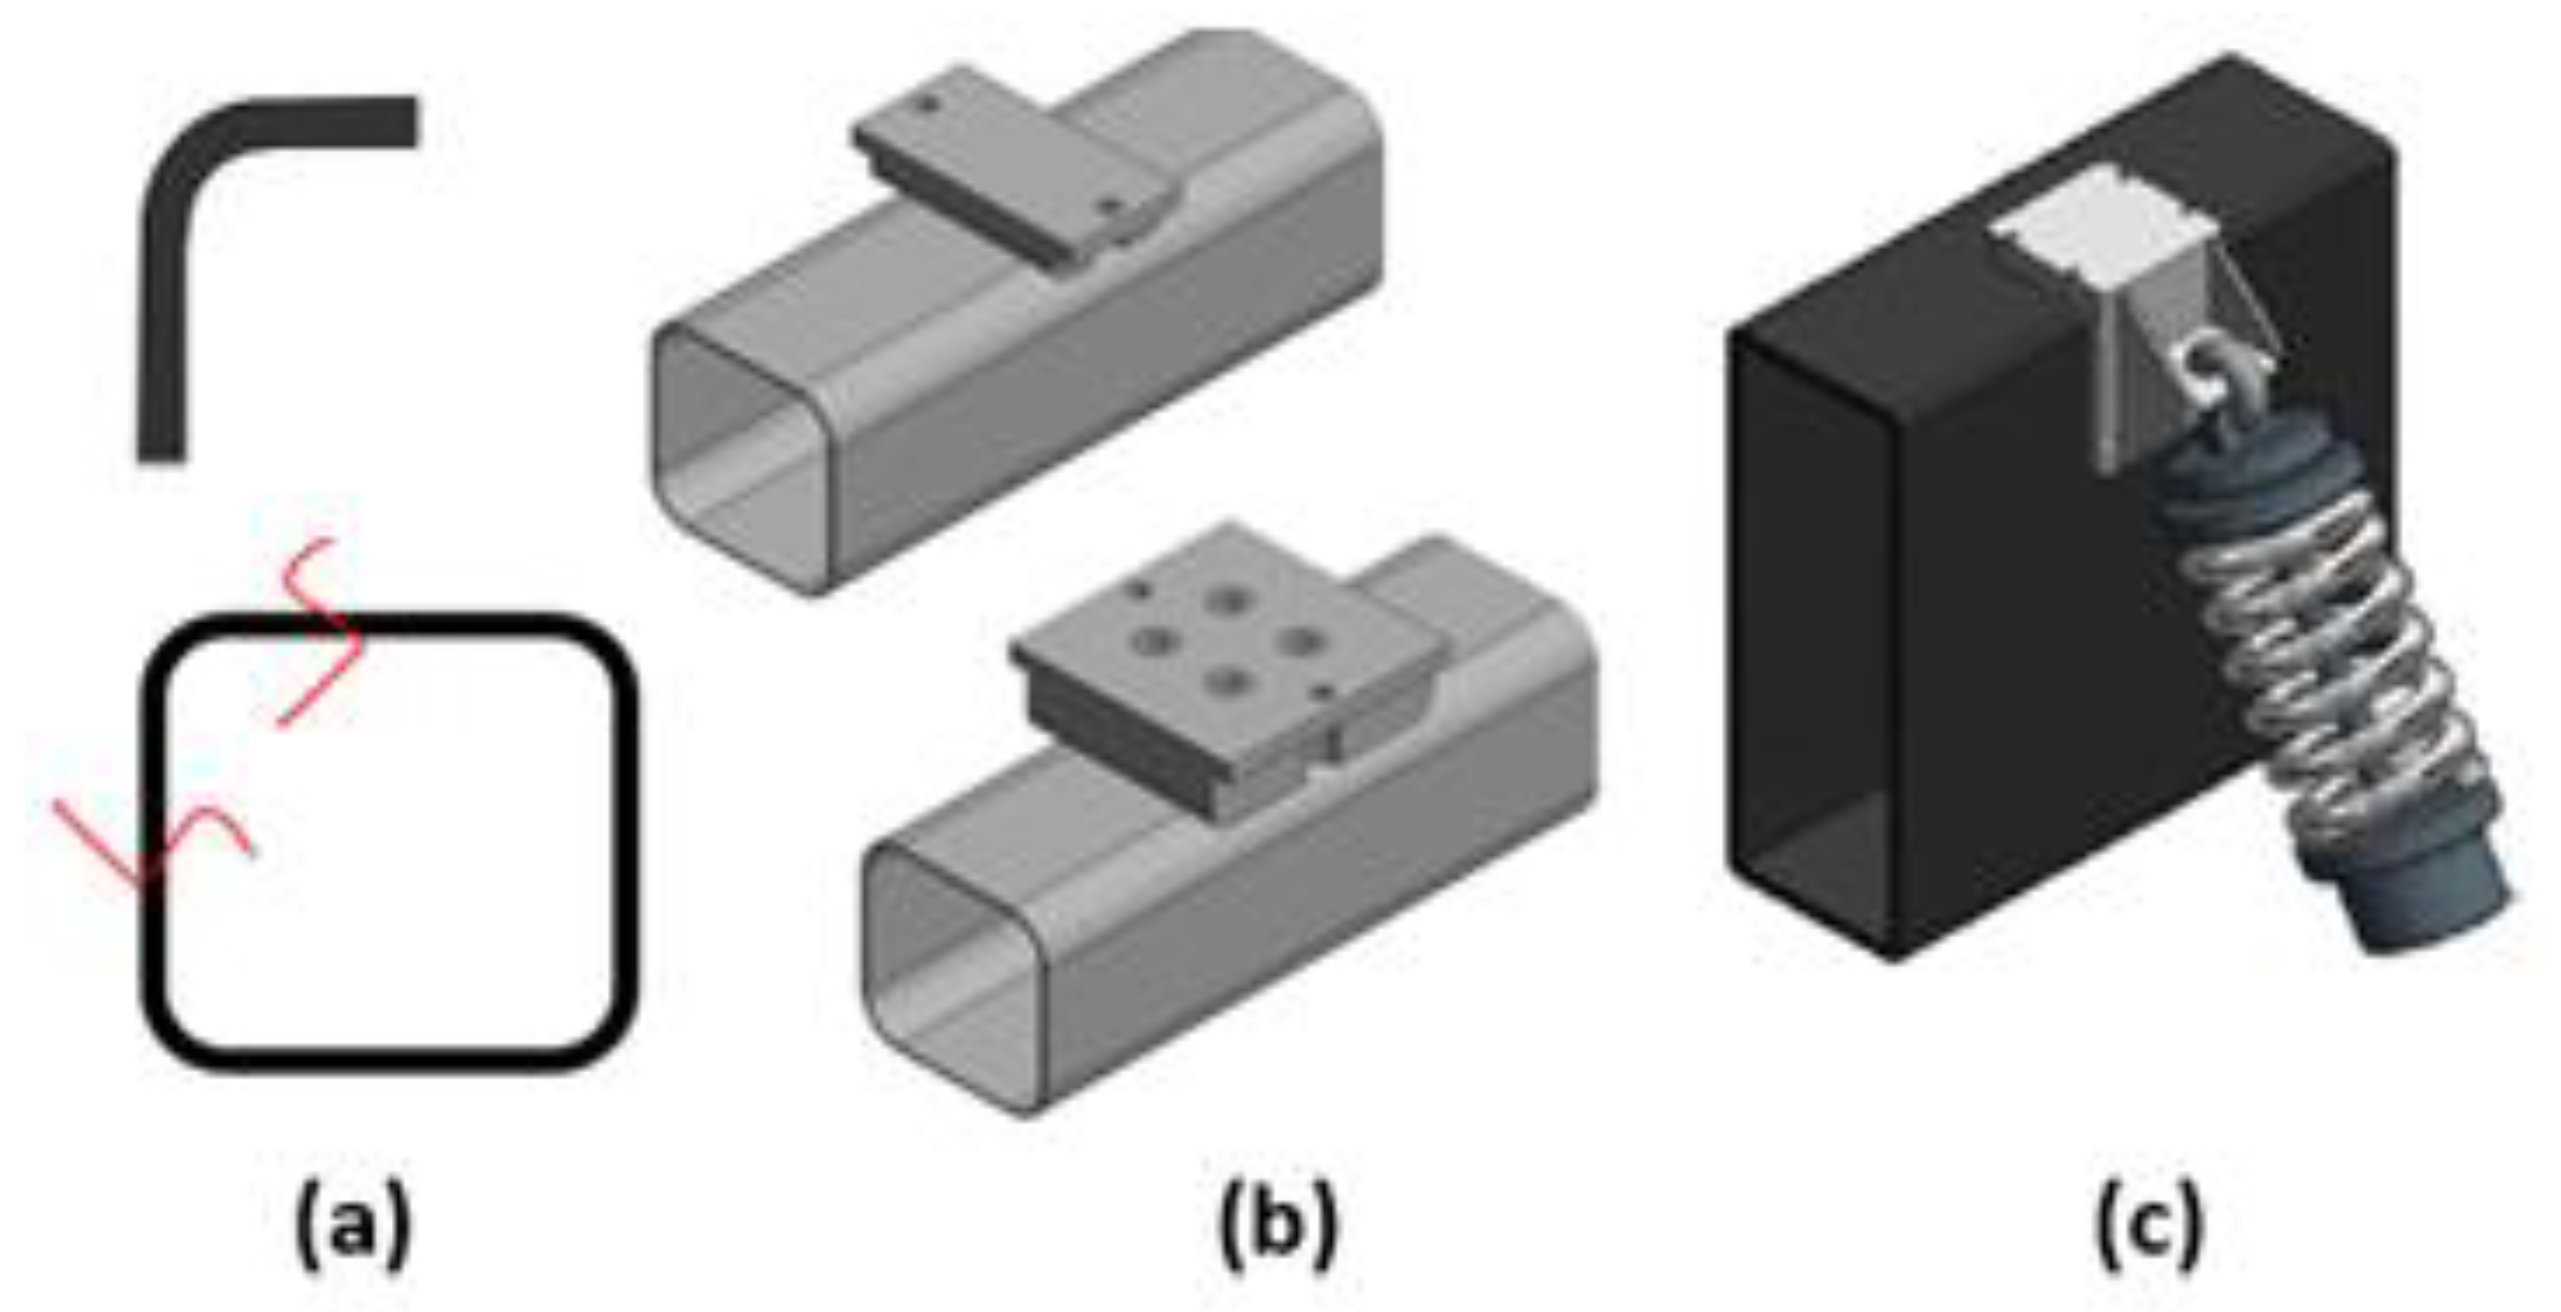
The V-shape specimens were manufactured using a carbon/epoxy composite material with a [30°/−30°/90°]
4s stacking sequence and a thickness of 5.6 mm (see
Figure 2). The specimens were provided by Mitsubishi Chemical Corporation and Honda R&D Co., Ltd., (Tokyo, Japan). The sides of the specimens were polished using progressively finer grit papers to remove possible edge damage initiation spots.
The tests during this experimental campaign were performed using an Instron 4505 machine (Instron, Norwood, MA, USA) with mechanical grips and a load cell of a 10 kN capacity. Static tests were performed with a displacement control rate of 1.0 mm/min. Fatigue testing was also performed under load control with an R-ratio of 0.1, a frequency of 2 Hz and a runout of 500,000 cycles. Maximum fatigue load levels ranging between 50% and 90% of the static load level were applied, with the last one being defined based on the onset of nonlinearity (considered as the initial compliance plus 1%) or the maximum measured load, whichever happened first. Two repetitions were performed during the static tests, whereas one test was performed at four different fatigue load levels and three repetitions at a single fatigue load level in order to identify scatter in the fatigue life curve.
Strain gauges (SGs) were positioned on the V-shape specimen arms at the areas pinpointed in
Figure 2b. Four rosette strain gauges were applied during the static tests while four linear strain gauges, providing measurements in the longitudinal direction only, were used during the fatigue tests. A DIC system with two cameras from Correlated Solutions, Inc. (Irmo, SC, USA) was used in order to provide through-thickness optical strain measurements, as shown in
Figure 2c. The DIC system was capturing images every second during the static tests, and it was taking images at the maximum displacement of the specimen during the predefined fatigue cycle intervals. Apart from displacement and strain measurements, the DIC method was used to measure the ‘sigma’ parameter, defined as the confidence in correlation between pixels [
10]. The ‘sigma’ parameter measures the difference in the subset match in pixels within a single standard deviation, with high sigma values pinpointing areas with a lower correlation and correspondingly higher distortion, indicating the occurrence of damage. For the AE measurements, two Pico sensors with a maximum sensitivity of 450 kHz were applied on the specimens between the strain gauges and the main bend area, as shown in
Figure 2b. A DiSP system from Physical Acoustics (Princeton Jct, NJ, USA) was used and a threshold of 40 dB was applied to filter noise. Linear localization was used to define AE events between the two sensors [
9].
3. Results and Discussion
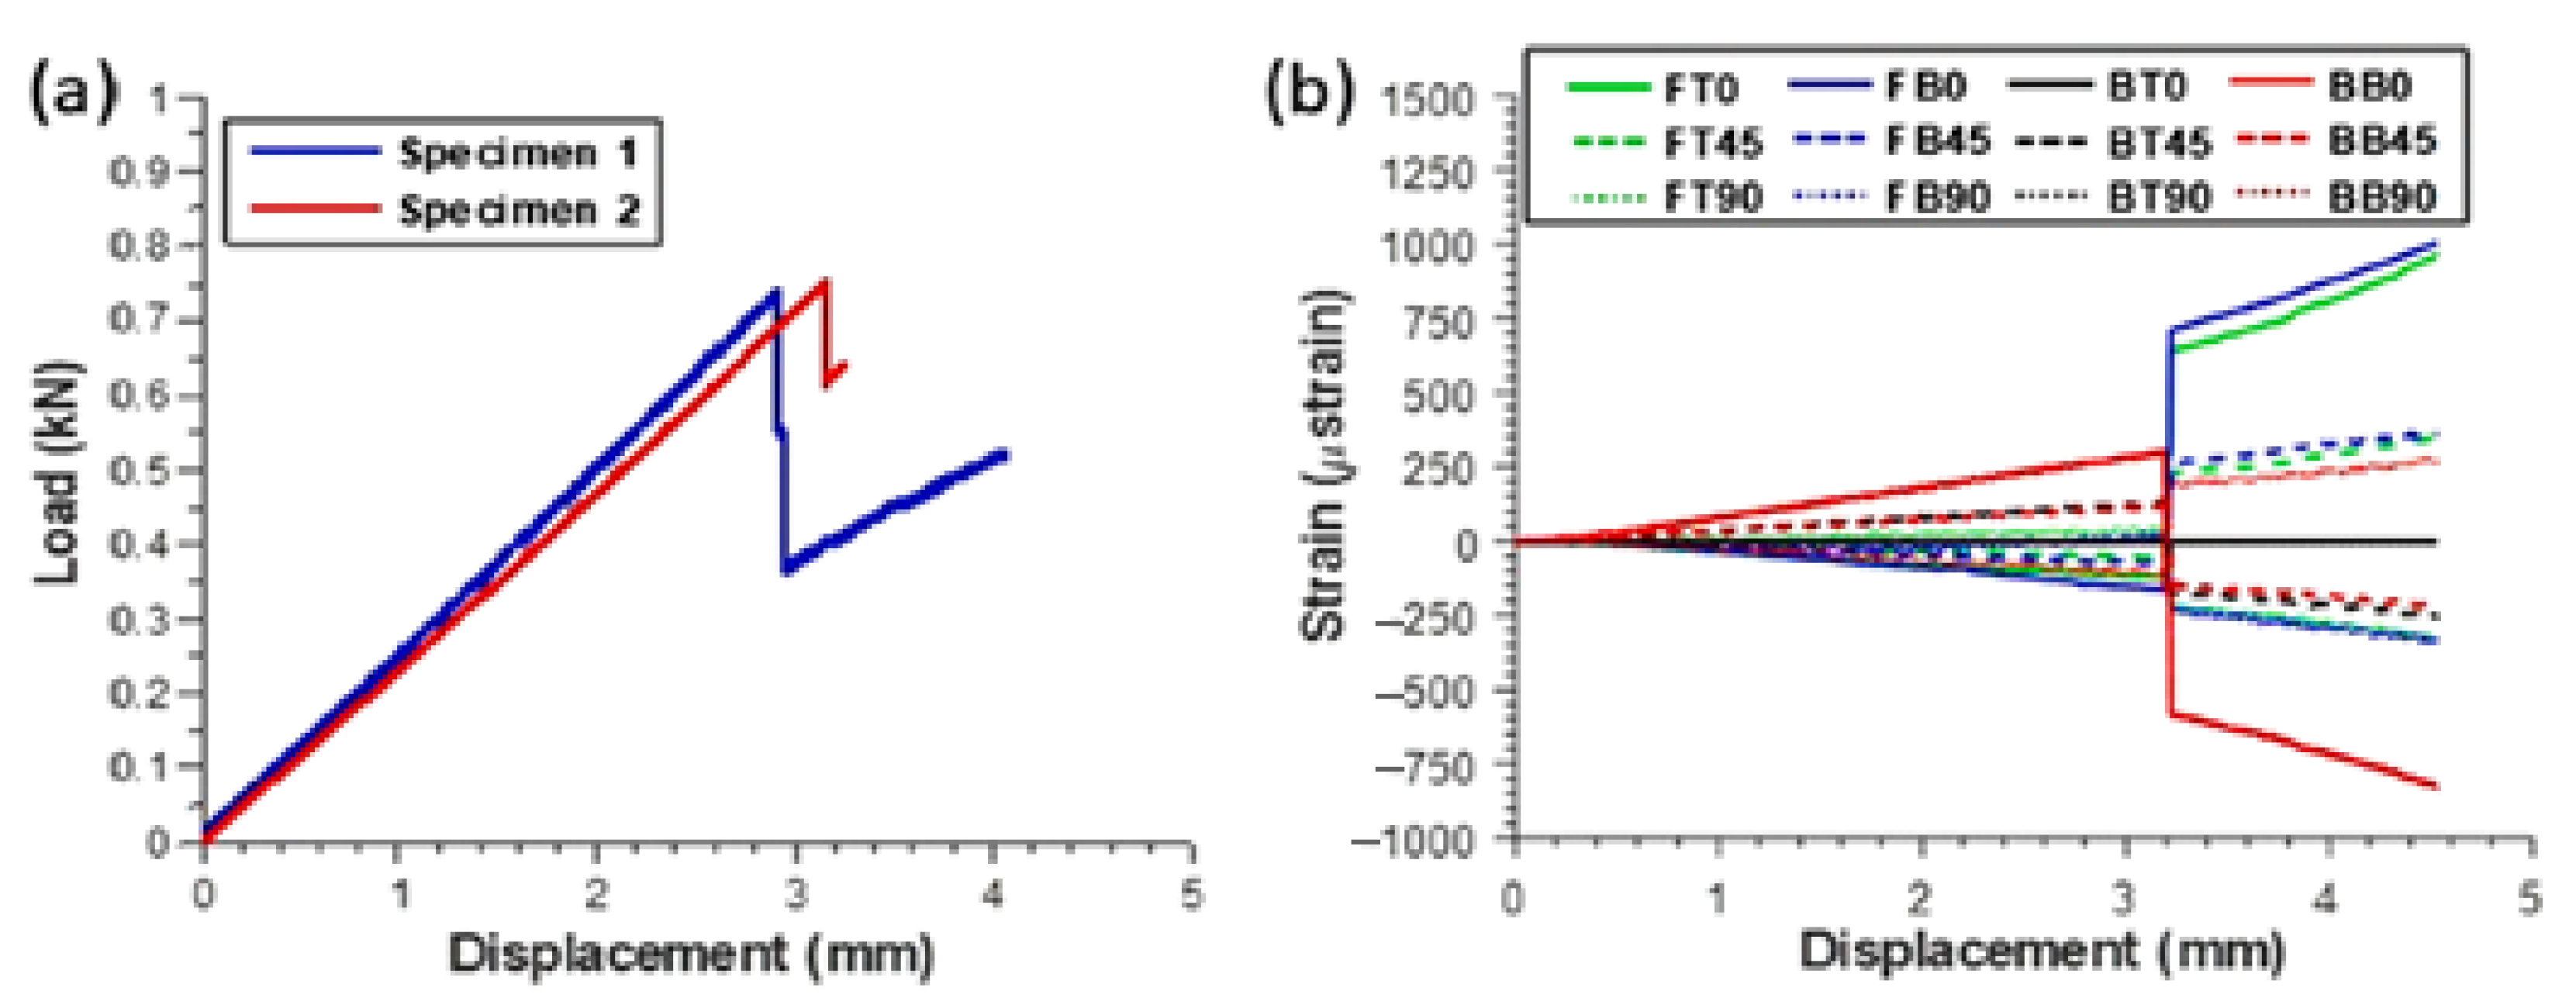
Static tensile failure occurred at an average load level of 0.752 (±0.0014) kN with the strain gauges indicating maximum strains of approximately ±300 μstrain in the 0° direction at the first load drop, with the front side of the specimen being under compression and the back side being under tension, as shown in
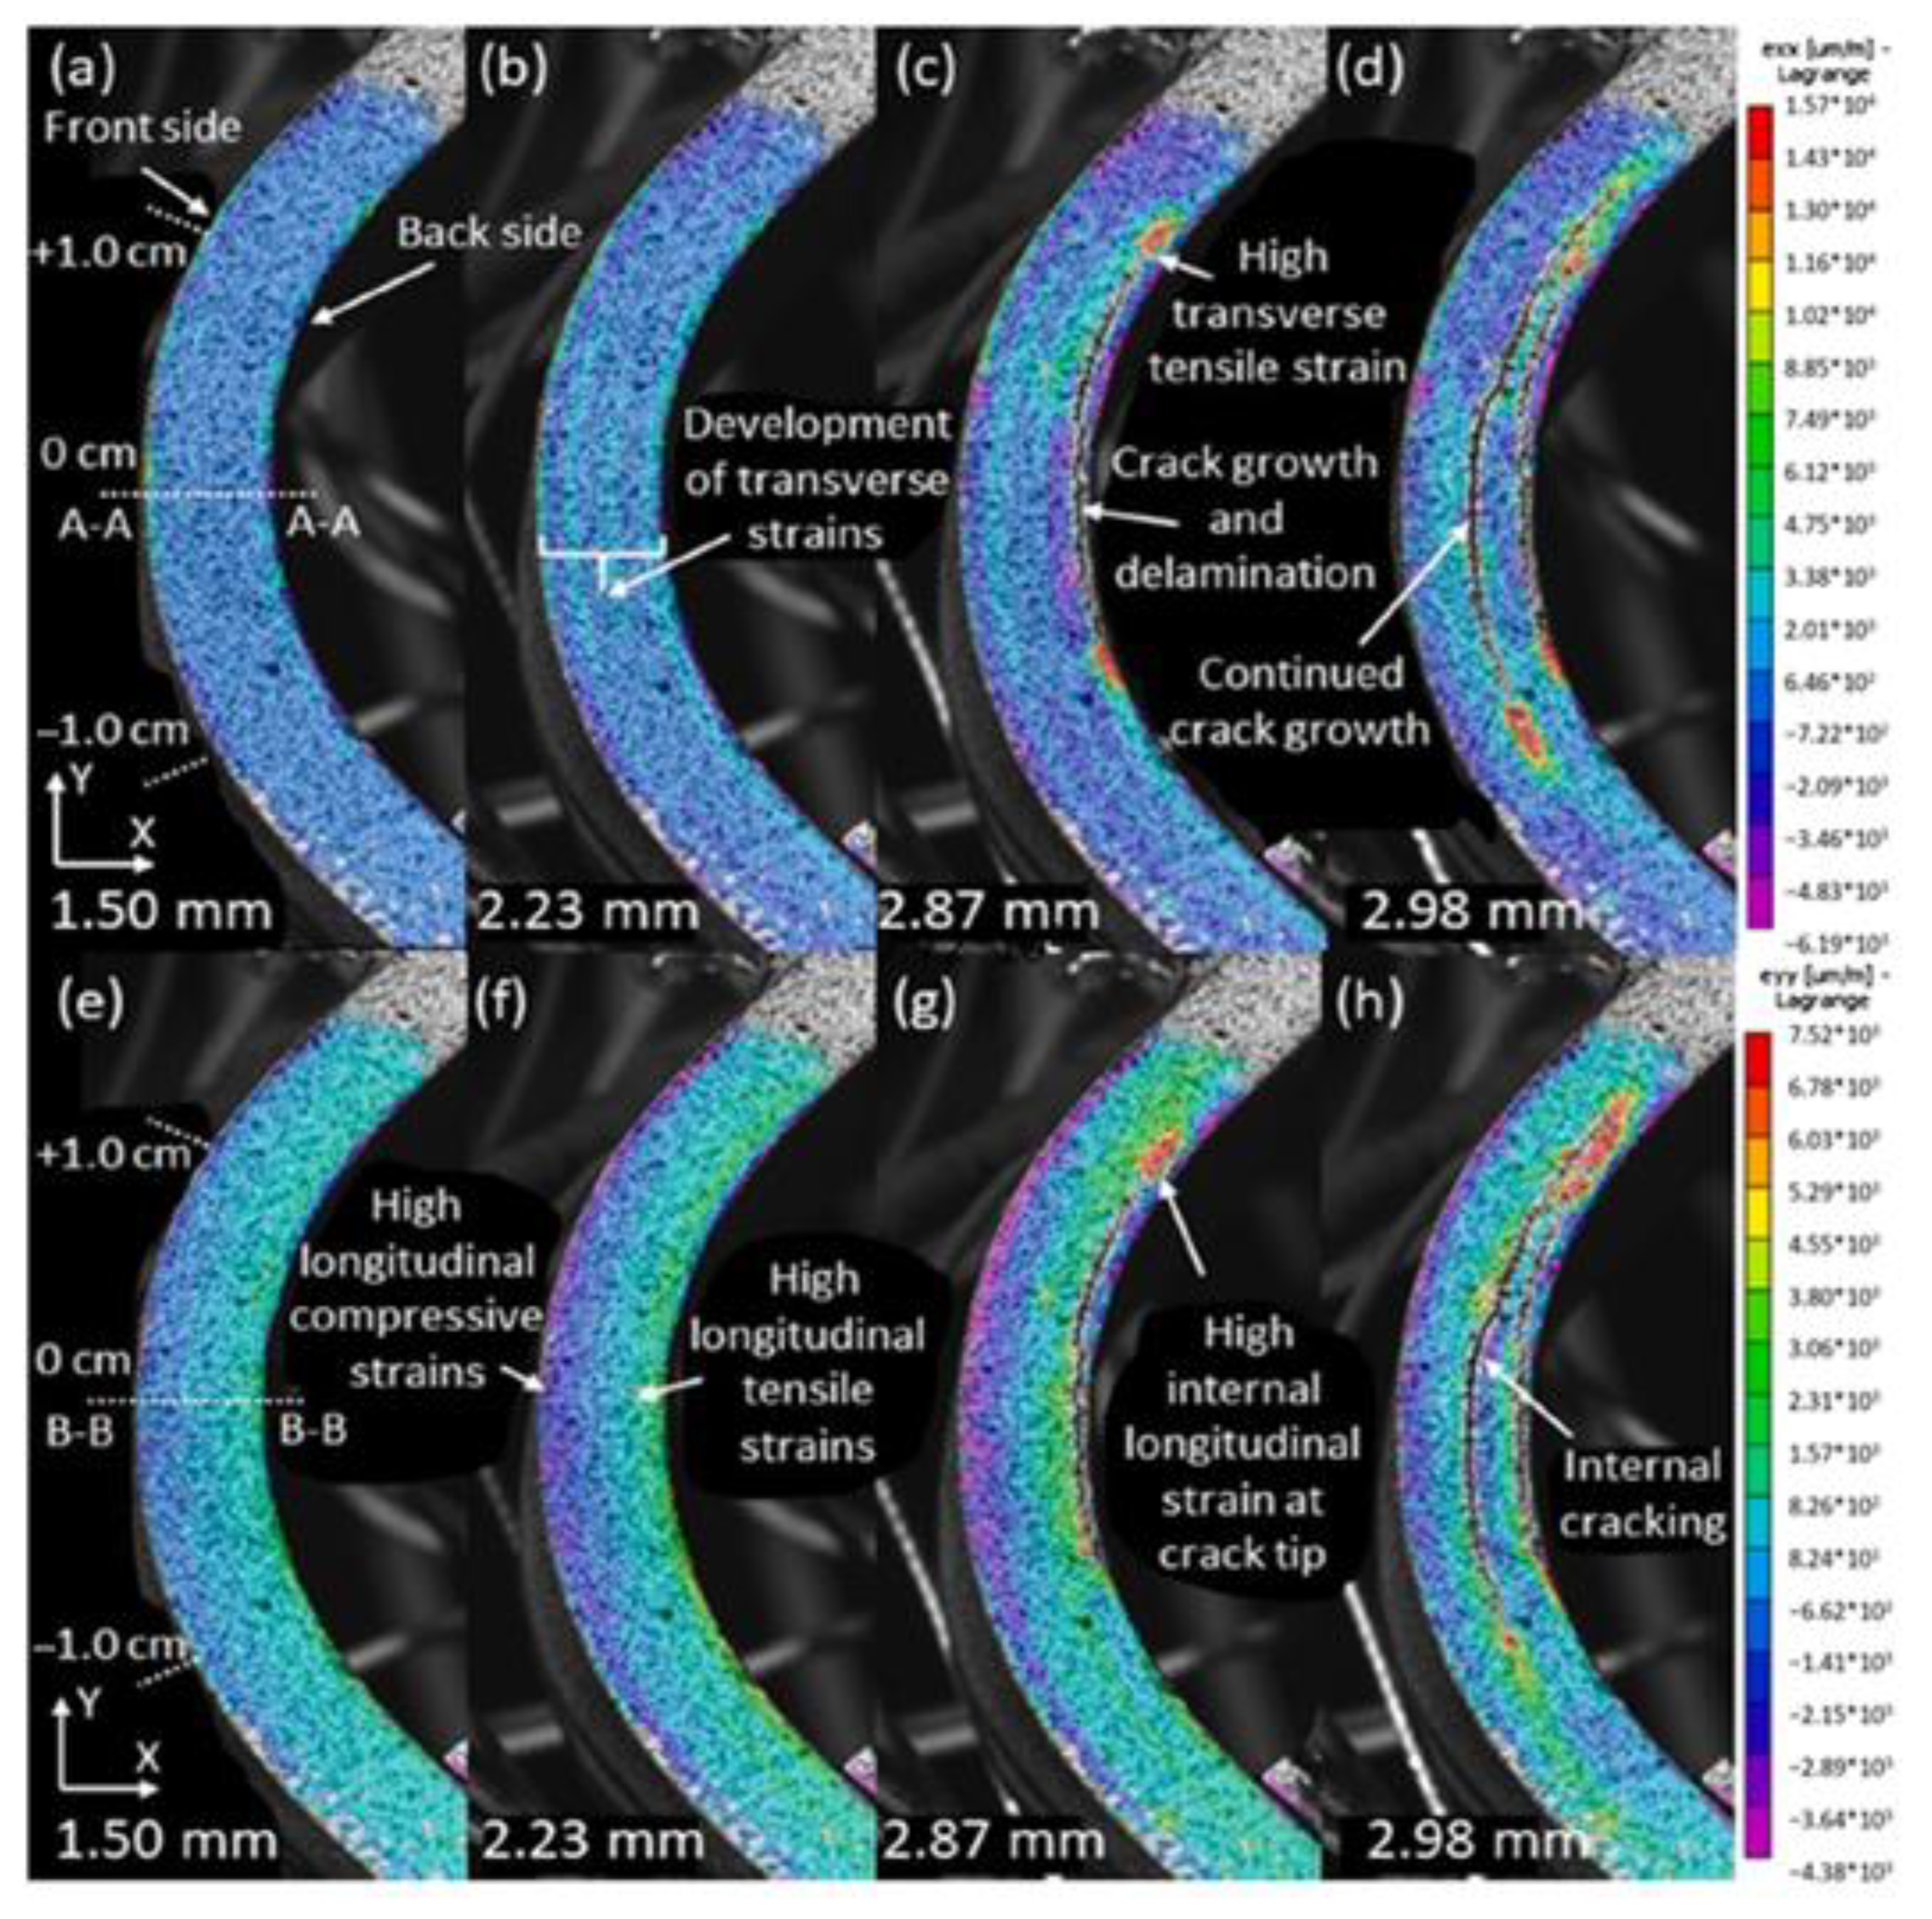
Figure 3. According to the DIC analysis, the failure occurred at the internal back side of the specimen, being under tension, with the corresponding measured strains at failure being ten times larger than the ones measured by the strain gauges. As shown in
Figure 4, delamination in the outermost 90°/90° layer interface was initiated as the test progressed, propagating through the thickness of the specimen as the load increased, leading to the ultimate failure. In all cases, a combination of high tensile strains both in the longitudinal and the transverse direction led to delamination and the ultimate failure of the V-shape specimens. It is characteristic that in the longitudinal direction high tensile strains of around 2500 μstrain were measured at the internal edge, whereas at the same area, just below the surface of the specimen, high tensile strains of approximately 3500 µstrain were measured in the transverse direction.
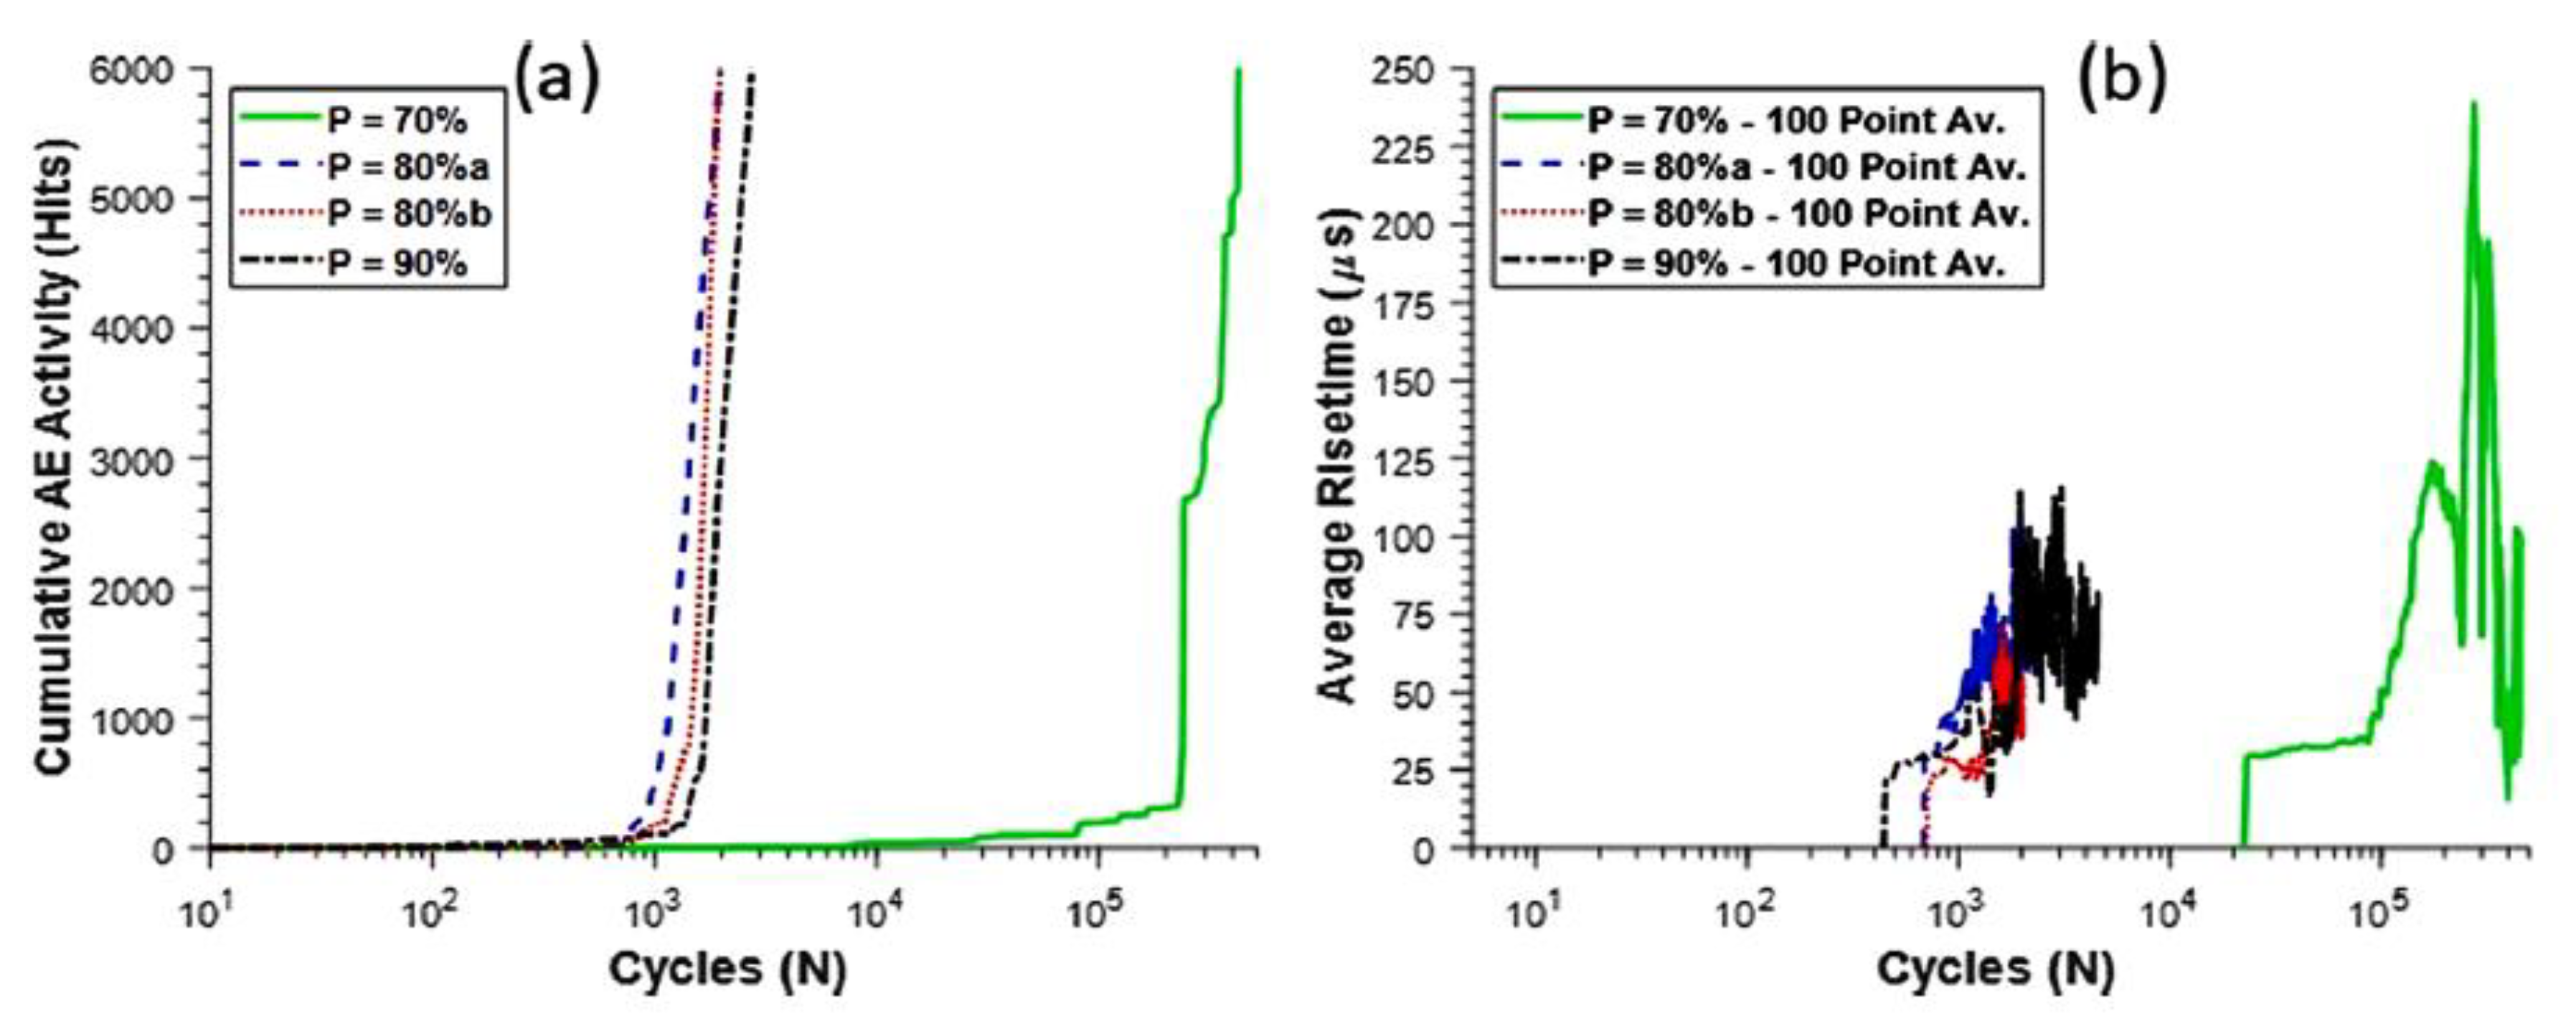
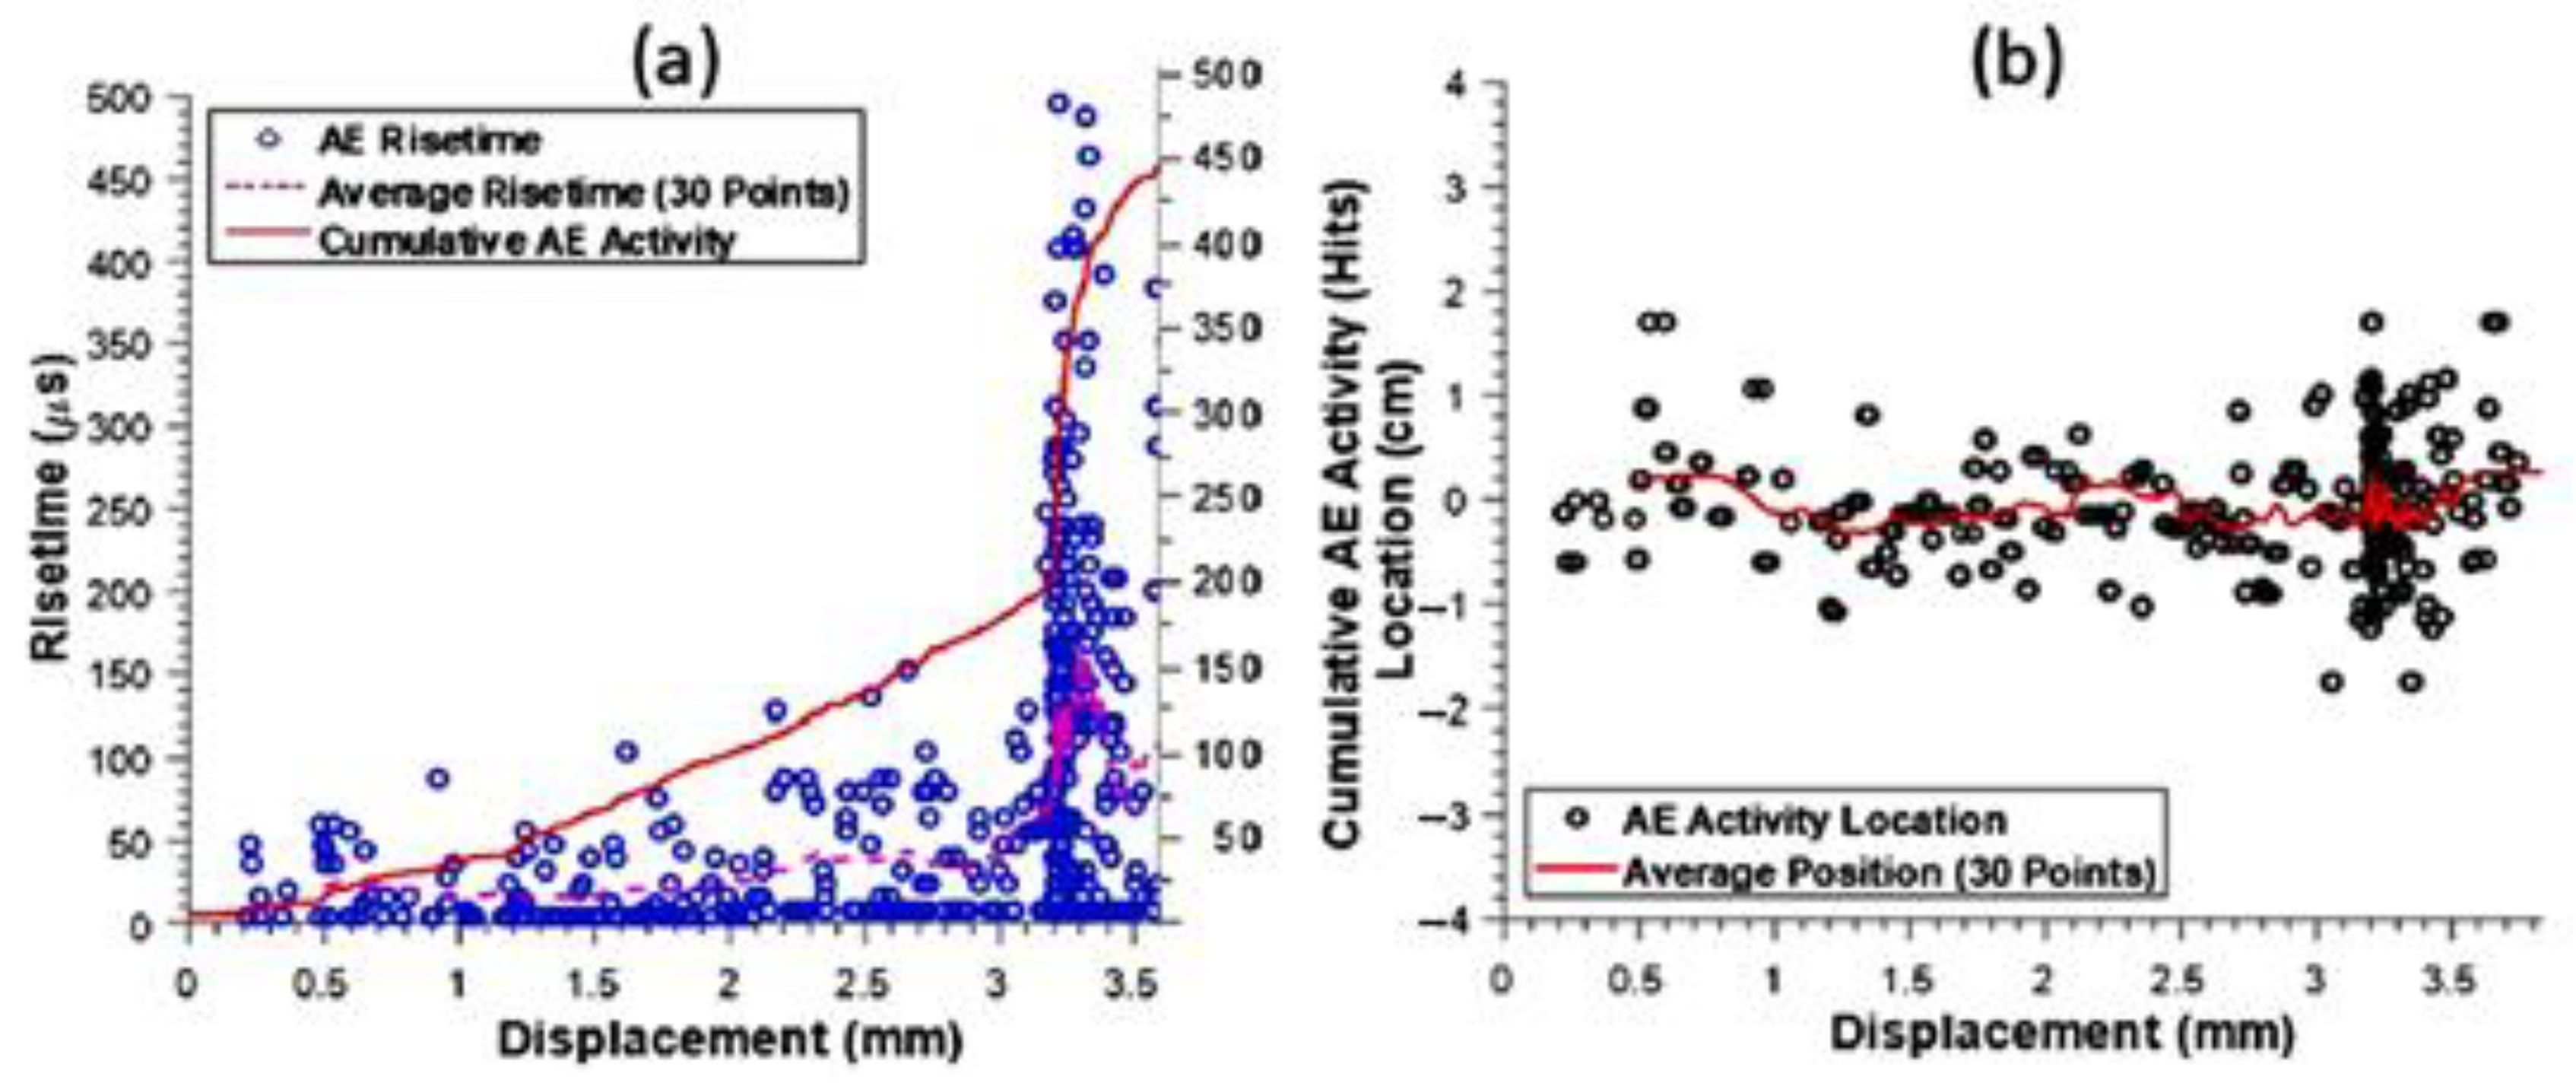
Looking at the results from the AE analysis in
Figure 5a, a characteristic increase in cumulative AE activity and average risetime is observed at a displacement of 3.2 mm, corresponding to the first load drop during the static test. However, AE events are registered even from the early loading stages during the test, indicating early damage. A significant feature used during the AE analysis is the risetime of the AE signals, defined as the time from the first threshold crossing of the signal until its maximum amplitude. An increase in the average risetime from around 15 to 40 µs was first captured at a displacement of around 2.35 mm, indicating an alteration of the damage type developing within the specimen. The second increase to over 100 µs was linked to more detrimental damage modes such as delamination. The AE waves were mainly located within an area of ±1 cm from the main bend, as shown in
Figure 5b. This comes to agreement with the DIC results, although the AE analysis detected events (linked to internal microscale damage) much earlier during the test, showing that Acoustic Emission activity was captured before failure reached the specimen sides and was visible by the DIC cameras (Correlated Solutions, Inc., Irmo, SC, USA) [
9].
In
Figure 6a,b, characteristic DIC examples of V-shape specimens tested under fatigue loading for P
MAX = 90% and P
MAX = 70%, respectively, are displayed. In all cases, DIC indicated the first failure location at the 90°/90° interface of the internal back side (tension side) of the specimen. It should be mentioned that during the fatigue tests, damage observations were not easy via the typical displacement/strain analyses; therefore, the “sigma” correlation coefficient was used to determine damage, with high sigma values signifying that damage occurred in the corresponding regions. In all cases, the total number of fatigue cycles to failure could be determined. In
Figure 7, the transverse and longitudinal strains developed through the thickness of the V-shape specimens for all different fatigue load cases are displayed. Similarities on the obtained strain patterns between the static and the fatigue tests can be observed. In all cases, a combination of high tensile strains both in the longitudinal and the transverse direction at the inner specimen edge always led to failure initiation, delamination and ultimate failure of the specimen.
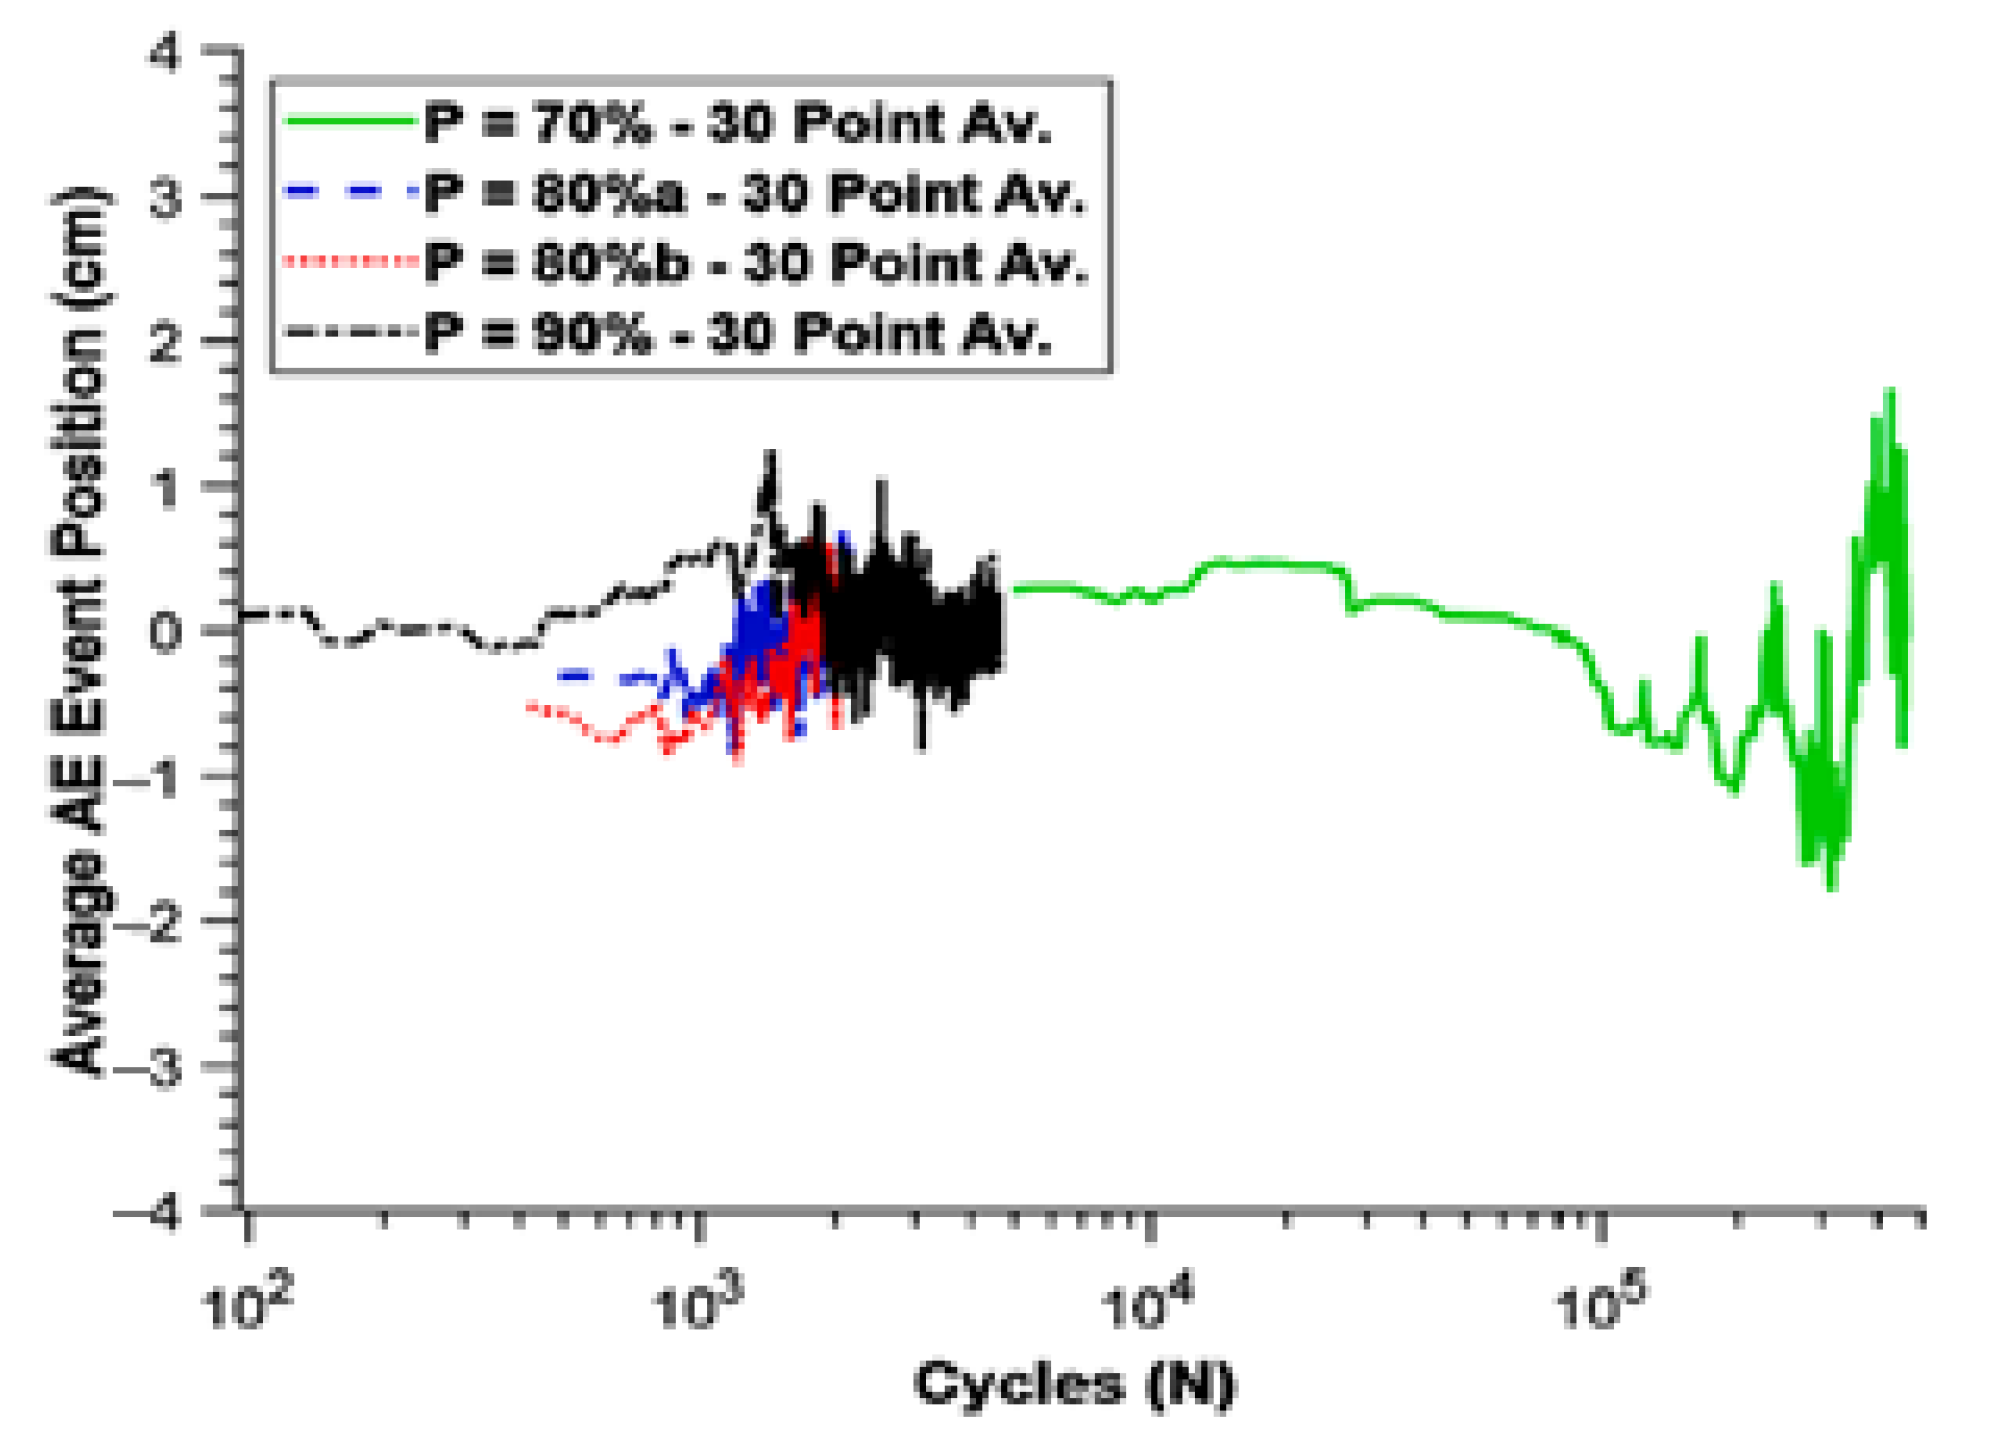
In
Figure 8, the AE activity of the V-shape specimens during the fatigue loading is displayed. AE events, indicating internal damage, are always registered before any visible DIC damage, as was the case during the static tests. However, limited AE activity is registered for the largest duration of the fatigue loading, with significant increases being evident only closer to the final failure. Nevertheless, the risetime seems to be a better damage indicator and predictor, since each test shows an increase in the average risetime to a value of around 80 µs from initial values of around 25 µs, even before the steep increase in the cumulative AE activity curve. This increase pinpoints the transition from internal microdamage to more severe damage events that proceed the eventual failure. The location of the AE events during the fatigue tests was also quite similar to that of the static tests (see
Figure 9). However, the population of events significantly increased during the fatigue loading in comparison with the static tests and more events have occurred up to ±4 cm from the main bend region. This is partly due to the inclusion of noise as well as to the repetitive nature of the loading and unloading sequence, leading to damage events throughout a larger area of V-shape specimens.
In
Figure 10, fatigue life curves are plotted using the time to failure, as determined by the different methodologies (strain gauges, DIC and AE). This graph shows that the AE and DIC techniques are more sensitive to failure determination, far surpassing the strain gauge measurement sensitivity. From these tests, AE has proven to be the most sensitive analysis technique over increased lifetimes, followed by DIC, whereas the less conservative time estimates are provided by the strain gauge measurements [
9].
4. Conclusions
The corner section of a square composite beam has been experimentally assessed by performing static and dynamic loading tests on V-shape specimens. Fatigue life curves have been developed for each loading case with runouts of 500,000 cycles. The location of failure, as observed via DIC in all test cases, was the result of a combination of high longitudinal and transverse tensile strains in the main bend region of the specimen. Such regions with this combination of strains were specifically susceptible to failure initiation and in all cases were the source of initial crack growth and delamination. Mitigating the occurrence of these types of strains through informed design, thereby ensuring that they remain at conservative levels, will help to ensure that the composite component retains its structural integrity. In conclusion, DIC and AE have showcased significant benefits over traditional strain gauge measurements, providing more conservative measurements of the time to failure. The added benefits of using these techniques are the ability of both DIC and AE to identify the failure location. The DIC analysis can define the specific location of failure and how strains develop in the cross section of the specimen over a continuous loading regime or multiple fatigue cycles. In comparison, the AE analysis can determine if internal damage has taken place and can quantify the location of this damage as it pertains to the distance between the AE sensors along the specimens’ length. These results showcase the benefits of incorporating DIC and AE techniques and why they should be considered as complimentary techniques for composite component analyses in the future.


 ,
, 