1. Introduction
Whereas concrete has been known as a robust construction material for many centuries, mixture design is continuously evolving to accommodate the need for more durable and better-performing construction materials. However, the shift toward so-called high-performance and ultra-high-performance concrete comes with an increased risk of autogenous shrinkage cracking due to the low water-to-cement (w/c) ratio of the mixture. It is clear that these cracks should be avoided to ensure the future functioning of structures and to mitigate autogenous shrinkage.
Superabsorbent polymers (SAPs) provide a solution to the occurrence of self-desiccation and subsequent autogenous shrinkage of cementitious materials by internal curing [
1,
2,
3]. During mixing, dry SAPs are added, together with an extra amount of water that will be fully absorbed by the SAPs. Therefore, additional water is present to counteract self-desiccation but not in direct contact with the cement particles, which would explicitly increase the w/c ratio. When the free water is consumed for hydration purposes, the SAPs gradually release their absorbed water so that continued hydration takes place. Self-desiccation and autogenous shrinkage are thereby counteracted but at the cost of macropore formation after the release of water by the SAPs. Additionally, in the case of cracking of the hardened matrix, SAPs promote the sealing and healing of cracks [
4,
5]. The SAPs that are present inside the cracks reabsorb water upon contact with moisture from the environment. Their absorption and swelling leads to physical blocking of the crack (sealing). Then, the water of the SAPs is released again and encourages the further hydration of unhydrated cement particles and the precipitation of CaCO
3 (healing).
The influence of SAP inclusion in cementitious materials is a topic that has been extensively investigated in recent decades. According to the literature, free or restrained shrinkage tests are the main methods used to evaluate the effect of SAPs on autogenous shrinkage. Besides these techniques, the impact of SAPs on the developed microstructure can be revealed by mechanical experiments, such as bending and compression tests or mercury intrusion porosimetry, to examine the pore distribution. Whereas these tests are mostly standardized and applied as common practice when studying cementitious materials, they are either of destructive nature or require individual samples, i.e., they are not suitable for in situ testing and cannot be combined to evaluate various characteristics in a single specimen. The latter is of considerable importance to allow for a straightforward comparison between measuring methods and to increase accuracy.
Non-destructive acoustic methods provide a means of solving this issue. In a previous study, piezoelectric sensors were used to complement restrained shrinkage ring tests by passive acoustic monitoring [
3]. For mortar mixtures without SAPs, acoustic emission pinpointed the moment of fracture of the cementitious ring. On the other hand, for mixtures with SAPs, high acoustic activity was observed shortly after final setting of the mortar material, demonstrating the internal curing action caused by the release of water by SAPs [
6]. By determining the period of water desorption, AE enables the evaluation of the SAP efficiency for internal curing, which depends on the moment of water release. The onset of internal curing should not be too rapid in order to avoid increasing the w/c ratio but should occur in a timely manner to reduce the risk of autogenous shrinkage. In addition, active acoustic monitoring through ultrasound has proven to be sensitive to microstructural changes inside the cementitious matrix [
7,
8,
9]. Therefore, this technique is able to expose the stiffness evolution of hydrating mixtures and to differentiate between materials with/without aggregates or voids. On the other hand, ultrasound was repetitively applied to cracked mortars during healing cycles and allowed for an evaluation of the crack-filling progress [
6].
In this study, AE and ultrasound were adopted to investigate processes occurring inside cementitious materials with and without superabsorbent polymers. The freshly mixed material was monitored by means of AE, which revealed the settlement and hydration of cementitious mixtures, as well as the internal curing induced by the SAPs. An analysis of the wave amplitude described the internal curing process more profoundly and indicated a variation of the intensity of action over time. Ultrasound experiments were performed in the hardened stage of the material. First, pencil lead break tests were conducted to compare the microstructure of a mixture containing SAPs to a reference material. Next, multiple cracks were formed by means of mechanical loading. By applying wet–dry curing cycles, sealing/healing of cracks was expected over time. A repetition of ultrasound experiments confirmed a restoration process, which was enhanced by the SAP inclusion.
2. Materials and Methods
2.1. Materials
Two cementitious mortar mixtures were investigated: a reference material and a mixture with SAPs. CEM I 52.5 Strong from Holcim (Nivelles, Belgium) was used, together with oven-dried river sand 0/2. The sand-to-cement ratio was equal to 2, and the w/c ratio was 0.35. Superplasticizer MasterGlenium 51 from BASF (Ludwigshafen, Germany) was added to improve the workability in an amount of 0.4% by weight of the cement.
The superabsorbent polymer was provided by BASF (Ludwigshafen, Germany) and is a copolymer of acrylamide and sodium acrylate. This SAP was explored in previous studies and showed to be effective for internal curing purposes [
2,
3]. The amount of SAP that was included is equal to 0.2% by weight of the cement. In order to maintain the workability of the fresh mortar material, an amount of 26 g of water per gram of SAP was added. In this way, an identical flow of 138 ± 1 mm was obtained compared to the reference mixture.
2.2. Acoustic Emission
Acoustic emission monitoring was performed during the fresh stage using three piezoelectric R15α sensors. The resonance frequency of the sensors is 150 kHz, and the operating frequency band is between 50 and 400 kHz. These sensors were mounted on a metallic mold, measuring 40 mm × 40 mm × 160 mm. Two of the sensors are shown in
Figure 1a, positioned in the middle of the side faces of the metallic mold. The mortar was cast in the mold, and a plastic foil was placed on top to avoid evaporation. A third sensor was placed on the bottom surface (
Figure 1b). Magnetic holders were used to keep the sensors in place during the measurements, as mentioned in [
6].
2.3. Ultrasound
Ultrasound measurements were obtained by means of pencil lead break (PLB) tests. The breaking of a thin pencil lead with a mechanical pencil generates a broadband wave signal that travels through the material under study. For these experiments, two broadband pico sensors with a peak sensitivity of 450 kHz were placed on the surface of a hardened mortar specimen with a central steel reinforcement bar. The use of PLB was two-fold. First, various PLB tests were performed on sound specimens after 28 days of curing in plastic foil. These results were used to obtain information on the mortar’s microstructure. Second, the specimens were fractured during a tensile test until multiple cracks occurred. The ultrasound method was then adopted to monitor the potential closure of cracks over time, as wet–dry curing cycles were applied. The wet–dry curing cycles consisted of one hour of submersion in water at 20 ± 1 °C, followed by 23 h in dry conditions at 20 ± 1 °C. The setup is shown in
Figure 2. For the tests on sound material, the sensors were placed at random positions, and several repetitions of PLBs were conducted. In the cracked stage, the sensors were placed on opposite sides of the crack, and again, multiple pencil lead break tests were performed after 16 h under dry conditions. The distance between the sensors was maintained at 30 mm throughout all experiments; more details can be found in [
6].
3. Results and Discussion
3.1. Acoustic Emission
Two replicates of each fresh mixture were monitored using acoustic emission. The cumulative amount of hits received during these experiments is shown in
Figure 3a. For the reference mortar, the total amount of hits remained below 1000 over the entire monitoring period of three days. In contrast, the specimens with SAPs and additional water presented a much higher number of hits received. This activity was not initiated from the start but found its origin shortly after 11 to 12 h of curing. On the contrary, the reference specimens showed no increase during the same period (see
Figure 3b), whereas all specimens exhibited relatively intense AE activity during the first 2 h. These captured hits were related to particle settlement, as the material was still liquid. The settlement could also be distinguished in the SAP curves but was slightly less pronounced.
With respect to the SAP mixtures, a sudden increase in the hit rate was observed after approximately 11 to 12 h of curing, which was about three to four hours after the final setting of the material had occurred. The hit rate then remained constant for several hours, even up to more than one day of curing, depending on the specimen. As this activity was only observed for SAP mixtures, it is most likely related to the action of the SAPs inside the mortar specimen, releasing absorbed water for internal curing. To obtain more information, the amplitude of the captured signals was analyzed and is depicted in
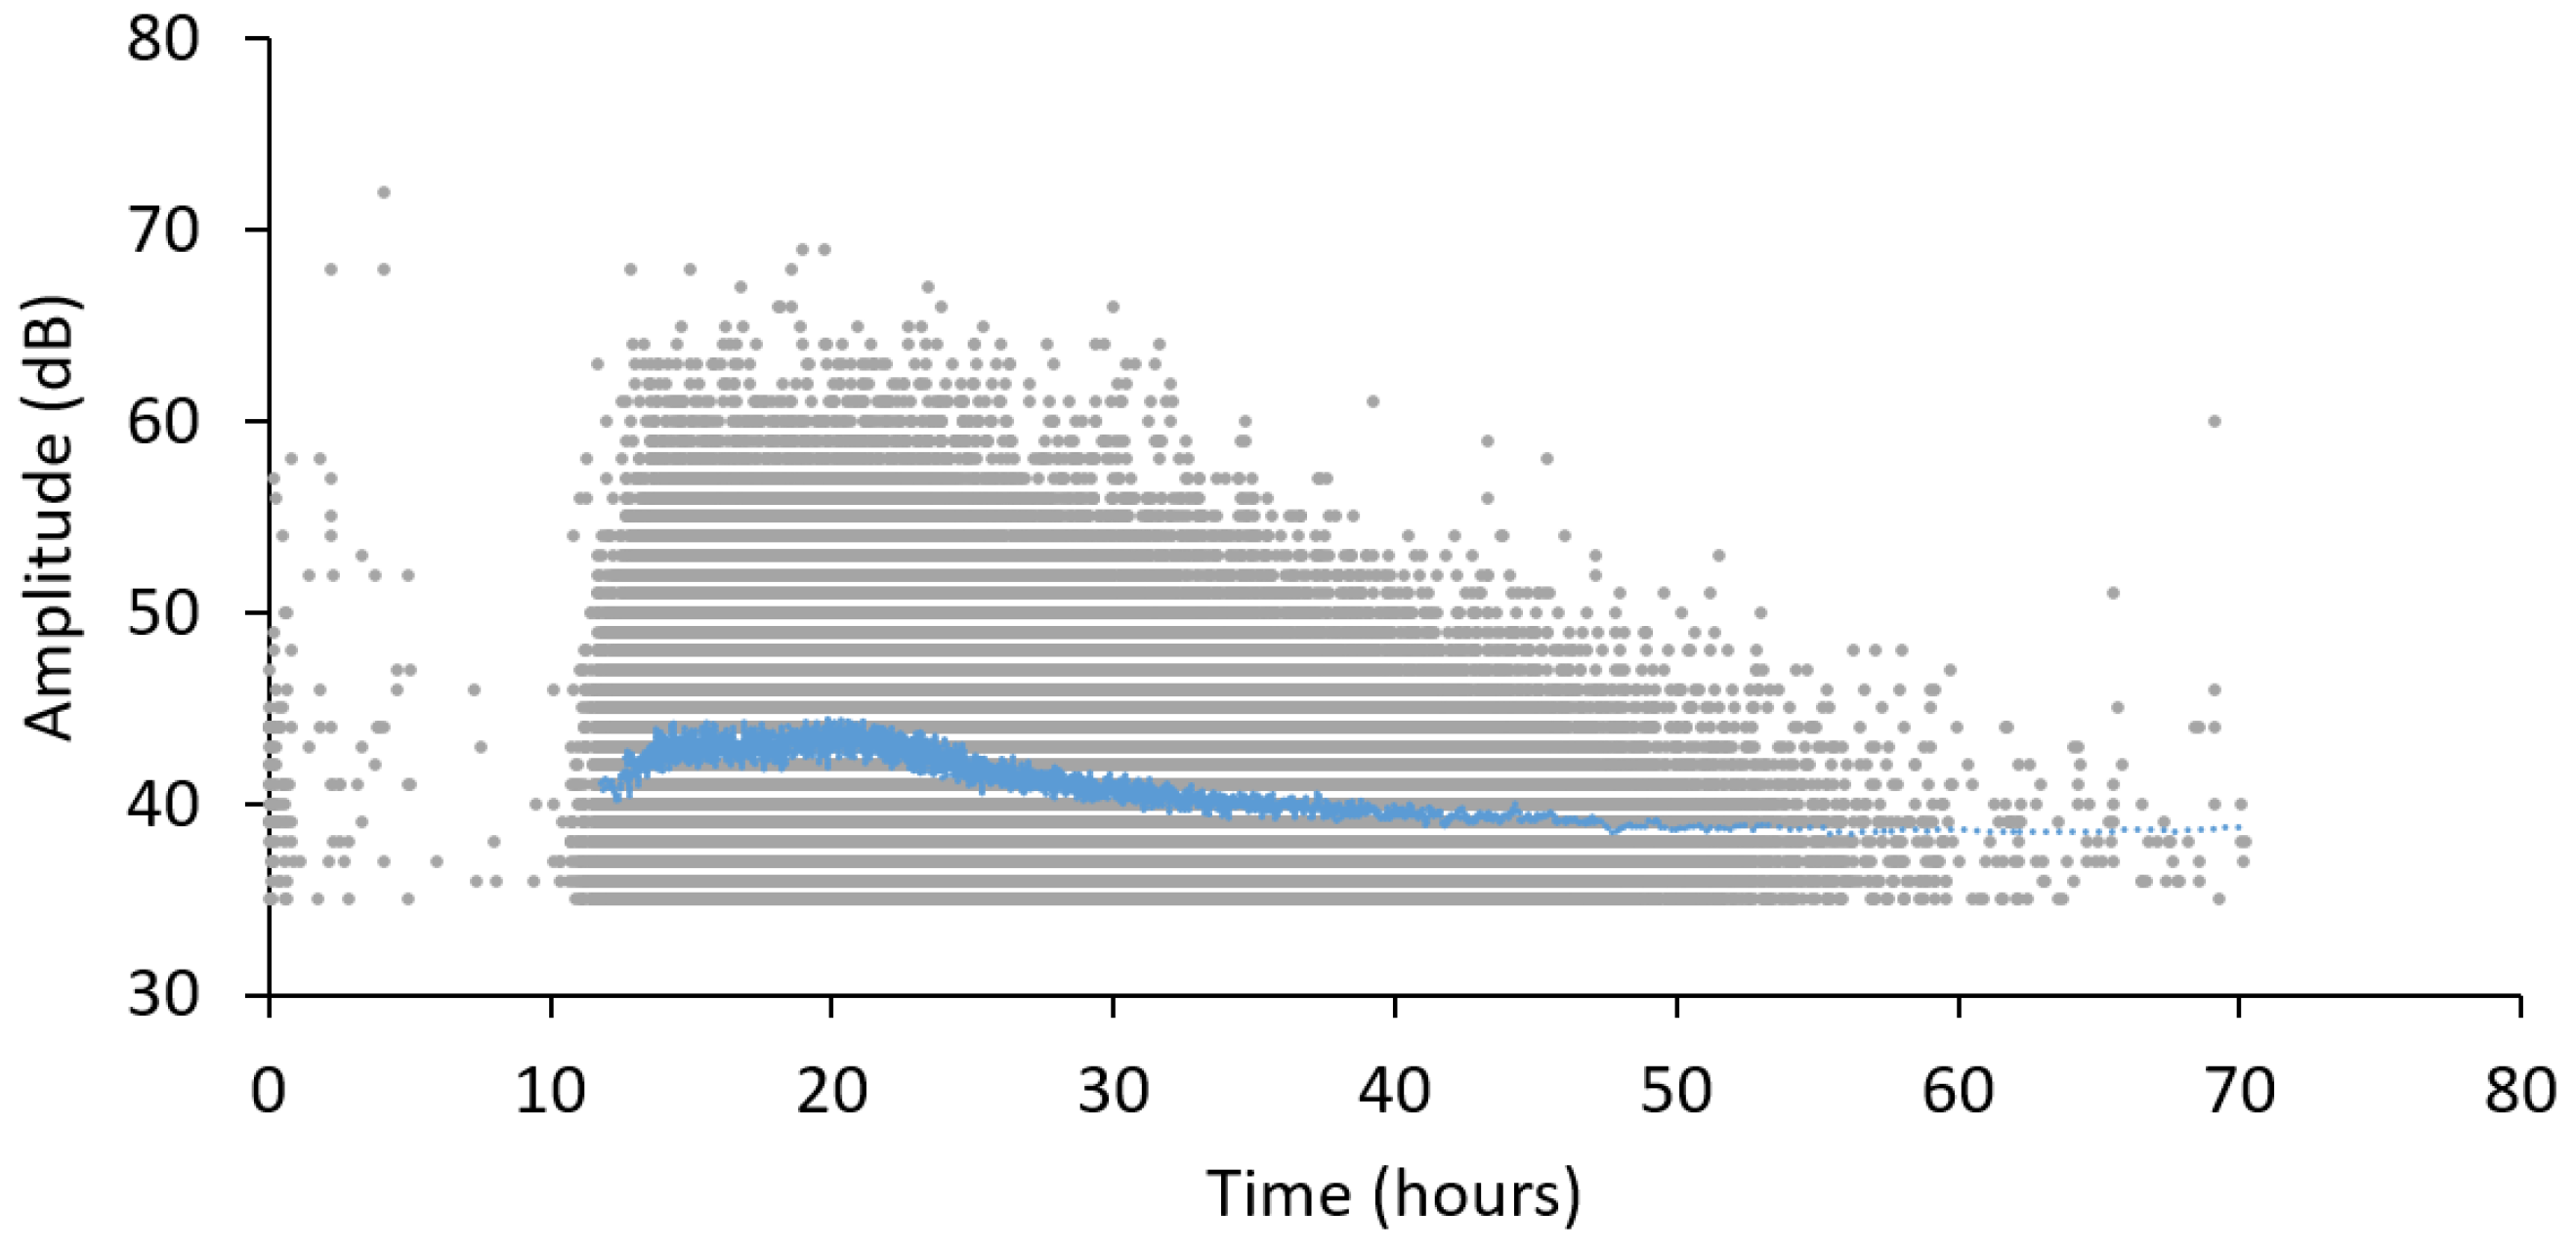
Figure 4.
With respect to the amplitude of signals received during monitoring of a representative SAP specimen, a broad range of values was captured, i.e., between 35 dB (threshold level) and 70 dB. The moving average increased rapidly in mean amplitude from 11 h onwards. Subsequently, the amplitude remained fairly constant for approximately 10 h of curing. Within this time period, a maximum amplitude of 70 dB was received. Afterwards, the moving average exhibited a decrease to the initial amplitude level. Whereas the cumulative hits curve showed an approximately constant rate for more than one day of curing, the amplitude reached a higher intensity for approximately 10 h, indicating that internal curing is not a constant process. According to a comparison with NMR data from the literature, the obtained trend with respect to the amplitude variation could be matched to the kinetics of water desorption of the SAP under study [
10]. In the latter study, the SAP gradually released its absorbed water inside a cement paste from 11 h onwards, shortly after final setting, with an effective w/c ratio of 0.3. However, the amount of water that was released varied over time and reached its maximum between 22 and 30 h of curing, after which the desorption rate slowed down again. This means that by using AE, the internal curing process can be monitored in a relatively easy manner, providing information on the water release rate in real time.
3.2. Ultrasound
Three reference and three SAP replicates were cast. After 28 days of curing in plastic foil, the specimens were each subjected to 5 PLB experiments. A PLB excitation generates longitudinal, shear and Rayleigh (surface) waves. The sensors on the surface captured both the longitudinal and Rayleigh waves. The longitudinal wave velocity, the Rayleigh wave velocity and the attenuation of the waves were determined to characterize the microstructure.
Figure 5 shows the waveforms received by both sensors after a PLB in a reference specimen. The arrival of the longitudinal wave was taken as the first disturbance that overpassed the noise level. The longitudinal wave velocity was obtained by dividing the distance between the sensors, equal to 30 mm, by the travel time (Δt
L). Signal attenuation was closely linked to the analysis of the amplitude and is a measure of the reduction in amplitude that occurs as the wave travels from one sensor to the other. As shown in
Figure 5, the amplitude was reduced at the second sensor compared to the first receiver. The attenuation (dB/mm) is calculated by:
with A
1 (V) the amplitude from the first sensor, and A
2 (V) the amplitude from the second sensor. A characteristic point of the Rayleigh wave was taken as the first negative peak after the weak longitudinal arrivals, as indicated by arrows in
Figure 5. The travel time of the Rayleigh wave was then defined as the difference in arrival of these peaks between the two receivers.
The average longitudinal wave velocity, Rayleigh wave velocity and attenuation, along with their standard deviation, are summarized in
Table 1. Regarding the longitudinal and Rayleigh wave velocity, it was noticed that both velocities decreased when SAPs and additional water were added. As the SAPs released their absorbed water and shrink after final setting, voids were created within the hardened material. When the wave travelled across the material, these voids increased scattering and reduced the velocity and the amplitude of the signal, as also confirmed in [
11]. Consequently, the attenuation of the waves was increased by the presence of SAPs.
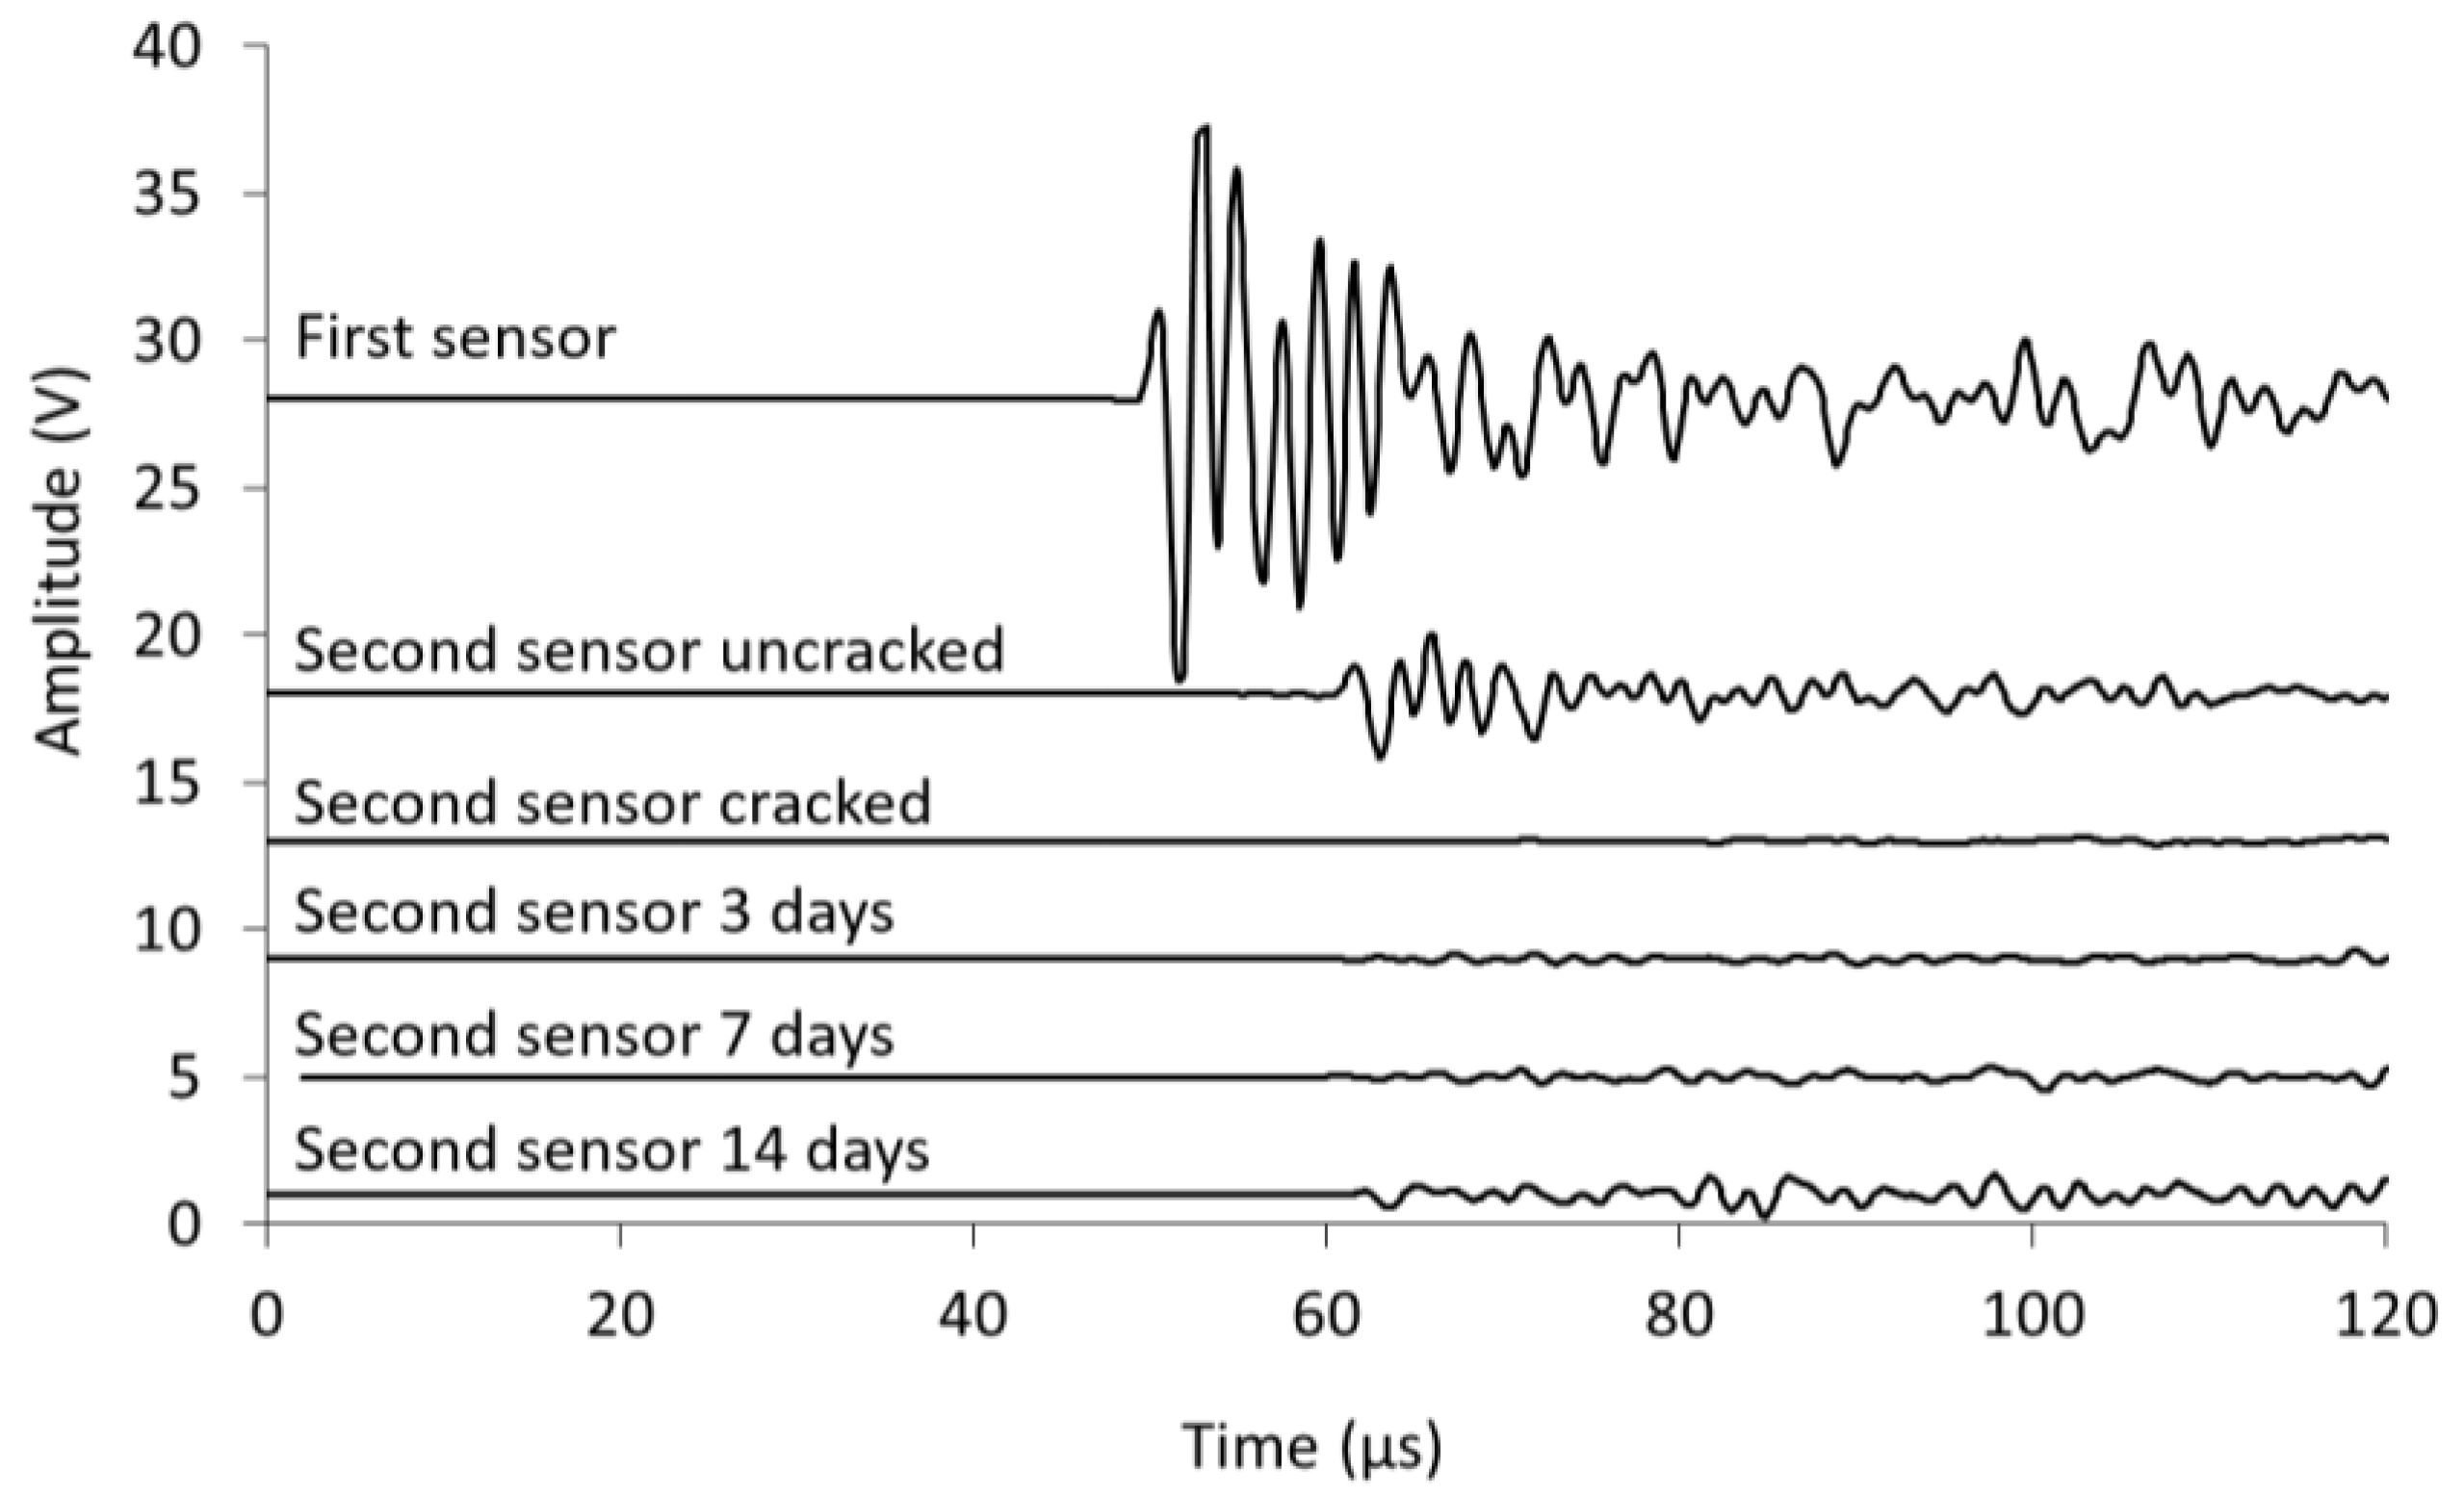
Next, the specimens under study were fractured during a tensile test. Multiple cracks were created, with an average width of between 100 and 200 µm. For each specimen, two cracks were chosen to be monitored by PLB tests during wet–dry healing cycles. These cycles consisted of one hour of submersion in water at 20 ± 2 °C and 23 h under dry conditions at 20 ± 2 °C. A healing period of 14 days was considered. Similarly to the first PLB experiment, the longitudinal wave velocity and attenuation were calculated. The Rayleigh wave velocity could no longer be calculated, as the specific cycle could not propagate through the crack opening. To obtain an improved understanding of the evolution of the wave signals after cracking, the results of representative PLB experiments over time are plotted in
Figure 6. Again, the amplitudes are shifted with respect to their original values to provide a global view of the results. Upon cracking, the signal received at the second sensor was strongly flattened, as the crack prohibited wave propagation. As healing cycles were performed, we observed that a partial restoration of the wave’s amplitude occurred, meaning that the crack became (partially) filled.
The average longitudinal wave velocity and attenuation for the PLB repetitions are summarized in
Table 2. Regarding the longitudinal wave velocity, a strong reduction was observed after cracking when comparing to the uncracked state (
Table 1). However, during wet–dry curing, the velocity increased gradually for both reference and SAP mixtures. This partial restoration suggested that a sealing or healing process was taking place inside the cracks, which reduced the effect of the discontinuity on the wave velocity. A comparison of the initial velocity after cracking with the velocity after 14 days of wet–dry curing showed a recovery of about 706 m/s for reference specimens, whereas for SAP samples, an increase of 845 m/s was observed, indicating the promotion of crack closure by the inclusion of SAPs.
Attenuation values increased upon cracking. A comparison of the reference specimens to the SAP material showed a lower attenuation for the reference mortars. This discrepancy comprised the differences in crack size and geometry, as well as the presence of macropores within the SAP specimens. Comparing the reduction in attenuation between the cracked and healing state after 14 days, a value of 0.20 dB/mm was obtained for the reference mix, whereas the SAP mortar showed a decrease of 0.25 dB/mm. The latter result implies the beneficial effect of SAPs with respect to healing cracks and confirms the sensitivity of ultrasound for measurement of crack closures in cementitious materials.
4. Conclusions
In this study, we investigated the use of acoustic methods to characterize the processes of internal curing and crack closure by a comparing a reference cementitious material and a mixture with SAPs. Fresh mortar prisms were monitored by means of AE. The cumulative hits received during curing of these specimens showed increased activity in SAP mixtures shortly after setting, which was linked to internal curing initiated by the release of water from the SAPs. Moreover, an analysis of the wave amplitude indicated that the internal curing process exhibited a period of increased intensity, which could be related to a faster release of water, as reported in the literature.
Additionally, active ultrasound experiments were performed on hardened specimens in the cracked and uncracked state by means of pencil lead breaking test. Before cracking, ultrasound was used to characterize the inner microstructure. The longitudinal and Rayleigh wave velocities showed a reduction with the addition of SAPs to the mixture due to macropore formation upon release of water by the SAPs. The existence of voids in SAP mixtures was also indicated by an increase in the attenuation of the wave amplitude. After characterizing the sound material, the specimens were cracked, and ultrasonic measurements were performed at various time points during wet–dry curing. Immediately after cracking, the longitudinal wave velocity was considerably decreased compared to the sound reference material, as well as SAP mortars. However, over time, the velocity increased again, suggesting that partial closure of the cracks took place. On the contrary, the attenuation was increased after cracking, caused by the created discontinuity. As wet–dry curing cycles were performed, a partial restoration toward the original attenuation value was observed. This restoration was more pronounced for mixtures with SAPs, demonstrating their advantage for self-healing purposes. It can be concluded that by applying a combination of acoustic measuring methods, various processes occurring inside cementitious materials can be monitored in real time in a non-destructive manner.
Author Contributions
Conceptualization, D.S., N.D.B., D.V.H. and D.G.A.; methodology, G.L., D.G.A.; validation, D.S., N.D.B., D.V.H. and D.G.A.; formal analysis, G.L.; investigation, G.L.; resources, D.S.; writing—original draft preparation, G.L.; writing—review and editing, D.S., N.D.B., D.V.H. and D.G.A.; supervision, D.S., N.D.B., D.V.H. and D.G.A.; funding acquisition, D.S., N.D.B., D.V.H. and D.G.A. All authors have read and agreed to the published version of the manuscript.
Funding
The financial support of the Research Foundation—Flanders (grant number G.0A28.16.6) is gratefully acknowledged by all authors.
Institutional Review Board Statement
Not applicable.
Informed Consent Statement
Not applicable.
Data Availability Statement
The data of this study is available upon request, where justified, by e-mail to the corresponding author.
Acknowledgments
The authors wish to thank Alexander Assmann (BASF) for providing the SAPs under study.
Conflicts of Interest
The authors declare no conflict of interest. The funders had no role in the design of the study; in the collection, analyses, or interpretation of data; in the writing of the manuscript, or in the decision to publish the results.
References
- Jensen, O.M.; Hansen, P.F. Water-entrained cement-based materials: I. Principles and theoretical background. Cem. Concr. Res. 2001, 31, 647–654. [Google Scholar] [CrossRef]
- Snoeck, D.; Jensen, O.; De Belie, N. The influence of superabsorbent polymers on the autogenous shrinkage properties of cement pastes with supplementary cementitious materials. Cem. Concr. Res. 2015, 74, 59–67. [Google Scholar] [CrossRef]
- Lefever, G.; Tsangouri, E.; Snoeck, D.; Aggelis, D.G.; De Belie, N.; Van Vlierberghe, S.; Van Hemelrijck, D. Combined use of superabsorbent polymers and nanosilica for reduction of restrained shrinkage and strength compensation in cementitious mortars. Constr. Build. Mater. 2020, 251, 118966. [Google Scholar] [CrossRef]
- Snoeck, D.; Van Tittelboom, K.; Steuperaert, S.; Dubruel, P.; De Belie, N. Self-healing cementitious materials by the combination of microfibres and superabsorbent polymers. J. Intell. Mater. Syst. Struct. 2014, 25, 13–24. [Google Scholar] [CrossRef] [Green Version]
- Mignon, A.; Snoeck, D.; Schaubroeck, D.; Luickx, N.; Dubruel, P.; Van Vlierberghe, S.; De Belie, N. pH-responsive super-absorbent polymers: A pathway to self-healing of mortar. React. Funct. Polym. 2015, 93, 68–76. [Google Scholar] [CrossRef]
- Lefever, G.; Snoeck, D.; De Belie, N.; Van Vlierberghe, S.; Van Hemelrijck, D.; Aggelis, D.G. The Contribution of Elastic Wave NDT to the Characterization of Modern Cementitious Media. Sensors 2020, 20, 2959. [Google Scholar] [CrossRef] [PubMed]
- Philippidis, T.; Aggelis, D. Experimental study of wave dispersion and attenuation in concrete. Ultrasonics 2005, 43, 584–595. [Google Scholar] [CrossRef] [PubMed]
- Chaix, J.-F.; Garnier, V.; Corneloup, G. Ultrasonic wave propagation in heterogeneous solid media: Theoretical analysis and experimental validation. Ultrasonics 2006, 44, 200–210. [Google Scholar] [CrossRef] [PubMed]
- Aggelis, D.G.; Shiotani, T. Experimental study of surface wave propagation in strongly heterogeneous media. J. Acoust. Soc. Am. 2007, 122, EL151–EL157. [Google Scholar] [CrossRef] [PubMed] [Green Version]
- Snoeck, D.; Pel, L.L.; De Belie, N. The water kinetics of superabsorbent polymers during cement hydration and internal curing visualized and studied by NMR. Sci. Rep. 2017, 7, 9514. [Google Scholar] [CrossRef] [PubMed]
- Zhu, J.; Kee, S.-H.; Han, D.; Tsai, Y.-T. Effects of air voids on ultrasonic wave propagation in early age cement pastes. Cem. Concr. Res. 2011, 41, 872–881. [Google Scholar] [CrossRef]
| Publisher’s Note: MDPI stays neutral with regard to jurisdictional claims in published maps and institutional affiliations. |
© 2022 by the authors. Licensee MDPI, Basel, Switzerland. This article is an open access article distributed under the terms and conditions of the Creative Commons Attribution (CC BY) license (https://creativecommons.org/licenses/by/4.0/).


 ,
, 


